
Temperature
NOAA's National Centers for Environmental Information calculates the global temperature anomaly every month based on preliminary data generated from authoritative datasets of temperature observations from around the globe. The major dataset, NOAAGlobalTemp version 5, updated in mid-2019, uses comprehensive data collections of increased global area coverage over both land and ocean surfaces. NOAAGlobalTempv5 is a reconstructed dataset, meaning that the entire period of record is recalculated each month with new data. Based on those new calculations, the new historical data can bring about updates to previously reported values. These factors, together, mean that calculations from the past may be superseded by the most recent data and can affect the numbers reported in the monthly climate reports. The most current reconstruction analysis is always considered the most representative and precise of the climate system, and it is publicly available through Climate at a Glance.
December 2022
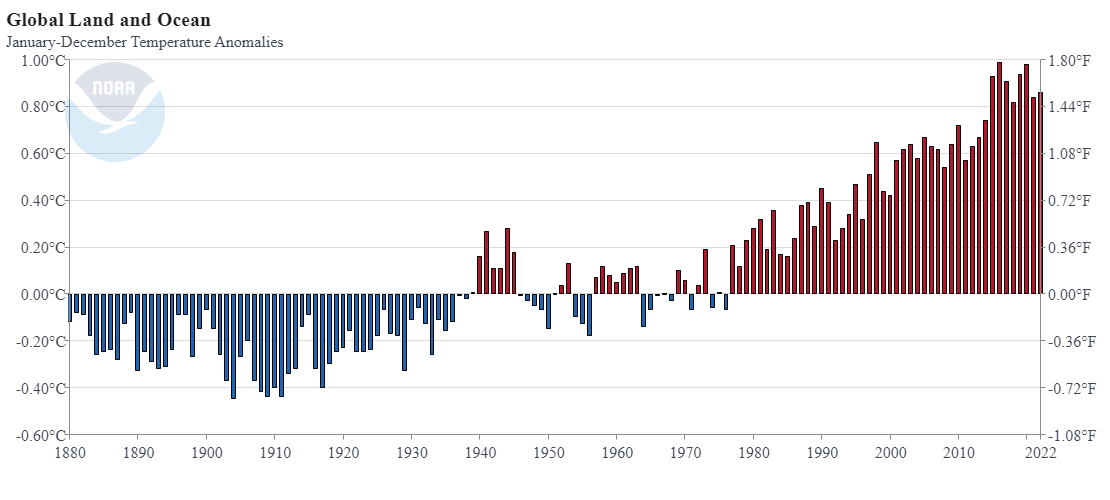
December 2022 ranked as the eighth-warmest December in NOAA's 143-year record. The December global surface temperature was 1.44°F (0.80°C) above the 20th-century average of 54.0°F (12.2°C). December 2022 marked the 46th consecutive December and the 456th consecutive month with temperatures, at least nominally, above the 20th-century average.

Warmer-than-average conditions were observed across most of South America, Africa, western Europe, and southern and northeastern North America, as well as across parts of southern and northeastern Asia and northeastern Oceania. Parts of southwestern Europe, northern Africa, and southeastern South America experienced record-high December temperatures. Sea surface temperatures were above average across much of the Atlantic and the northern, western, and southwestern Pacific and across parts of the northern Indian Ocean.
Overall, record-warm December temperatures encompassed about 7.5% of the world's surface. The northern hemisphere had its 10th-warmest December on record at 1.78°F (0.99°C) above average. Meanwhile, the southern hemisphere had its eighth-warmest December at 1.06°F (0.59°C) above average.
Temperatures were near- to cooler-than-average across parts of Scandinavia and eastern Europe, central Asia, Oceania, and southeastern, central, and northwestern North America. The south-central, central, and eastern tropical Pacific Ocean experienced near- to cooler-than-average sea surface temperatures. Record-cold temperatures were observed in Australia this month; however, less than 1% of the world's surface experienced record-cold December temperatures this month.


Africa and South America both had a December that ranked among the five warmest on record.
- December in Africa tied 2016 to rank as second warmest on record.
- In South America, December 2022 was the fourth warmest on record.
- In Uruguay, December temperatures ranged from 0.3°C to 1.6°C above the average.
Europe had its 10th-warmest December on record. Individual countries reported a mix of conditions.
- December in Italy ranked second-warmest on record.
- December in Croatia varied from 2.4°C to 4.9°C above the 1981-2010 average; at all stations, air temperature was higher than average.
- Norway had a national temperature for December that was 2.9°C below average; the month was the coldest December since 2012.
- The Baltic countries, including Estonia, Latvia, and Lithuania each had a December that was 1.5°C or more below average.
- The United Kingdom had a cooler-than-average December—the only month of 2022 to have a below-average monthly temperature.
- Ireland had a cooler-than-average December; it was the country's coldest December since 2010.
North America and Asia each had a warmer-than-average December, though it did not rank among the twenty warmest on record.
- The contiguous U.S. average temperature during December was 33.3°F, which was 0.6°F above average and ranked in the middle third of NOAA's 128-year record.
- North America had its coolest December since 2013.
- The Caribbean Islands had their coolest December since 2011.
- The Hawaiian region had its 10th-warmest December on record.
- Hong Kong had a cooler-than-average December.
- Israel had a warmer-than-average December at 1.74°C above the 1991-2020 average, according to The Israeli Meteorological Service.
- Pakistan had a December that was 1.18°C warmer than average.
Oceania had a warmer-than-average December, but it was the region's coolest December since 2011.
- Australia had a December that was 0.21°C below the average.
| December | Anomaly | Rank (out of 143 years) | Records | ||||
|---|---|---|---|---|---|---|---|
| °C | °F | Year(s) | °C | °F | |||
| Global | |||||||
| Land | +1.02 ± 0.14 | +1.84 ± 0.25 | Warmest | 16th | 2015 | +1.96 | +3.53 |
| Coolest | 128th | 1929 | -1.29 | -2.32 | |||
| Ocean | +0.71 ± 0.15 | +1.28 ± 0.27 | Warmest | 4th | 2015 | +0.84 | +1.51 |
| Coolest | 140th | 1910 | -0.49 | -0.88 | |||
| Land and Ocean | +0.80 ± 0.14 | +1.44 ± 0.25 | Warmest | 8th | 2015 | +1.15 | +2.07 |
| Coolest | 136th | 1916 | -0.63 | -1.13 | |||
| Northern Hemisphere | |||||||
| Land | +1.14 ± 0.20 | +2.05 ± 0.36 | Warmest | 19th | 2015 | +2.18 | +3.92 |
| Coolest | 125th | 1929 | -1.61 | -2.90 | |||
| Ocean | +0.90 ± 0.15 | +1.62 ± 0.27 | Warmest | 3rd | 2015 | +1.00 | +1.80 |
| Coolest | 141st | 1904 | -0.53 | -0.95 | |||
| Ties: 2018 | |||||||
| Land and Ocean | +0.99 ± 0.15 | +1.78 ± 0.27 | Warmest | 10th | 2015 | +1.45 | +2.61 |
| Coolest | 134th | 1916 | -0.79 | -1.42 | |||
| Southern Hemisphere | |||||||
| Land | +0.71 ± 0.14 | +1.28 ± 0.25 | Warmest | 19th | 2019 | +1.46 | +2.63 |
| Coolest | 125th | 1916 | -0.70 | -1.26 | |||
| Ocean | +0.57 ± 0.15 | +1.03 ± 0.27 | Warmest | 7th | 2015 | +0.73 | +1.31 |
| Coolest | 137th | 1909, 1910 | -0.49 | -0.88 | |||
| Land and Ocean | +0.59 ± 0.15 | +1.06 ± 0.27 | Warmest | 8th | 2015 | +0.83 | +1.49 |
| Coolest | 136th | 1909 | -0.52 | -0.94 | |||
| Arctic | |||||||
| Land and Ocean | +1.98 ± 0.14 | +3.56 ± 0.25 | Warmest | 15th | 2017 | +3.33 | +5.99 |
| Coolest | 129th | 1916 | -2.85 | -5.13 | |||
500 mb maps
In the atmosphere, 500-millibar height pressure anomalies correlate well with temperatures at the Earth's surface. The average position of the upper-level ridges of high pressure and troughs of low pressure—depicted by positive and negative 500-millibar height anomalies on the December 2022 map—is generally reflected by areas of positive and negative temperature anomalies at the surface, respectively.

Year-to-date Temperature: January–December 2022
Please see the NCEI State of the Climate Annual Global Analysis report for more information.


| January–December | Anomaly | Rank (out of 143 years) | Records | ||||
|---|---|---|---|---|---|---|---|
| °C | °F | Year(s) | °C | °F | |||
| Global | |||||||
| Land | +1.29 ± 0.14 | +2.32 ± 0.25 | Warmest | 7th | 2020 | +1.57 | +2.83 |
| Coolest | 137th | 1884 | -0.70 | -1.26 | |||
| Ocean | +0.69 ± 0.16 | +1.24 ± 0.29 | Warmest | 6th | 2016 | +0.79 | +1.42 |
| Coolest | 138th | 1904 | -0.46 | -0.83 | |||
| Land and Ocean | +0.86 ± 0.15 | +1.55 ± 0.27 | Warmest | 6th | 2016 | +0.99 | +1.78 |
| Coolest | 138th | 1904 | -0.45 | -0.81 | |||
| Northern Hemisphere | |||||||
| Land | +1.46 ± 0.18 | +2.63 ± 0.32 | Warmest | 6th | 2020 | +1.73 | +3.11 |
| Coolest | 138th | 1884 | -0.81 | -1.46 | |||
| Ocean | +0.88 ± 0.16 | +1.58 ± 0.29 | Warmest | 5th | 2020 | +0.98 | +1.76 |
| Coolest | 139th | 1904 | -0.52 | -0.94 | |||
| Land and Ocean | +1.10 ± 0.15 | +1.98 ± 0.27 | Warmest | 6th | 2020 | +1.27 | +2.29 |
| Coolest | 138th | 1893, 1904, 1907 | -0.47 | -0.85 | |||
| Southern Hemisphere | |||||||
| Land | +0.87 ± 0.11 | +1.57 ± 0.20 | Warmest | 12th | 2019 | +1.29 | +2.32 |
| Coolest | 132nd | 1917 | -0.74 | -1.33 | |||
| Ties: 2009 | |||||||
| Ocean | +0.56 ± 0.16 | +1.01 ± 0.29 | Warmest | 7th | 2016 | +0.70 | +1.26 |
| Coolest | 137th | 1909, 1911 | -0.43 | -0.77 | |||
| Land and Ocean | +0.61 ± 0.15 | +1.10 ± 0.27 | Warmest | 7th | 2016 | +0.77 | +1.39 |
| Coolest | 137th | 1911 | -0.44 | -0.79 | |||
| Arctic | |||||||
| Land and Ocean | +1.76 ± 0.10 | +3.17 ± 0.18 | Warmest | 5th | 2016 | +2.34 | +4.21 |
| Coolest | 139th | 1902 | -1.43 | -2.57 | |||
Precipitation
The maps shown below represent precipitation percent of normal (left, using a base period of 1961–1990) and precipitation percentiles (right, using the period of record) based on the GHCN dataset of land surface stations.
December 2022
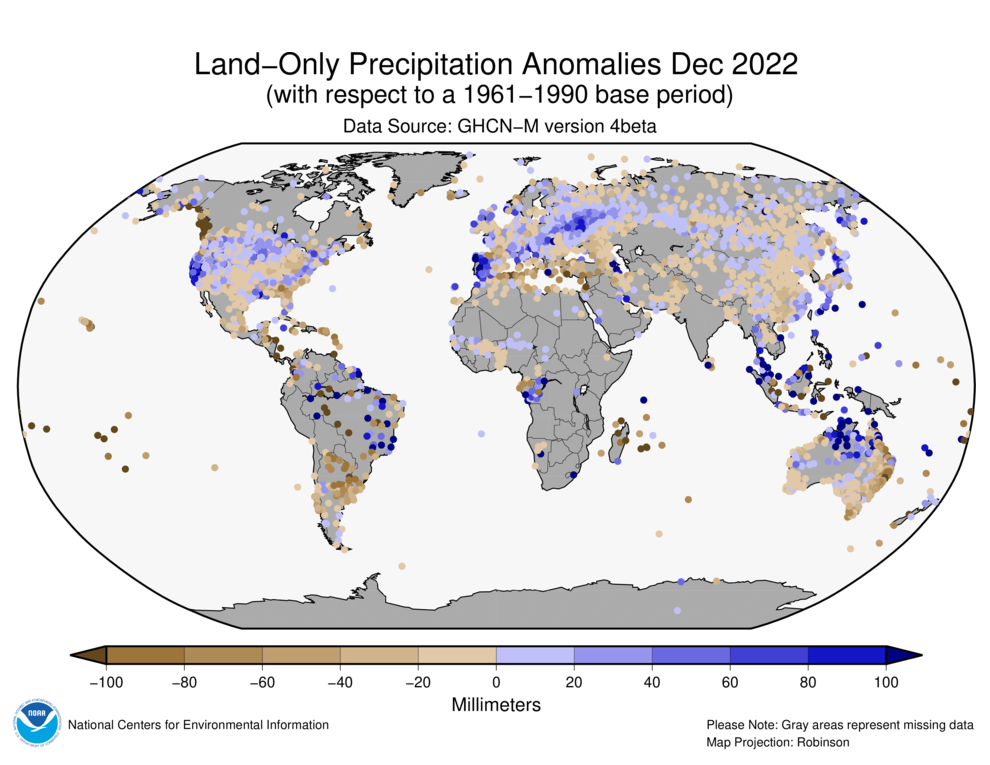

December 2022 saw above-average precipitation across much of the western, north-central, and coastal eastern U.S., as well as parts of eastern Brazil, western Europe, eastern central Europe and western central Asia, southern Japan, and northern Oceania. Dry conditions existed through much of the southern and central plains of the U.S., Mexico, northern Africa, southwestern Asia, eastern China, and eastern and southern Oceania.
Global Precipitation Climatology Project (GPCP)
The following analysis is based upon the Global Precipitation Climatology Project (GPCP) Interim Climate Data Record. It is provided courtesy of the GPCP Principal Investigator team at the University of Maryland.
The Global Precipitation Climatology Project (GPCP) monthly data set is a long-term (1979-present) analysis (Adler et al., 2018) using a combination of satellite and gauge information. An interim GPCP analysis completed within ~10 days of the end of the month allows the use of the GPCP analysis in climate monitoring and for this discussion.
December Highlights:
- The ongoing La Niña continued to strongly affect tropical precipitation patterns from the Indian Ocean across to the central and eastern Pacific Ocean, even though it may be weakening.
- December tropical cyclones added to the pattern over both the North and South Indian Oceans, and affected Australia, the Philippines, Sri Lanka, and India.
- Over North America, dry conditions extended across Mexico and the eastern U.S., while a positive anomaly further north was linked to California floods, heavy snows in the Sierras, and partial drought relief in the western U.S.
- Iberia had extensive rainfall and flooding, while the Alps continued drought conditions with a lack of snow.

December is the first month of winter in the Northern Hemisphere and summer in the Southern Hemisphere. The mean map (left, top panel) for December 2022 reflects this with the usual climatological features drifting southward, more noticeable over land (Africa, Australia, South Asia, South America) where the latitude seasonal excursions were more obvious. On top of these seasonal changes, inter-annual forcings such as ENSO and weather-scale variations during the month contributed to the monthly totals and deviations from the climatology as seen in the figure to the left (middle and bottom panels).
In the tropics, the main pattern of anomalies over the Pacific and Indian Oceans was still dominated by the effects of the long-term (more than two years) La Niña. These La Niña effects can easily be seen in the rainfall deficit along the Equator centered at 160°E, with extensions to the east along the ITCZ and to the southeast toward the tip of South America. The figure below shows a climatological composite of La Niña anomalies for December (top panel) and a repeat of this December's anomaly field (bottom panel) for easy comparison. To the west, the Maritime Continent between Australia and South Asia was dominated by an area of precipitation surplus with tentacles reaching out in various directions into the Bay of Bengal, toward Australia and westward into the Indian Ocean. Floods and landslides in southern Thailand and peninsular Malaysia were specific events connected to this larger-scale feature. The La Niña-related circulation pattern enhanced rising motion over these areas, but was also related to the enhancement of tropical cyclone rainfall. For this month, this was related to various storms such as Tropical Cyclone (TC) Mandous hitting Sri Lanka and southern India, floods in the Philippines from a weak tropical system, TC Ellie coming ashore in northern Australia, and long-lived TC Dorian leaving a clear precipitation anomaly track across the South Indian Ocean from Sumatra southwestward to about 30°S.

Further afield from these areas, the La Niña effects for December were more mixed. This result may be related to a slight apparent weakening of the La Niña as indicated by the Niño 3.4 SST index in December. Forecasts also call for a La Niña weakening and a trend toward ENSO-neutral conditions during the coming season. Australia showed a mixed anomaly pattern instead of a continent-wide positive pattern typical of La Niña. Africa also had a pattern with some positive anomalies in its eastern portion instead of La Niña-typical dry conditions, although the positive anomaly in South Africa was La Niña-typical and associated with floods in Johannesburg. This La Niña connection can also be tenuously tied to floods and landslides with over 100 dead in Kinshasa province of the Democratic Republic of Congo near the west equatorial coast of Africa. Over South America, the pattern's association with La Niña was mixed; the positive anomalies in the northeast and east, and the dry area to the south, was typical of La Niña, but the dry area in the northwest portion of the continent was atypical of that pattern.
Over North America, the December anomaly pattern was very similar to the December La Niña composite (figure to the right) with a dry zone running from the Pacific across Mexico and Central America and into the eastern U.S. To the north, this December's pattern had a strong positive anomaly running from the eastern Pacific into the western U.S. and northeastward into Canada. This feature was connected to tracks of Pacific storms and a very strong Atmospheric River (AR) that hit central and northern California late in the month. The AR caused extensive flooding along the coast and large snowfalls in the western mountains. This feature was weakly evident in the La Niña composite. Overall, the positive precipitation anomaly in the western U.S. helped to somewhat alleviate drought conditions there.
Over Europe, the precipitation anomaly pattern was varied. Some areas received significant precipitation which partially relieved drought conditions in those locales. The anomaly map for this December indicated the Iberian Peninsula had a positive precipitation anomaly which was linked to floods there, such as in Lisbon, Portugal. Further east, a continuing precipitation deficit this month was linked to a continuing lack of significant snowfall in the Alps that affected the skiing industry there.
Drought in December 2022
Drought information is based on global drought indicators available at the Global Drought Information System website, and media reports summarized by the National Drought Mitigation Center.
December Highlights: Beneficial precipitation fell across parts of the drought areas in Europe, North America, and Africa during December 2022, but the month was drier than normal over other parts of the drought-plagued agricultural lands of these three continents as well as South America and Asia. Much of the world's agricultural lands were still suffering from low soil moisture and groundwater levels, with evaporative stress high for this time of year in the lower latitudes and Southern Hemisphere. The afflicted areas include the Canadian Prairies, Great Plains of the United States, Brazil and Argentina in South America, Western Europe, southeast China, and northern and East Africa. Like the last two months, of the continents, Australia seems to be in the best shape. According to the Associated Press, drought and other factors drove up inflation and worsened hunger worldwide in 2022.
December 2022 was warmer than normal across southern Europe and cooler than normal over the British Isles and Scandinavia. The month was drier than normal over parts of France and Scandinavia while the Iberian Peninsula and eastern Europe were wetter than normal. Aside from Spain, much of the land bordering the Mediterranean Sea was drier than normal—over both southern Europe and northern Africa plus Anatolia—as well as warmer than normal. The recent precipitation was not enough to overcome deficits that built up earlier in 2022, with drier-than-normal conditions evident across northern to central Europe at the 3-month time scale, extending into southern Europe at the 6-month time scale, and across most of Europe at 9 to 12 months and beyond, as seen in Standardized Precipitation Index (SPI) and Standardized Precipitation Evapotranspiration Index (SPEI) values at these time periods. Much of the Mediterranean area was dry at 2- to 3-year time scales. Unusually warm temperatures that began in May 2022 and persisted throughout much of the year gave Europe the warmest June-December period and second warmest year in NCEI's 1910-2022 historical record. The excessive heat enhanced evapotranspiration that, in combination with lack of rain, dried soils and lowered groundwater levels. The recent precipitation was not enough to replenish these deficits, so low soil moisture and groundwater levels were still extensive across Europe and Anatolia at the end of December. Satellite observations of vegetative health showed that natural vegetation has recovered due to the recent precipitation, but the European Combined Drought Indicator still showed areas of drought on the continent. According to media reports, at the end of December, 19 departments across France remained on drought alert, due to a lack of water and low water table reserves.
The December precipitation anomaly pattern in Asia revealed alternating bands of wetter- and drier-than-normal precipitation. One drier-than-normal band stretched from the Black and Caspian Seas to eastern China, while another extended from northwest Russia to east of Lake Baikal. December temperatures were warmer than normal over southern Asia and along the Arctic coast, and near to below normal in between. Dry conditions were indicated in southeast China on the 2- to 6-month SPI and SPEI; from northwest Russia to Mongolia on the 6- to 9-month SPEI; and across Southwest Asia at 2-month time scales and longer. The dryness was especially severe over Southwest Asia at 1- to 3-year time scales. Excessive heat for much of 2022 gave the continent the second warmest year on record, based on NCEI data. High evapotranspiration associated with the extremely warm temperatures dried soils. At the end of December, satellite-based analyses indicated dry soils and low groundwater continued across parts of northwest Russia, central Asia, and much of eastern and southern China.
December was drier than normal across the northern Africa coast but wetter than normal in the Horn of Africa. Much of Africa was warmer than normal, with December 2022 ranking as the second warmest December continent-wide. The combination of high evapotranspiration (due to hot temperatures) and lack of precipitation earlier in the year resulted in severe dryness in East Africa and along the northern Africa coast in the 2-month to 4-year SPEI indicator. Parts of southern Africa were also dry at these time scales. Satellite-based analyses showed low groundwater and soil moisture across northern Africa, East Africa, and central areas of the continent, and poor vegetative health in East and northern Africa. According to media reports, drought has killed many wildlife in Kenya; "poor rainfall since late 2020 has devastated the Horn of Africa, raising fears of a famine in Somalia and plunging around four million Kenyans—nearly 10 percent of the population—into hunger." NASA described the drought in the Horn of Africa as the longest and most severe drought on record. Reuters reported that three years of drought have dried up Tunisian reservoirs, threatening harvests that are critical to the North African country's battered economy, and pushing the government to raise tap water prices for homes and businesses.
Parts of eastern and western Australia were drier than normal in December, and the eastern third of the continent was cooler than normal. There was some dryness indicated for western Australia on the 3-month SPI and satellite-based groundwater, soil moisture, and vegetative health indicators, and in northern Australia on the 9- to 36-month SPEI. Dry conditions in these areas at these time scales were also shown on the Australian Bureau of Meteorology Combined Drought Indicator analyses. But overall, much of the continent is free of drought.
Beneficial rain fell across parts of Brazil in December, but western and southern parts of South America were drier than normal. Warmer-than-normal temperatures were widespread, giving the continent the fourth warmest December according to NCEI data. Drought stress was evident on the SPEI across western and southern Brazil, and from Peru to Argentina and Chile, at the 1- to 24-month time scales and longer. Dryness extended into eastern Brazil at 2- to 24-month times scales. Low soil moisture and groundwater were indicated across these areas on satellite analyses. The satellite-based Vegetation Health Index (VHI) showed poor vegetative health especially across the northern half of Argentina. Drought in southern and eastern Brazil was confirmed on the Brazilian Drought Monitor. According to media reports, two years of drought have gripped Argentina's Pampas farm belt, threatening wheat, corn and soy crops and killing cattle in what Reuters described as "the worst scenario of the last 20 years."
In North America, like November, frequent troughs in the upper-atmosphere gave the western U.S. and southwest Canada a cooler-than-normal December, with warmer-than-normal temperatures limited to eastern and southern parts of the continent. Above-normal precipitation fell across much of the western to north central U.S., southern Mexico, and Alaska. December was drier than normal in some central and eastern parts of the U.S., northern Mexico, and several areas across Canada. The precipitation in the western U.S. brought short-term drought relief, but reservoirs continued very low and precipitation deficits were still evident on the SPI and SPEI indicators at 3 to 36 months and longer, with the dry area extending into northern Mexico at these time scales. Much of western Canada and parts of central and eastern Canada were dry at 1- to 24-month time scales. Satellite-based analyses indicated low groundwater and dry soils across most of western Canada; the Pacific Northwest, Ohio Valley, and southern Plains of the U.S.; and northern Mexico and the Yucatan Peninsula. The North American Drought Monitor product depicted drought across much of western Canada, most of the central to western U.S., and parts of northern to central Mexico and the Ohio Valley and Southeast in the U.S. According to media reports, in Canada, drought in British Columbia was reducing potable water supplies.
Ocean Heat Content
Ocean Heat Content (OHC) is essential for understanding and modeling global climate since > 90% of excess heat in the Earth's system is absorbed by the ocean. Further, expansion due to increased ocean heat contributes to sea level rise. Change in OHC is calculated from the difference of observed temperature profiles from the long-term mean.
| Basin | 0-700 meters | Rank (1955-2023) | |||||
|---|---|---|---|---|---|---|
| Entire Basin | Northern Hemisphere | Southern Hemisphere | ||||
| Atlantic | 8.483 | 3rd | 4.955 | 2nd | 3.528 | 3rd |
| Indian | 4.531 | 3rd | 0.608 | 10th | 3.923 | 3rd |
| Pacific | 7.344 | 2nd | 3.375 | 2nd | 3.969 | 2nd |
| World | 20.357 | 2nd | 8.937 | 3rd | 11.420 | 2nd |
| Source: Basin time series of heat content | ||||||

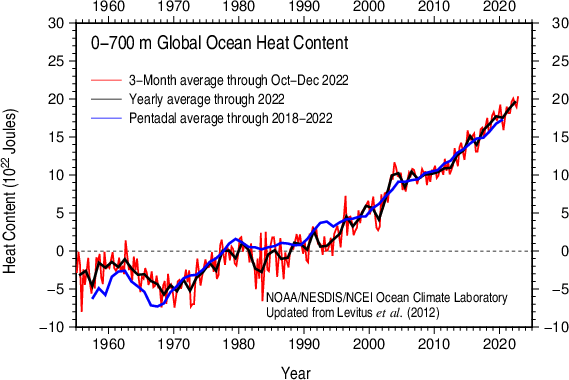
Global OHC for October–December 2022 is the highest October–December OHC in our records, which extend back to 1955. In fact, 2022 was the warmest year on record for the global ocean. Overall, the latest quarterly OHC reveals widespread warmer-than-normal conditions relative to the 1955–2006 mean, a situation observed since the end of 2016. In general, current OHC features are similar to those observed since October–December 2021. Cooler than normal conditions, about -10x105 J/m3, persist across the subtropical North Pacific Ocean and also dominate the tropical Pacific Ocean east of 160°W. Much higher—greater than 30x105 J/m3—than normal OHC conditions continue to exist in the Gulf Stream/North Atlantic Current, the North Pacific Current, the western tropical Pacific Ocean, and the northern Antarctic Circumpolar Current in the Indian Ocean sector. Higher—10x105 J/m3—than normal OHC conditions dominate the Indonesian Throughflow, the eastern Indian Ocean, the Arabian Sea, and the Tasman Sea. Cool conditions of less than -10x105 J/m3 persist in the subpolar North Atlantic Ocean south of Greenland. Higher-than-normal OHC conditions dominate most of the South Atlantic Ocean with the exception of the Brazil/Falkland Confluence Zone, where much cooler-than-normal conditions of less than -30x105 J/m3 persist.
References
- Adler, R., G. Gu, M. Sapiano, J. Wang, G. Huffman 2017. Global Precipitation: Means, Variations and Trends During the Satellite Era (1979-2014). Surveys in Geophysics 38: 679-699, doi:10.1007/s10712-017-9416-4
- Adler, R., M. Sapiano, G. Huffman, J. Wang, G. Gu, D. Bolvin, L. Chiu, U. Schneider, A. Becker, E. Nelkin, P. Xie, R. Ferraro, D. Shin, 2018. The Global Precipitation Climatology Project (GPCP) Monthly Analysis (New Version 2.3) and a Review of 2017 Global Precipitation. Atmosphere. 9(4), 138; doi:10.3390/atmos9040138
- Gu, G., and R. Adler, 2022. Observed Variability and Trends in Global Precipitation During 1979-2020. Climate Dynamics, doi:10.1007/s00382-022-06567-9
- Huang, B., Peter W. Thorne, et. al, 2017: Extended Reconstructed Sea Surface Temperature version 5 (ERSSTv5), Upgrades, validations, and intercomparisons. J. Climate, doi: 10.1175/JCLI-D-16-0836.1
- Huang, B., V.F. Banzon, E. Freeman, J. Lawrimore, W. Liu, T.C. Peterson, T.M. Smith, P.W. Thorne, S.D. Woodruff, and H-M. Zhang, 2016: Extended Reconstructed Sea Surface Temperature Version 4 (ERSST.v4). Part I: Upgrades and Intercomparisons. J. Climate, 28, 911-930, doi:10.1175/JCLI-D-14-00006.1.
- Menne, M. J., C. N. Williams, B.E. Gleason, J. J Rennie, and J. H. Lawrimore, 2018: The Global Historical Climatology Network Monthly Temperature Dataset, Version 4. J. Climate, in press. https://doi.org/10.1175/JCLI-D-18-0094.1.
- Peterson, T.C. and R.S. Vose, 1997: An Overview of the Global Historical Climatology Network Database. Bull. Amer. Meteorol. Soc., 78, 2837-2849.
- Vose, R., B. Huang, X. Yin, D. Arndt, D. R. Easterling, J. H. Lawrimore, M. J. Menne, A. Sanchez-Lugo, and H. M. Zhang, 2021. Implementing Full Spatial Coverage in NOAA's Global Temperature Analysis. Geophysical Research Letters 48(10), e2020GL090873; doi:10.1029/2020gl090873.