Temperature
NOAA's National Centers for Environmental Information calculates the global temperature anomaly every month based on preliminary data generated from authoritative datasets of temperature observations from around the globe. The major dataset, NOAAGlobalTemp version 5, updated in mid-2019, uses comprehensive data collections of increased global area coverage over both land and ocean surfaces. NOAAGlobalTempv5 is a reconstructed dataset, meaning that the entire period of record is recalculated each month with new data. Based on those new calculations, the new historical data can bring about updates to previously reported values. These factors, together, mean that calculations from the past may be superseded by the most recent data and can affect the numbers reported in the monthly climate reports. The most current reconstruction analysis is always considered the most representative and precise of the climate system, and it is publicly available through Climate at a Glance.
August 2022
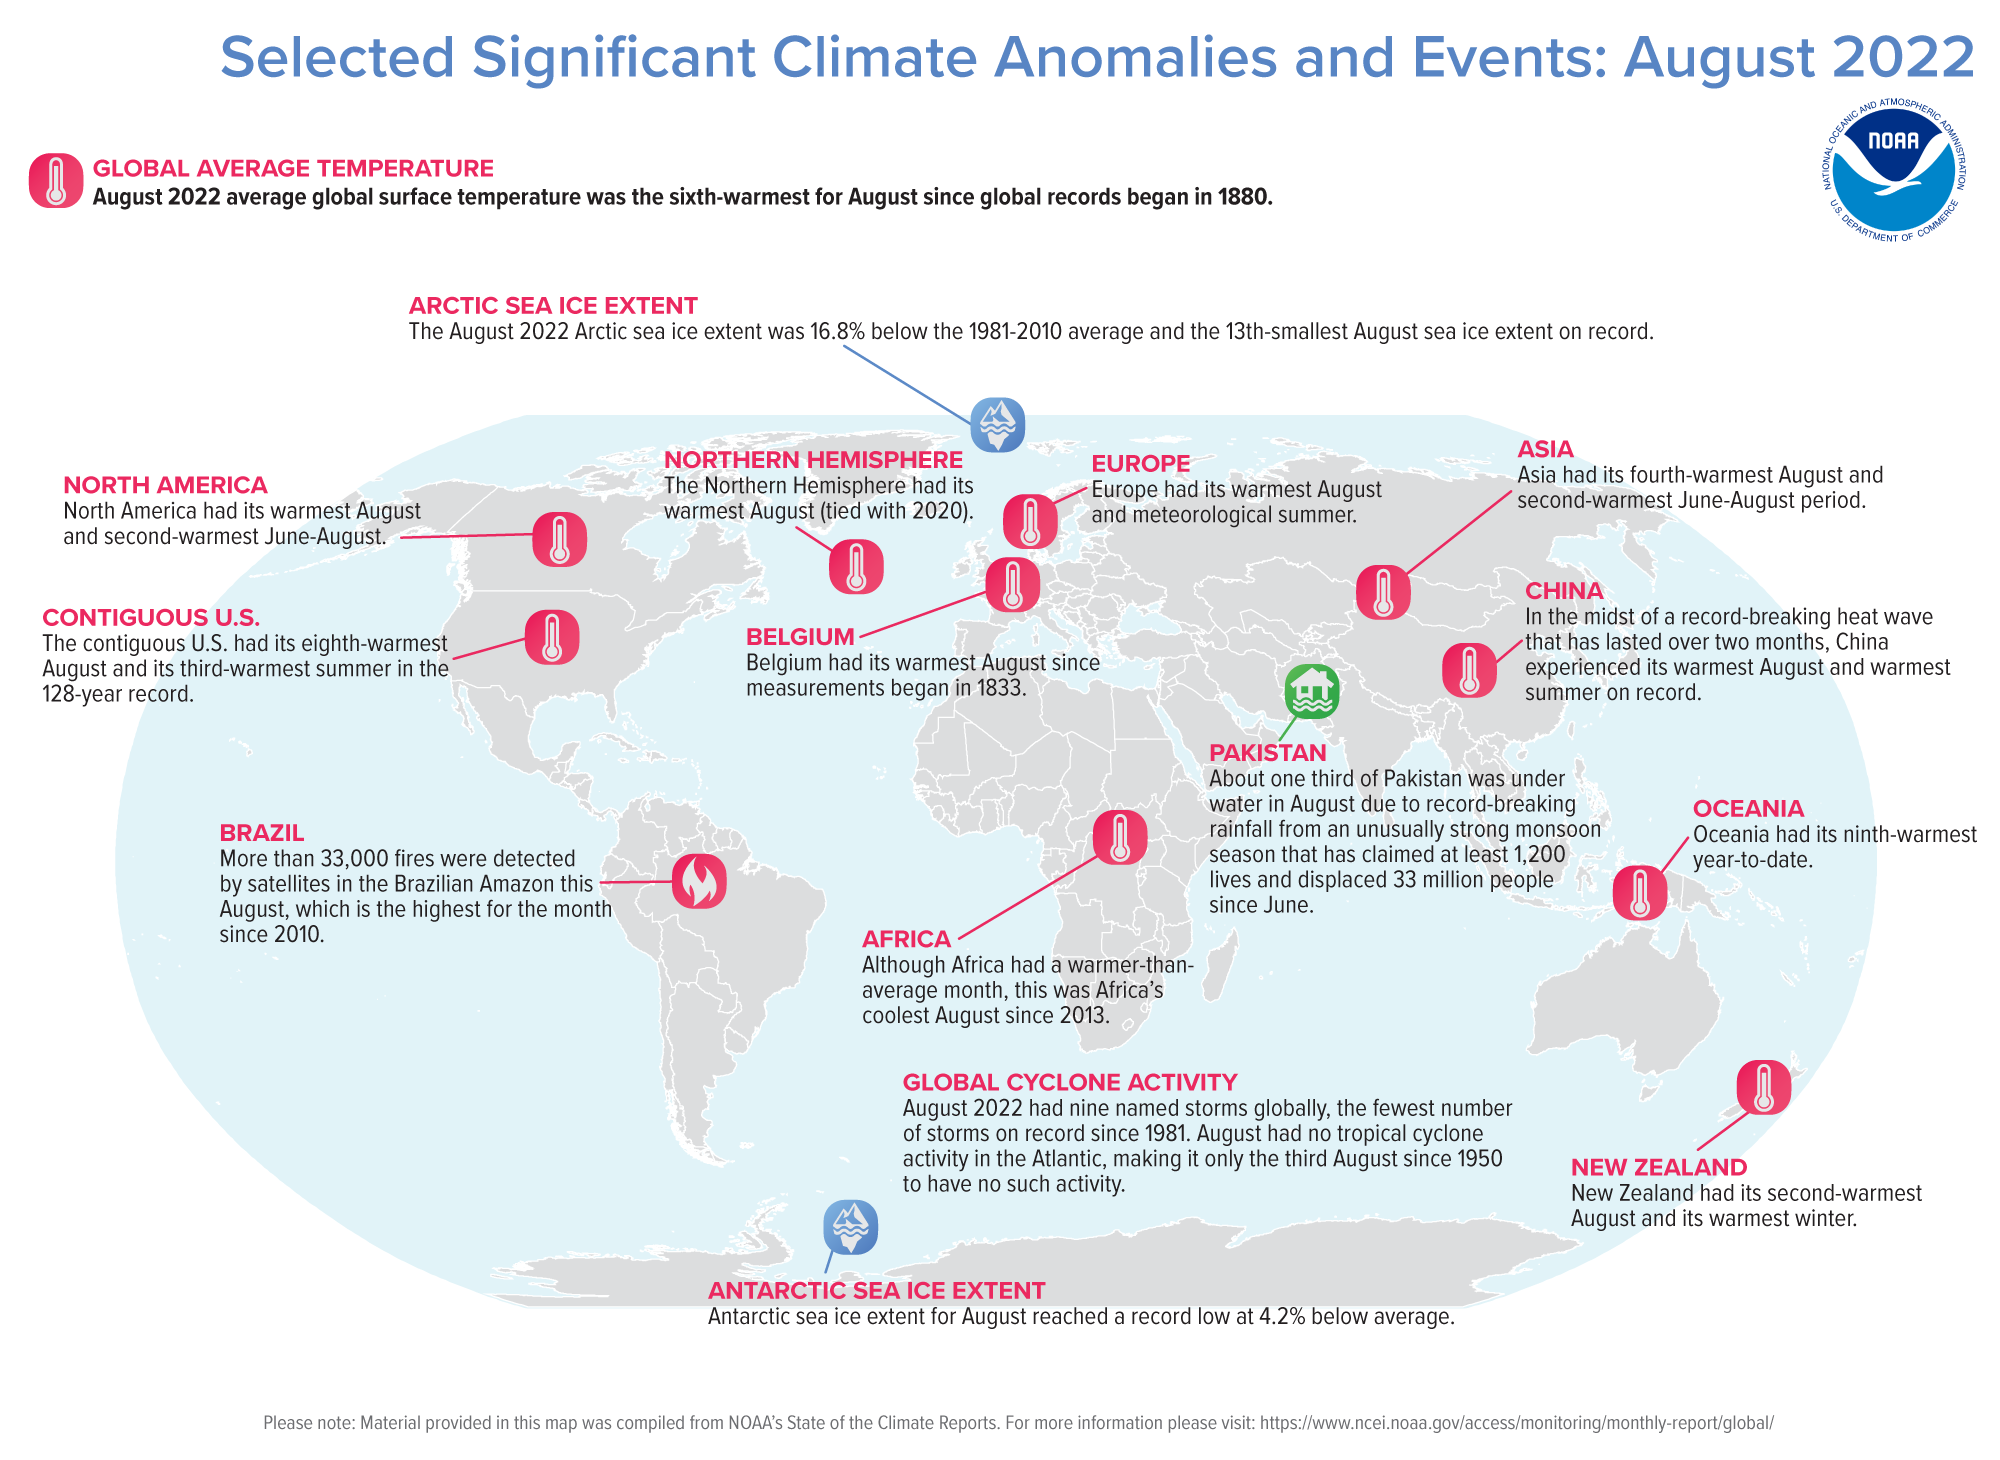
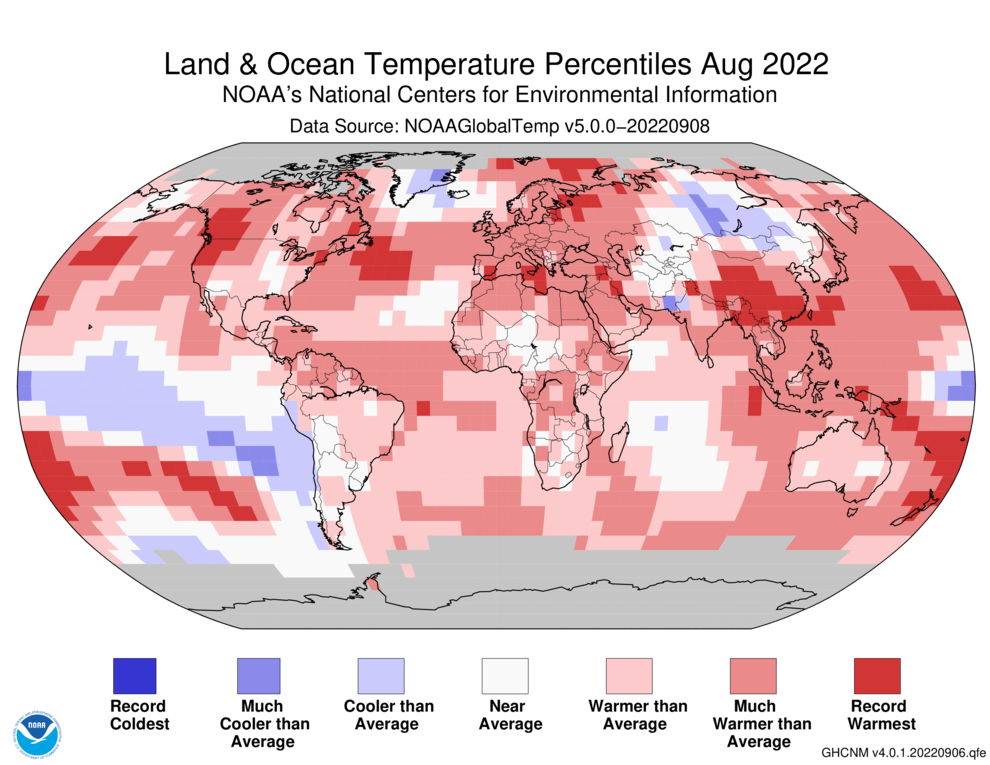
The August 2022 global surface temperature departure was the sixth highest for August in the 143-year record at 0.90°C (1.62°F) above the 20th century average of 15.6°C (60.1°F). The ten warmest Augusts on record have all occurred since 2009. August 2022 also marked the 46th consecutive August and the 452nd consecutive month with temperatures, at least nominally, above the 20th century average.

The month of August was characterized by warmer-than-average conditions across much of Europe, North America, and southern and southeastern Asia, as well as across parts of northern Africa, northern South America, the Arabian Peninsula, and northern Oceania. Record-high August temperatures were observed in parts of the northwestern U.S., southwestern Canada, Spain, Italy, China, southeast Asia, and New Zealand. Sea surface temperatures were above average across much of the northern, western, and southwestern Pacific, the Gulf of Mexico, the Mediterranean, and parts of the Atlantic and eastern Indian oceans. Overall, record-warm August temperatures encompassed about 8.2% of the world's surface — the 3rd-highest percentage for record-high August temperatures.
Temperatures were near-average throughout parts of south-central Asia (e.g. Afghanistan, Turkmenistan, Tajikistan), southern South America, and the central Indian Ocean. Cooler-than-average August temperatures were present across parts of central Russia, southeastern Pakistan, central Kazakhstan, eastern Mongolia, and southern Chile. Consistent with La Niña, sea surface temperatures were below average over much of the south-central, central, and eastern tropical Pacific. However, there were no areas with record-cold August temperatures this month.
This August's Northern Hemisphere land temperature tied a 2021 record for the warmest on record. Similarly, the combined land and ocean temperature of the Northern Hemisphere for August 2022 tied a 2020 record as the warmest August on record.

Both Europe and North America had their warmest August on record.
- The contiguous U.S. had its eighth-warmest August on record. For the second month in a row, the contiguous U.S. monthly average minimum temperature was record warm.
- Spain had its second-warmest August on record after August 2003.
- The Royal Meteorological Institute confirmed that Belgium had its warmest August since records began in 1833.
- According to the French National Meteorological Service, this August was the country's second-warmest August on record after 2003.
- August 2022 tied a 1990 record for the second-warmest August on record in Switzerland.
- According to the German Meteorological Service, August 2022 was the country's second-warmest August on record.
- The Netherlands had its third warmest August on record.
- August 2022 in Belarus tied August 2010 as the hottest August on record.
Asia had its fourth-warmest August on record.
- Chinese state media confirmed this August as China's hottest August on record.
- A record-breaking heat wave has affected much of China for more than two months. According to the Beijing Climate Centre, the combined intensity of this summer's heat wave event in China since early June is the most severe on record since 1961.
- Japan had its ninth-warmest August on record according to the Japanese Meteorological Agency.
- The Iran Meteorological Organization verified a 53.6°C (128.48°F) temperature on August 9 that was recorded in the city of Shush in the Khuzestan Province. This is one of the hottest temperatures ever recorded worldwide.
Oceania, Africa, and South America each had a warmer-than-average August, but it did not rank among their top ten on record.
- New Zealand had its second-warmest August on record.
- In Australia, the mean temperature for August was 0.73°C (1.31°F) warmer than the 1961-1990 average.
| August | Anomaly | Rank (out of 143 years) | Records | ||||
|---|---|---|---|---|---|---|---|
| °C | °F | Year(s) | °C | °F | |||
| Global | |||||||
| Land | +1.23 ± 0.24 | +2.21 ± 0.43 | Warmest | 5th | 2016 | +1.39 | +2.50 |
| Coolest | 139th | 1912 | -0.65 | -1.17 | |||
| Ocean | +0.78 ± 0.14 | +1.40 ± 0.25 | Warmest | 6th | 2019 | +0.84 | +1.51 |
| Coolest | 138th | 1903 | -0.48 | -0.86 | |||
| Land and Ocean | +0.90 ± 0.16 | +1.62 ± 0.29 | Warmest | 6th | 2016 | +0.98 | +1.76 |
| Coolest | 138th | 1912 | -0.46 | -0.83 | |||
| Northern Hemisphere | |||||||
| Land | +1.42 ± 0.28 | +2.56 ± 0.50 | Warmest | 1st | 2021, 2022 | +1.42 | +2.56 |
| Coolest | 143rd | 1884 | -0.90 | -1.62 | |||
| Ties: 2021 | |||||||
| Ocean | +1.08 ± 0.13 | +1.94 ± 0.23 | Warmest | 3rd | 2019, 2020 | +1.14 | +2.05 |
| Coolest | 141st | 1903 | -0.57 | -1.03 | |||
| Land and Ocean | +1.20 ± 0.19 | +2.16 ± 0.34 | Warmest | 1st | 2020, 2022 | +1.20 | +2.16 |
| Coolest | 143rd | 1912 | -0.64 | -1.15 | |||
| Ties: 2020 | |||||||
| Southern Hemisphere | |||||||
| Land | +0.76 ± 0.12 | +1.37 ± 0.22 | Warmest | 17th | 2015, 2016 | +1.33 | +2.39 |
| Coolest | 127th | 1891 | -0.83 | -1.49 | |||
| Ocean | +0.55 ± 0.15 | +0.99 ± 0.27 | Warmest | 9th | 2016 | +0.67 | +1.21 |
| Coolest | 135th | 1911 | -0.42 | -0.76 | |||
| Land and Ocean | +0.59 ± 0.14 | +1.06 ± 0.25 | Warmest | 11th | 2016 | +0.78 | +1.40 |
| Coolest | 133rd | 1911 | -0.43 | -0.77 | |||
| Arctic | |||||||
| Land and Ocean | +1.53 ± 0.33 | +2.75 ± 0.59 | Warmest | 5th | 2016 | +1.75 | +3.15 |
| Coolest | 139th | 1912 | -1.06 | -1.91 | |||
500 mb maps
In the atmosphere, 500-millibar height pressure anomalies correlate well with temperatures at the Earth's surface. The average position of the upper-level ridges of high pressure and troughs of low pressure—depicted by positive and negative 500-millibar height anomalies on the August 2022 map—is generally reflected by areas of positive and negative temperature anomalies at the surface, respectively.

Seasonal Temperature: June–August 2022
The June–August 2022 global surface temperature was 0.89°C (1.60°F) above the 20th-century average of 15.6°C (60.1°F). This ranks as the fifth-warmest June-August period in the 143-year record, tied with the June–August periods of 2015 and 2017. This is 0.05°C (0.09°F) cooler than the warmest June–August period (2016). The five warmest June–August periods have occurred from 2015 to present.
The June–August period is defined as the Northern Hemisphere's meteorological summer and the Southern Hemisphere's meteorological winter. The Northern Hemisphere summer 2022 temperature was the second warmest on record after 2020, and the Southern Hemisphere winter temperature was the tenth warmest on record.
Europe had its warmest meteorological summer on record at 2.41°C (4.34°F) above average. It was the second-warmest June–August period on record for both North America and Asia at 1.45°C (2.61°F) and 1.46°C (2.63°F) above average, respectively. Africa tied 2002 for its 11th-warmest June–August period on record.
| June–August | Anomaly | Rank (out of 143 years) | Records | ||||
|---|---|---|---|---|---|---|---|
| °C | °F | Year(s) | °C | °F | |||
| Global | |||||||
| Land | +1.27 ± 0.24 | +2.29 ± 0.43 | Warmest | 2nd | 2021 | +1.37 | +2.47 |
| Coolest | 142nd | 1884 | -0.59 | -1.06 | |||
| Ocean | +0.74 ± 0.15 | +1.33 ± 0.27 | Warmest | 6th | 2019 | +0.83 | +1.49 |
| Coolest | 138th | 1904, 1911 | -0.48 | -0.86 | |||
| Land and Ocean | +0.89 ± 0.17 | +1.60 ± 0.31 | Warmest | 5th | 2016 | +0.94 | +1.69 |
| Coolest | 139th | 1904, 1911 | -0.46 | -0.83 | |||
| Ties: 2015, 2017 | |||||||
| Northern Hemisphere | |||||||
| Land | +1.44 ± 0.24 | +2.59 ± 0.43 | Warmest | 2nd | 2021 | +1.56 | +2.81 |
| Coolest | 142nd | 1884 | -0.69 | -1.24 | |||
| Ocean | +0.97 ± 0.14 | +1.75 ± 0.25 | Warmest | 5th | 2020 | +1.10 | +1.98 |
| Coolest | 139th | 1904 | -0.55 | -0.99 | |||
| Ties: 2017 | |||||||
| Land and Ocean | +1.15 ± 0.20 | +2.07 ± 0.36 | Warmest | 2nd | 2020 | +1.18 | +2.12 |
| Coolest | 142nd | 1904 | -0.52 | -0.94 | |||
| Southern Hemisphere | |||||||
| Land | +0.86 ± 0.13 | +1.55 ± 0.23 | Warmest | 11th | 2015 | +1.23 | +2.21 |
| Coolest | 133rd | 1891, 1894 | -0.75 | -1.35 | |||
| Ocean | +0.57 ± 0.16 | +1.03 ± 0.29 | Warmest | 8th | 2016 | +0.69 | +1.24 |
| Coolest | 136th | 1911 | -0.45 | -0.81 | |||
| Ties: 2009, 2020 | |||||||
| Land and Ocean | +0.62 ± 0.15 | +1.12 ± 0.27 | Warmest | 10th | 2016 | +0.74 | +1.33 |
| Coolest | 134th | 1911 | -0.49 | -0.88 | |||
| Arctic | |||||||
| Land and Ocean | +1.60 ± 0.11 | +2.88 ± 0.20 | Warmest | 3rd | 2016 | +1.87 | +3.37 |
| Coolest | 141st | 1884 | -0.97 | -1.75 | |||
Over the land surface, air temperatures for the season were above average across much of North America; Europe; western, eastern, southwestern, and southeastern Asia; much of northern and eastern South America; northern and southern Africa; and western Australia. Parts of western Europe, China, and southeast Asia experienced multiple heat waves and were record warm during the three-month period. Air temperatures were near- to below-average across parts of coastal western and southern South America, central Russia, Pakistan, and northeastern Australia.
Sea surface temperatures for the season were above average across much of the northern and western Pacific, parts of the southeastern Pacific, and most of the Atlantic and eastern Indian oceans. Sea surface temperatures were below average over much of the central and eastern tropical Pacific.
None of the world's surface had a record-cold temperature in the June–August period.


Select national information is highlighted below. Please note that different countries report anomalies with respect to different base periods. The information provided here is based directly upon these data:
- The contiguous U.S. had its third-warmest summer on record.
- Spain had its warmest summer on record with an average departure of 2.2°C from the 1981-2010 reference period. Summer 2022 average temperature exceeded the previous record in Spain (summer 2003) by 0.4°C.
- England tied a 2018 record for its warmest summer since records began in 1884.
- According to Hungary's National Meteorological Service, summer 2022 was the country's hottest summer in 121 years of records. Temperatures were 2.0°C above average.
- Slovenia had its second-warmest summer on record since records began in 1961.
- France had its second-hottest summer on record after 2003, with an average departure of +2.3°C from the 1991-2020 average. Whereas summer 2003 had 22 heat wave days, this summer in France saw 33 heat wave days.
- The Czech Republic had its sixth-warmest summer on record.
- New Zealand had its warmest and wettest winter on record. The country's last three winters have been the warmest on record.
Year-to-date Temperature: January–August 2022
January to August was characterized by much-warmer-than-average conditions across much of southern North America, Europe, Asia, Oceania, and central South America, and across parts of the Atlantic, Indian, and northern and western Pacific oceans. Meanwhile, near- to cooler-than-average conditions were present across parts of northern North America, north central Africa, the northern Atlantic Ocean, the central and eastern tropical Pacific and the southeastern Pacific Ocean.
The January–August global surface temperature was 0.86°C (1.55°F) above the 1901-2000 average of 14.0°C (57.3°F) — the sixth-highest January–August temperature in the 143-year record. The ten warmest January–August periods on record have occurred since 2010. According to NCEI's statistical analysis, the year 2022 is very likely to rank among the ten warmest years on record but only has a 10.4% chance to rank among the five warmest years on record.


Regionally, Europe had its second-warmest January–August period on record after 2020. Asia had its third-warmest January–August. The Caribbean Islands had their eighth-warmest year-to-date, and the Oceania region had its ninth-warmest.
| January–August | Anomaly | Rank (out of 143 years) | Records | ||||
|---|---|---|---|---|---|---|---|
| °C | °F | Year(s) | °C | °F | |||
| Global | |||||||
| Land | +1.33 ± 0.18 | +2.39 ± 0.32 | Warmest | 6th | 2016 | +1.70 | +3.06 |
| Coolest | 138th | 1893 | -0.70 | -1.26 | |||
| Ocean | +0.68 ± 0.18 | +1.22 ± 0.32 | Warmest | 6th | 2016 | +0.84 | +1.51 |
| Coolest | 138th | 1911 | -0.50 | -0.90 | |||
| Land and Ocean | +0.86 ± 0.17 | +1.55 ± 0.31 | Warmest | 6th | 2016 | +1.07 | +1.93 |
| Coolest | 138th | 1911 | -0.52 | -0.94 | |||
| Northern Hemisphere | |||||||
| Land | +1.53 ± 0.21 | +2.75 ± 0.38 | Warmest | 4th | 2016 | +1.90 | +3.42 |
| Coolest | 140th | 1884, 1893 | -0.78 | -1.40 | |||
| Ocean | +0.85 ± 0.17 | +1.53 ± 0.31 | Warmest | 5th | 2020 | +0.99 | +1.78 |
| Coolest | 139th | 1904 | -0.53 | -0.95 | |||
| Land and Ocean | +1.11 ± 0.18 | +2.00 ± 0.32 | Warmest | 5th | 2016, 2020 | +1.32 | +2.38 |
| Coolest | 139th | 1893, 1904 | -0.55 | -0.99 | |||
| Southern Hemisphere | |||||||
| Land | +0.84 ± 0.14 | +1.51 ± 0.25 | Warmest | 11th | 2019 | +1.22 | +2.20 |
| Coolest | 133rd | 1917 | -0.80 | -1.44 | |||
| Ocean | +0.57 ± 0.18 | +1.03 ± 0.32 | Warmest | 7th | 2016 | +0.75 | +1.35 |
| Coolest | 137th | 1911 | -0.49 | -0.88 | |||
| Ties: 2010 | |||||||
| Land and Ocean | +0.61 ± 0.17 | +1.10 ± 0.31 | Warmest | 9th | 2016 | +0.82 | +1.48 |
| Coolest | 135th | 1911 | -0.52 | -0.94 | |||
| Arctic | |||||||
| Land and Ocean | +1.85 ± 0.15 | +3.33 ± 0.27 | Warmest | 5th | 2016 | +2.63 | +4.73 |
| Coolest | 139th | 1888, 1902 | -1.29 | -2.32 | |||
Precipitation
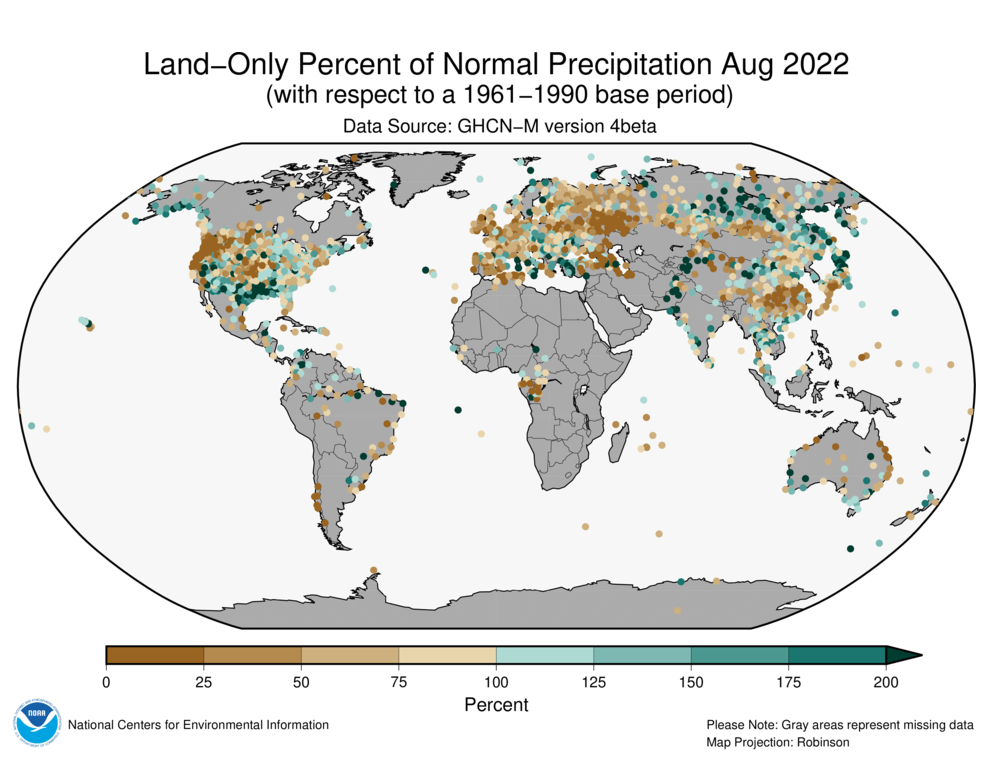
The maps shown below represent precipitation percent of normal (left, using a base period of 1961–1990) and precipitation percentiles (right, using the period of record) based on the GHCN dataset of land surface stations.
August 2022
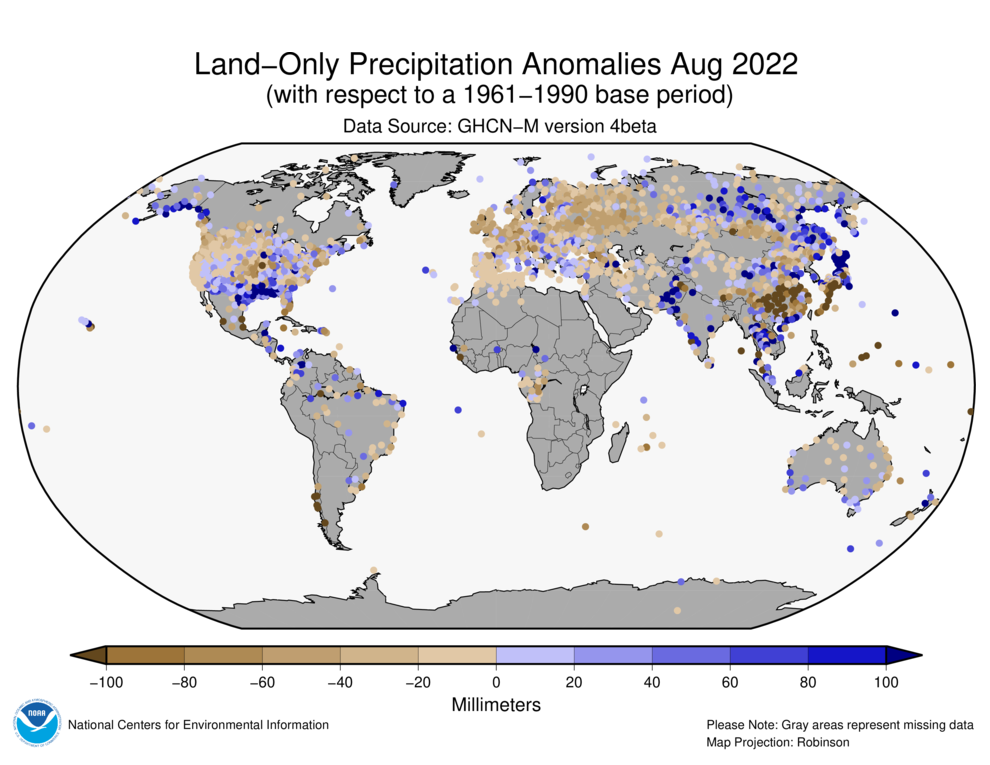
Precipitation anomalies during August 2022 varied significantly around the world. August precipitation was generally less than normal across the western coast of the contiguous U.S., western Europe, western Russia, and southeast Asia, as well as parts of southeastern Brazil, southern and central Japan, and central Asia. Wetter-than-normal conditions were notable across parts of the southwestern U.S., western and central Gulf of Mexico coast, northern Japan, western India, and Pakistan.
Global Precipitation Climatology Project (GPCP)
The following analysis is based upon the Global Precipitation Climatology Project (GPCP) Interim Climate Data Record. It is provided courtesy of the GPCP Principal Investigator team at the University of Maryland.
August and Seasonal Highlights:
- Asian monsoon shows alternating wet and dry anomalies from the Indian Ocean northward associated with floods and drought
- La Niña effects still dominate tropical Pacific across to Indian Ocean; land and ocean totals respectively set positive and negative records for August, but cancel out for global total
- Drought continues over western Europe into Russia as dry zone extension from Atlantic Ocean
- Tropical Indian Ocean to Magellan Straits feature for the June-August period linked to La Niña
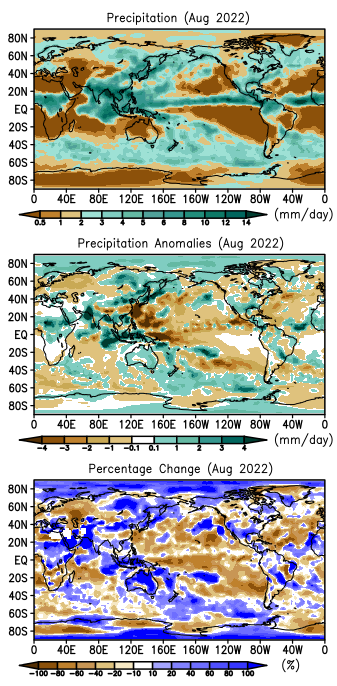
For August, the climatological rain belts and dry zones are generally at or near their northernmost positions as seen in the top panel. The Asian monsoon covers southeast Asia, the northern Indian Ocean and extends out into the Pacific Ocean. The Intertropical Convergence Zone (ITCZ) positions over the Atlantic and Pacific and the peak mean rain areas over South America and Africa are also at their northern extreme positions.
When the specific amounts for this August are compared to the relatively smooth 40-year climatology, the resulting anomaly pattern (middle panel) and percentage anomaly pattern (bottom panel; especially useful in areas with smaller monthly amounts) have an irregular, highly variable pattern reflecting an individual month's precipitation events. While there are broad areas of positive and negative deviations from the mean, superimposed there are very intense features of both signs. On the broad scale, the negative area of anomalies across the tropical Pacific covers almost the entire zone and is generally associated with the ongoing La Niña. Imbedded in that broad zone are some intense negative features that occur mainly in areas of high rainfall and in this case are partially related to the relative absence of tropical cyclones this August, e.g., in the western Pacific. These intense negative features are not as intense in the percentage anomaly chart because of the large climatological means there.
On the positive anomaly side, there is a broad area of that sign across the Maritime Continent and out into the Indian Ocean, again mainly associated with the La Niña. Just to the north of that excess rain feature that was related to flooding in Indonesia is a narrow east-west dry feature running from just south of Indochina westward to India. But further north, another somewhat narrow east-west wet feature running from Pakistan through India, then across Indochina and the South China sea to the Philippines has imbedded peaks that included periods of flooding in Pakistan, northern India, Vietnam, and the northern Philippines. The positive anomaly in Pakistan is the most distinctive feature over land this month and the floods there were devastating with over 1000 dead and 30 million people affected.
Even further north yet another dry zone with similar orientation extends across China covering most of the Yangtze River valley, where a major drought has been inter-related with an intense heat wave reducing the flow in the Yangtze to extremely low levels affecting hydropower and transportation. And finally, north of that dry feature is another wet, east-west, anomaly with accompanying floods in northern China, Korea and Japan during the month. These five anomaly features (and possibly two more further north) point to the spatial variations in the summer monsoon of Asia, the complexities of the dynamics therein, and the large impacts (floods or drought) on communities and countries depending on their position relative to these features.
The seasonal rain belt over Africa was active in August producing a wet anomaly across the continent with associated floods, including in Nigeria, Sudan, and across the Red Sea into Yemen. This active convection zone over the continent extends out into the eastern Atlantic and is the breeding ground for waves that can grow into tropical cyclones. However, this August, for the first time in many years, no named storms (tropical storm or hurricane status) were initiated and that seems to be reflected in the general drier-than-normal situation in the tropical Atlantic into the Caribbean.
Over the Americas, there are variable patterns not linked to the La Niña, but the month shows that both floods and drought can coexist in the same month in the same region. In the midst of a long-term drought, the southwest U.S. and Mexico received some relief through an active monsoon providing above normal rainfall in some of the region. The immediate west coast is still drier than normal for the month as in the northwest U.S. and southwest Canada. Perhaps the driest place in the U.S., Death Valley, CA, experienced a flood in the middle of a very long dry period. The positive anomaly sweeps across the southwest U.S. and Mexico into the Mississippi River valley. On the edge of the feature, in the middle of a heat wave, Dallas, TX experienced a downtown flood and a small area of southeast Illinois received about 250 mm of rain in a day early in the month. Near the end of August, the south-central U.S. coast received substantial rain helping to produce the peak in the figure there and producing flooding along the Pearl River in Jackson, MS which led to serious water system problems there. In contrast, the northeast U.S. was relatively dry with rainfall deficits, with drought conditions in Massachusetts and Rhode Island.
The Atlantic Ocean east of North America has a precipitation deficit for August and that feature continues into western Europe and northeastward into Russia. The lack of August rainfall extended the major drought over these land areas, and also helped to lead to wildfires in France and Russia and low flow on the Rhine River, negatively affecting shipping.
If one closely examines the anomaly map for this month, it is not hard to detect that most of the ocean area contains precipitation deficits, while the land seems to be dominated by areas of precipitation excess. The global statistics for this month confirm this impression. The global total for this August is estimated to be 2.71 mm/d, almost exactly equal to the climatological normal of 2.72 mm/d. However, the ocean mean value is 2.65 mm/d, with an anomaly of -0.18 mm/d, while the land area mean for this month is 2.83 mm/d with an anomaly of +0.35 mm/d. The land precipitation number is an August record at the high end for the entire record, while the ocean mean is a record low for the entire record.
Although this kind of land/ocean, positive/negative split is expected under La Niña conditions, the record-setting magnitudes are surprising under an average La Niña in terms of the magnitude of the Niño 3.4 SST index (~ -0.8). Perhaps the length of the La Niña (over two years) is a factor.
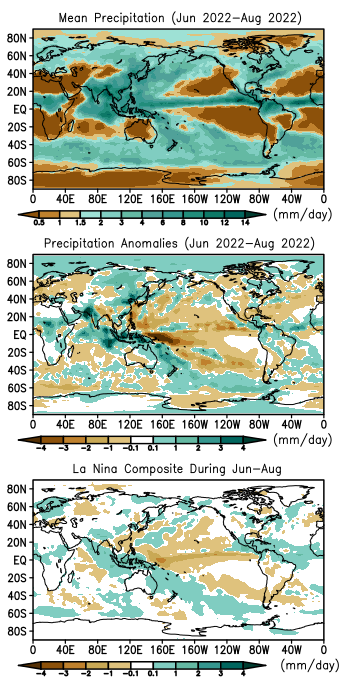
For this year's June through August period, the seasonal map (top panel) shows the planet's mean precipitation features for this time of year, while the middle panel displays the field of anomalies to compare to the long-term La Niña composite for the period in the bottom panel. Across the tropical Pacific through the Maritime Continent and into the Indian Ocean there is positive correlation between the two anomaly fields, indicating a contribution of La Niña to the seasonal variations, especially in the western Pacific and the Maritime Continent, with possible extensions further out.In fact, the positive anomaly extending from the northern Indian Ocean southeastward through Australia and continuing across the South Pacific into the Straits of Magellan is evident in both the anomaly map for this year's June through August and the composite.
Besides these La Niña-related features, the three-month anomaly map (middle panel) shows the seasonal deficit across western Europe and Russia, the positive anomaly over central Africa and a well-defined positive anomaly over eastern Asia above about 30°N. Over North America, western Mexico and the southwest U.S. is dominated by this year's stronger-than-usual monsoon, with a dry area running south-to-north from eastern Mexico through the Midwest U.S. into Canada.
Drought
Drought Information based on global drought indicators is available at the Global Drought Information System.
August 2022 was another month of excessively hot temperatures across Europe. The August heat, combined with very hot temperatures for July and June, resulted in the warmest summer in the 1910-2022 record for the continent. The persistent excessive heat increased evaporative demand which, when combined with below-normal precipitation, made drought conditions worse from Spain to Germany and from the British Isles to the Balkans. Some short-term relief occurred in some eastern and northern parts of Europe, where August was near to wetter than normal. But dry conditions have persisted for the last 9 to 12 months in some drought indicators, especially in southern areas. Groundwater and soil moisture were depleted, rivers were low, and vegetation stressed across most of the continent. The European Combined Drought Indicator showed drought stretching from Spain to southern Scandinavia and from the British Isles to Ukraine.
Numerous impacts were summarized in media reports: Wildfires continued to rage across the continent. The drought dried up rivers, drained reservoirs, and created water shortages that prompted water restrictions. In Britain, the source of the River Thames has dried up further downstream than ever before. Germans and Poles faced a mass fish die-off in a river flowing between their countries. Europe's Hunger Stones became visible again; this historically has been a warning of famine when water levels are low enough to expose the rocks. French utility EDF had to significantly reduce the capacity utilization rate of its nuclear power plants due to reduced water availability for cooling. Plunging water levels on the Rhine River are making it harder to transport cargo, threatening factories which may have to reduce production or halt it completely. The Rhine's level at Emmerich, near the Dutch border, hit zero on the depth gauge in August. The drought reduced crop yields across the EU, and dried up pastures halted the production of traditional cheese in France (the salers variety in the central Auvergne region) due to no grass for cows, and threatened the production of other prized cheeses.
August was drier than normal in western, central, and southeastern parts of Asia, with the dryness accompanied by abnormally hot temperatures over the west, southwest, and southeast regions. The month was wetter than normal over parts of Southwest Asia, but that did little to alleviate dryness there that has built up over the last year and longer. Indicators such as the Standardized Precipitation Evaporation Index (SPEI) show drought from the last 1 to 12 months, and longer, over central to southwestern Asia and parts of the northeast and northwest. Groundwater and soil moisture were low in these areas and over southeastern areas from China to the Bay of Bengal. Satellite observations show stressed vegetation across central to southwest Asia. According to media reports, in August China issued its first national drought alert of the year as authorities battled forest fires and mobilized specialist teams to protect crops from scorching temperatures across the Yangtze river basin. Up to 66 rivers in 34 counties in the southwestern China region of Chongqing have gone dry, according to state broadcaster CCTV. Factories in China's southwest shut down after reservoirs used to generate hydropower ran low, adding to economic strains.
Some precipitation fell across parts of Africa in August, including areas of drought-stricken East Africa. But it was not enough to eliminate deficits that have built up over several years. Widespread drought is still indicated in East Africa on the SPEI and Standardized Precipitation Index (SPI), especially at the 3-month and longer time scales. Dryness was also indicated over northern and western parts of Africa, as well as Madagascar. August was warmer than normal across much of Africa, with the heat further exacerbating drought conditions. Soil moisture and groundwater were depleted, and satellite analysis indicates stressed vegetation. According to media reports, in Kenya, pastoralists were losing their herds as the Horn of Africa's worst drought in 40 years leaves pastures desiccated and cows with nothing to eat.
Much of Australia was wetter than normal in August, with temperatures near normal. But longer-term dry conditions persist, especially in the southwest starting at the 2-month time scale and extending to the north coast by the 6-month time scale. The Evaporative Stress Index (ESI) shows dry conditions across western Australia, especially at the 3-month time scale. Groundwater and soil moisture levels are low from the southwest to north central areas, and satellite observations show stressed vegetation in the southwest. The August rains improved streamflow, but the observations of dry soils and rainfall deficits since December 2021 in the north and southwest were confirmed by the Australian Bureau of Meteorology's Combined Drought Indicator analyses.
Some of the drought areas in South America received rainfall during August, but temperatures were warmer than normal across much of the continent. But longer-term precipitation deficits persist, especially beginning at the 2-month time scale over parts of Brazil to Bolivia and southward across parts of Argentina. The dryness is especially acute from the 3- to 6-month time scales, but extends beyond that time frame. The ESI indicates high evaporative stress from southeast Brazil to northern Argentina, with large areas of low soil moisture and groundwater levels, plus stressed vegetation in places. Drought in southern and eastern Brazil was confirmed on the Northeast Brazil Drought Monitor.
In North America, August was warmer than normal across western and northern portions of the continent as well as parts of central Mexico. Above-normal precipitation fell over Alaska and much of the contiguous U.S. and Mexico. August was drier than normal across the central Plains and Pacific Northwest in the U.S. and several parts of Canada. The SPEI shows dry conditions across much of the northeastern, central, and western U.S., much of Mexico, and parts of western Canada at the 2- to 12-month time scales and, for some areas, longer time scales. The ESI shows evaporative stress across many parts of the continent. Satellite observations indicated poor vegetative health across much of the western U.S. and Great Plains from northeastern Mexico to the southern Canadian Prairies, as well as parts of the U.S. Northeast. Groundwater and soil moisture were low from northeast Mexico to the U.S. central Plains, across much of the U.S. Southwest, in parts of the northeastern U.S., and over parts of Canada. The North American Drought Monitor product depicted drought over parts of southern Mexico, from central Mexico to much of the U.S. from the West Coast to the Mississippi River, and into the southern Canadian Prairies, as well as across parts of northwestern Canada and eastern North America. According to media reports, drought prompted major cities in Mexico to ration water. Drought and water supply shortages in northern Mexico led President Obrador to say that beer brewing in northern Mexico is at an end (Mexico is the world's largest exporter of beer).
References
- Adler, R., G. Gu, M. Sapiano, J. Wang, G. Huffman 2017. Global Precipitation: Means, Variations and Trends During the Satellite Era (1979-2014). Surveys in Geophysics 38: 679-699, doi:10.1007/s10712-017-9416-4
- Adler, R., M. Sapiano, G. Huffman, J. Wang, G. Gu, D. Bolvin, L. Chiu, U. Schneider, A. Becker, E. Nelkin, P. Xie, R. Ferraro, D. Shin, 2018. The Global Precipitation Climatology Project (GPCP) Monthly Analysis (New Version 2.3) and a Review of 2017 Global Precipitation. Atmosphere. 9(4), 138; doi:10.3390/atmos9040138
- Gu, G., and R. Adler, 2022. Observed Variability and Trends in Global Precipitation During 1979-2020. Climate Dynamics, doi:10.1007/s00382-022-06567-9
- Huang, B., Peter W. Thorne, et. al, 2017: Extended Reconstructed Sea Surface Temperature version 5 (ERSSTv5), Upgrades, validations, and intercomparisons. J. Climate, doi: 10.1175/JCLI-D-16-0836.1
- Huang, B., V.F. Banzon, E. Freeman, J. Lawrimore, W. Liu, T.C. Peterson, T.M. Smith, P.W. Thorne, S.D. Woodruff, and H-M. Zhang, 2016: Extended Reconstructed Sea Surface Temperature Version 4 (ERSST.v4). Part I: Upgrades and Intercomparisons. J. Climate, 28, 911-930, doi:10.1175/JCLI-D-14-00006.1.
- Menne, M. J., C. N. Williams, B.E. Gleason, J. J Rennie, and J. H. Lawrimore, 2018: The Global Historical Climatology Network Monthly Temperature Dataset, Version 4. J. Climate, in press. https://doi.org/10.1175/JCLI-D-18-0094.1.
- Peterson, T.C. and R.S. Vose, 1997: An Overview of the Global Historical Climatology Network Database. Bull. Amer. Meteorol. Soc., 78, 2837-2849.
- Vose, R., B. Huang, X. Yin, D. Arndt, D. R. Easterling, J. H. Lawrimore, M. J. Menne, A. Sanchez-Lugo, and H. M. Zhang, 2021. Implementing Full Spatial Coverage in NOAA's Global Temperature Analysis. Geophysical Research Letters 48(10), e2020GL090873; doi:10.1029/2020gl090873.