
Temperature
In the atmosphere, 500-millibar height pressure anomalies correlate well with temperatures at the Earth's surface. The average position of the upper-level ridges of high pressure and troughs of low pressure—depicted by positive and negative 500-millibar height anomalies on the December 2021 map, is generally reflected by areas of positive and negative temperature anomalies at the surface, respectively.
Monthly Temperature: December 2021
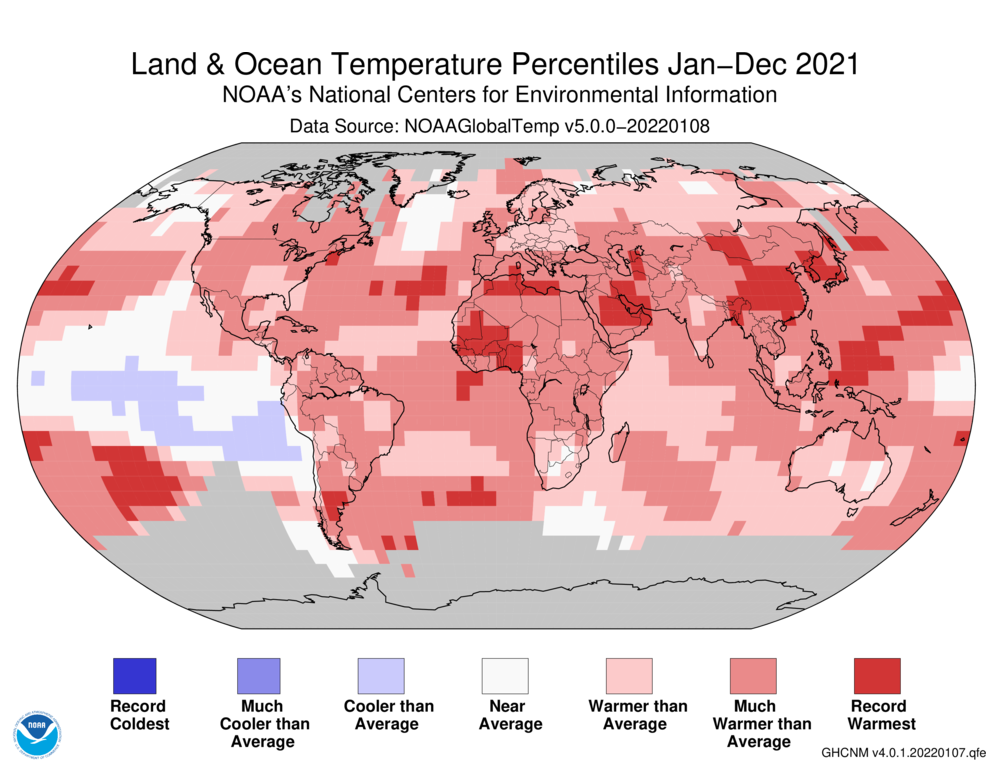
Temperature anomalies and percentiles are shown on the gridded maps below. The anomaly map on the left is a product of a merged land surface temperature (Global Historical Climatology Network, GHCN) and sea surface temperature (ERSST version 5) anomaly analysis. Temperature anomalies for land and ocean are analyzed separately and then merged to form the global analysis. For more information, please visit NCEI's Global Surface Temperature Anomalies page. The percentile map on the right provides additional information by placing the temperature anomaly observed for a specific place and time period into historical perspective, showing how the most current month, season or year compares with the past.
The December 2021 global surface temperature tied with 2016 as the fifth highest in the 142-year record at 0.83°C (1.49°F) above the 20th century average. Eight of the 10 warmest Decembers have occurred since 2014. December 2021 also marked the 37th consecutive December and the 444th consecutive month with temperatures, at least nominally, above the 20th century average.

During the month of December, the most notable warm temperature departures were present across much of the contiguous U.S. and across parts of eastern Canada, northern Mexico, and southern Asia, where temperatures were at least 2.5°C (4.5°F) above average. Record-warm December temperatures were present across a large area of the southwestern Pacific Ocean and small areas across North America, South America, Africa, Asia, and the Atlantic Ocean. Meanwhile, the most notable cool temperatures were observed across the western half of Canada and across parts of Scandinavia and northern Russia. However, no land or ocean areas had a record-cold December temperature.
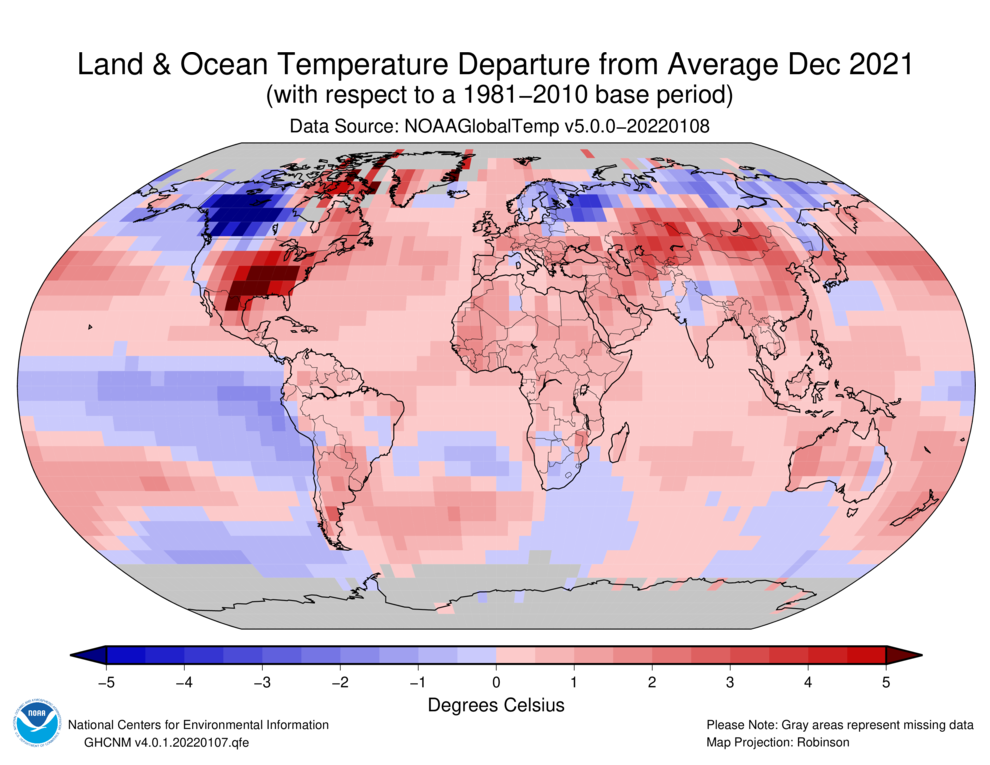

Regionally, South America's temperature departure of 1.17°C (2.11°F) was its third highest December temperature on record. Only the Decembers of 2013 (second) and 2015 (warmest) were warmer. The continents of Africa and Oceania had a December temperature that ranked among the eight warmest on record. Although North America and Europe's December temperature were above average, it was their coldest December since 2016.
According to the World Meteorological Organization, Sweden had its coldest December night in 35 years when temperatures dropped to -43.8°C (-46.8°F) in the early morning hours of December 6 in northern Lapland. Compared to all months, this was Sweden's night since February 2001, when temperatures dropped to -44.0°C (-47.2°F) in Dalarna.
Australia's December temperature departure of +1.04°C (+1.87°F) tied with another year as the ninth highest for December in the nation's 112-year temperature record. Regionally, Western Australia had its third warmest December on record at 1.69°C (3.04°F) above average, while the Northern Territory had its fourth warmest December on record. According to the Bureau of Meteorology, a severe to extreme heat wave at the end of the month impacted parts of the west coast of Western Australia, with several locations observing their highest December temperature on record. Of note, Perth saw four consecutive days with temperatures reaching 40.0°C (104.0°F) — the first time to occur in December.
| December | Anomaly | Rank (out of 142 years) | Records | ||||
|---|---|---|---|---|---|---|---|
| °C | °F | Year(s) | °C | °F | |||
| Global | |||||||
| Land | +1.38 ± 0.17 | +2.48 ± 0.31 | Warmest | 6th | 2015 | +1.97 | +3.55 |
| Coolest | 137th | 1917, 1929 | -1.30 | -2.34 | |||
| Ocean | +0.62 ± 0.15 | +1.12 ± 0.27 | Warmest | 6th | 2015 | +0.84 | +1.51 |
| Coolest | 137th | 1910 | -0.49 | -0.88 | |||
| Ties: 2017 | |||||||
| Land and Ocean | +0.83 ± 0.14 | +1.49 ± 0.25 | Warmest | 5th | 2015 | +1.15 | +2.07 |
| Coolest | 138th | 1916 | -0.63 | -1.13 | |||
| Ties: 2016 | |||||||
| Northern Hemisphere | |||||||
| Land | +1.54 ± 0.21 | +2.77 ± 0.38 | Warmest | 9th | 2015 | +2.20 | +3.96 |
| Coolest | 134th | 1917, 1929 | -1.61 | -2.90 | |||
| Ocean | +0.79 ± 0.15 | +1.42 ± 0.27 | Warmest | 6th | 2015 | +1.00 | +1.80 |
| Coolest | 137th | 1904 | -0.54 | -0.97 | |||
| Land and Ocean | +1.07 ± 0.15 | +1.93 ± 0.27 | Warmest | 6th | 2015 | +1.46 | +2.63 |
| Coolest | 137th | 1916 | -0.79 | -1.42 | |||
| Ties: 2014 | |||||||
| Southern Hemisphere | |||||||
| Land | +0.98 ± 0.12 | +1.76 ± 0.22 | Warmest | 6th | 2019 | +1.46 | +2.63 |
| Coolest | 137th | 1916 | -0.69 | -1.24 | |||
| Ocean | +0.50 ± 0.16 | +0.90 ± 0.29 | Warmest | 8th | 2015 | +0.73 | +1.31 |
| Coolest | 135th | 1909, 1910 | -0.49 | -0.88 | |||
| Ties: 2001, 2002 | |||||||
| Land and Ocean | +0.58 ± 0.15 | +1.04 ± 0.27 | Warmest | 7th | 2015 | +0.84 | +1.51 |
| Coolest | 136th | 1909 | -0.52 | -0.94 | |||
| Arctic | |||||||
| Land and Ocean | +0.62 ± 0.19 | +1.12 ± 0.34 | Warmest | 50th | 2017 | +3.33 | +5.99 |
| Coolest | 93rd | 1916 | -2.88 | -5.18 | |||

The most current data can be accessed via the Global Surface Temperature Anomalies page.
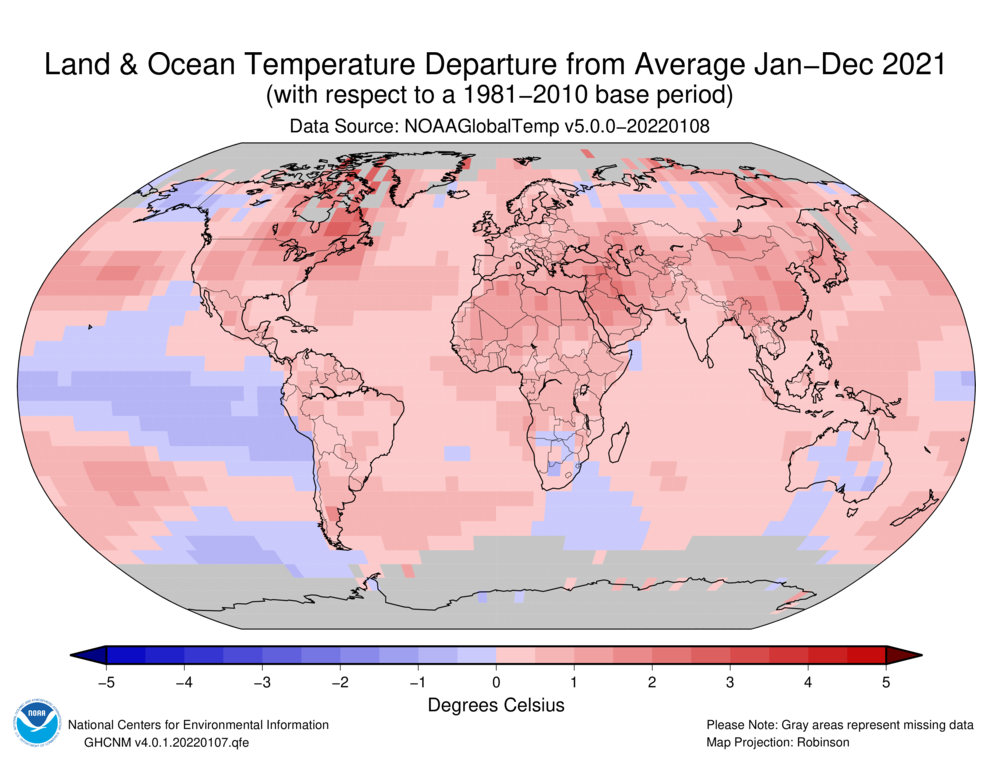
Year-to-date Temperature: January–December 2021
Please see the NCEI State of the Climate Annual Global Analysis report for additional information.

| January–December | Anomaly | Rank (out of 142 years) | Records | ||||
|---|---|---|---|---|---|---|---|
| °C | °F | Year(s) | °C | °F | |||
| Global | |||||||
| Land | +1.35 ± 0.14 | +2.43 ± 0.25 | Warmest | 6th | 2020 | +1.58 | +2.84 |
| Coolest | 137th | 1884 | -0.69 | -1.24 | |||
| Ocean | +0.65 ± 0.16 | +1.17 ± 0.29 | Warmest | 7th | 2016 | +0.80 | +1.44 |
| Coolest | 136th | 1904 | -0.46 | -0.83 | |||
| Land and Ocean | +0.84 ± 0.15 | +1.51 ± 0.27 | Warmest | 6th | 2016 | +0.99 | +1.78 |
| Coolest | 137th | 1904 | -0.45 | -0.81 | |||
| Northern Hemisphere | |||||||
| Land | +1.54 ± 0.16 | +2.77 ± 0.29 | Warmest | 3rd | 2020 | +1.74 | +3.13 |
| Coolest | 140th | 1884 | -0.79 | -1.42 | |||
| Ocean | +0.81 ± 0.16 | +1.46 ± 0.29 | Warmest | 7th | 2020 | +0.99 | +1.78 |
| Coolest | 136th | 1904 | -0.52 | -0.94 | |||
| Land and Ocean | +1.09 ± 0.15 | +1.96 ± 0.27 | Warmest | 6th | 2020 | +1.27 | +2.29 |
| Coolest | 137th | 1907 | -0.49 | -0.88 | |||
| Southern Hemisphere | |||||||
| Land | +0.86 ± 0.11 | +1.55 ± 0.20 | Warmest | 12th | 2019 | +1.29 | +2.32 |
| Coolest | 131st | 1917 | -0.73 | -1.31 | |||
| Ocean | +0.54 ± 0.16 | +0.97 ± 0.29 | Warmest | 7th | 2016 | +0.70 | +1.26 |
| Coolest | 136th | 1909, 1911 | -0.43 | -0.77 | |||
| Ties: 1998 | |||||||
| Land and Ocean | +0.59 ± 0.15 | +1.06 ± 0.27 | Warmest | 9th | 2016 | +0.77 | +1.39 |
| Coolest | 134th | 1911 | -0.43 | -0.77 | |||
| Arctic | |||||||
| Land and Ocean | +1.26 ± 0.09 | +2.27 ± 0.16 | Warmest | 14th | 2016 | +2.35 | +4.23 |
| Coolest | 129th | 1902 | -1.43 | -2.57 | |||


Precipitation
December Precipitation
The maps shown below represent anomalies (left, using a base period of 1961–1990) and percent of normal (right, using the same base period) based on the GHCN dataset of land surface stations. As is typical, precipitation anomalies during December 2021 varied significantly around the world.

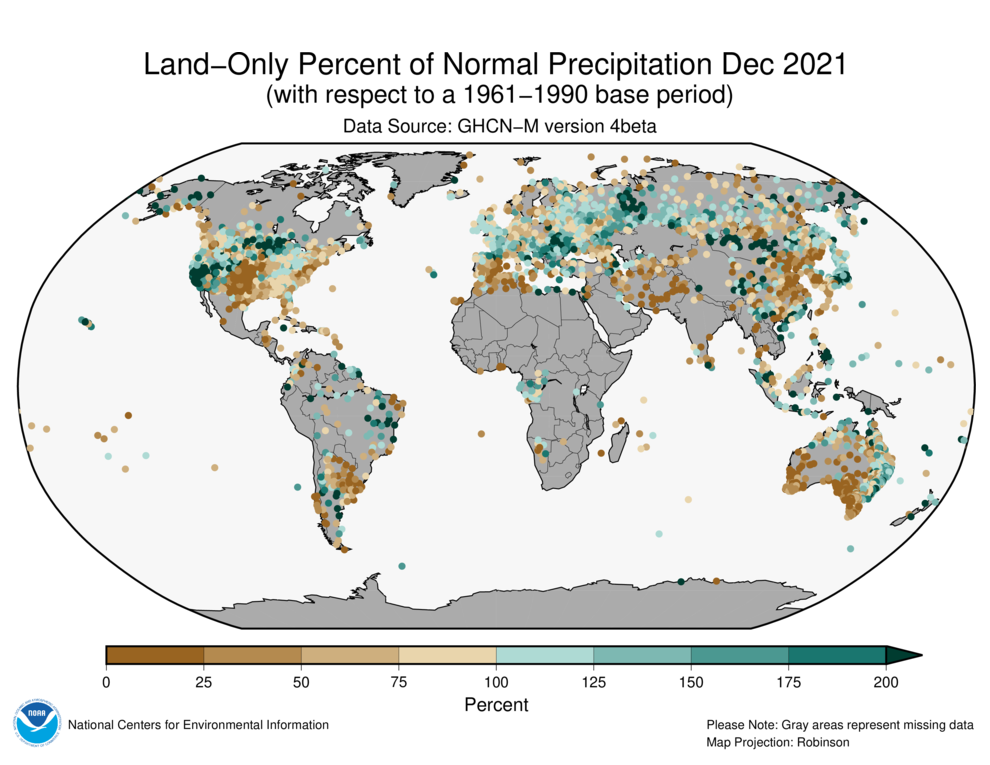
Significantly below-average precipitation occurred across parts of the northwestern, south-central and eastern contiguous U.S., Mexico, eastern Spain, southern Asia, and southwestern, central, and southern Australia. Significantly above-normal precipitation occurred across parts of Alaska, southwestern and north-central contiguous U.S., eastern Europe, parts of Russia, Mongolia, Japan, and central and southeastern China as well as parts of northeastern and eastern Australia.
In early December, severe storms affected parts of eastern Brazil. Heavy rains prompted the overflow of the Gabo Bravo and Jucurucu rivers that led to floods in the Bahia and Minas Gerais states, which resulted damaged homes, roads, and bridges. According to reports, over 15,000 people were affected by the floods.
In mid-December, heavy rain fell across parts of Malaysia. In just 24-hours some locations received between 300 to 400 mm (11.8 to 15.7 inches), leading to dangerous floods. According to reports, the worst-hit state was Selangor, with over 18,000 people affected.
During December 2021, parts of northern and eastern Australia had a wetter-than-average December, while parts of central and southern Australia had drier-than-average conditions during the month. Tasmania had the highest precipitation deficit at 67% below average, which was Tasmania's driest December since 1994 and the sixth driest since national precipitation records began in 1900. Averaged as a whole, December had near-average December precipitation total.
Cyclone Rai was a strong and destructive typhoon that made landfall across southern Philippines on December 16. The typhoon brought strong winds and torrential rainfall and wreaked havoc across the region. According to preliminary reports, close to 400 people died and over 1,000 were injured due to the storm. After crossing the Philippines, Rai continued to move westward towards the South China Sea. Once Rai is on warm ocean water again, it re-itensified to an equivalent Category 5, becoming the first super typhoon in the South China Sea in the month of December since 1961 (Source: Hong Kong Observatory).
Global Precipitation Climatology Project (GPCP)
The following analysis is based upon the Global Precipitation Climatology Project (GPCP) Interim Climate Data Record. It is provided courtesy of the GPCP Principal Investigator team at the University of Maryland.
The Global Precipitation Climatology Project (GPCP) monthly data set is a long-term (1979-present) analysis (Adler et al., 2018) using a combination of satellite and gauge information. An interim GPCP analysis completed within ~10 days of the end of the month allows its use in climate monitoring.

The global mean rainfall map for December 2021 (Fig. 1, top panel) displays the usual features of this season, with an ITCZ hovering just north of the equator across the Atlantic and Pacific Oceans and active storm tracks further north across the mid-latitudes of the oceans of the Northern Hemisphere and into the continents to their east. These precipitation maxima are significantly stronger than the corresponding Southern Hemisphere mid/high latitude maxima. Over South Asia rainfall has abandoned the continent and moved south with the sun and moved into northern Australia. Over North America the continent is cut north to south down the middle by a dry slot with more precipitation to the east and west.
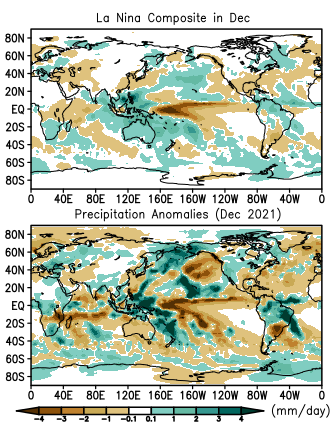
The anomaly map of precipitation for this December (Fig. 1, middle panel; with percentage anomalies in the bottom panel) has some features that are related to the on-going La Niña and others which definitely do not fit that model. A composite La Niña anomaly map was calculated using 14 Decembers (not including December 2021) when the Nino 3.4 SST index was in La Niña territory. That composite for December La Niña conditions (Fig. 2, top panel) is much smoother than the anomaly field for December 2021 (repeated here for easy comparison, Fig. 2, bottom panel).
A very good match between this month's anomalies and the La Niña composite (see Fig. 2) can be found in the deep tropics between the Maritime Continent, eastward along the Equator to South America and the tropical Atlantic. The heavier than normal rainfall this December over Malaysia, Indonesia, Philippine Islands and Vietnam fits very well with the La Niña composite model and was associated with numerous floods and landslides in those and surrounding regions during the month. Further east a very intense and elongated dry zone extending along the Equator from about 160°E to the South America coast (with a southeast extension into the South Pacific) appears in both fields. Even further east the positive anomaly for this month over northern South America matches the composite as does an extension of that feature across the Atlantic at the Equator as part of the ITCZ. Floods in Bahia state in eastern Brazil were associated with this La Niña feature. In the southeast part of South America, the dry anomaly for this December also matches with the composite.
Typically, La Niña is relatively wet over Australia as is evident in the composite; but in this particular month almost the whole country has negative rainfall anomalies, as the positive anomalies are restricted to the far north and off the east coast. The situation over Africa is mixed, although the southern tip has a positive anomaly (as does the composite), with a dry area to the north along the east coast. Over North America, the December 2021 anomalies have generally dry conditions to the east of the Rocky Mountains to the east coast of the U.S., somewhat like the La Niña composite. However, to the west, and stretching to the northeast into Canada, there is a surplus of precipitation associated with some flooding and heavy mountain snow in the Cascade and Rocky Mountains, helping to partially alleviate the long-term drought in those areas. This pattern somewhat fits the La Niña composite pattern, but was more intense. The December snow in the central Rockies did not extend to the east slope around Denver, where the dry conditions and a chinook windstorm resulted in a devastating wildfire destroying many houses near Boulder, CO.
Over the North Pacific Ocean intense anomaly features are present, including above normal rainfall in the central zone, including Hawaii, which was affected by a Kona storm producing flooding in the early part of the month. To the northeast of there a large, intense negative anomaly indicates a displacement of the usual storm track to the north and south. Above average precipitation over eastern Siberia, across the Bering Strait and into Alaska is noted, the latter also having some record high temperatures.
The dry zone across the southeast U.S. extends into the northern Atlantic, dominating that ocean region and even further extending into northern Europe, somewhat like the La Niña composite. A wetter than normal zone exists from southern Europe northeastward through eastern Europe into Asia, again looking similar to the composite.
Background discussion of long-term means, variations and trends of global precipitation can be found in Adler et al. (2017).
Ocean Heat Content
Ocean Heat Content (OHC) is essential for understanding and modeling global climate since > 90% of excess heat in the Earth's system is absorbed by the ocean. Further, expansion due to increased ocean heat contributes to sea level rise. Change in OHC is calculated from the difference of observed temperature profiles from the long-term mean.
| Basin | 0-700 meters | Rank (1955-2023) | |||||
|---|---|---|---|---|---|---|
| Entire Basin | Northern Hemisphere | Southern Hemisphere | ||||
| Atlantic | 8.979 | 1st | 4.938 | 3rd | 4.041 | 1st |
| Indian | 3.875 | 11th | 0.811 | 4th | 3.064 | 13th |
| Pacific | 6.807 | 3rd | 3.313 | 3rd | 3.495 | 4th |
| World | 19.662 | 3rd | 9.062 | 2nd | 10.600 | 3rd |
| Source: Basin time series of heat content | ||||||

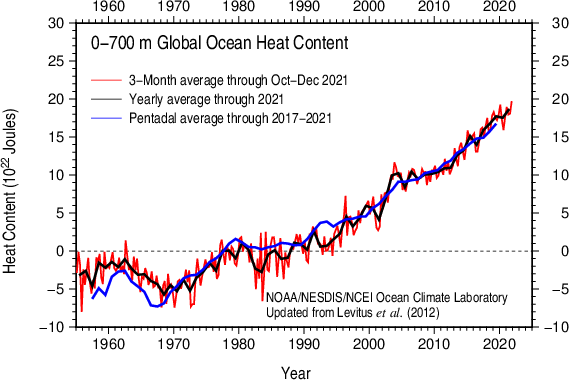
Global OHC for October–December 2021 is the highest October–December OHC in our records, which extend back to 1955. In fact, 2021 was the warmest year on record for the World Ocean. Overall, the latest quarterly OHC reveals widespread warmer than normal conditions relative to the 1955–2006 mean, a situation observed since the end of 2016. After the relative lows observed around mid-2020, global OHC remains at record high levels, which coincides with the weakening since late 2020 of the 2020–2021 La Niña event. A notable difference from the OHC features observed in July–September 2021 is the formation of cool conditions, < -10x105 J/m3, extending westward from South America to about 165W in the Equatorial Pacific Ocean. Otherwise, OHC conditions are similar to those described for the previous quarter. Much higher, > 30x105 J/m3, than normal OHC conditions continue to exist in the Gulf Stream/North Atlantic Current, the South Atlantic Ocean, the Kuroshio Current/Kuroshio Extension/North Pacific Current, and along the Antarctic Circumpolar Current in the Indian Ocean and Southwestern Pacific Ocean sectors. Cool conditions, < -10x105 J/m3, persist in the subpolar North Atlantic Ocean south of Greenland and Iceland and in the southern Norwegian Sea. Higher, > 10x105 J/m3, than normal OHC conditions continue to dominate most of the Eastern Indian Ocean, the Indonesian Throughflow, the central and western tropical South Pacific Ocean, and the South China Sea.
References
- Adler, R., G. Gu, M. Sapiano, J. Wang, G. Huffman 2017. Global Precipitation: Means, Variations and Trends During the Satellite Era (1979-2014). Surveys in Geophysics 38: 679-699, doi:10.1007/s10712-017-9416-4
- Adler, R., M. Sapiano, G. Huffman, J. Wang, G. Gu, D. Bolvin, L. Chiu, U. Schneider, A. Becker, E. Nelkin, P. Xie, R. Ferraro, D. Shin, 2018. The Global Precipitation Climatology Project (GPCP) Monthly Analysis (New Version 2.3) and a Review of 2017 Global Precipitation. Atmosphere. 9(4), 138; doi:10.3390/atmos9040138
- Gu, G., and R. Adler, 2022. Observed Variability and Trends in Global Precipitation During 1979-2020. Climate Dynamics, doi:10.1007/s00382-022-06567-9
- Huang, B., Peter W. Thorne, et. al, 2017: Extended Reconstructed Sea Surface Temperature version 5 (ERSSTv5), Upgrades, validations, and intercomparisons. J. Climate, doi: 10.1175/JCLI-D-16-0836.1
- Huang, B., V.F. Banzon, E. Freeman, J. Lawrimore, W. Liu, T.C. Peterson, T.M. Smith, P.W. Thorne, S.D. Woodruff, and H-M. Zhang, 2016: Extended Reconstructed Sea Surface Temperature Version 4 (ERSST.v4). Part I: Upgrades and Intercomparisons. J. Climate, 28, 911-930, doi:10.1175/JCLI-D-14-00006.1.
- Menne, M. J., C. N. Williams, B.E. Gleason, J. J Rennie, and J. H. Lawrimore, 2018: The Global Historical Climatology Network Monthly Temperature Dataset, Version 4. J. Climate, in press. https://doi.org/10.1175/JCLI-D-18-0094.1.
- Peterson, T.C. and R.S. Vose, 1997: An Overview of the Global Historical Climatology Network Database. Bull. Amer. Meteorol. Soc., 78, 2837-2849.
- Vose, R., B. Huang, X. Yin, D. Arndt, D. R. Easterling, J. H. Lawrimore, M. J. Menne, A. Sanchez-Lugo, and H. M. Zhang, 2021. Implementing Full Spatial Coverage in NOAA's Global Temperature Analysis. Geophysical Research Letters 48(10), e2020GL090873; doi:10.1029/2020gl090873.