Introduction
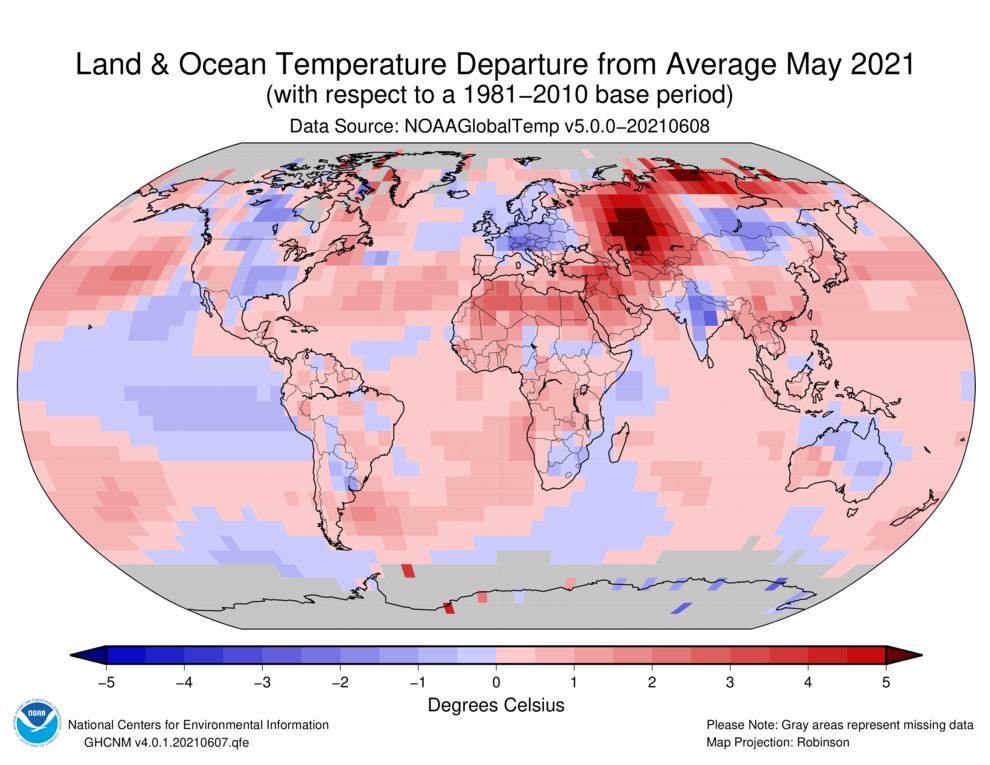
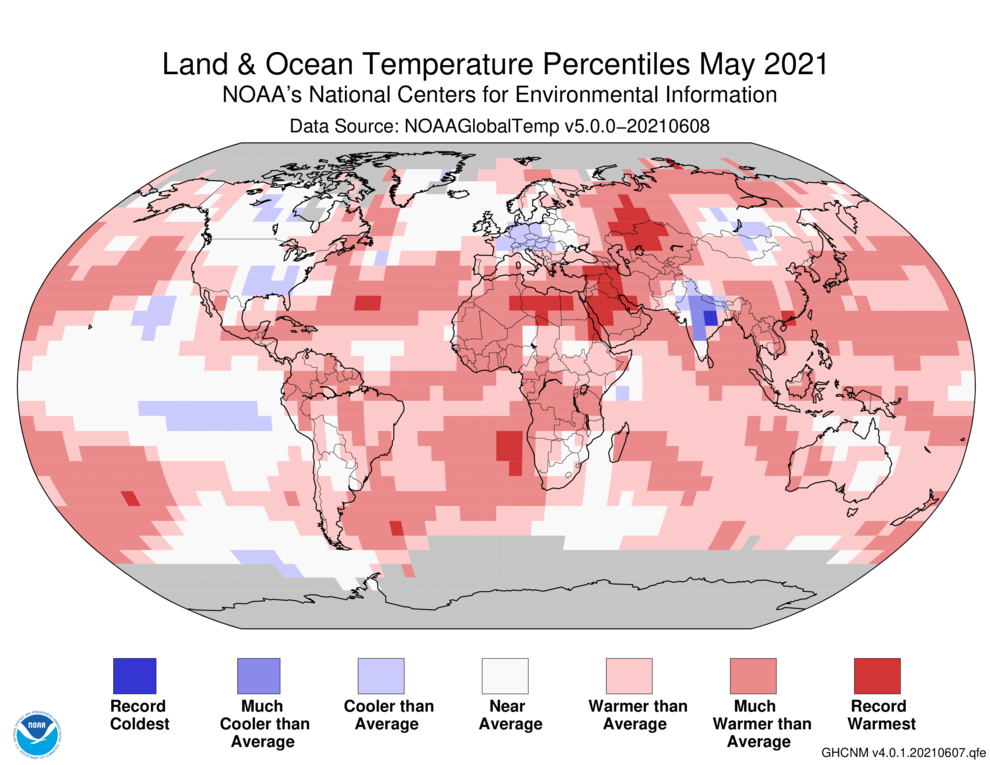
Temperature anomalies and percentiles are shown on the gridded maps below. The anomaly map on the left is a product of a merged land surface temperature (Global Historical Climatology Network, GHCN) and sea surface temperature (ERSST version 5) anomaly analysis. Temperature anomalies for land and ocean are analyzed separately and then merged to form the global analysis. For more information, please visit NCEI's Global Surface Temperature Anomalies page. The percentile map on the right provides additional information by placing the temperature anomaly observed for a specific place and time period into historical perspective, showing how the most current month, season or year compares with the past.
Temperature
In the atmosphere, 500-millibar height pressure anomalies correlate well with temperatures at the Earth's surface. The average position of the upper-level ridges of high pressure and troughs of low pressure—depicted by positive and negative 500-millibar height anomalies on the May 2021 and March–May 2021 maps—is generally reflected by areas of positive and negative temperature anomalies at the surface, respectively.
Monthly Temperature: May 2021
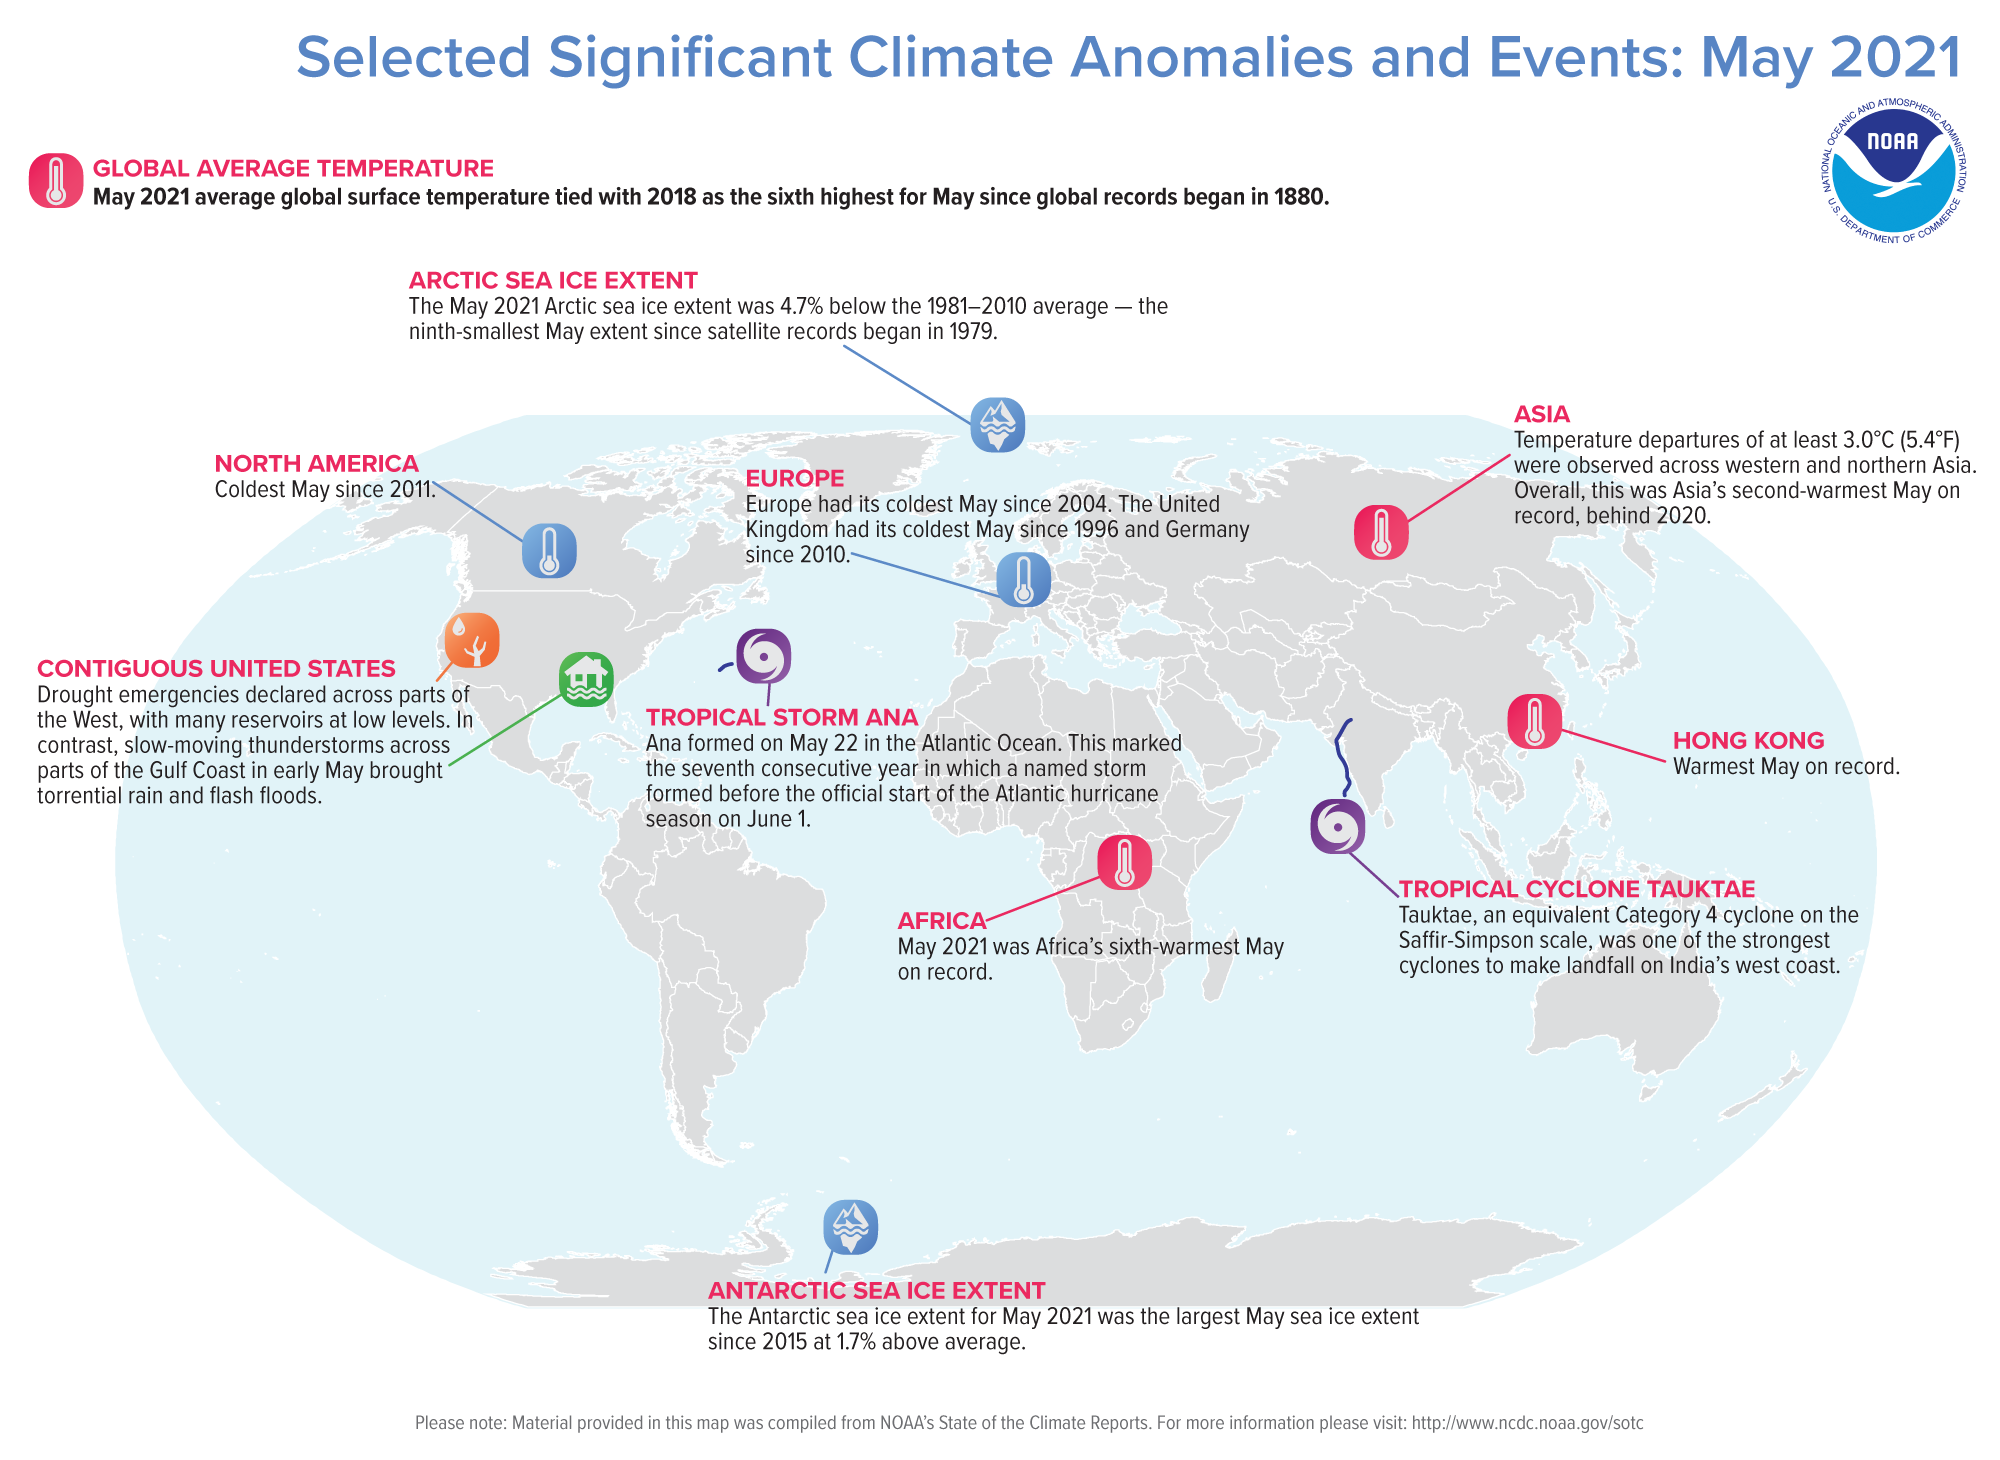
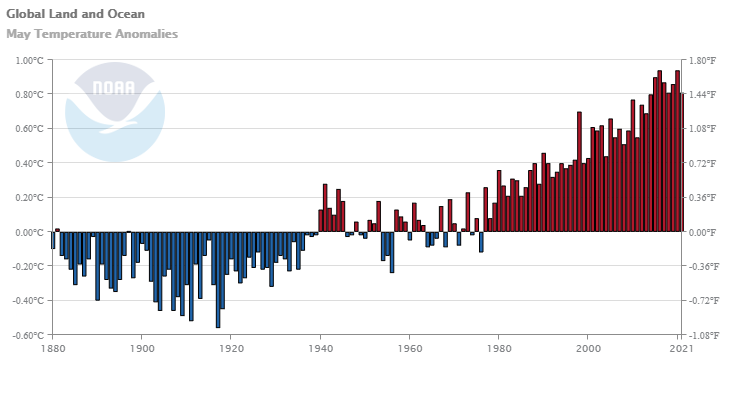
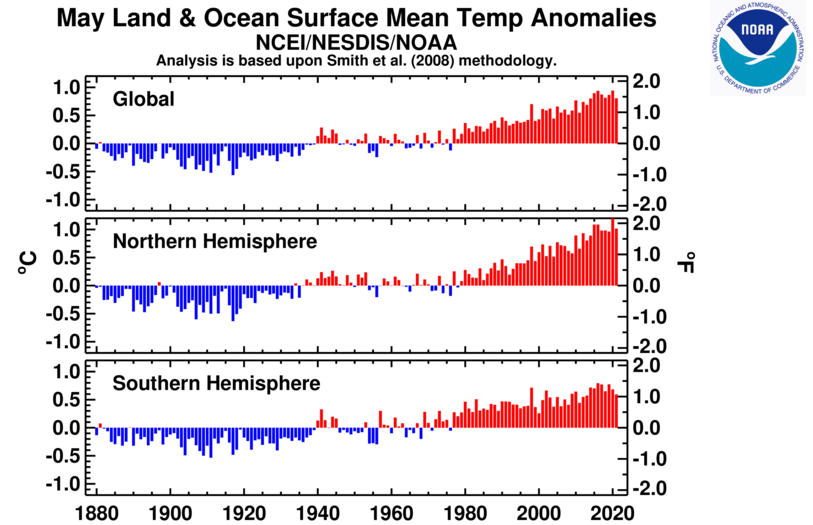
The May 2021 global surface temperature was 0.81°C (1.46°F) above the 20th century average of 14.8°C (58.6°F). This value tied with 2018 as the sixth warmest May in the 142-year record. May 2021 was also the 45th consecutive May and the 437th consecutive month with temperatures, at least nominally, above the 20th century average.
According to the May 2021 temperature percentile map, the month of May was characterized by much-warmer-than-average temperatures across parts of northern, western, and southeastern Asia, Africa, northern South America and across parts of the Pacific, Atlantic, and the Indian oceans. The most notable warm temperature departures from average were observed across parts of western and northern Asia and northern Africa, where temperatures were at least 2.5°C (4.5°F) above average. Record-warm May temperatures were observed across parts of northern Africa, western Asia, and small areas across the Atlantic Ocean and the South Pacific Ocean. This encompassed only 3.0% of the world's surface with a record-warm May temperature—the tenth highest May percentage for record-warm May temperatures since records began in 1951.
Cooler-than-average May temperatures were observed across parts of North America, the eastern Pacific Ocean, central Europe, and central Asia and India. There was a small area in eastern India that had a record-cold May temperature, encompassing only 0.1% of the world surface with a record-cold May temperature. The European temperature for May 2021 was 0.41°C (0.74°F) above average and was the coolest May since 2004. Several central European countries had their coolest May in at least 10 years. Of note, Germany had its coldest May since 2010, with a temperature that was 2.4°C (4.3°F) below the 1991–2020 period. The United Kingdom's national temperature was 1.3°C (2.3°F) below the 1981–2010 average and was the coldest for May since 1996. North America also had a temperature departure for May that was above average; however, it was also the coolest May since 2011.
Asia, as a whole, had a May temperature that was 1.91°C (3.44°F) above average, resulting in Asia's second highest temperature departure for May on record. This value was 0.21°C (0.38°F) shy of tying the record warm May set in 2020. In China, Hong Kong had its warmest May on record, with a mean temperature departure of 2.7°C (4.9°F) above average. According to the Hong Kong Observatory, Hong Kong had a total of 14 hot nights [daily minimum temperature ≥ 28.0°C (82.4°F)]—the most number of hot nights in May on record. Meanwhile, Africa and the Caribbean region had their sixth and ninth warmest May on record, respectively.
| May | Anomaly | Rank (out of 142 years) | Records | ||||
|---|---|---|---|---|---|---|---|
| °C | °F | Year(s) | °C | °F | |||
| Global | |||||||
| Land | +1.27 ± 0.11 | +2.29 ± 0.20 | Warmest | 6th | 2020 | +1.38 | +2.48 |
| Coolest | 137th | 1917 | -0.92 | -1.66 | |||
| Ocean | +0.63 ± 0.14 | +1.13 ± 0.25 | Warmest | 8th | 2016 | +0.80 | +1.44 |
| Coolest | 135th | 1911 | -0.54 | -0.97 | |||
| Land and Ocean | +0.81 ± 0.13 | +1.46 ± 0.23 | Warmest | 6th | 2016, 2020 | +0.94 | +1.69 |
| Coolest | 137th | 1917 | -0.56 | -1.01 | |||
| Ties: 2018 | |||||||
| Northern Hemisphere | |||||||
| Land | +1.47 ± 0.11 | +2.65 ± 0.20 | Warmest | 3rd | 2020 | +1.61 | +2.90 |
| Coolest | 140th | 1907 | -0.98 | -1.76 | |||
| Ocean | +0.74 ± 0.14 | +1.33 ± 0.25 | Warmest | 7th | 2020 | +0.95 | +1.71 |
| Coolest | 136th | 1911 | -0.55 | -0.99 | |||
| Land and Ocean | +1.02 ± 0.13 | +1.84 ± 0.23 | Warmest | 4th | 2020 | +1.20 | +2.16 |
| Coolest | 139th | 1917 | -0.63 | -1.13 | |||
| Southern Hemisphere | |||||||
| Land | +0.78 ± 0.11 | +1.40 ± 0.20 | Warmest | 16th | 2019 | +1.28 | +2.30 |
| Coolest | 127th | 1917 | -1.27 | -2.29 | |||
| Ties: 2009 | |||||||
| Ocean | +0.56 ± 0.15 | +1.01 ± 0.27 | Warmest | 11th | 2016 | +0.73 | +1.31 |
| Coolest | 132nd | 1911 | -0.53 | -0.95 | |||
| Land and Ocean | +0.59 ± 0.14 | +1.06 ± 0.25 | Warmest | 12th | 2016 | +0.79 | +1.42 |
| Coolest | 131st | 1911 | -0.53 | -0.95 | |||
| Arctic | |||||||
| Land and Ocean | +1.79 ± 0.09 | +3.22 ± 0.16 | Warmest | 6th | 2016 | +2.16 | +3.89 |
| Coolest | 137th | 1890 | -1.99 | -3.58 | |||

The most current data can be accessed via the Global Surface Temperature Anomalies page.
Seasonal Temperature: March–May 2021
The three-month period of March–May 2021 was the eighth highest in the 142-year record for the globe at 0.82°C (1.48°F) above average. The March–May period is defined as the Northern Hemisphere's meteorological spring and the Southern Hemisphere's meteorological autumn. For the Northern Hemisphere, as a whole, the March–May period was the sixth warmest such period on record with a temperature departure of +1.06°C (+1.91°F). Meanwhile, the Southern Hemisphere had the 11th warmest autumn on record. Although the Southern Hemisphere had an above-average autumn temperature, it was the coolest autumn since 2013.

During March–May 2021, much-warmer-than-average temperatures were observed across parts of North America, South America, Africa, Asia, and across the northern, western, and southern Pacific, Atlantic, and Indian oceans. Record-warm temperatures during the three-month period were limited to small areas across the Middle East, southeastern Asia, and the western Pacific Ocean. Meanwhile, according to the percentiles map, cooler-than-average seasonal temperatures were observed across parts of the North Atlantic Ocean, the eastern and central Pacific Ocean, central Europe, India, and southeastern Australia. However, no land or ocean areas had a record-cold seasonal temperature.

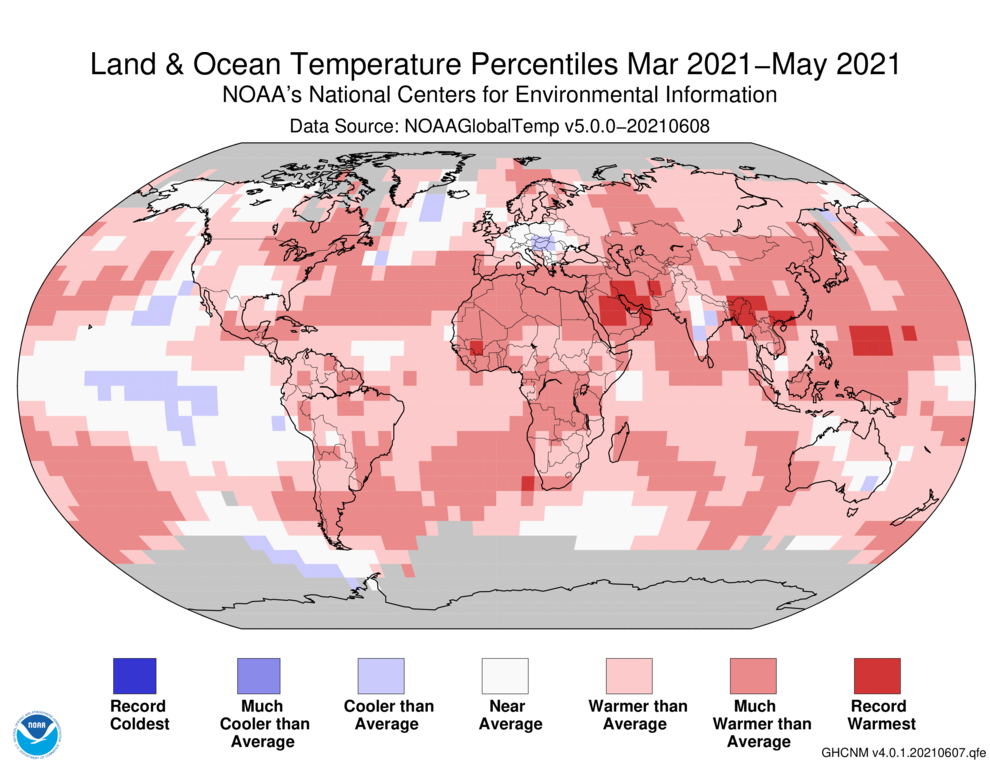
Regionally, Africa and Asia had their fifth and seventh warmest March–May period on record. In Asia, the Hong Kong Observatory reported that Hong Kong had its warmest March–May period on record. In Oceania, New Zealand had its 10th warmest autumn since national records began in 1909. According to NIWA, no region across New Zealand had below-average autumn temperatures.
In contrast, in Europe, Austria had its coldest spring temperature in 34 years. De Bilt, Netherlands had a spring temperature that was 1.8°C (3.2°F) below average and the coolest spring since 2013.
| March–May | Anomaly | Rank (out of 142 years) | Records | ||||
|---|---|---|---|---|---|---|---|
| °C | °F | Year(s) | °C | °F | |||
| Global | |||||||
| Land | +1.37 ± 0.12 | +2.47 ± 0.22 | Warmest | 8th | 2016 | +1.92 | +3.46 |
| Coolest | 135th | 1898 | -0.91 | -1.64 | |||
| Ocean | +0.61 ± 0.15 | +1.10 ± 0.27 | Warmest | 8th | 2016 | +0.82 | +1.48 |
| Coolest | 135th | 1911 | -0.52 | -0.94 | |||
| Land and Ocean | +0.82 ± 0.15 | +1.48 ± 0.27 | Warmest | 8th | 2016 | +1.12 | +2.02 |
| Coolest | 135th | 1911, 1917 | -0.55 | -0.99 | |||
| Northern Hemisphere | |||||||
| Land | +1.61 ± 0.15 | +2.90 ± 0.27 | Warmest | 5th | 2016 | +2.16 | +3.89 |
| Coolest | 138th | 1898 | -0.99 | -1.78 | |||
| Ocean | +0.72 ± 0.14 | +1.30 ± 0.25 | Warmest | 7th | 2020 | +0.95 | +1.71 |
| Coolest | 136th | 1904, 1911, 1917 | -0.49 | -0.88 | |||
| Land and Ocean | +1.06 ± 0.14 | +1.91 ± 0.25 | Warmest | 6th | 2016 | +1.38 | +2.48 |
| Coolest | 137th | 1917 | -0.61 | -1.10 | |||
| Southern Hemisphere | |||||||
| Land | +0.79 ± 0.12 | +1.42 ± 0.22 | Warmest | 14th | 2019 | +1.31 | +2.36 |
| Coolest | 129th | 1917 | -0.98 | -1.76 | |||
| Ties: 2003 | |||||||
| Ocean | +0.53 ± 0.16 | +0.95 ± 0.29 | Warmest | 11th | 2016 | +0.78 | +1.40 |
| Coolest | 132nd | 1911 | -0.53 | -0.95 | |||
| Land and Ocean | +0.57 ± 0.15 | +1.03 ± 0.27 | Warmest | 11th | 2016 | +0.86 | +1.55 |
| Coolest | 132nd | 1911 | -0.55 | -0.99 | |||
| Arctic | |||||||
| Land and Ocean | +1.52 ± 0.28 | +2.74 ± 0.50 | Warmest | 13th | 2019 | +2.93 | +5.27 |
| Coolest | 130th | 1902 | -2.45 | -4.41 | |||
| Ties: 2003 | |||||||


Year-to-date Temperature: January–May 2021
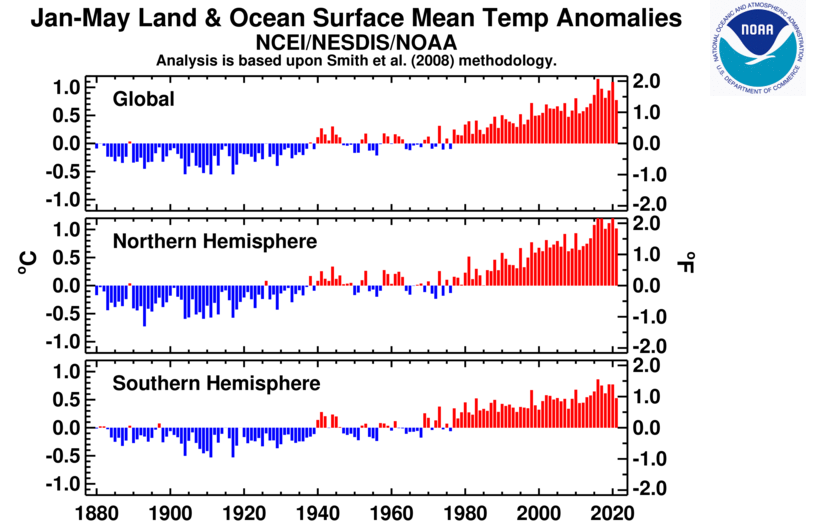
The January–May 2021 global surface temperature was also the eighth warmest such period on record, with a temperature departure of 0.77°C (1.39°F) above average. Although the year-to-date global surface temperature was above average, this was the smallest temperature departure for January–May since 2014. Looking ahead, the year 2021 is very likely to rank among the ten warmest years on record, with less than 2% chance to rank among the five warmest years on record, according to a statistical analysis done by NCEI scientists.

During the first five months of the year, much-warmer-than-average conditions were observed across parts of the northern and western Pacific Ocean, North America, South America, Africa, the southern half of Asia, as well as the Atlantic and Indian oceans. Record-warm temperature departures from average were present across parts of southern Asia and in small areas across southern South America, northern Africa, and the Pacific and Atlantic oceans. Meanwhile, cooler-than-average January–May temperatures were observed across the eastern and central tropical Pacific Ocean, the southern U.S., and a small area in the North Atlantic Ocean. However, no land or ocean areas has a record-cold January–May temperature.

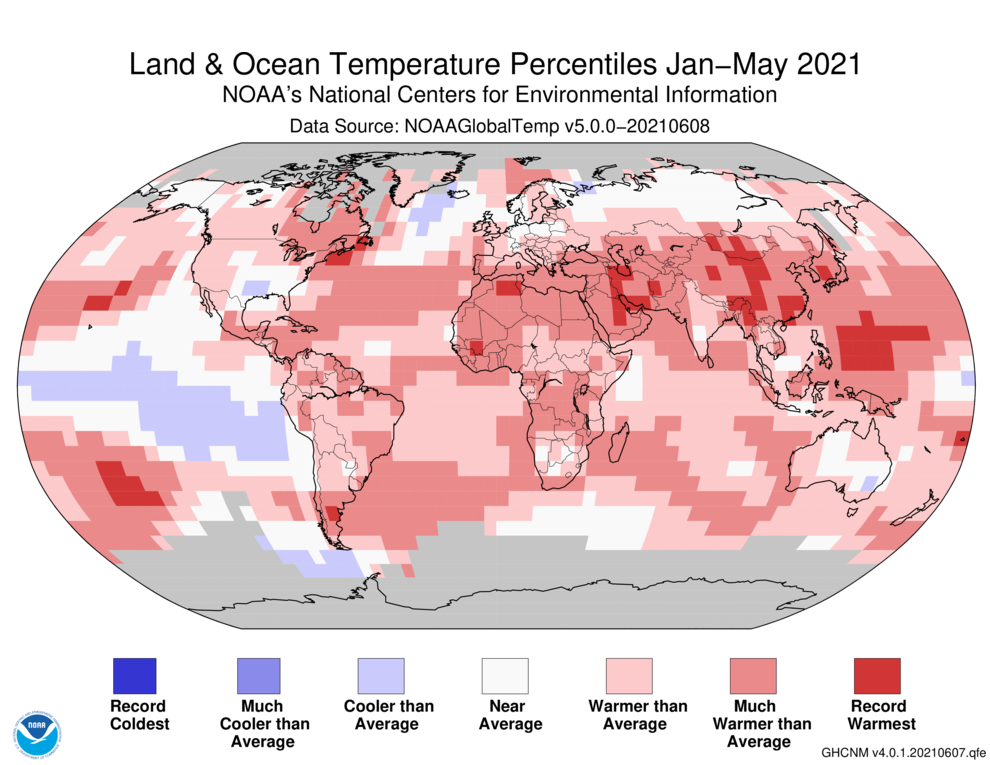
Regionally, Africa's year-to-date temperature was 1.28°C (2.30°F) above average and the third highest for the January–May period on record. Only January–May of 2010 and 2016 were warmer. Nine of the 10 warmest January–Mays on record for Africa have occurred since 2005, with 1998 among the 10 warmest. Asia and South America had their eighth and ninth warmest January–May period on record, respectively. The Caribbean region also had its eighth warmest year-to-date on record.
Oceania and Europe had an above-average year-to-date; however, the year-to-date values were the smallest for the January–May period since 2012 and 2013, respectively. The Hawaiian region also had an above-average January–May, which was the smallest temperature departure from average since 2013.
| January–May | Anomaly | Rank (out of 142 years) | Records | ||||
|---|---|---|---|---|---|---|---|
| °C | °F | Year(s) | °C | °F | |||
| Global | |||||||
| Land | +1.27 ± 0.16 | +2.29 ± 0.29 | Warmest | 8th | 2016 | +1.97 | +3.55 |
| Coolest | 135th | 1893 | -1.00 | -1.80 | |||
| Ties: 2010 | |||||||
| Ocean | +0.59 ± 0.17 | +1.06 ± 0.31 | Warmest | 8th | 2016 | +0.85 | +1.53 |
| Coolest | 135th | 1904, 1911 | -0.50 | -0.90 | |||
| Land and Ocean | +0.77 ± 0.17 | +1.39 ± 0.31 | Warmest | 8th | 2016 | +1.15 | +2.07 |
| Coolest | 135th | 1904, 1911, 1917 | -0.55 | -0.99 | |||
| Northern Hemisphere | |||||||
| Land | +1.50 ± 0.19 | +2.70 ± 0.34 | Warmest | 7th | 2016 | +2.22 | +4.00 |
| Coolest | 136th | 1893 | -1.17 | -2.11 | |||
| Ocean | +0.72 ± 0.16 | +1.30 ± 0.29 | Warmest | 6th | 2016 | +0.95 | +1.71 |
| Coolest | 137th | 1904 | -0.52 | -0.94 | |||
| Ties: 2015 | |||||||
| Land and Ocean | +1.02 ± 0.17 | +1.84 ± 0.31 | Warmest | 6th | 2016 | +1.43 | +2.57 |
| Coolest | 137th | 1893 | -0.73 | -1.31 | |||
| Southern Hemisphere | |||||||
| Land | +0.69 ± 0.14 | +1.24 ± 0.25 | Warmest | 17th | 2016 | +1.32 | +2.38 |
| Coolest | 126th | 1917 | -0.91 | -1.64 | |||
| Ocean | +0.50 ± 0.17 | +0.90 ± 0.31 | Warmest | 12th | 2016 | +0.78 | +1.40 |
| Coolest | 131st | 1911 | -0.52 | -0.94 | |||
| Land and Ocean | +0.53 ± 0.16 | +0.95 ± 0.29 | Warmest | 13th | 2016 | +0.86 | +1.55 |
| Coolest | 130th | 1911, 1917 | -0.53 | -0.95 | |||
| Ties: 2005 | |||||||
| Arctic | |||||||
| Land and Ocean | +1.12 ± 0.26 | +2.02 ± 0.47 | Warmest | 21st | 2016 | +3.10 | +5.58 |
| Coolest | 122nd | 1966 | -1.87 | -3.37 | |||

Precipitation
May Precipitation


The maps shown above represent precipitation percent of normal (left, using a base period of 1961–1990) and precipitation percentiles (right, using the period of record) based on the GHCN dataset of land surface stations. As is typical, precipitation anomalies during May 2021 varied significantly around the world. May 2021 precipitation was generally drier than normal across parts of the eastern coast and western contiguous U.S., central and southern South America, western and southern Europe, northern and western Asia, and the eastern half of Australia. Wetter-than-average conditions were present across parts of the southern contiguous U.S., Mexico, northern Argentina, Europe, central and eastern Asia, and western Australia.
May 2021 was particularly wet across parts of Sweden, with several locations having their wettest May on record. Of note, Stockholm had its third wettest May on record, behind 1794 and 1802. Similarly, most of the United Kingdom had a wetter-than-average May, resulting in the nation's fourth wettest May at 171% of normal since precipitation records began in 1862. Meanwhile, in contrast, Spain had a drier-than-average May, receiving only 57% of normal precipitation for the month. This was Spain's 12th driest May since national records began in 1961.
March–May Precipitation


During the three-month period of March–May, drier-than-average conditions were present across parts of the western and eastern coast of the contiguous U.S., the eastern Caribbean region, Brazil, southern South America, the southern coast of Europe, central Asia, as well as Russia's Far East, and the eastern half of Australia.
Wetter-than-average conditions were observed across parts of the south-central contiguous U.S., Mexico, northern Argentina, much of Europe, western Australia, and across eastern Asia.
Global Precipitation Climatology Project (GPCP)
The following analysis is based upon the Global Precipitation Climatology Project (GPCP) Interim Climate Data Record. It is provided courtesy of the GPCP Principal Investigator team at the University of Maryland.
The Global Precipitation Climatology Project (GPCP) monthly data set is a long-term (1979-present) analysis (Adler et al., 2018) using a combination of satellite and gauge information. An interim GPCP analysis completed within ~10 days of the end of the month allows its use in climate monitoring.


The transition month of May has precipitation features moving northward and with the El Niño/Southern Oscillation (ENSO) now officially "Neutral", the tropical rainfall anomaly features have lost their La Niña characteristics. Tropical cyclone season in the Northern Hemisphere also started in May in the Atlantic and eastern Pacific with minor storms, but in the Indian Ocean the typical seasonal (pre-monsoon) peak produced two storms with significant rain features in the monthly map.
The GPCP Monthly analysis (Fig. 1, top panel) shows the usual wavy, broken line across the tropics north of the Equator, with the largest rainfall values in the western Pacific, but also with an active tropical Atlantic. Toward the middle latitudes the maximum over eastern China and stretching to the northeast indicates an active Maiyu (or Baiu) front with associated springtime "plum rains". Another, weaker feature in mid-latitudes is the rainfall area extending from central America northward into the south-central U.S. The monthly anomaly chart (Fig. 1, bottom panel) emphasizes the features already described, especially the Maiyu rains and the Gulf Coast feature. The northward shift of the Maiyu frontal rain is evident by the distinct ENE–WSW orientations of both the positive and negative anomaly fields. The anomaly pattern across North America has the drought continuing in the west, especially the southwest U.S., but even dry conditions in much of the eastern part of the continent. In between positive rain anomalies centered in eastern Texas and Louisiana were associated with persistent rain and flooding.
The Indian Ocean also shows positive anomalies where two early-season tropical cyclones, Cyclone Tauktae in the Arabian Sea and Cyclone Yaas in the Bay of Bengal moved right along their respective coasts on the two sides of India with damage and some flooding in coastal regions. Flooding was also linked to the positive anomalies over east-central Africa, including Ethiopia and Sudan. In the eastern Pacific the ITCZ appears a little northward than normal with an east-west anomaly pattern, with a small positive anomaly just southwest of Mexico, partially related to Tropical Storm Andres, the record-setting earliest in the season storm (May 8) in the region. South America is dominated by dry anomalies, with drought continuing in many places.
The Atlantic ITCZ had above average rain for the month and that did extend into the northeast part of the continent and led to some flooding, especially in Guyana. A band of positive anomalies runs northeastward across the North Atlantic and continues into Europe. An early Tropical Storm Ana was a part of that feature.
The mean precipitation field and associated anomalies for the March–May period are shown in Fig. 2. The strongest anomaly features are in the western Pacific region and associated with the weakening La Niña over these months. The positive anomalies are to the west and the ITCZ in the central Pacific is weak. The ITCZ over the western Atlantic is strong and narrow and extends into northern South America. The rest of South America has a deficit of precipitation for this season, which has helped to extend drought conditions in various areas there.
In North America negative anomalies for this season in the west are extensions of features over the Pacific and still at least partially reflect the effect of the fading La Niñulting river flows setting records in some cases. This negative feature in the west extends across southern Canada and back down into the northeast U.S. Countering these negative anomalies is a positive rain anomaly pushing up from the Gulf of Mexico into the south-central U.S. with springtime severe thunderstorms and flooding along the Gulf coast.
Africa and Australia also are dominated by precipitation deficit features this season. Exceptions are the region of the Upper Nile watershed and southeast Australia. In the North Atlantic the precipitation in the storm track was less than normal and that pattern extended into western Europe. An exception to all this dryness for this season is Asia, which has a majority of coverage by areas with precipitation above normal. This is especially true for India and China.
Background discussion of long-term means, variations and trends of global precipitation can be found in Adler et al. (2017).
References
- Adler, R., G. Gu, M. Sapiano, J. Wang, G. Huffman 2017. Global Precipitation: Means, Variations and Trends During the Satellite Era (1979-2014). Surveys in Geophysics 38: 679-699, doi:10.1007/s10712-017-9416-4
- Adler, R., M. Sapiano, G. Huffman, J. Wang, G. Gu, D. Bolvin, L. Chiu, U. Schneider, A. Becker, E. Nelkin, P. Xie, R. Ferraro, D. Shin, 2018. The Global Precipitation Climatology Project (GPCP) Monthly Analysis (New Version 2.3) and a Review of 2017 Global Precipitation. Atmosphere. 9(4), 138; doi:10.3390/atmos9040138
- Gu, G., and R. Adler, 2022. Observed Variability and Trends in Global Precipitation During 1979-2020. Climate Dynamics, doi:10.1007/s00382-022-06567-9
- Huang, B., Peter W. Thorne, et. al, 2017: Extended Reconstructed Sea Surface Temperature version 5 (ERSSTv5), Upgrades, validations, and intercomparisons. J. Climate, doi: 10.1175/JCLI-D-16-0836.1
- Huang, B., V.F. Banzon, E. Freeman, J. Lawrimore, W. Liu, T.C. Peterson, T.M. Smith, P.W. Thorne, S.D. Woodruff, and H-M. Zhang, 2016: Extended Reconstructed Sea Surface Temperature Version 4 (ERSST.v4). Part I: Upgrades and Intercomparisons. J. Climate, 28, 911-930, doi:10.1175/JCLI-D-14-00006.1.
- Menne, M. J., C. N. Williams, B.E. Gleason, J. J Rennie, and J. H. Lawrimore, 2018: The Global Historical Climatology Network Monthly Temperature Dataset, Version 4. J. Climate, in press. https://doi.org/10.1175/JCLI-D-18-0094.1.
- Peterson, T.C. and R.S. Vose, 1997: An Overview of the Global Historical Climatology Network Database. Bull. Amer. Meteorol. Soc., 78, 2837-2849.
- Vose, R., B. Huang, X. Yin, D. Arndt, D. R. Easterling, J. H. Lawrimore, M. J. Menne, A. Sanchez-Lugo, and H. M. Zhang, 2021. Implementing Full Spatial Coverage in NOAA's Global Temperature Analysis. Geophysical Research Letters 48(10), e2020GL090873; doi:10.1029/2020gl090873.