Introduction
Temperature anomalies and percentiles are shown on the gridded maps below. The anomaly map on the left is a product of a merged land surface temperature (Global Historical Climatology Network, GHCN) and sea surface temperature (ERSST version 5) anomaly analysis. Temperature anomalies for land and ocean are analyzed separately and then merged to form the global analysis. For more information, please visit NCEI's Global Surface Temperature Anomalies page. The percentile map on the right provides additional information by placing the temperature anomaly observed for a specific place and time period into historical perspective, showing how the most current month, season or year compares with the past.
Temperature
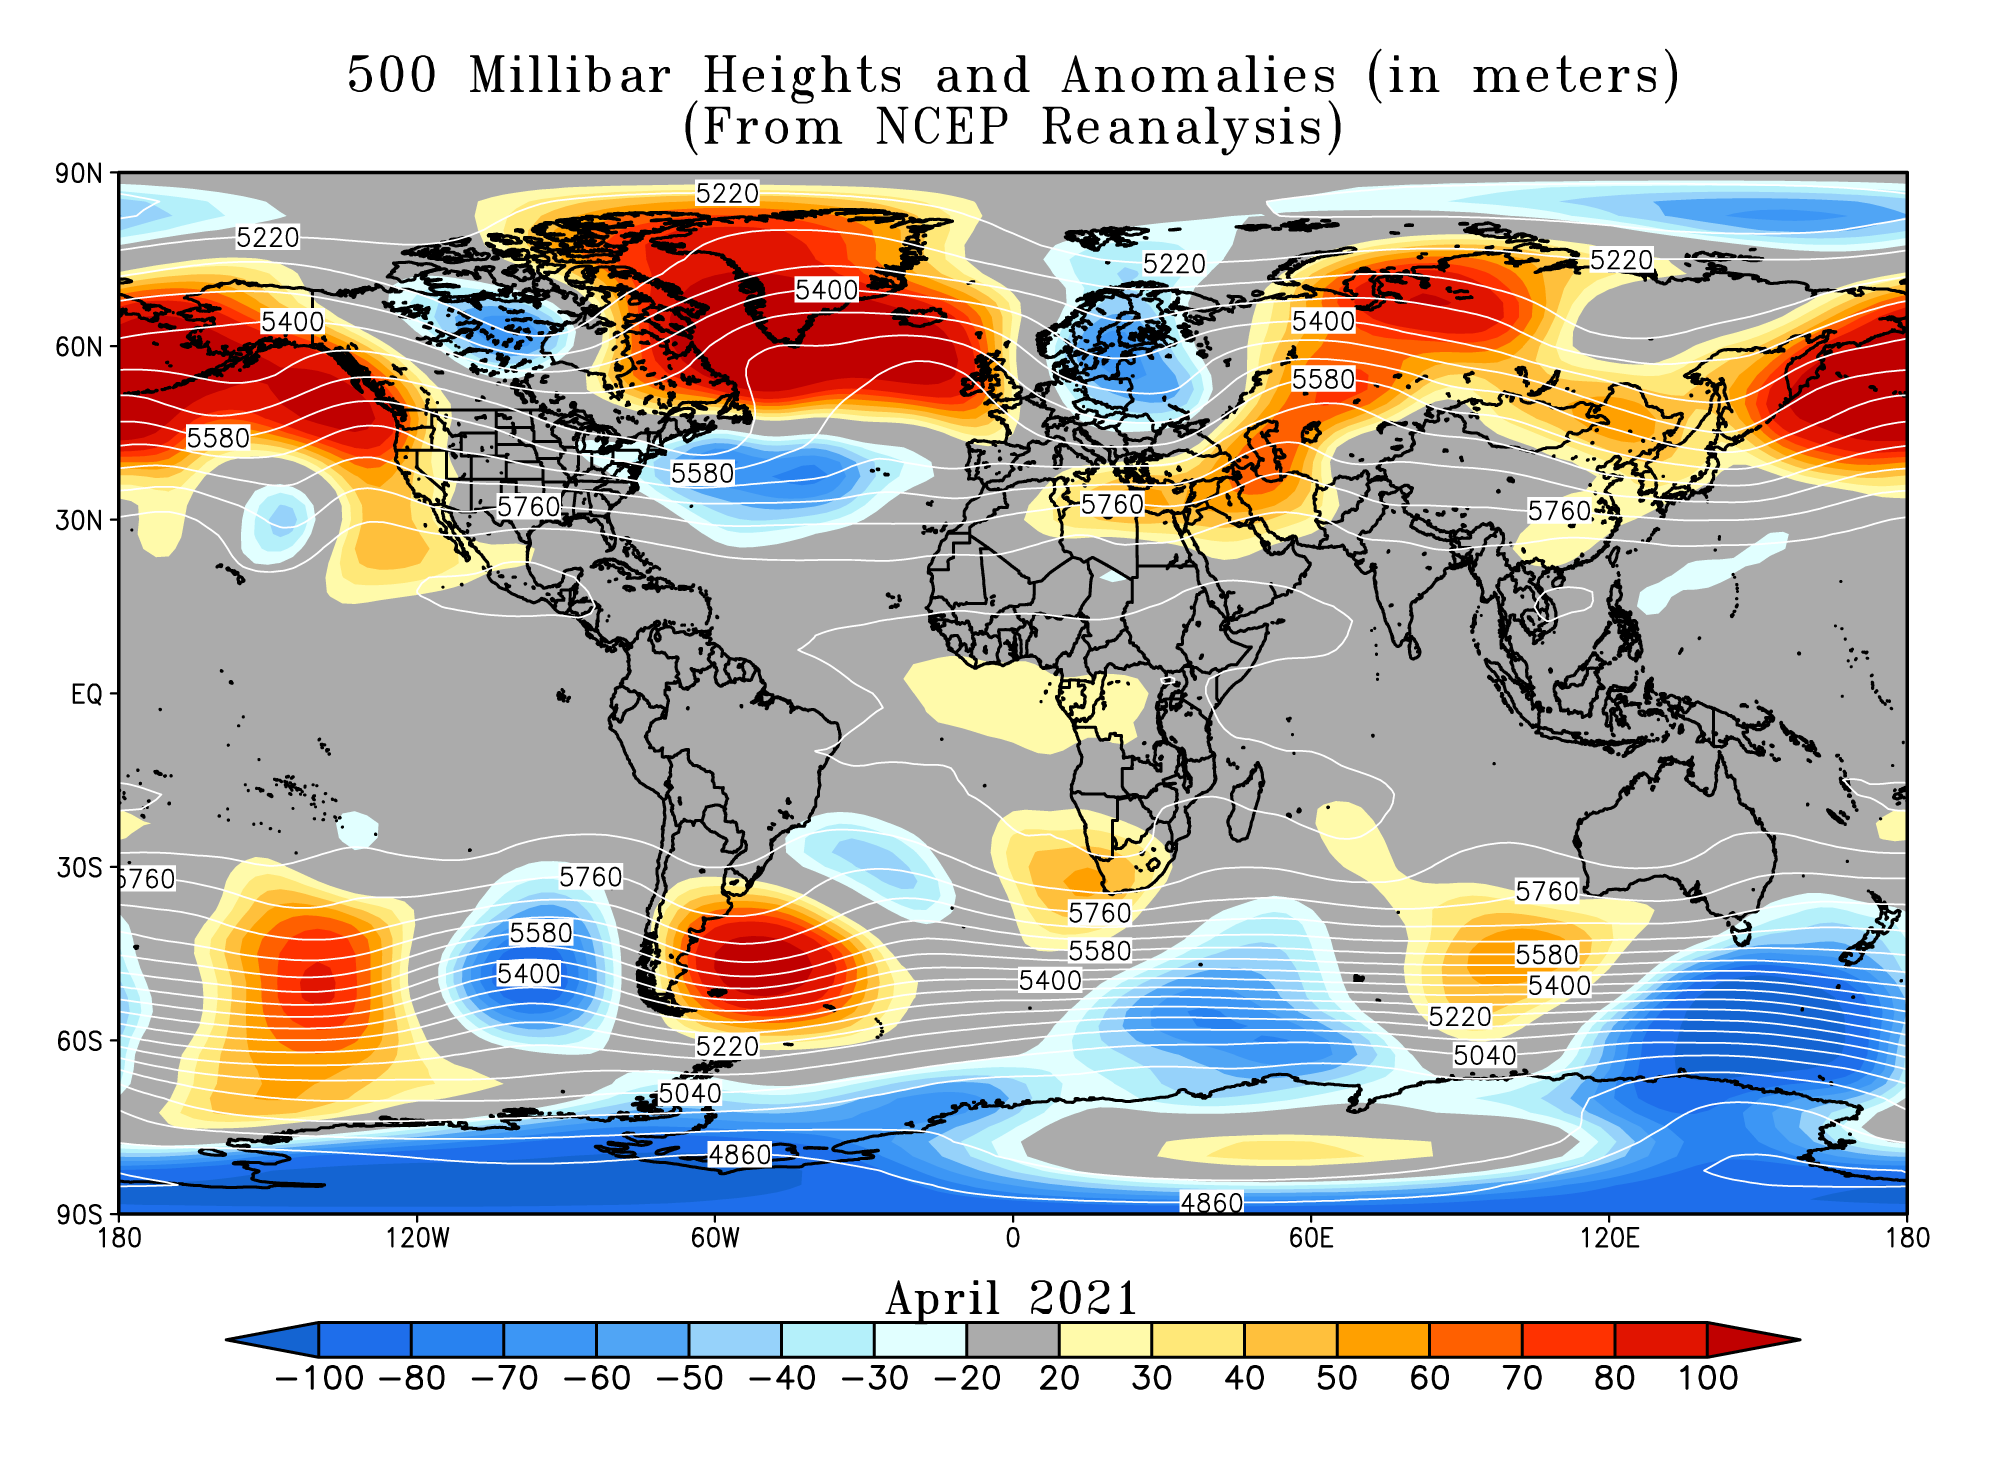
In the atmosphere, 500-millibar height pressure anomalies correlate well with temperatures at the Earth's surface. The average position of the upper-level ridges of high pressure and troughs of low pressure—depicted by positive and negative 500-millibar height anomalies on the April 2021 map—is generally reflected by areas of positive and negative temperature anomalies at the surface, respectively.
Monthly Temperature: April 2021
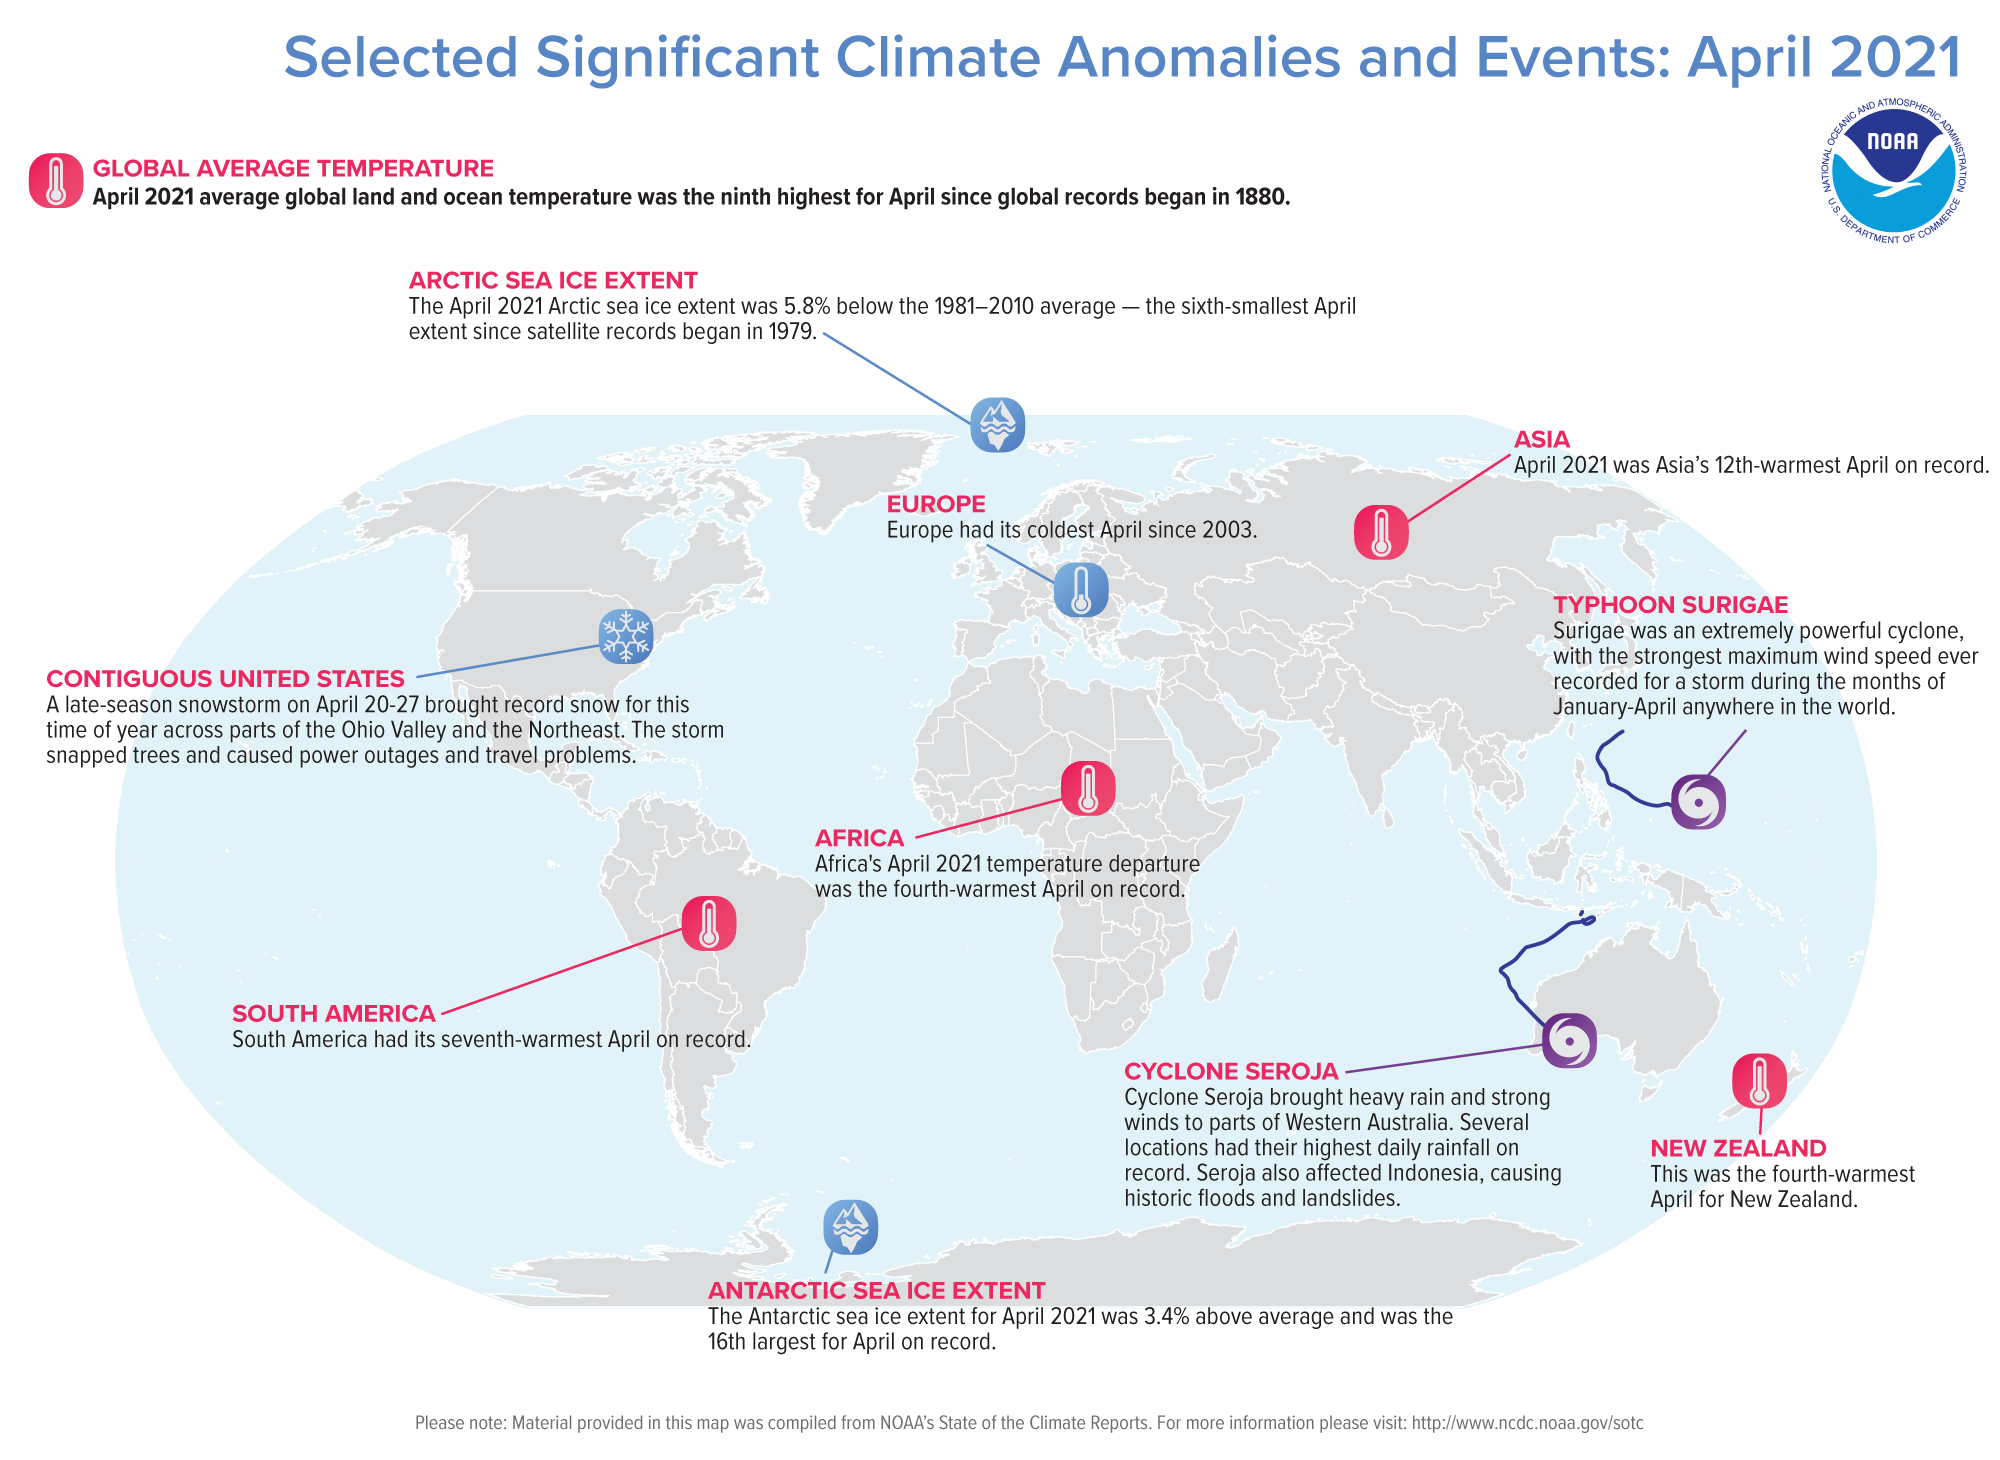
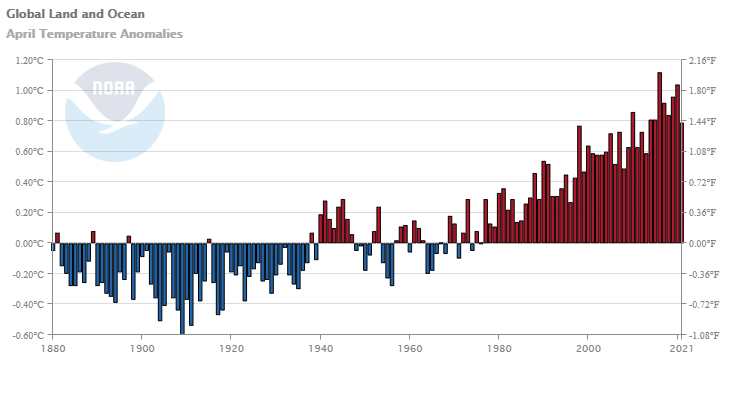
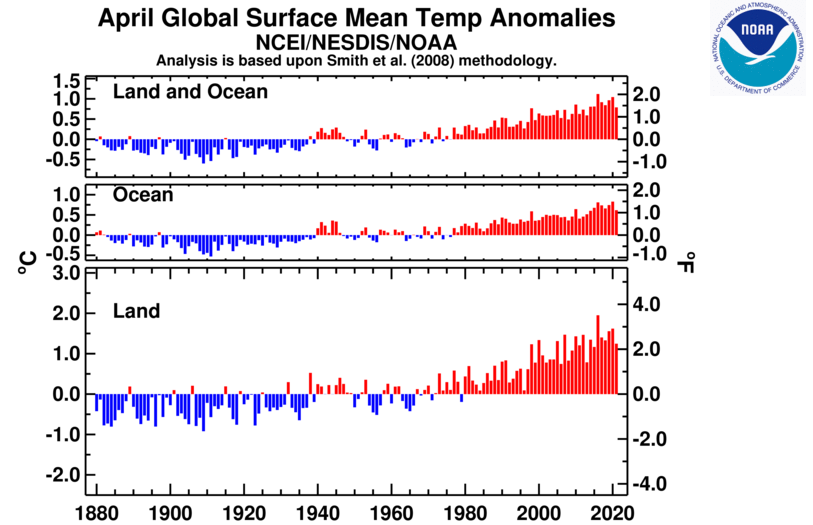
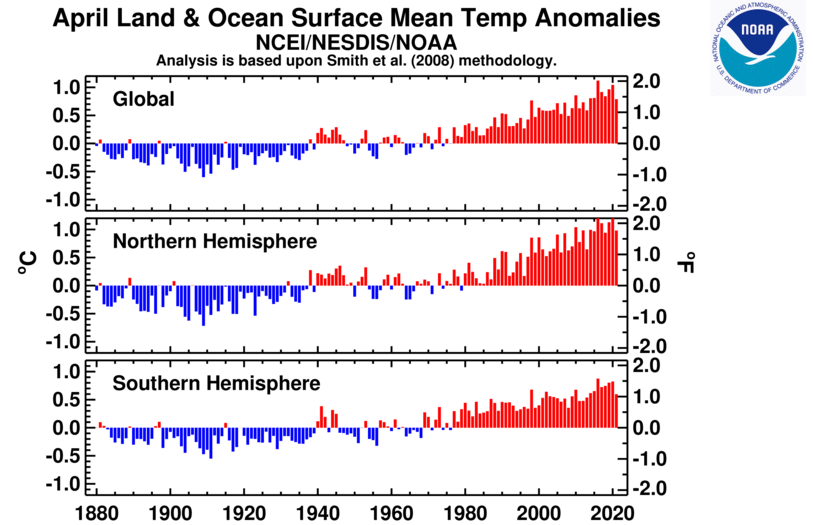
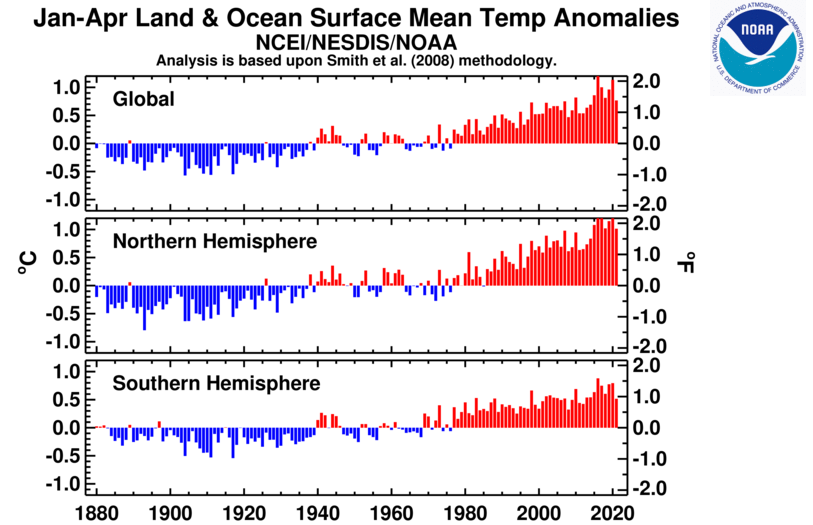
The April 2021 global surface temperature was 0.79°C (1.42°F) above the 20th century average of 13.7°C (56.7°F). This was the smallest value for April since 2013 and was the ninth warmest April in the 142-year record. April 2021 marked the 45th consecutive April and the 436th consecutive month with temperatures, at least nominally, above the 20th-century average. December 1984 was the last time a monthly temperature was below average.
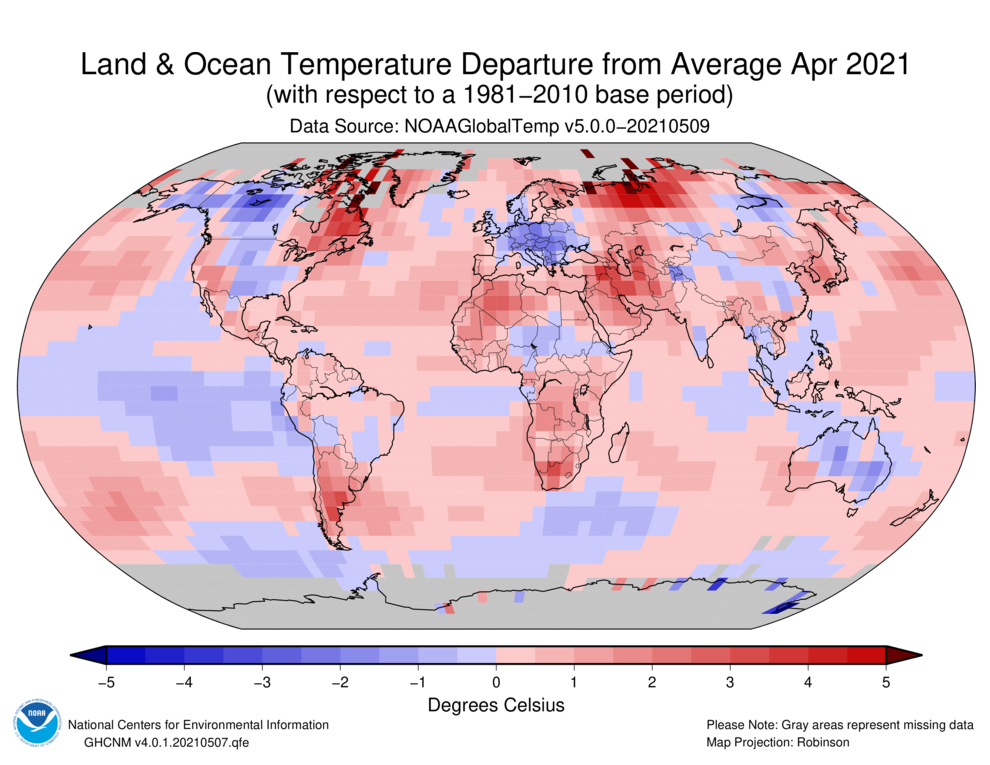
Warmer-than-average temperatures were observed across much of the world's land and ocean surfaces, with the most notable warm anomalies across eastern Canada, southern South America, northwestern and southwestern Asia, and southern Africa, where temperatures were at least 2.5°C (4.5°F) above average. Record-warm April temperatures were present across parts of southern South America, southern Africa, the Middle East and the Pacific and Atlantic oceans. This encompassed only 2.44% of the world's surface with a record-warm April temperature—the smallest percentage since April 2013. Overall, this was the 11th highest April percentage for record-warm April temperatures since records began in 1951.
Meanwhile, near- to cooler-than-average April temperatures were present across much of North America, central Europe, parts of central Asia, Australia, and across the central and eastern tropical Pacific Ocean, and the southern oceans. However, no land or ocean areas had a record-cold April.

The global land surface temperature departure of +1.25°C (+2.25°F) was the smallest temperature departure for April since 2015 and was the 12th highest on record. Similarly, the global ocean surface temperature departure (+0.62°C / +1.12°F) was the smallest for April since 2014 and the eighth highest on record for April.
Regionally, Africa and South America had their fourth and seventh warmest April on record, respectively. Meanwhile, Europe had its coolest April since 2003. Several European countries had their coldest April in at least 20 years.
| April | Anomaly | Rank (out of 142 years) | Records | ||||
|---|---|---|---|---|---|---|---|
| °C | °F | Year(s) | °C | °F | |||
| Global | |||||||
| Land | +1.25 ± 0.12 | +2.25 ± 0.22 | Warmest | 12th | 2016 | +1.95 | +3.51 |
| Coolest | 131st | 1909 | -0.92 | -1.66 | |||
| Ocean | +0.62 ± 0.14 | +1.12 ± 0.25 | Warmest | 8th | 2020 | +0.83 | +1.49 |
| Coolest | 135th | 1911 | -0.53 | -0.95 | |||
| Land and Ocean | +0.79 ± 0.13 | +1.42 ± 0.23 | Warmest | 9th | 2016 | +1.12 | +2.02 |
| Coolest | 134th | 1909 | -0.60 | -1.08 | |||
| Northern Hemisphere | |||||||
| Land | +1.36 ± 0.16 | +2.45 ± 0.29 | Warmest | 12th | 2016 | +2.16 | +3.89 |
| Coolest | 131st | 1909 | -1.05 | -1.89 | |||
| Ocean | +0.74 ± 0.13 | +1.33 ± 0.23 | Warmest | 7th | 2020 | +0.97 | +1.75 |
| Coolest | 136th | 1911 | -0.51 | -0.92 | |||
| Land and Ocean | +0.98 ± 0.13 | +1.76 ± 0.23 | Warmest | 7th | 2016 | +1.36 | +2.45 |
| Coolest | 136th | 1909 | -0.72 | -1.30 | |||
| Ties: 2012 | |||||||
| Southern Hemisphere | |||||||
| Land | +0.95 ± 0.11 | +1.71 ± 0.20 | Warmest | 10th | 2018 | +1.55 | +2.79 |
| Coolest | 133rd | 1885 | -0.84 | -1.51 | |||
| Ocean | +0.53 ± 0.15 | +0.95 ± 0.27 | Warmest | 11th | 2016 | +0.78 | +1.40 |
| Coolest | 132nd | 1911 | -0.53 | -0.95 | |||
| Land and Ocean | +0.60 ± 0.14 | +1.08 ± 0.25 | Warmest | 11th | 2016 | +0.88 | +1.58 |
| Coolest | 132nd | 1911 | -0.55 | -0.99 | |||
| Arctic | |||||||
| Land and Ocean | +1.82 ± 0.49 | +3.28 ± 0.88 | Warmest | 15th | 2007 | +3.31 | +5.96 |
| Coolest | 128th | 1884 | -2.24 | -4.03 | |||
The most current data can be accessed via the Global Surface Temperature Anomalies page.
Select national information is highlighted below. Please note that different countries report anomalies with respect to different base periods. The information provided here is based directly upon these data:
- The United Kingdom's national temperature of 5.7°C (42.3°F) was 1.7°C (3.1°F) below the 1981–2010 average. April was colder than March for the first time since 2012 across the United Kingdom.
- Austria had its coldest April since 1997 with a temperature 2.7°C (4.9°F) below average. It was also a dry month for Austria, ranking among the eight driest Aprils on record. According to ZAMG, having a combination of a dry and cool April is very rare, occurring only three additional times since records began in 1858.
- According to Sweden's SMHI, France and Switzerland had their coldest April since 2001, while Poland, Serbia, and Hungary had their coldest April since 1997. The Netherland's April 2021 temperature was the coldest since 1986.
- Parts of western and central Europe experienced really cold temperatures during the first week of April, with several locations setting new low minimum temperatures. Of note, there were several locations across Slovenia that had their coldest April temperature in over 100 years. The weather station in Nova Vas, southern Slovenia, recorded a minimum temperature of -20.6°C (-5.1°F)—a new all-time national record for April, exceeding the previous record of -20.4°C (-4.7°F) set on April 9, 1956 at Pokljuka. Vegetation across these areas was damaged due to the really cold temperatures.
- Warmer-than-average conditions engulfed much of New Zealand. April 2021 was New Zealand's fourth warmest April on record at 0.9°C (1.6°F) above average. According to NIWA, several locations had near-record or record high maximum temperatures during the month, particularly during April 4–6. Of note, Timaru had a maximum temperature of 30.8°C (87.4°F) on April 4—New Zealand's fourth highest April maximum temperature on record.
Year-to-date Temperature: January–April 2021

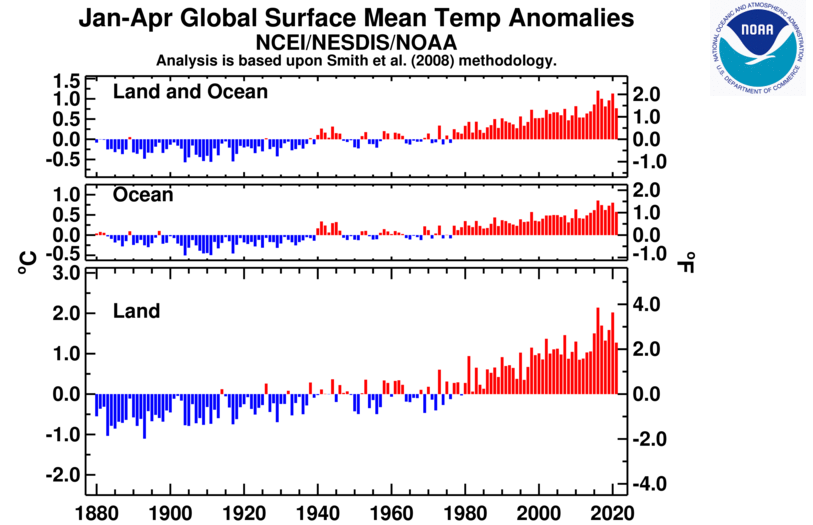
The January–April global surface temperature was 0.77°C (1.39°F) above the 20th century average—the smallest January–April temperature departure since 2014 and the eighth highest in the 142-year record. According to a statistical analysis done by NCEI scientists, the year 2021 is very likely to rank among the ten warmest years on record and has less than 4% chance to rank among the five warmest years on record.
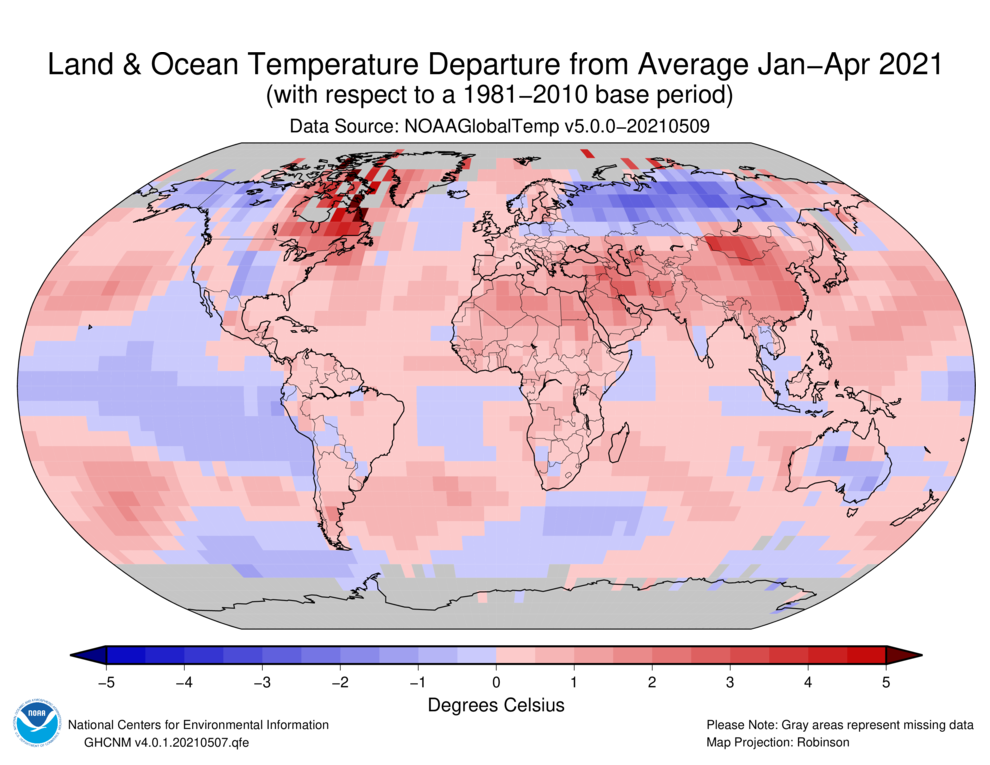
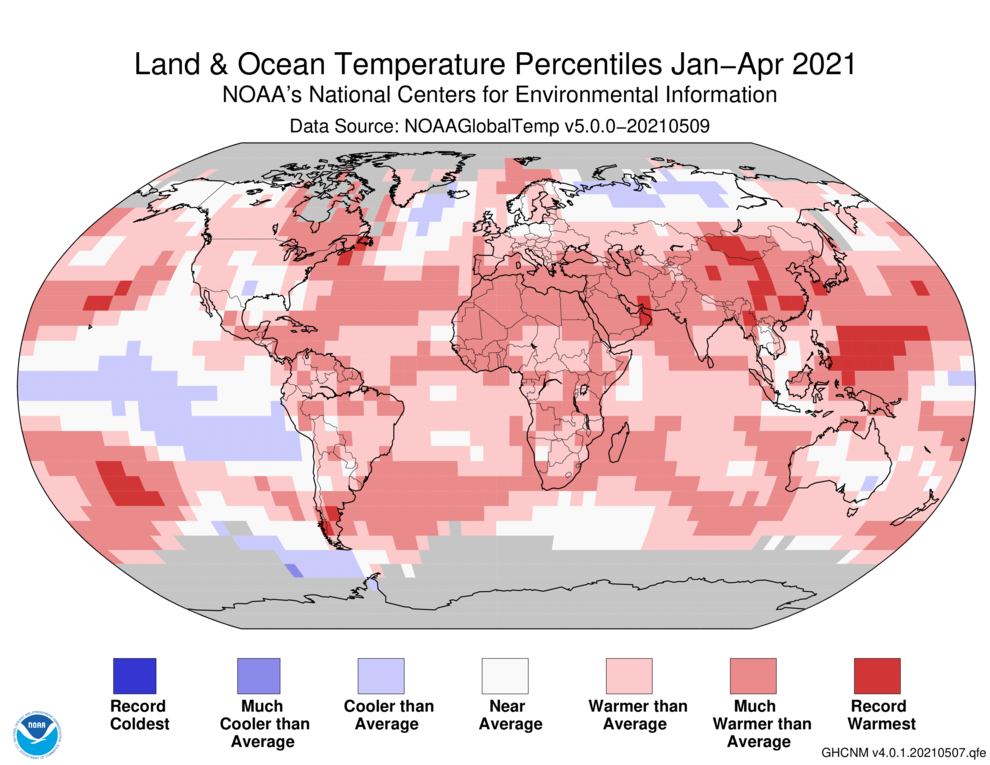
The January–April period was characterized by warmer-than-average conditions across much of the globe. The most notable warm year-to-date temperature anomalies were observed across eastern Canada and across parts of southern Asia, where temperatures were at least 2.0°C (3.6°F) above average. Parts of northern and southern Pacific Ocean were also notable. Record-warm January–April temperatures were present across parts of the western and central Pacific Ocean as well as parts of southern Asia. Notable cooler-than-average temperatures were observed across northern Asia, where temperatures were at least 1.5°C (2.7°F) below average.
Regionally, Africa and South America had their third and tenth warmest January–April period on record, respectively. Oceania and Europe had their smallest January–April period since 2012 and 2013, respectively. Asia had its coolest such period since 2014.
| January–April | Anomaly | Rank (out of 142 years) | Records | ||||
|---|---|---|---|---|---|---|---|
| °C | °F | Year(s) | °C | °F | |||
| Global | |||||||
| Land | +1.27 ± 0.16 | +2.29 ± 0.29 | Warmest | 10th | 2016 | +2.14 | +3.85 |
| Coolest | 133rd | 1893 | -1.10 | -1.98 | |||
| Ocean | +0.57 ± 0.16 | +1.03 ± 0.29 | Warmest | 8th | 2016 | +0.86 | +1.55 |
| Coolest | 135th | 1904, 1911 | -0.50 | -0.90 | |||
| Ties: 1998 | |||||||
| Land and Ocean | +0.77 ± 0.17 | +1.39 ± 0.31 | Warmest | 8th | 2016 | +1.20 | +2.16 |
| Coolest | 135th | 1904 | -0.57 | -1.03 | |||
| Northern Hemisphere | |||||||
| Land | +1.50 ± 0.20 | +2.70 ± 0.36 | Warmest | 8th | 2016 | +2.44 | +4.39 |
| Coolest | 135th | 1893 | -1.33 | -2.39 | |||
| Ocean | +0.71 ± 0.15 | +1.28 ± 0.27 | Warmest | 6th | 2016 | +0.96 | +1.73 |
| Coolest | 137th | 1904 | -0.53 | -0.95 | |||
| Land and Ocean | +1.01 ± 0.16 | +1.82 ± 0.29 | Warmest | 7th | 2016 | +1.52 | +2.74 |
| Coolest | 136th | 1893 | -0.80 | -1.44 | |||
| Southern Hemisphere | |||||||
| Land | +0.69 ± 0.13 | +1.24 ± 0.23 | Warmest | 18th | 2016 | +1.37 | +2.47 |
| Coolest | 125th | 1917 | -0.83 | -1.49 | |||
| Ocean | +0.48 ± 0.16 | +0.86 ± 0.29 | Warmest | 14th | 2016 | +0.79 | +1.42 |
| Coolest | 129th | 1911 | -0.52 | -0.94 | |||
| Ties: 1983, 2013 | |||||||
| Land and Ocean | +0.52 ± 0.16 | +0.94 ± 0.29 | Warmest | 16th | 2016 | +0.88 | +1.58 |
| Coolest | 127th | 1917 | -0.54 | -0.97 | |||
| Ties: 1988, 2007 | |||||||
| Arctic | |||||||
| Land and Ocean | +0.93 ± 0.41 | +1.67 ± 0.74 | Warmest | 27th | 2016 | +3.34 | +6.01 |
| Coolest | 116th | 1966 | -2.32 | -4.18 | |||
Precipitation
April Precipitation
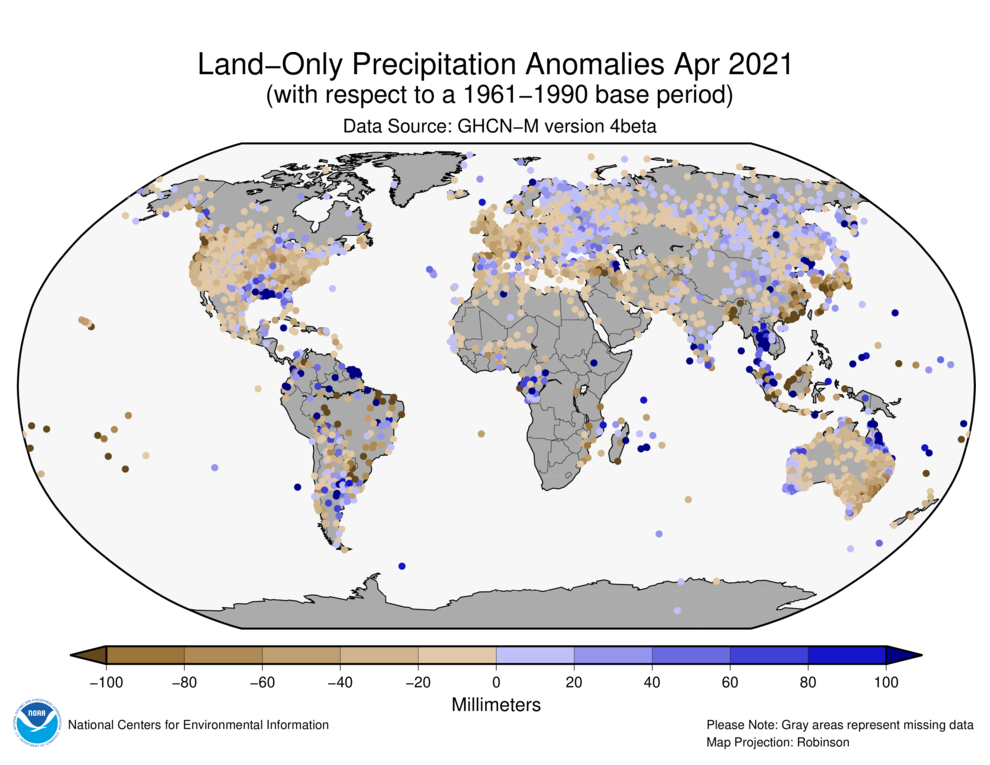

The maps shown above represent precipitation percent of normal (left, using a base period of 1961–1990) and precipitation percentiles (right, using the period of record) based on the GHCN dataset of land surface stations. As is typical, precipitation anomalies during April 2021 varied significantly around the world. April 2021 precipitation was generally drier than normal across parts of the western half of the contiguous U.S., Mexico, central and northern Europe, the Middle East, southwestern Russia, eastern China, Australia, and across parts of southern South America. Wetter-than-average conditions were present across parts the southeastern contiguous U.S., central Argentina, western and southeastern Russia, Mongolia, northern China, and southwestern and northeastern Australia.
Select national information is highlighted below. (Please note that different countries report anomalies with respect to different base periods. The information provided here is based directly upon these data):
- Spain, as a whole, had near-normal precipitation for April 2021. However, regionally, northern and parts of southern Spain had below-average precipitation, while the rest had near- to above-average precipitation. Of note, several locations across the eastern and southeastern portions of the country had double or triple the April normal precipitation.
- Typhoon Surigae, an extremely powerful cyclone, had the strongest maximum wind speed ever recorded for a storm during the months of January through April anywhere in the world. Surigae formed in the Western Pacific Ocean on April 12 and dissipated by the end of the month. Surigae was also the third Category 5 cyclone in 2021 and the first one this year for the West Pacific basin. Although Surigae didn't make landfall anywhere, it brought heavy rains to parts of Palau and Federated States of Micronesia as well as the Philippines.
- Much of Australia had below-average precipitation during April 2021, resulting in a national average total of 18.9 mm (0.7 inch), which is 38% below average. Most regions had a drier-than-average April. Of note, New South Wales and South Australia had their driest April since 2005 and 1997, respectively, and ranked among the eight driest Aprils in the 122-year record. Queensland was the only region with wetter-than-average conditions at 10% above average. Queensland wet conditions were attributed to heavy rain that fell during the last two weeks of the month associated with troughs. Several locations across Queensland had their wettest April on record.
- Cyclone Seroja formed in the eastern Indian Ocean basin early in the month and crossed the coast of Western Australia on April 11. Seroja brought copious rain and strong winds to the region. Several locations had their highest daily rainfall on record. Seroja also affected Indonesia, causing historic floods and landslides in parts of the region.
Global Precipitation Climatology Project (GPCP)
The following analysis is based upon the Global Precipitation Climatology Project (GPCP) Interim Climate Data Record. It is provided courtesy of the GPCP Principal Investigator team at the University of Maryland.
The Global Precipitation Climatology Project (GPCP) monthly data set is a long-term (1979-present) analysis (Adler et al., 2018) using a combination of satellite and gauge information. An interim GPCP analysis completed within ~10 days of the end of the month allows its use in climate monitoring.
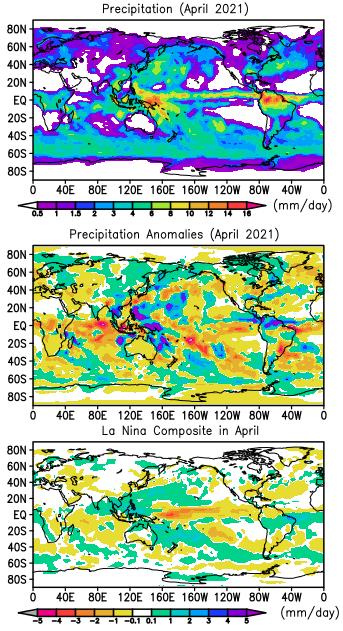
Another transition month has the major tropical rain zones moving north. Along with the seasonal changes the La Niña effect is still somewhat present (although definitely weakened) and the effect of tropical cyclones is evident, even though it is not summer in either hemisphere. The ITCZ stretches across the Pacific (Fig. 1, top panel) and in the eastern portions of the ocean the twin quasi-linear features of the double ITCZ can be discerned straddling the Equator, although the southern element of the double feature is very weak. In the monthly anomaly map (Fig. 1, middle panel) the north-of-the-Equator feature is stronger (more rainfall) than normal, while the south-side feature shows a negative anomaly.
The La Niña has gradually weakened with SST values in the central Pacific now only slightly below normal. The April composite for La Niña conditions (Fig. 1, bottom panel) has the typical rainfall deficit in the central Pacific and the surplus further west. The moderated La Niña for this April has weakened and less organized rainfall anomaly features along the Equator (Fig. 1, middle panel). In the central Pacific, where past months have shown an organized negative anomaly, a less organized pattern of smaller negative and some positive features is evident. Further west over the Maritime Continent, where positive anomalies dominated in previous months, a more disorganized pattern is seen, although the positive anomaly features were connected to floods in parts of Indonesia. The Indian Ocean retains a La Niña-type look. Over South America the ITCZ crossing the continent was active with above normal rainfall (opposite to the La Niña composite) and some associated flooding in Colombia and Peru and also in Central America. Further to the south a sharp negative feature helped to keep the local drought going. The African continent is dominated by negative anomalies, especially in central Africa, with small, positive features along the southeast coast and over part of Somalia.
Although Australia was relatively dry, its periphery was touched by tropical cyclone activity along the northeast and western coasts. Tropical cyclones also contributed rainfall to the Mozambique/Madagascar region and even the positive anomaly in Indochina had a significant contribution from a system that started as a short-lived tropical depression in the Bengal Sea near the beginning of the month that is extremely unusual there at this time of year. However, the most intense positive anomaly on the map is the curved feature over and to the east of the Philippines. This feature indicates the track of Super Typhoon Surigae from about 13–22 April as it approached the Philippines and then re-curved to the northeast, just brushing the islands. This was the strongest storm ever in the Northern Hemisphere before May and left its mark on the rainfall map, although it did not significantly affect any land.
Although the La Niña in the Pacific has moved more toward neutral conditions, it still seemed to have an effect on North America with relative dry conditions across most of the continent this month, similar to the composite. This result helped to intensify the drought conditions in much of the southwest and west of the U.S. However, a clear exception to this La Niña pattern is the small strip of positive anomalies along the Gulf of Mexico coast associated with flooding in Houston at the end of the month and further east.
Over the North Atlantic the springtime storm track was further south than normal with a positive anomaly running northeastward from Florida and a negative anomaly area further north extending into Western Europe, where drought conditions held in several areas. Western Europe also recorded its coldest April in decades, giving the region a cool and dry April.
Background discussion of long-term means, variations and trends of global precipitation can be found in Adler et al. (2017).
References
- Adler, R., G. Gu, M. Sapiano, J. Wang, G. Huffman 2017. Global Precipitation: Means, Variations and Trends During the Satellite Era (1979-2014). Surveys in Geophysics 38: 679-699, doi:10.1007/s10712-017-9416-4
- Adler, R., M. Sapiano, G. Huffman, J. Wang, G. Gu, D. Bolvin, L. Chiu, U. Schneider, A. Becker, E. Nelkin, P. Xie, R. Ferraro, D. Shin, 2018. The Global Precipitation Climatology Project (GPCP) Monthly Analysis (New Version 2.3) and a Review of 2017 Global Precipitation. Atmosphere. 9(4), 138; doi:10.3390/atmos9040138
- Gu, G., and R. Adler, 2022. Observed Variability and Trends in Global Precipitation During 1979-2020. Climate Dynamics, doi:10.1007/s00382-022-06567-9
- Huang, B., Peter W. Thorne, et. al, 2017: Extended Reconstructed Sea Surface Temperature version 5 (ERSSTv5), Upgrades, validations, and intercomparisons. J. Climate, doi: 10.1175/JCLI-D-16-0836.1
- Huang, B., V.F. Banzon, E. Freeman, J. Lawrimore, W. Liu, T.C. Peterson, T.M. Smith, P.W. Thorne, S.D. Woodruff, and H-M. Zhang, 2016: Extended Reconstructed Sea Surface Temperature Version 4 (ERSST.v4). Part I: Upgrades and Intercomparisons. J. Climate, 28, 911-930, doi:10.1175/JCLI-D-14-00006.1.
- Menne, M. J., C. N. Williams, B.E. Gleason, J. J Rennie, and J. H. Lawrimore, 2018: The Global Historical Climatology Network Monthly Temperature Dataset, Version 4. J. Climate, in press. https://doi.org/10.1175/JCLI-D-18-0094.1.
- Peterson, T.C. and R.S. Vose, 1997: An Overview of the Global Historical Climatology Network Database. Bull. Amer. Meteorol. Soc., 78, 2837-2849.
- Vose, R., B. Huang, X. Yin, D. Arndt, D. R. Easterling, J. H. Lawrimore, M. J. Menne, A. Sanchez-Lugo, and H. M. Zhang, 2021. Implementing Full Spatial Coverage in NOAA's Global Temperature Analysis. Geophysical Research Letters 48(10), e2020GL090873; doi:10.1029/2020gl090873.