Introduction
Temperature anomalies and percentiles are shown on the gridded maps below. The anomaly map on the left is a product of a merged land surface temperature (Global Historical Climatology Network, GHCN) and sea surface temperature (ERSST version 5) anomaly analysis. Temperature anomalies for land and ocean are analyzed separately and then merged to form the global analysis. For more information, please visit NCEI's Global Surface Temperature Anomalies page. The percentile map on the right provides additional information by placing the temperature anomaly observed for a specific place and time period into historical perspective, showing how the most current month, season or year compares with the past.
Temperature
In the atmosphere, 500-millibar height pressure anomalies correlate well with temperatures at the Earth's surface. The average position of the upper-level ridges of high pressure and troughs of low pressure—depicted by positive and negative 500-millibar height anomalies on the March 2021 map—is generally reflected by areas of positive and negative temperature anomalies at the surface, respectively.
Monthly Temperature: March 2021
Following a strongly negative Arctic Oscillation (AO) in February 2021, a strongly positive AO was present in March 2021. In a positive phase, the jet stream strengthens and circulates the North Pole, confining the cold Arctic Air across the Polar Regions. The AO value for March 2021 was 2.11—the fifth highest March value since 1950. The peak value on March 11 was the ninth highest daily value and the third highest for a day in March. In addition, during March 2021, La Niña continued to be present across the tropical Pacific Ocean; however, it weakened in strength.
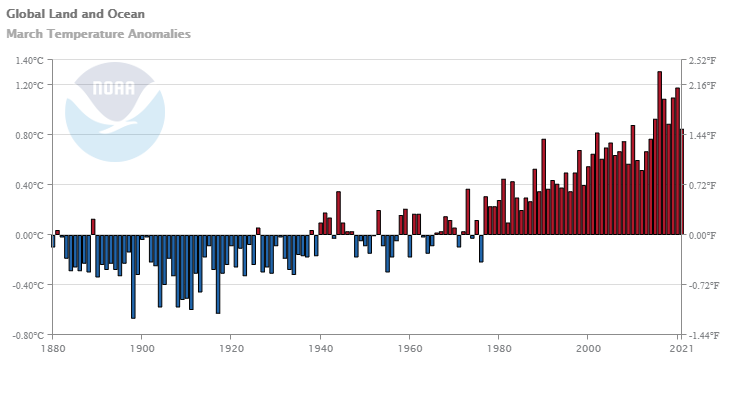
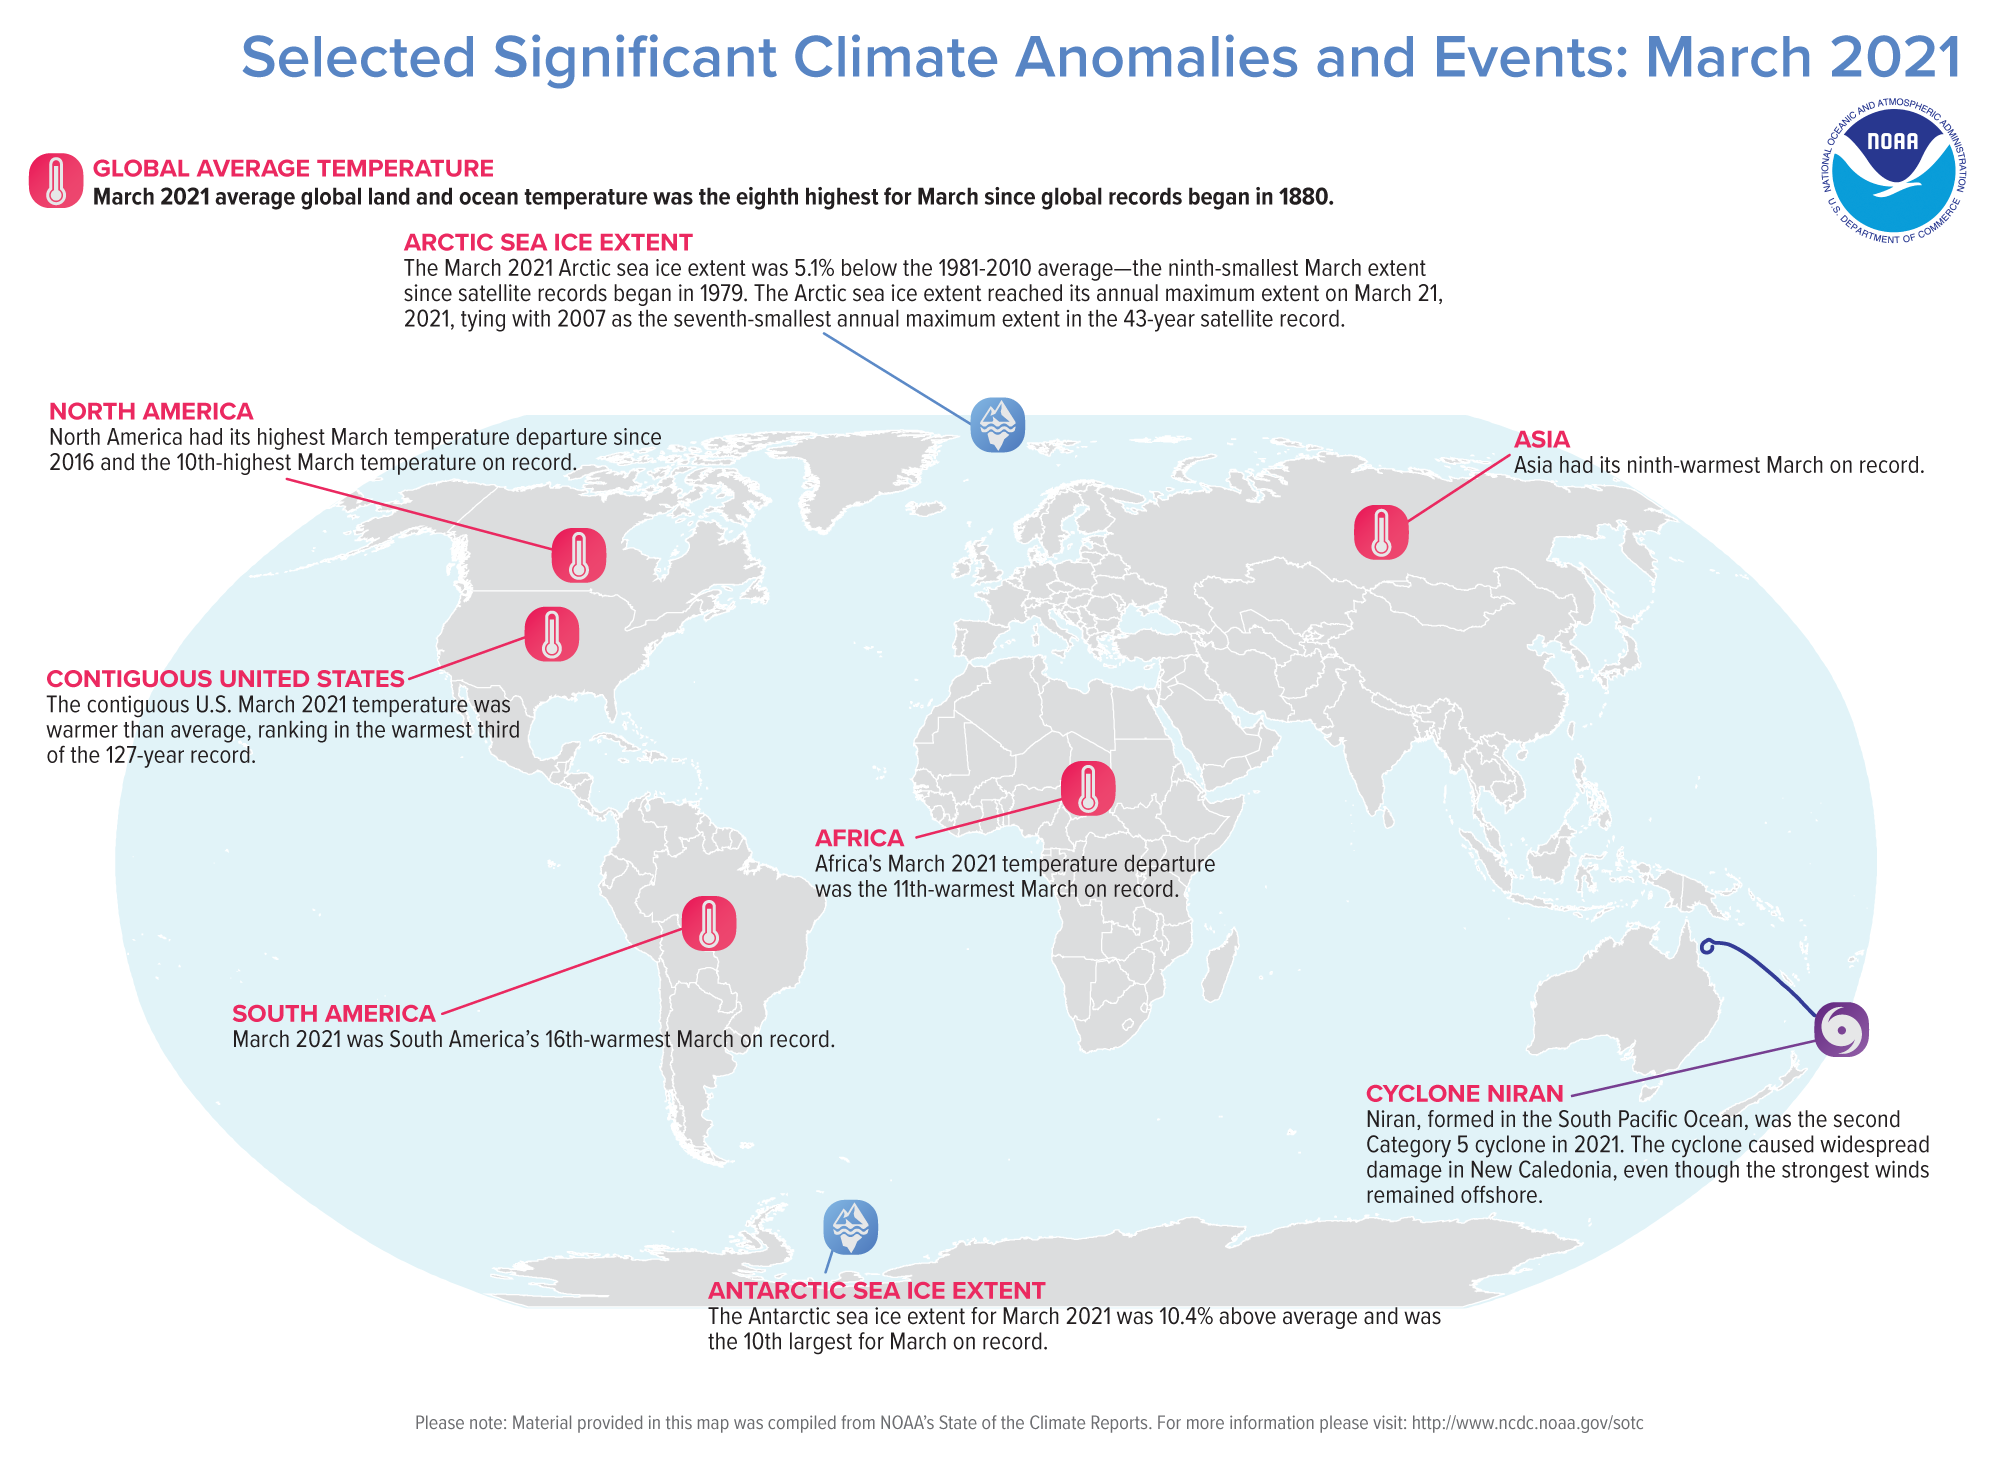
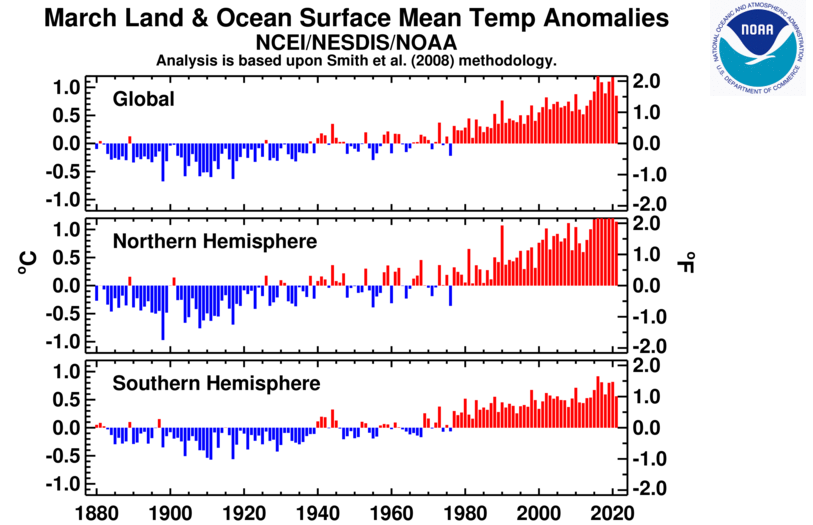
The global surface temperature departure of +0.85°C (+1.53°F) in March 2021 was the smallest March temperature departure since 2014 and was the eighth highest for March in the 142-year record. March 2021 also marked the 45th consecutive March and the 435th consecutive month with temperatures, at least nominally, above the 20th-century average.
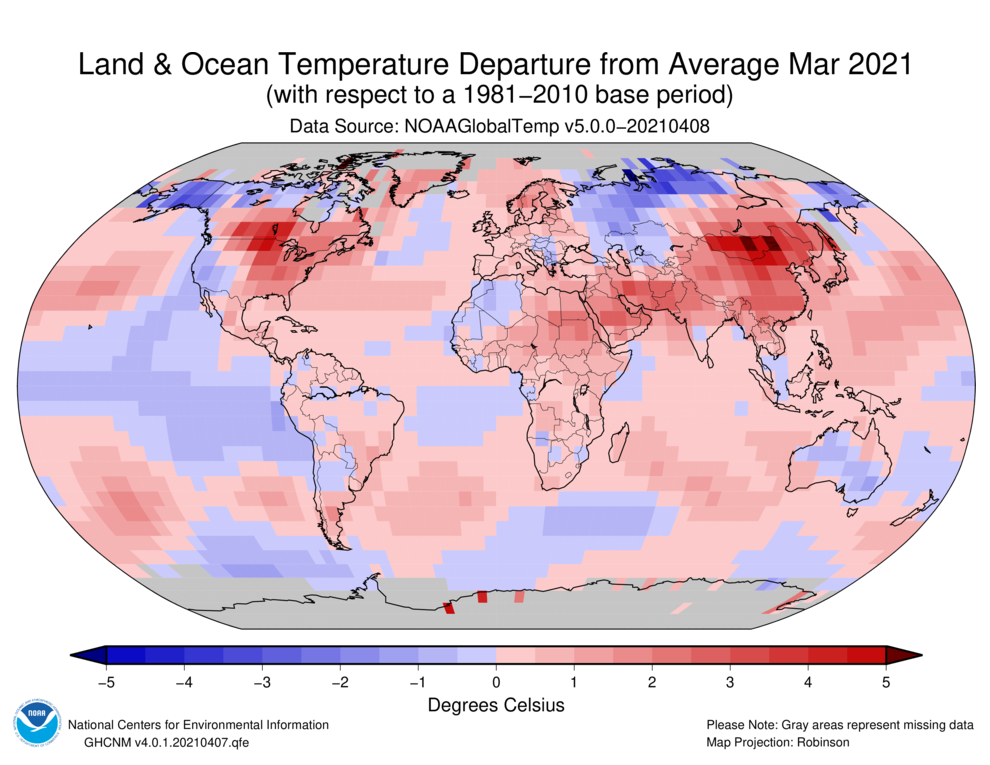
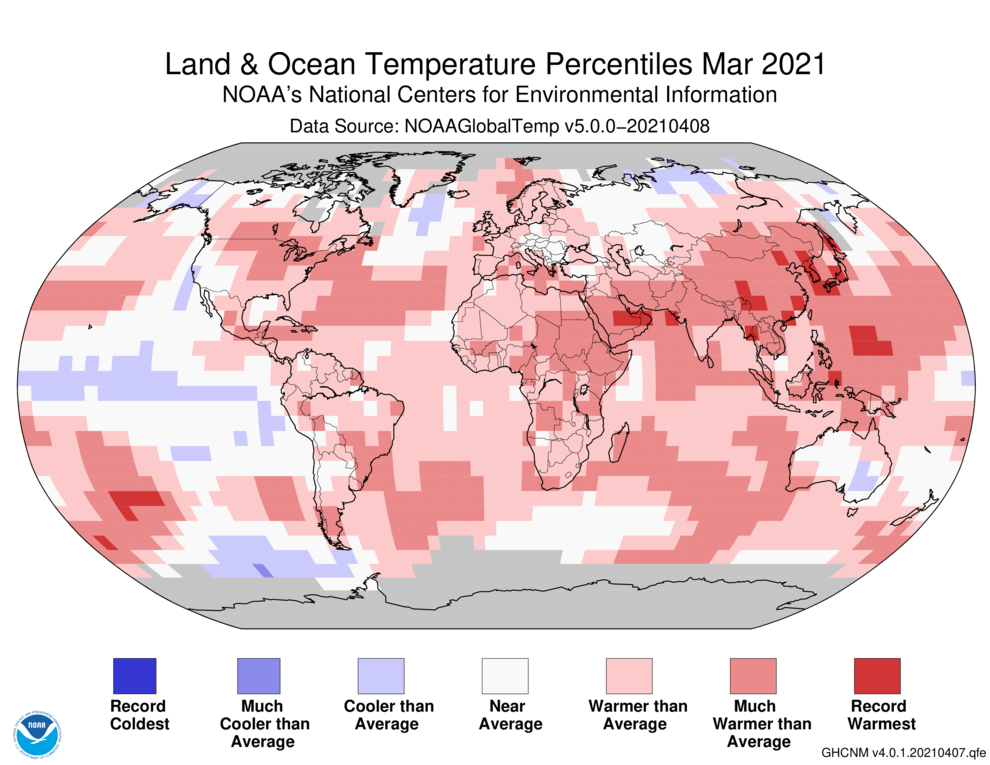
The most notable warmer-than-average March 2021 temperatures of at least +2.0°C (+3.6°F) were present across southern and eastern Canada, the eastern half of the contiguous U.S., the Middle East, southern and eastern Asia, as well as parts of central Antarctica. Other notable temperature anomalies were present across parts of the northern and southern Pacific Ocean, where temperatures were at least 1.5°C (2.7°) above average. Record warm March temperatures were limited to parts of the Middle East, southeastern Asia, and across parts of the Pacific Ocean. This encompassed only 2.5% of the world's surface with a record-warm March temperature, which is the smallest percentage since March 2014. Overall, this was the 11th highest March percentage for record-warm March temperatures since records began in 1951. Meanwhile, the most notable cool temperature departures of -0.5°C (0.9°F) or cooler during March were observed across Alaska, northern Canada, northwestern, north-central, and Far East Russia, and across parts of the tropical Pacific Ocean, the southern oceans, and Australia. However, no global land or ocean areas had record-cold March temperatures.
Regionally, North America and Asia had a March temperature that ranked among the 10 highest on record. Meanwhile, Oceania and the Hawaiian region had their smallest March temperature departure since 2012 and 2013, respectively.
| March | Anomaly | Rank (out of 142 years) | Records | ||||
|---|---|---|---|---|---|---|---|
| °C | °F | Year(s) | °C | °F | |||
| Global | |||||||
| Land | +1.60 ± 0.11 | +2.88 ± 0.20 | Warmest | 9th | 2016 | +2.53 | +4.55 |
| Coolest | 134th | 1898 | -1.69 | -3.04 | |||
| Ocean | +0.57 ± 0.14 | +1.03 ± 0.25 | Warmest | 9th | 2016 | +0.86 | +1.55 |
| Coolest | 134th | 1904, 1911 | -0.50 | -0.90 | |||
| Land and Ocean | +0.85 ± 0.15 | +1.53 ± 0.27 | Warmest | 8th | 2016 | +1.31 | +2.36 |
| Coolest | 135th | 1898 | -0.67 | -1.21 | |||
| Northern Hemisphere | |||||||
| Land | +1.93 ± 0.16 | +3.47 ± 0.29 | Warmest | 8th | 2016 | +2.98 | +5.36 |
| Coolest | 135th | 1898 | -2.13 | -3.83 | |||
| Ocean | +0.65 ± 0.13 | +1.17 ± 0.23 | Warmest | 7th | 2020 | +0.93 | +1.67 |
| Coolest | 136th | 1904 | -0.55 | -0.99 | |||
| Land and Ocean | +1.14 ± 0.13 | +2.05 ± 0.23 | Warmest | 7th | 2016 | +1.70 | +3.06 |
| Coolest | 136th | 1898 | -0.97 | -1.75 | |||
| Southern Hemisphere | |||||||
| Land | +0.76 ± 0.12 | +1.37 ± 0.22 | Warmest | 16th | 2016 | +1.38 | +2.48 |
| Coolest | 127th | 1885 | -1.01 | -1.82 | |||
| Ocean | +0.52 ± 0.15 | +0.94 ± 0.27 | Warmest | 12th | 2016 | +0.83 | +1.49 |
| Coolest | 131st | 1911 | -0.54 | -0.97 | |||
| Land and Ocean | +0.56 ± 0.14 | +1.01 ± 0.25 | Warmest | 11th | 2016 | +0.92 | +1.66 |
| Coolest | 132nd | 1911 | -0.57 | -1.03 | |||
| Ties: 2005 | |||||||
| Arctic | |||||||
| Land and Ocean | +0.77 ± 0.72 | +1.39 ± 1.30 | Warmest | 42nd | 2019 | +4.20 | +7.56 |
| Coolest | 101st | 1902 | -3.73 | -6.71 | |||
| Ties: 1950 | |||||||

The most current data can be accessed via the Global Surface Temperature Anomalies page.
Select national information is highlighted below. Please note that different countries report anomalies with respect to different base periods. The information provided here is based directly upon these data:
- Portugal had a very warm March, with a national average temperature that was 0.66°C (1.19°F) above the 1981–2010 average. The nation's above-average mean temperature was mainly driven by a very high national maximum temperature (+1.65°C / +2.97°F), which ranked as the fifth highest March maximum temperature since 2000.
- Cooler-than-average conditions were present across much of Austria during March 2021. Austria's national temperature was 0.8°C (1.4°F) below the 1991–2020 average—resulting in the coldest March since 2018.
- Hong Kong had its warmest March on record, with a mean temperature that was 2.9°C (5.2°F) above the 1981–2010 average.
Year-to-date Temperature: January–March 2021

The global surface temperature for January–March 2021 tied with 2007 as the ninth highest for this year-to-date period at 0.76°C (1.37°F) above the 20th century average. The global land-only temperature was also the ninth highest on record, while the global ocean-only temperature tied with January–March of 1998 as the eighth highest in the 142-year record. According to a statistical analysis done by NCEI scientists, the year 2021 is very likely to rank among the ten warmest years on record and only has a 6% chance to rank among the five warmest years on record.
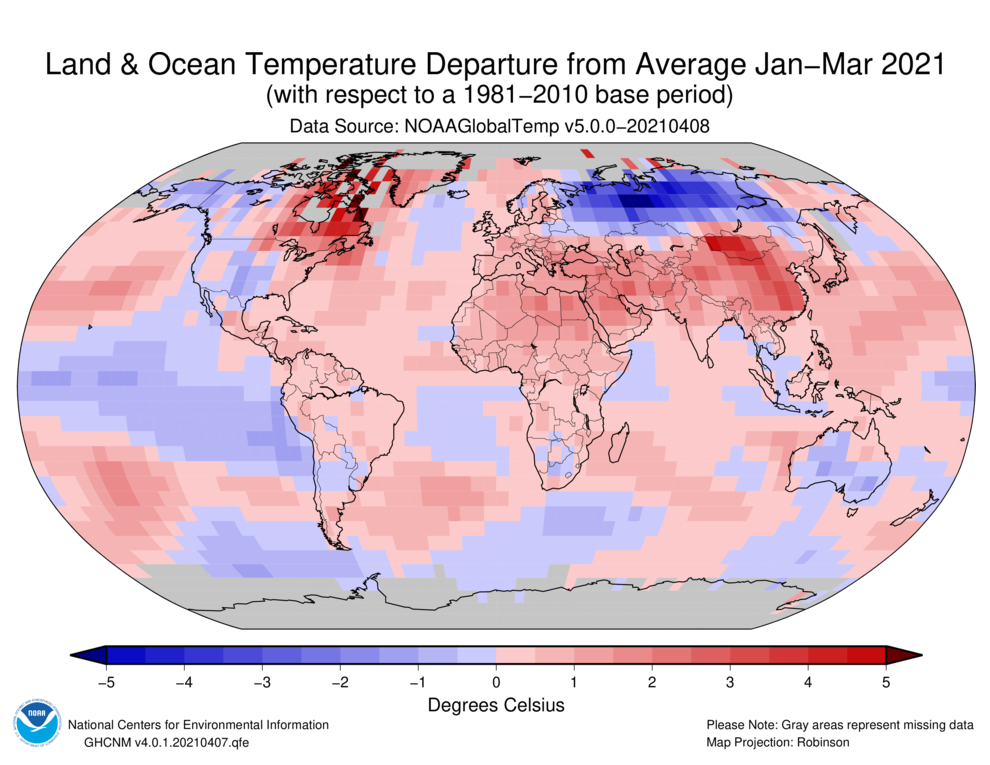

During the first three months of the year, the most notable high temperature departures were present across eastern Canada and southern Asia, where temperatures were at least 2.0°C (3.6°F) above average. Other notable areas include parts of the Pacific and Atlantic oceans, which had temperature departures of +1.5°C (+2.7°F) or higher. Record warm January–March temperatures were seen across parts of the Atlantic and Pacific oceans, as well as parts of Mongolia, China, and the Mediterranean Sea. Notable cool temperatures of -1.5°C (-2.7°F) or cooler were observed across parts of Alaska, northwestern Canada, northern Russia, Australia, and across parts of the tropical Pacific Ocean. However, no land or ocean areas had a record-cold January–March.
Regionally, Asia and the Caribbean region had their fourth and eighth highest January–March temperature, respectively, on record. Meanwhile, Oceania had its smallest January–March temperature departure since 2012.
| January–March | Anomaly | Rank (out of 142 years) | Records | ||||
|---|---|---|---|---|---|---|---|
| °C | °F | Year(s) | °C | °F | |||
| Global | |||||||
| Land | +1.29 ± 0.17 | +2.32 ± 0.31 | Warmest | 9th | 2016 | +2.22 | +4.00 |
| Coolest | 134th | 1893 | -1.32 | -2.38 | |||
| Ocean | +0.56 ± 0.16 | +1.01 ± 0.29 | Warmest | 8th | 2016 | +0.87 | +1.57 |
| Coolest | 135th | 1904 | -0.51 | -0.92 | |||
| Ties: 1998 | |||||||
| Land and Ocean | +0.76 ± 0.17 | +1.37 ± 0.31 | Warmest | 9th | 2016 | +1.23 | +2.21 |
| Coolest | 134th | 1904 | -0.59 | -1.06 | |||
| Ties: 2007 | |||||||
| Northern Hemisphere | |||||||
| Land | +1.55 ± 0.21 | +2.79 ± 0.38 | Warmest | 8th | 2020 | +2.56 | +4.61 |
| Coolest | 135th | 1893 | -1.61 | -2.90 | |||
| Ocean | +0.70 ± 0.15 | +1.26 ± 0.27 | Warmest | 6th | 2016 | +0.99 | +1.78 |
| Coolest | 137th | 1904 | -0.56 | -1.01 | |||
| Land and Ocean | +1.02 ± 0.17 | +1.84 ± 0.31 | Warmest | 7th | 2016 | +1.58 | +2.84 |
| Coolest | 136th | 1893 | -0.91 | -1.64 | |||
| Southern Hemisphere | |||||||
| Land | +0.63 ± 0.13 | +1.13 ± 0.23 | Warmest | 20th | 2016 | +1.37 | +2.47 |
| Coolest | 123rd | 1918 | -0.88 | -1.58 | |||
| Ocean | +0.47 ± 0.16 | +0.85 ± 0.29 | Warmest | 15th | 2016 | +0.80 | +1.44 |
| Coolest | 128th | 1917 | -0.52 | -0.94 | |||
| Ties: 2013 | |||||||
| Land and Ocean | +0.49 ± 0.15 | +0.88 ± 0.27 | Warmest | 19th | 2016 | +0.88 | +1.58 |
| Coolest | 124th | 1917 | -0.58 | -1.04 | |||
| Arctic | |||||||
| Land and Ocean | +0.59 ± 0.63 | +1.06 ± 1.13 | Warmest | 45th | 2016 | +3.49 | +6.28 |
| Coolest | 98th | 1966 | -2.56 | -4.61 | |||


Precipitation
March Precipitation
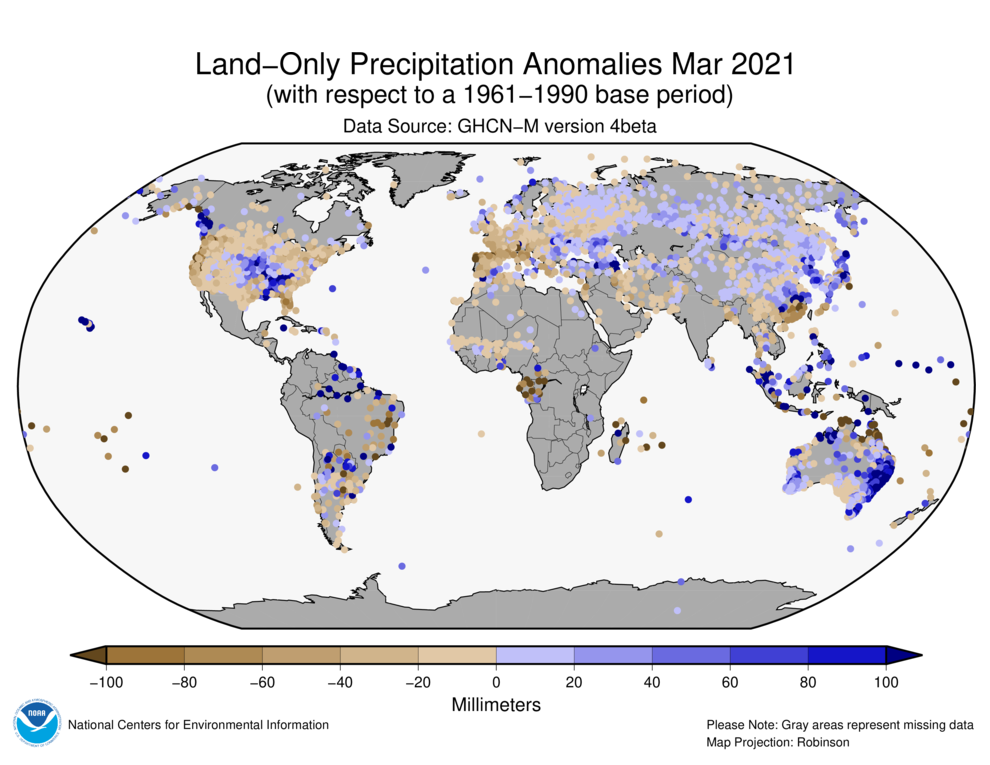

The maps shown above represent precipitation percent of normal (left, using a base period of 1961–1990) and precipitation percentiles (right, using the period of record) based on the GHCN dataset of land surface stations. As is typical, precipitation anomalies during March 2021 varied significantly around the world. March 2021 precipitation was generally drier than normal across parts of the northern, western, southern, and eastern contiguous U.S., northeastern Brazil, southern Chile, western and central Europe, and across parts of southern Asia. Wetter-than-average conditions were present across parts the central contiguous U.S., northeastern South America, across parts of the northern half of Asia, and across parts of western and eastern Australia.
Select national information is highlighted below. (Please note that different countries report anomalies with respect to different base periods. The information provided here is based directly upon these data):
- Australia had a wetter-than-average March, with a national average precipitation total of 80.8 mm, which is 28% above average. All Australian regions had near- to above-average March. The region with the highest precipitation total was New South Wales, which had 153% above average precipitation. This was New South Wales second wettest March in the 122-year record.
- Tropical Cyclone Niran, formed in the South Pacific Ocean, was the second Category 5 cyclone in 2021. The cyclone caused widespread damage in New Caledonia, even though the strongest winds remained offshore. Niran didn't make landfall in Australia, but heavy rain and across parts of Queensland were associated with the storm.
Global Precipitation Climatology Project (GPCP)
The following analysis is based upon the Global Precipitation Climatology Project (GPCP) Interim Climate Data Record. It is provided courtesy of the GPCP Principal Investigator team at the University of Maryland.
The Global Precipitation Climatology Project (GPCP) monthly data set is a long-term (1979-present) analysis (Adler et al., 2018) using a combination of satellite and gauge information. An interim GPCP analysis completed within ~10 days of the end of the month allows its use in climate monitoring.
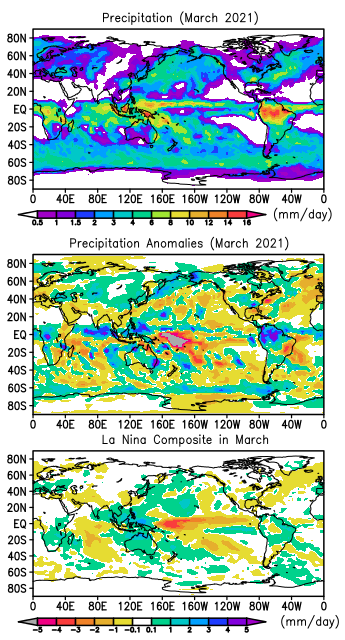
In the equinox month of March, the sun is over the Equator during its movement north, and in the tropical eastern Pacific Ocean the atmosphere gives a hint of what the tropical circulation might be if we had an aqua planet (all ocean) and a "straight up" instead of an inclined axis, eliminating seasons. A double ITCZ (Inter-Tropical Convergence Zone), with east-west oriented rain bands just north and south of the Equator is evident in the mean precipitation map for the past month (Fig. 1, top panel) all the way from the dateline to the South American coast. With a minimum in rainfall right along the Equator related to generally descending motion there, and ascending branches associated with the mean rain bands a picture emerges of two similar Hadley-type circulation cells in each hemisphere centered right on the Equator. This feature is often observed at this time of year, although usually not also at the September equinox. This transition month also features northward shifting of precipitation features, including a general receding of the Asian monsoon from Australia and northward shifts of climatological rainfall features in Africa and South America.
The most intense regional maximum this month is over northern South America, with a second area of scattered heavy rain over the Maritime Continent area. Although the SST cold anomalies in the central Pacific have weakened in the past month with an apparent transition toward neutral ENSO conditions, the rainfall anomaly field is still partially related to the presence of the La Niña. The March precipitation anomaly map (Fig. 1, middle panel) still shows some La Niña features (compare with the March La Niña composite in Fig. 1, bottom panel), starting with the large rainfall deficit in the central Pacific, typical of La Niña and a continuation of conditions there for previous months back to late 2020. The rain maximum over northern South America and its large positive anomaly is nearly opposite the La Niña composite, and this heavy rain feature was related to significant floods in Colombia, Peru, Bolivia and northern Brazil. Over Indonesia and Malaysia floods were also a result of heavy rain associated with this large-scale circulation/rainfall feature, which is typical of La Niña.
La Niña also effects Australia. The past summer months had been the rainiest in five years on the continent as a whole and moving into March the anomaly map still shows some positive features, including the strong feature in the southeast. In late March a rain system stalled just off and along Australia's southeast coast producing heavy rains there (over 400 mm over seven days) with associated flooding around Sydney and further north along the coast and westward into the country's interior. Africa shows fairly small-scale surplus and deficit rain features not correlated to the La Niña composite. In South America a rainfall deficit in southeast Brazil has helped to continue the drought conditions there.
Over the North Pacific the area of the mid-latitude maximum generally has negative anomalies, although a couple of small positive features are present, including one located over the Hawaiian Islands associated with flooding occurring in early March, especially in Maui. The mid-latitude Pacific maximum is shifted somewhat northward with a resulting positive anomaly stretching form northeast of Japan and into western Alaska.
Over North America the effect of the La Niña has weakened somewhat, although rainfall deficits still exist along the west coast and the southwest U.S. and Mexico with concerns about dry conditions and the early fire season in Arizona and New Mexico. To the east a distinct rainfall maximum is associated with a rainfall surplus in the lower Mississippi Valley and storms and floods over the area with serious flooding in Nashville, TN near the end of the month. Another feature to the northwest is located in eastern Colorado, Wyoming and areas to the east and is the result of a very significant snowstorm in the region. Despite that storm, the winter snowpack in Colorado near the end of the season is below average, especially in the southwest part of the state, a condition normal with winter/early spring La Niña conditions.
The northeast U.S. was below normal in precipitation and that pattern held along the northwest edge of the mid-latitude maximum extending into the Atlantic Ocean. A narrow positive anomaly was located along the axis of this ocean feature, but along the southeast edge of the feature a rainfall deficit is evident extending from the ocean into western and central Europe. Warm and dry conditions dominated March there adding to drought conditions throughout the region.
Background discussion of long-term means, variations and trends of global precipitation can be found in Adler et al. (2017).
Ocean Heat Content
Ocean Heat Content (OHC) is essential for understanding and modeling global climate since > 90% of excess heat in the Earth's system is absorbed by the ocean. Further, expansion due to increased ocean heat contributes to sea level rise. Change in OHC is calculated from the difference of observed temperature profiles from the long-term mean.
| Basin | 0-700 meters | Rank (1955-2023) | |||||
|---|---|---|---|---|---|---|
| Entire Basin | Northern Hemisphere | Southern Hemisphere | ||||
| Atlantic | 8.409 | 3rd | 4.765 | 3rd | 3.644 | 1st |
| Indian | 3.321 | 10th | 1.004 | 1st | 2.316 | 15th |
| Pacific | 7.257 | 5th | 3.869 | 1st | 3.387 | 7th |
| World | 18.986 | 4th | 9.639 | 1st | 9.348 | 6th |
| Source: Basin time series of heat content | ||||||

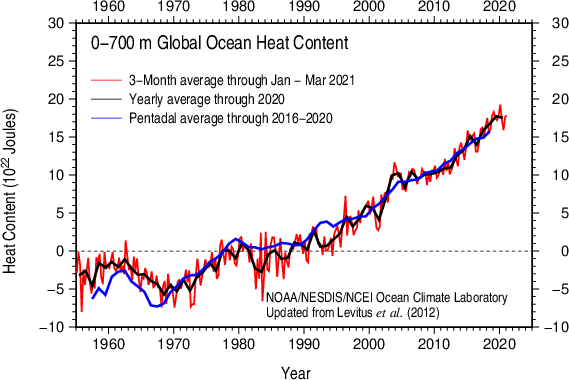
Global OHC for January–March 2021 is the third highest January–March OHC in our records, which extend back to 1955; it is statistically the same as the OHC of January–March 2018. Overall, the latest quarterly OHC reveals widespread warmer than normal conditions relative to the 1955–2006 mean, a situation observed since the end of 2016. However, a drop in the global OHC since January–March 2020 has occurred, which coincides with the development in the last year of a La Niña event. During 2020, OHC decreased in April–June and again in July–September, compared to January–March, before increasing in October-December, and staying unchanged for January–March 2021. The cool signal first observed in July–September 2020, < -10x105 J/m3, in the tropical and subtropical Eastern Pacific Ocean and extending westward around the Equator from the South America coast to about 170E strengthened in October–December 2020, and it has now expanded poleward to 30N and 30S latitude along the coast of Central and South America. Otherwise, global OHC conditions are similar to those observed during October–December 2020: Much higher, > 30x105 J/m3, than normal OHC conditions continue to exist in the Gulf Stream/North Atlantic Current, the South Atlantic Ocean, and the Kuroshio Current/Kuroshio Extension/North Pacific Current; Cool conditions, < -10x105 J/m3, continue in the Southwestern Indian Ocean, and persist in the subpolar North Atlantic Ocean south of Greenland and Iceland. The warm signal around the Equator in the western Pacific Ocean and eastern Indian Ocean has strengthened, and it now extends southeastward in the Pacific Ocean.
References
- Adler, R., G. Gu, M. Sapiano, J. Wang, G. Huffman 2017. Global Precipitation: Means, Variations and Trends During the Satellite Era (1979-2014). Surveys in Geophysics 38: 679-699, doi:10.1007/s10712-017-9416-4
- Adler, R., M. Sapiano, G. Huffman, J. Wang, G. Gu, D. Bolvin, L. Chiu, U. Schneider, A. Becker, E. Nelkin, P. Xie, R. Ferraro, D. Shin, 2018. The Global Precipitation Climatology Project (GPCP) Monthly Analysis (New Version 2.3) and a Review of 2017 Global Precipitation. Atmosphere. 9(4), 138; doi:10.3390/atmos9040138
- Gu, G., and R. Adler, 2022. Observed Variability and Trends in Global Precipitation During 1979-2020. Climate Dynamics, doi:10.1007/s00382-022-06567-9
- Huang, B., Peter W. Thorne, et. al, 2017: Extended Reconstructed Sea Surface Temperature version 5 (ERSSTv5), Upgrades, validations, and intercomparisons. J. Climate, doi: 10.1175/JCLI-D-16-0836.1
- Huang, B., V.F. Banzon, E. Freeman, J. Lawrimore, W. Liu, T.C. Peterson, T.M. Smith, P.W. Thorne, S.D. Woodruff, and H-M. Zhang, 2016: Extended Reconstructed Sea Surface Temperature Version 4 (ERSST.v4). Part I: Upgrades and Intercomparisons. J. Climate, 28, 911-930, doi:10.1175/JCLI-D-14-00006.1.
- Menne, M. J., C. N. Williams, B.E. Gleason, J. J Rennie, and J. H. Lawrimore, 2018: The Global Historical Climatology Network Monthly Temperature Dataset, Version 4. J. Climate, in press. https://doi.org/10.1175/JCLI-D-18-0094.1.
- Peterson, T.C. and R.S. Vose, 1997: An Overview of the Global Historical Climatology Network Database. Bull. Amer. Meteorol. Soc., 78, 2837-2849.
- Vose, R., B. Huang, X. Yin, D. Arndt, D. R. Easterling, J. H. Lawrimore, M. J. Menne, A. Sanchez-Lugo, and H. M. Zhang, 2021. Implementing Full Spatial Coverage in NOAA's Global Temperature Analysis. Geophysical Research Letters 48(10), e2020GL090873; doi:10.1029/2020gl090873.