Introduction
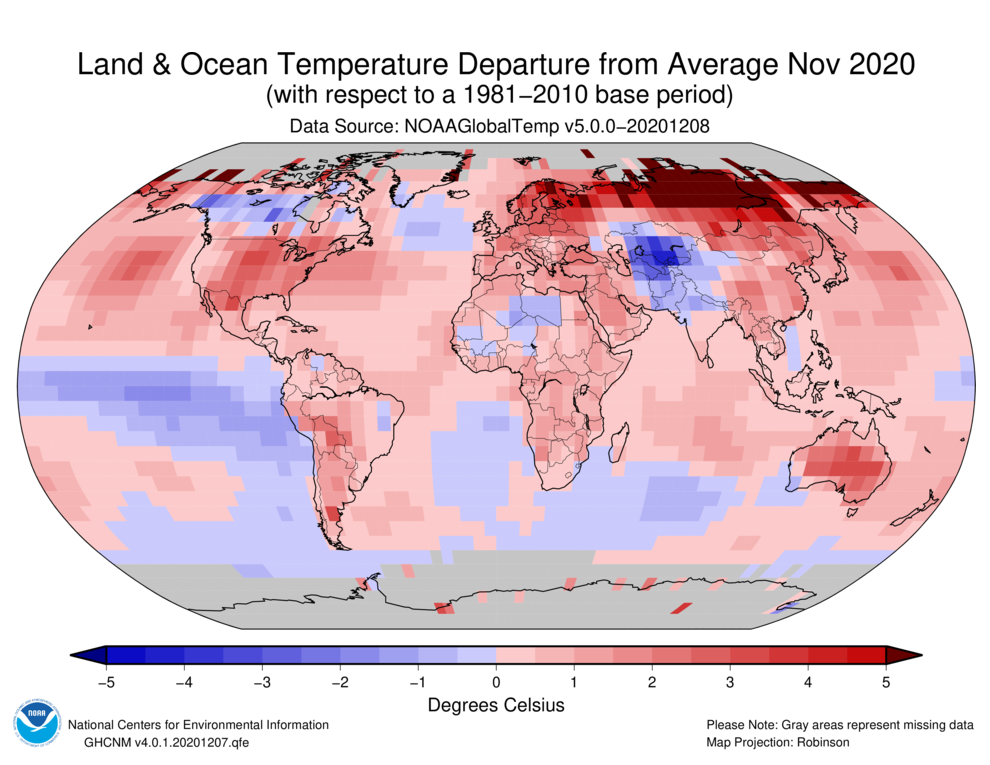
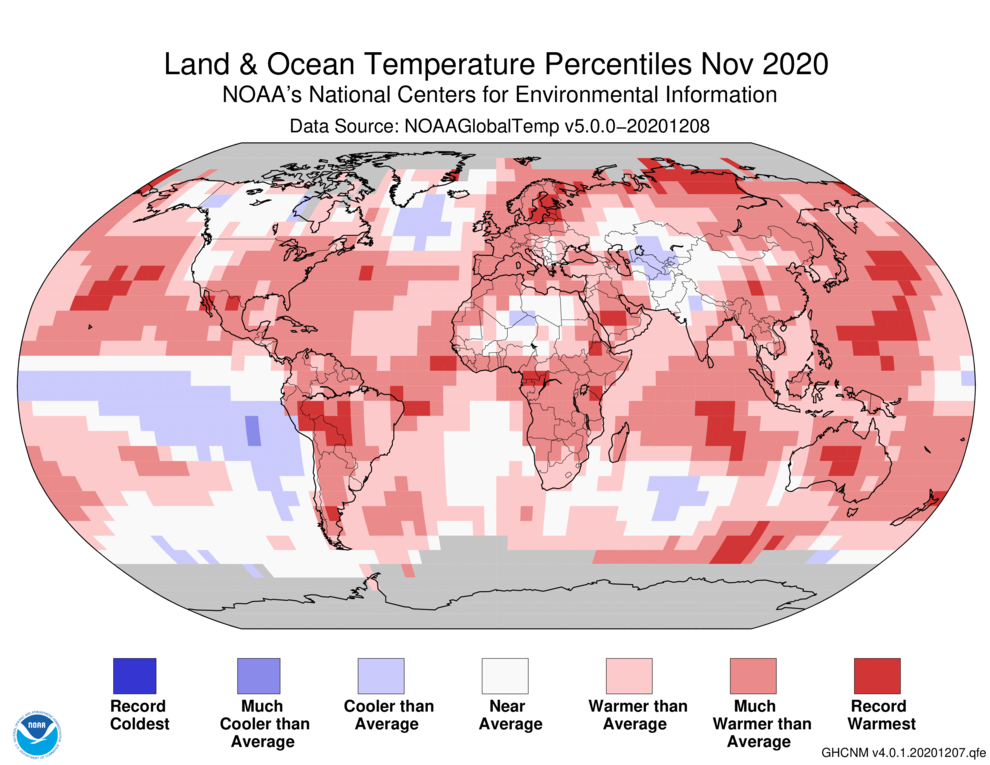
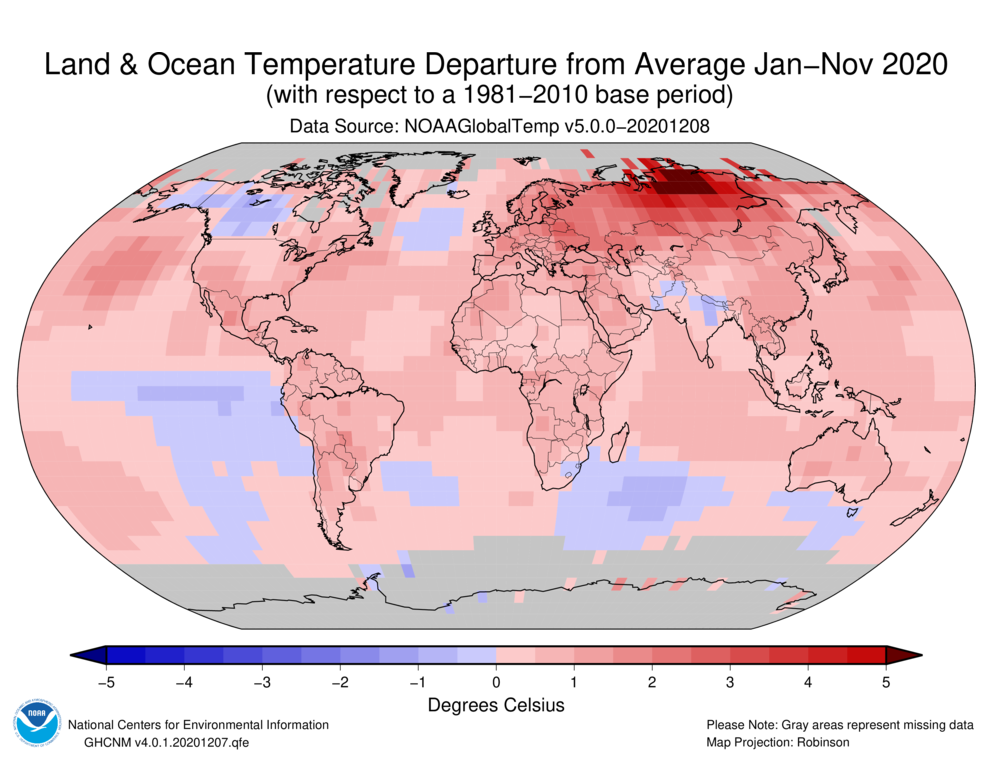
Temperature anomalies and percentiles are shown on the gridded maps below. The anomaly map on the left is a product of a merged land surface temperature (Global Historical Climatology Network, GHCN) and sea surface temperature (ERSST version 5) anomaly analysis. Temperature anomalies for land and ocean are analyzed separately and then merged to form the global analysis. For more information, please visit NCEI's Global Surface Temperature Anomalies page. The percentile map on the right provides additional information by placing the temperature anomaly observed for a specific place and time period into historical perspective, showing how the most current month, season or year compares with the past.
Temperature
In the atmosphere, 500-millibar height pressure anomalies correlate well with temperatures at the Earth's surface. The average position of the upper-level ridges of high pressure and troughs of low pressure—depicted by positive and negative 500-millibar height anomalies on the November 2020 and September–November 2020 maps—is generally reflected by areas of positive and negative temperature anomalies at the surface, respectively.
Monthly Temperature: November 2020
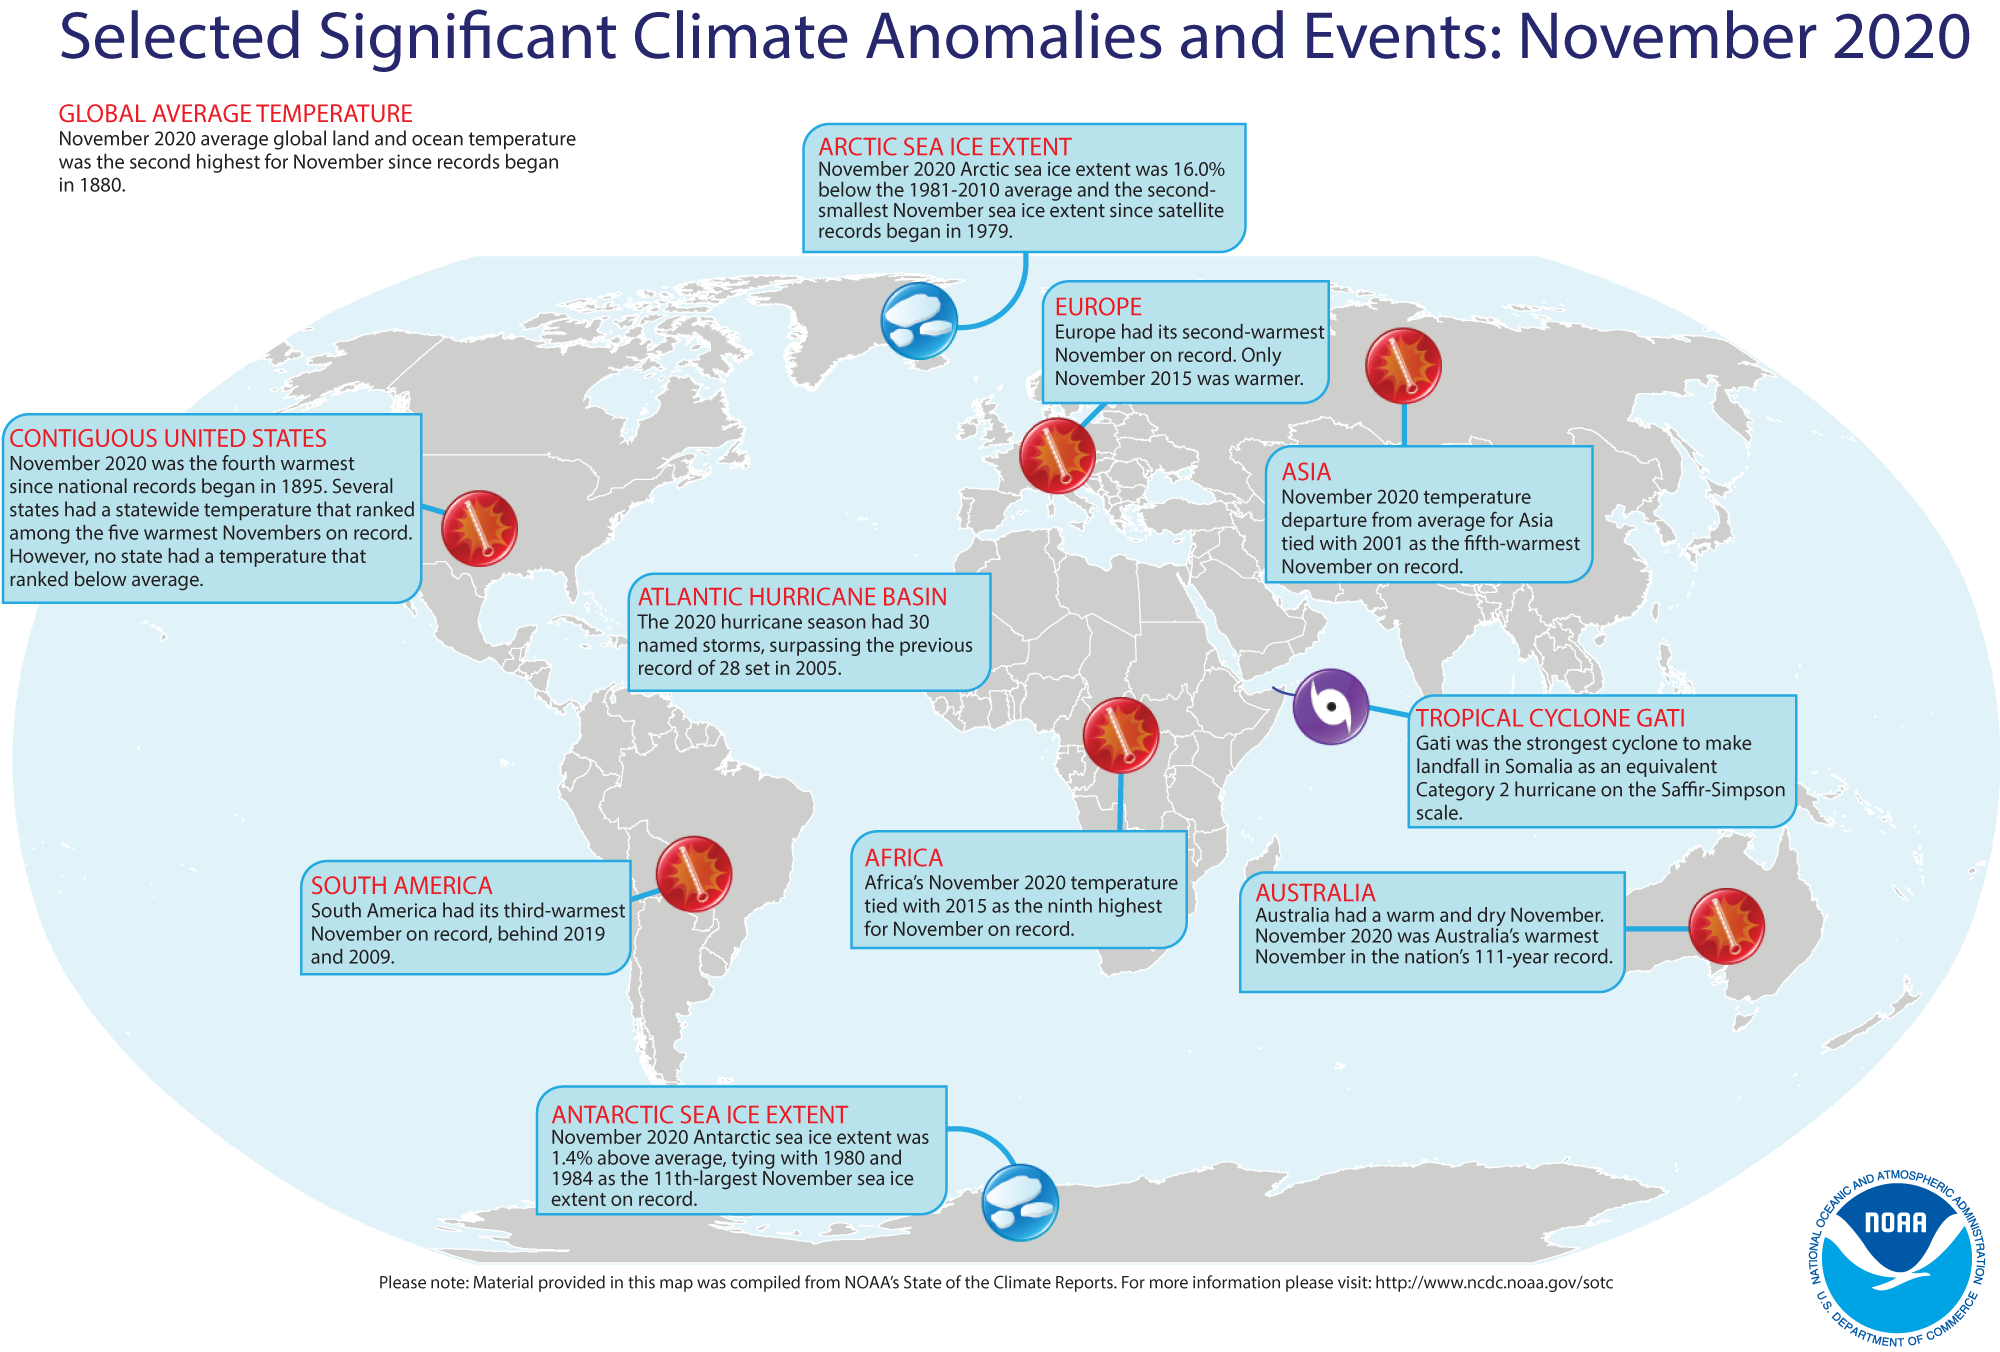
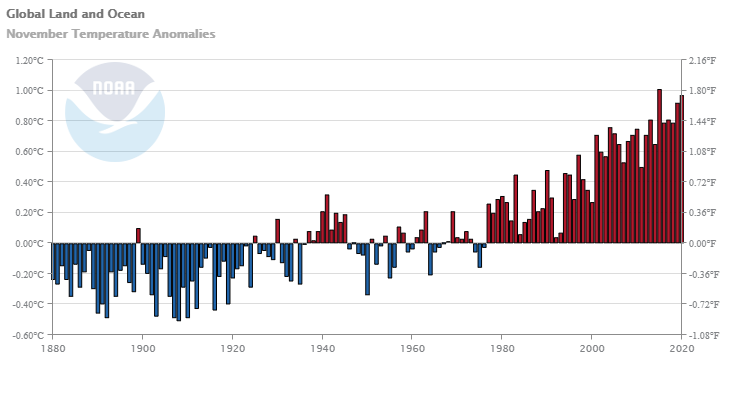
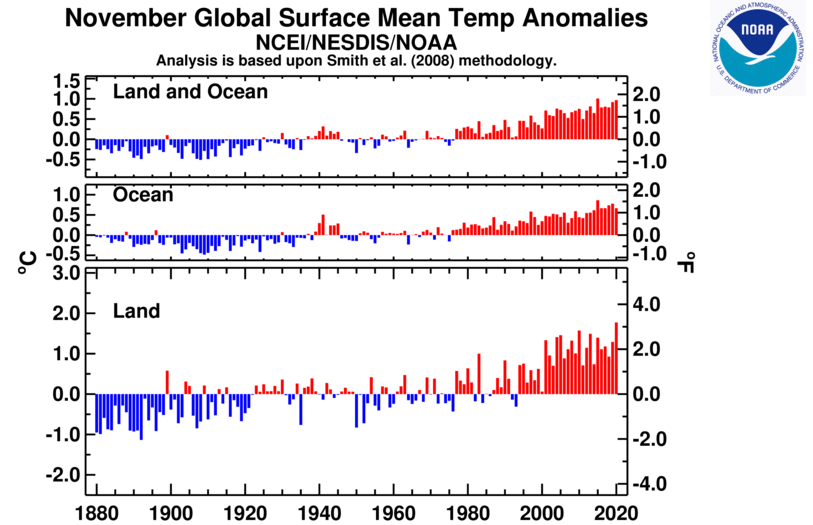
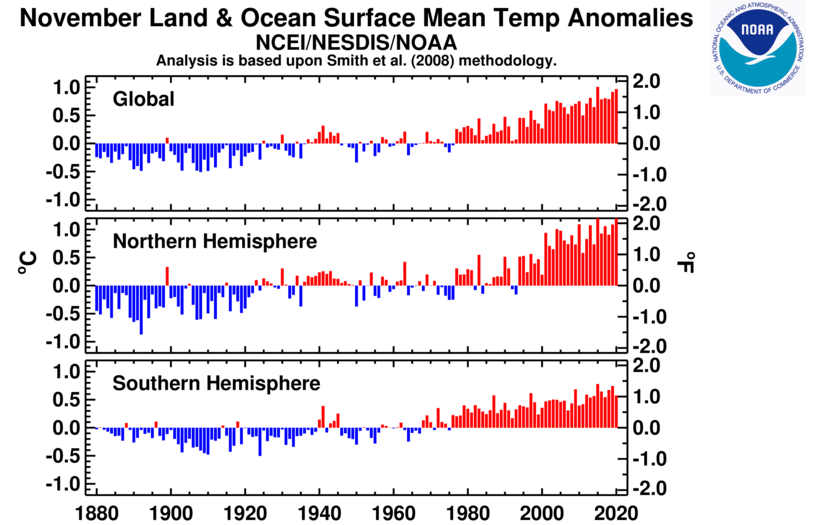
The combined global average temperature over the land and ocean surfaces for November 2020 was 0.97°C (1.75°F) above the 20th century average of 12.9°C (55.2°F). This was the second warmest November in the 141-year global record, behind the record warm November set in 2015 (+1.01°C / +1.82°F). The 10 warmest Novembers have all occurred since 2004; the five warmest Novembers have occurred since 2013. November 2020 also marked the 44th consecutive November and the 431st consecutive month with temperatures, at least nominally, above the 20th-century average.
The month of November was characterized by warmer-than-average temperatures across much of the globe, with the most notable warm temperature departures from average across western and northern Alaska, most of the contiguous U.S., northern Europe, northern Asia, Australia, and across parts of South America, the North Pacific Ocean, the Bering Sea and parts of the western Antarctic, where temperatures were at least 3.0°C (5.4°F) above average. Record-warm November temperatures were observed across parts each of the continents where data is available and across parts of all of the major oceans. As a whole, about 6.74% of the world's land and ocean surfaces had a record-warm November temperature—the fourth highest November percentage since records began in 1951. Only Novembers of 2015 (9.73%), 2019 (9.23%), and 2010 (7.61%) had a higher percentage of record warm November temperatures. Cooler-than-average November temperatures were observed across parts of Canada, northern Africa, southwestern Asia, across the eastern and central tropical Pacific Ocean, the northern Atlantic and southern oceans. However, no land or ocean areas had record-cold November temperatures.
According to NCEI's regional analysis, Oceania had its warmest November on record, with a temperature departure from average of +2.06°C (+3.71°F). This value shattered the previous record of 1.85°C (3.33°F) by 0.21°C (0.38°F). Seven of Oceania's ten warmest Novembers have occurred since 2002. Australia had its warmest November in the nation's 111-year record with a national mean temperature departure of +2.47°C (+4.45°F). This surpassed the now second highest November temperature set in 2014 by 0.40°C (0.72°F). The national maximum and minimum temperatures were also the highest on record. All regions had a top five warm November, with South Australia and the Northern Territory having their warmest November on record. New Zealand also had a very warm November, with a national temperature of 14.6°C (58.3°F) or 0.9°C (1.6°F) above the 1981–2010 average. November 2020 marked New Zealand's 46th consecutive month with temperatures above average. Several locations across New Zealand had a top five warm November. Of note, the town of Motueka had their warmest November since temperature records began in 1956.
Europe, as a whole, had its second highest November temperature departure on record at +2.15°C (+3.87°F), which is 0.33°C (0.59°F) less than the record set in 2015. The United Kingdom's national mean temperature for November 2020 was 7.7°C (45.9°F) or 1.5°C (2.7°F) above average—this was the sixth highest since national records began in 1884. Regionally, England and Scotland had their fifth warmest November on record. According to Norway's Meteorologisk Institutt, Norway's November 2020 temperature was 4.6°C (8.3°F) above average and tied with 2011 as the highest November since national records began in 1900. Spain had its third warmest November since national records began in 1961, with a temperature departure of 2.0°C (3.6°F) above average. Only Novembers of 1983 and 2006 were warmer.
South America (third warmest), the Hawaiian region (fourth warmest), and Asia (fifth warmest) had a November temperature that ranked among the five highest on record. November 2020 was Kingdom of Bahrain's warmest November since national records began in 1902, with a mean temperature departure of +1.9°C (+3.4°F). The previous record set in 1954 and, again in 2017, was 0.2°C (0.4°F) cooler. The nation's minimum and maximum temperatures were the second and fifth highest on record, respectively.
| November | Anomaly | Rank (out of 141 years) | Records | ||||
|---|---|---|---|---|---|---|---|
| °C | °F | Year(s) | °C | °F | |||
| Global | |||||||
| Land | +1.77 ± 0.23 | +3.19 ± 0.41 | Warmest | 1st | 2020 | +1.77 | +3.19 |
| Coolest | 141st | 1892 | -1.13 | -2.03 | |||
| Ocean | +0.67 ± 0.15 | +1.21 ± 0.27 | Warmest | 4th | 2015 | +0.86 | +1.55 |
| Coolest | 138th | 1909 | -0.48 | -0.86 | |||
| Ties: 2016, 2017 | |||||||
| Land and Ocean | +0.97 ± 0.17 | +1.75 ± 0.31 | Warmest | 2nd | 2015 | +1.01 | +1.82 |
| Coolest | 140th | 1908 | -0.51 | -0.92 | |||
| Northern Hemisphere | |||||||
| Land | +1.88 ± 0.24 | +3.38 ± 0.43 | Warmest | 2nd | 2010 | +2.03 | +3.65 |
| Coolest | 140th | 1892 | -1.40 | -2.52 | |||
| Ocean | +1.01 ± 0.14 | +1.82 ± 0.25 | Warmest | 2nd | 2015 | +1.10 | +1.98 |
| Coolest | 140th | 1912 | -0.54 | -0.97 | |||
| Ties: 2019 | |||||||
| Land and Ocean | +1.34 ± 0.19 | +2.41 ± 0.34 | Warmest | 1st | 2020 | +1.34 | +2.41 |
| Coolest | 141st | 1892 | -0.87 | -1.57 | |||
| Southern Hemisphere | |||||||
| Land | +1.49 ± 0.13 | +2.68 ± 0.23 | Warmest | 1st | 2019, 2020 | +1.49 | +2.68 |
| Coolest | 141st | 1917 | -0.80 | -1.44 | |||
| Ties: 2019 | |||||||
| Ocean | +0.40 ± 0.15 | +0.72 ± 0.27 | Warmest | 20th | 2015 | +0.68 | +1.22 |
| Coolest | 122nd | 1924 | -0.48 | -0.86 | |||
| Ties: 1982 | |||||||
| Land and Ocean | +0.57 ± 0.15 | +1.03 ± 0.27 | Warmest | 9th | 2015 | +0.78 | +1.40 |
| Coolest | 133rd | 1924 | -0.50 | -0.90 | |||
| Arctic | |||||||
| Land and Ocean | +3.38 ± 0.76 | +6.08 ± 1.37 | Warmest | 1st | 2020 | +3.38 | +6.08 |
| Coolest | 141st | 1902 | -2.63 | -4.73 | |||
The most current data can be accessed via the Global Surface Temperature Anomalies page.
Seasonal Temperature: September–November 2020
The September–November period is defined as the Northern Hemisphere's meteorological fall and the Southern Hemisphere's meteorological spring.
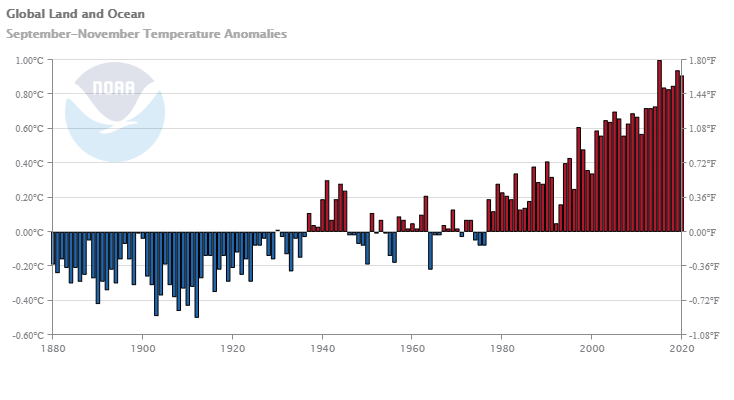
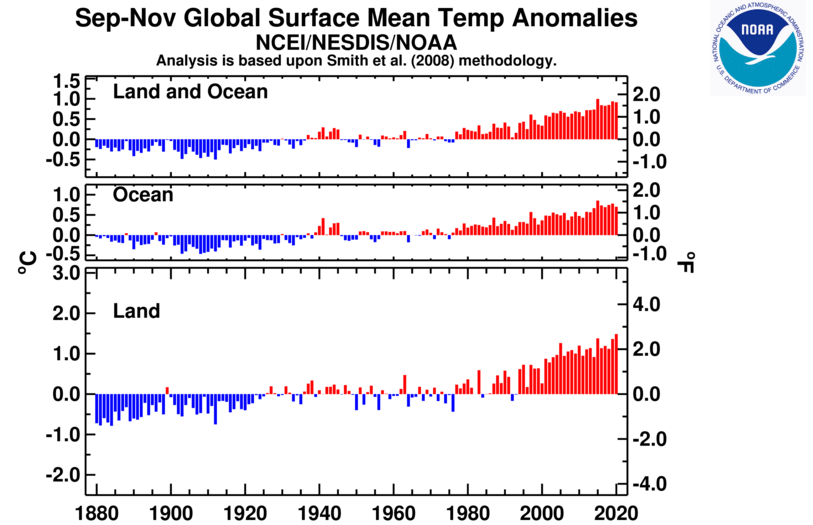
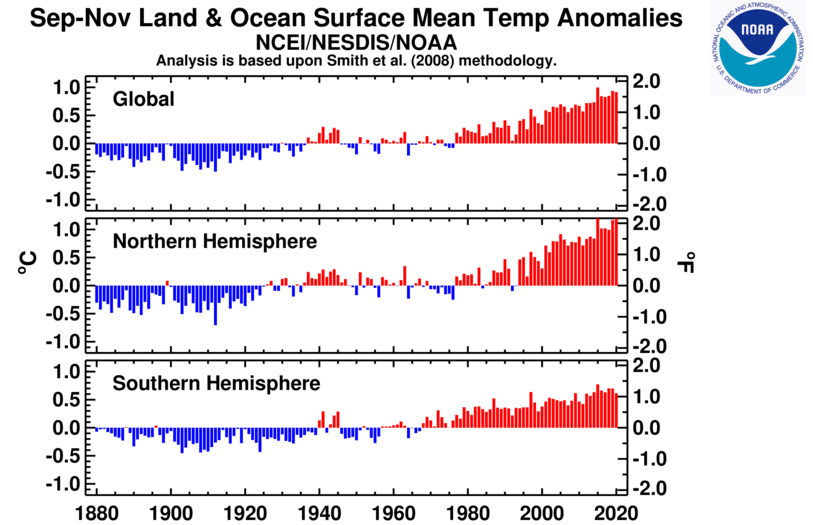
The September–November 2020 global land and ocean surface temperature was the third highest on record at 0.91°C (1.64°F) above average. Only September–Novembers of 2015 and 2019 were warmer. The ten highest September–November periods have occurred since 2005, with the five warmest occurring since 2015.
The three-month period of September–November was characterized by warmer-than-average conditions, with the most notable warm temperature departures across much of northern and eastern Europe and northern Russia, where temperatures were at least 3.0°C (5.6°F) above average. Record-warm September–November temperatures were observed across parts of northern and eastern Europe, northern Asia, North America, South America, Australia, as well as across the north and western Pacific, Atlantic, and Indian oceans. Cooler-than-average temperatures were observed across the eastern and central tropical Pacific Ocean and across parts of Canada, the North Atlantic Ocean, southwestern Indian Ocean, and southwestern Asia. However, no land or ocean areas had record-cold September–November temperatures.
The Northern Hemisphere had its second warmest autumn, only 0.01°C (0.02°F) behind the record set in 2015. Meanwhile, the Southern Hemisphere had its ninth warmest spring on record.
South America, Europe, and Oceania had their warmest September–November period on record. South America's three-month temperature departure of 1.59°C (2.86°F) surpassed the previous record set only last year (2019) by 0.16°C (0.29°F). This was also South America's third warmest seasonal temperature departure on record, only behind June–August of 2015 (+1.80°C / +3.24°F) and December–February of 2016 (+1.62°C / +2.92°F). South America's seven warmest September–November period have occurred since 2012.
Europe's seasonal temperature departure of +2.24°C (+4.03°F) marked the first time Europe had a September–November temperature departure at or above 2.0°C (3.6°F). The now second warmest autumn was set in 2006. Europe's ten warmest autumn have occurred since 2000.
Oceania's spring temperature was 1.71°C (3.08°F) above average and exceeded the previous record set in 2015 by 0.10°C (0.18°F). The 10 warmest autumns for Oceania have occurred since 2002. This was also the third highest seasonal temperature departure for any season since records began in 1910. Only March–May 2016 and December 2015–February 2016 had a higher temperature departure from average.
New Zealand's spring 2020 was 0.9°C (1.6°F) above average and the fifth-warmest spring on record since national records began in 1909. According to New Zealand's NIWA, four of New Zealand's five warmest springs have occurred during La Niña conditions in the tropical Pacific Ocean.
Spring 2020 was Australia's warmest spring on record, with a mean temperature departure of +2.03°C (+3.65°F). This was 0.22°C (0.40°F) above the previous record set in 2014. The nation's above-average mean temperature was mainly driven by the very warm minimum temperatures across the nation. As a whole, the nation's minimum temperature was also the highest on record at 1.91°C (3.44°F) above average, exceeding the previous record set in 1998 by 0.45°C (0.81°F). The national maximum temperature was the fifth highest on record. Regionally, Queensland and the Northern Territory had their highest spring temperature on record, while the rest of the regions had a top 5 warm spring.
Asia had its second warmest September–November, while the African, the Caribbean and Hawaiian regions had a temperature departure that ranked among the seven warmest such periods on record. The Hong Kong Observatory reported that Hong Kong had its fourth warmest September–November on record, with a mean temperature +0.8°C (+1.4°F) above average.
| September–November | Anomaly | Rank (out of 141 years) | Records | ||||
|---|---|---|---|---|---|---|---|
| °C | °F | Year(s) | °C | °F | |||
| Global | |||||||
| Land | +1.49 ± 0.23 | +2.68 ± 0.41 | Warmest | 1st | 2020 | +1.49 | +2.68 |
| Coolest | 141st | 1881, 1884 | -0.78 | -1.40 | |||
| Ocean | +0.70 ± 0.15 | +1.26 ± 0.27 | Warmest | 5th | 2015 | +0.85 | +1.53 |
| Coolest | 137th | 1908 | -0.47 | -0.85 | |||
| Land and Ocean | +0.91 ± 0.16 | +1.64 ± 0.29 | Warmest | 3rd | 2015 | +1.00 | +1.80 |
| Coolest | 139th | 1912 | -0.50 | -0.90 | |||
| Northern Hemisphere | |||||||
| Land | +1.49 ± 0.22 | +2.68 ± 0.40 | Warmest | 1st | 2020 | +1.49 | +2.68 |
| Coolest | 141st | 1912 | -0.96 | -1.73 | |||
| Ocean | +1.02 ± 0.15 | +1.84 ± 0.27 | Warmest | 3rd | 2015 | +1.10 | +1.98 |
| Coolest | 139th | 1912 | -0.54 | -0.97 | |||
| Land and Ocean | +1.20 ± 0.18 | +2.16 ± 0.32 | Warmest | 2nd | 2015 | +1.21 | +2.18 |
| Coolest | 140th | 1912 | -0.70 | -1.26 | |||
| Southern Hemisphere | |||||||
| Land | +1.47 ± 0.14 | +2.65 ± 0.25 | Warmest | 1st | 2020 | +1.47 | +2.65 |
| Coolest | 141st | 1880 | -0.64 | -1.15 | |||
| Ocean | +0.45 ± 0.15 | +0.81 ± 0.27 | Warmest | 15th | 2015 | +0.66 | +1.19 |
| Coolest | 127th | 1903, 1908 | -0.44 | -0.79 | |||
| Land and Ocean | +0.61 ± 0.15 | +1.10 ± 0.27 | Warmest | 9th | 2015 | +0.77 | +1.39 |
| Coolest | 133rd | 1903 | -0.45 | -0.81 | |||
| Ties: 2012 | |||||||
| Arctic | |||||||
| Land and Ocean | +2.38 ± 0.39 | +4.28 ± 0.70 | Warmest | 1st | 2020 | +2.38 | +4.28 |
| Coolest | 141st | 1902 | -1.49 | -2.68 | |||
Year-to-date Temperature: January–November 2020
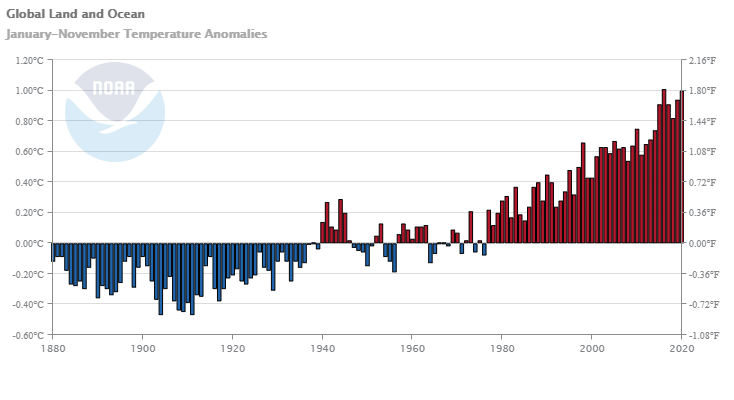
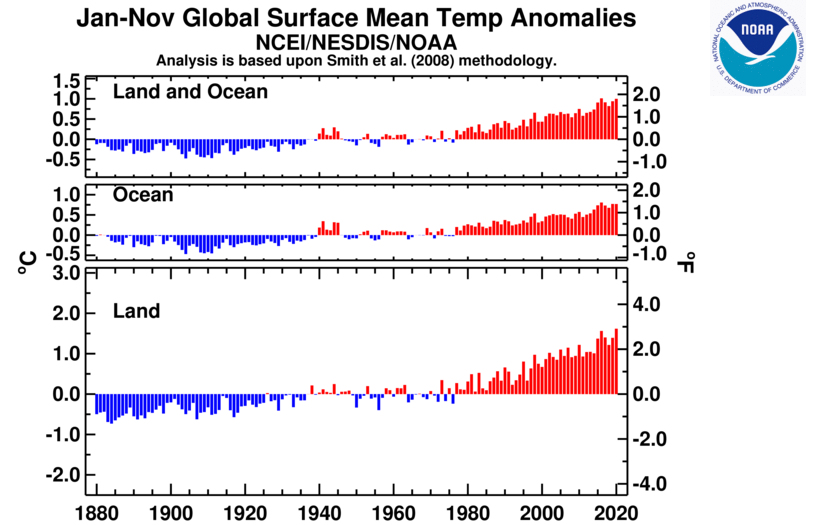
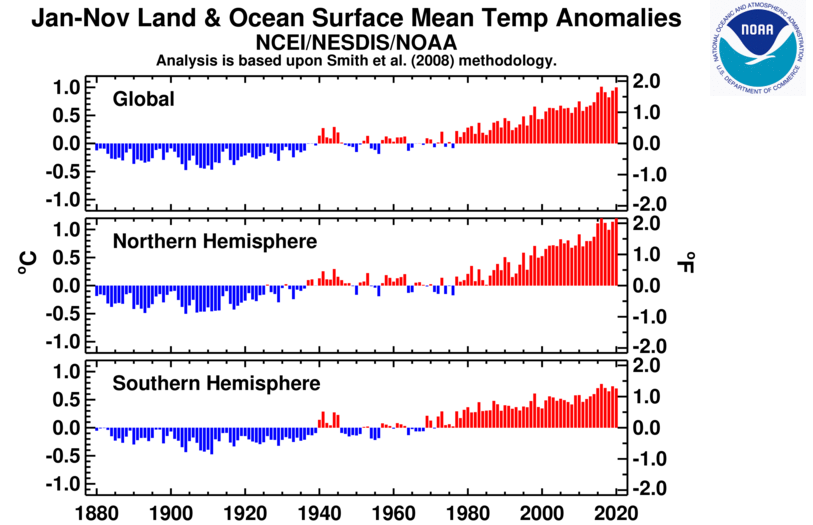
The January–November 2020 global temperature was the second highest on record at 1.00°C (1.80°F) above average and only 0.01°C (0.02°F) shy of tying the record set in 2016. According to NCEI's Annual Rankings Outlook, there is a 54% chance of 2020 ending as the warmest year on record. The 10 warmest January–November periods have occurred since 2005, with the six warmest all occurring since 2015.
Warmer-than-average temperatures were present across much of the globe during the 11-month period. The most notable warm temperature departures occurred across northern Asia where temperatures were at least 3.5°C (6.3°F) above average. Record-warm January–November temperatures were present across much of northern Asia and across parts of southeastern Asia, Europe, northern Africa, southern North America, South America as well as the Atlantic, Indian and Pacific oceans.
The global land-only temperature departure for the year-to-date was 1.62°C (2.92°F) above average and the highest for January–November on record. This was also the Northern Hemisphere's warmest January–November on record for the combined land and ocean, land-only, and ocean-only temperatures.
Regionally, Europe and Asia's year-to-date temperature departure were the highest in the 111-year record. This was the first time on record that the January–November temperature departure for both Europe and Asia was above 2.0°C (3.6°F). Asia's temperature of 2.21°C (3.98°F) was 0.56°C (1.01°F) above the previous record set in 2017.
South America, Oceania, and the Caribbean region had their second warmest year-to-date on record, while Africa had its fifth warmest on record.
| January–November | Anomaly | Rank (out of 141 years) | Records | ||||
|---|---|---|---|---|---|---|---|
| °C | °F | Year(s) | °C | °F | |||
| Global | |||||||
| Land | +1.62 ± 0.16 | +2.92 ± 0.29 | Warmest | 1st | 2020 | +1.62 | +2.92 |
| Coolest | 141st | 1884 | -0.73 | -1.31 | |||
| Ocean | +0.77 ± 0.17 | +1.39 ± 0.31 | Warmest | 2nd | 2016 | +0.81 | +1.46 |
| Coolest | 140th | 1904 | -0.47 | -0.85 | |||
| Ties: 2019 | |||||||
| Land and Ocean | +1.00 ± 0.16 | +1.80 ± 0.29 | Warmest | 2nd | 2016 | +1.01 | +1.82 |
| Coolest | 140th | 1904, 1911 | -0.47 | -0.85 | |||
| Northern Hemisphere | |||||||
| Land | +1.77 ± 0.17 | +3.19 ± 0.31 | Warmest | 1st | 2020 | +1.77 | +3.19 |
| Coolest | 141st | 1884 | -0.84 | -1.51 | |||
| Ocean | +1.00 ± 0.17 | +1.80 ± 0.31 | Warmest | 1st | 2020 | +1.00 | +1.80 |
| Coolest | 141st | 1904 | -0.52 | -0.94 | |||
| Land and Ocean | +1.29 ± 0.17 | +2.32 ± 0.31 | Warmest | 1st | 2020 | +1.29 | +2.32 |
| Coolest | 141st | 1904 | -0.50 | -0.90 | |||
| Southern Hemisphere | |||||||
| Land | +1.24 ± 0.14 | +2.23 ± 0.25 | Warmest | 2nd | 2019 | +1.30 | +2.34 |
| Coolest | 140th | 1917 | -0.77 | -1.39 | |||
| Ocean | +0.60 ± 0.17 | +1.08 ± 0.31 | Warmest | 5th | 2016 | +0.71 | +1.28 |
| Coolest | 137th | 1911 | -0.45 | -0.81 | |||
| Land and Ocean | +0.70 ± 0.17 | +1.26 ± 0.31 | Warmest | 5th | 2016 | +0.78 | +1.40 |
| Coolest | 137th | 1911 | -0.47 | -0.85 | |||
| Arctic | |||||||
| Land and Ocean | +2.26 ± 0.20 | +4.07 ± 0.36 | Warmest | 2nd | 2016 | +2.44 | +4.39 |
| Coolest | 140th | 1902 | -1.35 | -2.43 | |||
Precipitation
November Precipitation
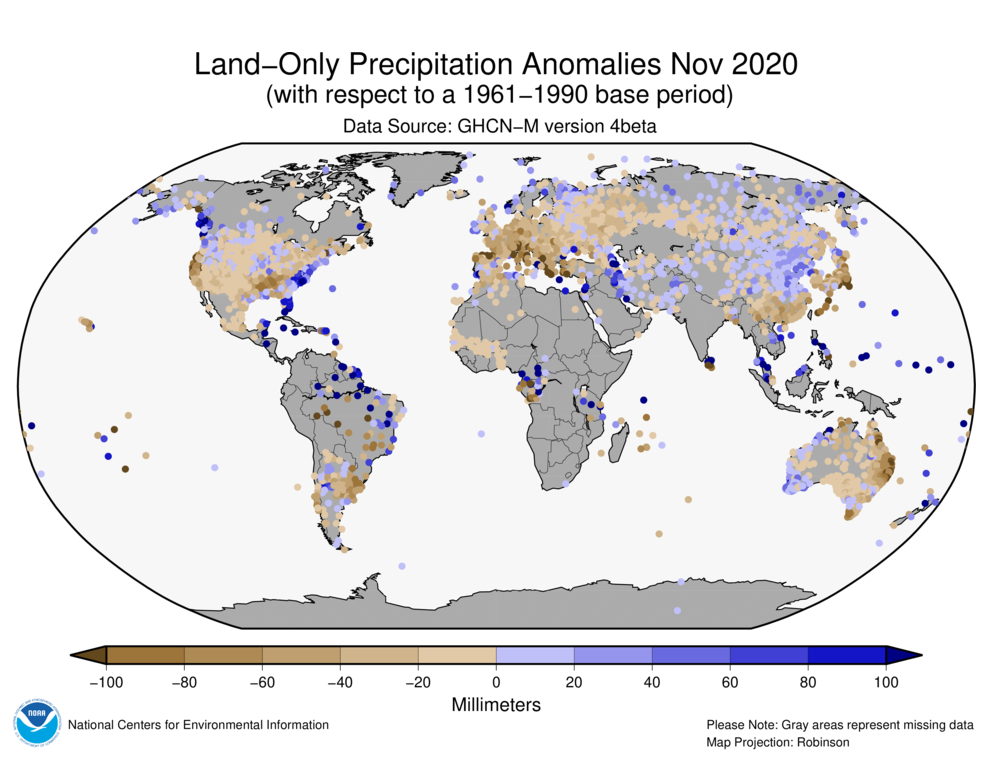
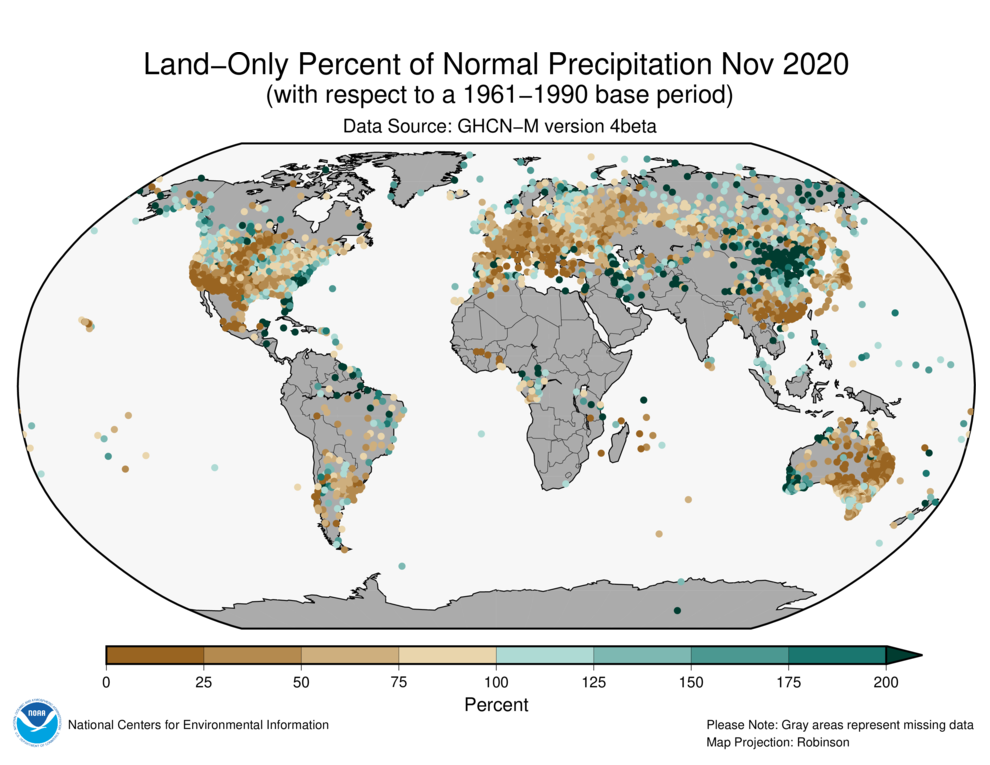
The maps shown above represent precipitation percent of normal (left, using a base period of 1961–1990) and precipitation percentiles (right, using the period of record) based on the GHCN dataset of land surface stations. As is typical, precipitation anomalies during November 2020 varied significantly around the world. November 2020 precipitation was generally drier than normal across parts of the southwestern and central contiguous U.S., Mexico, Europe, western and southern Russia, southern China, Japan, central and eastern Australia, and southern South America. Wetter-than-average conditions were present across parts of southern Alaska, the northwestern and eastern contiguous U.S., northern and southeastern Russia, northern South America, the Middle East, and southwestern Australia.
Australia had a drier-than-average November at 41% below average. Most regions had below-average precipitation during November, with South Australia having the largest precipitation deficit at 71% below average. Tasmania had its lowest November precipitation since 2007 and the ninth lowest since records began in 1900. Western Australia was the only region with above-average precipitation.
Tropical Cyclone Gati was the strongest cyclone to make landfall in Somalia as an equivalent Category 2 hurricane on the Saffir-Simpson scale. According to the World Meteorological Organization, prior to Gati, there was no historical record of a hurricane strength system making landfall in Somalia. Preliminary reports stated that Gati could have produced about 8 inches of rain, which is over two year's worth of rain for that location, in just two days.
September–November Precipitation
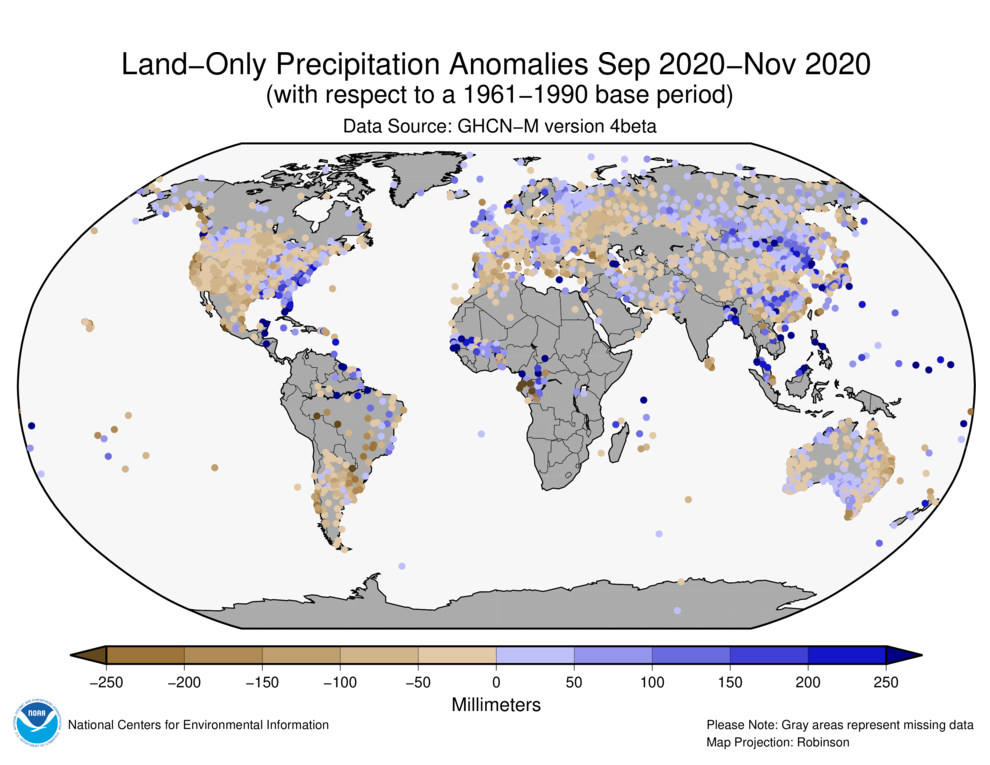
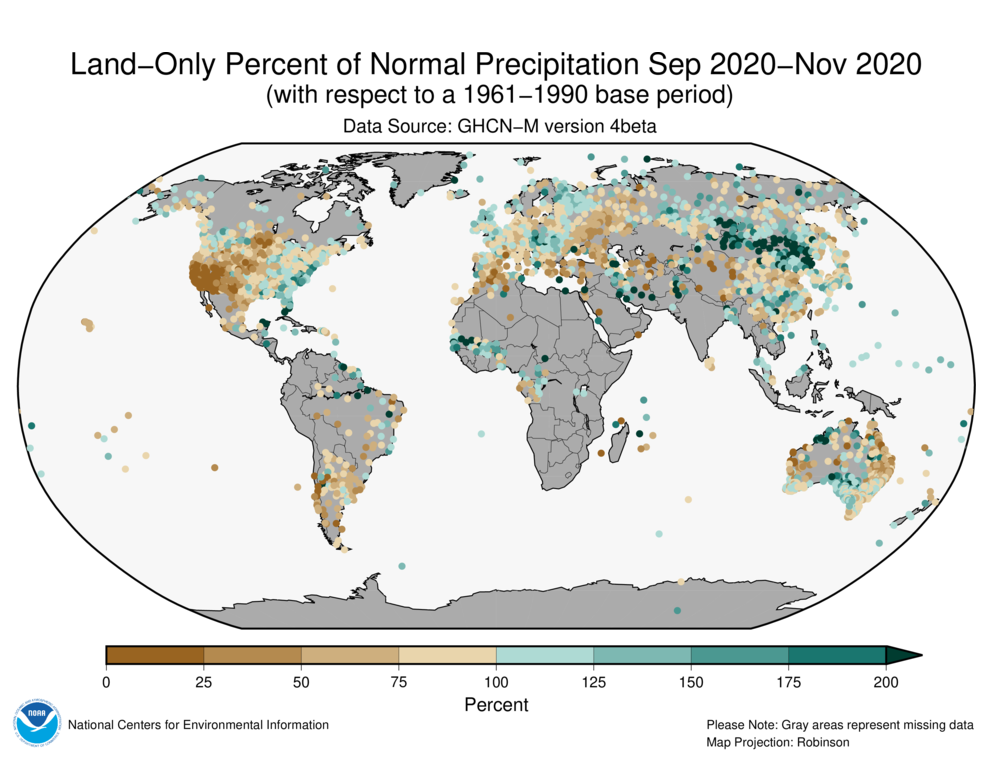
September–November 2020 precipitation was generally drier than normal across parts of the western half of the contiguous U.S., southern South America, southern Europe, western and southern parts of Asia, and across western and eastern Australia. Wetter-than-average conditions were present across parts the eastern contiguous U.S., northern Brazil, central and northern Europe, central-eastern Asia, and central Australia.
Global Precipitation Climatology Project (GPCP)
The following analysis is based upon the Global Precipitation Climatology Project (GPCP) Interim Climate Data Record. It is provided courtesy of the GPCP Principal Investigator team at the University of Maryland.
The Global Precipitation Climatology Project (GPCP) monthly data set is a long-term (1979-present) analysis (Adler et al., 2018) using a combination of satellite and gauge information. An interim GPCP analysis completed within ~10 days of the end of the month allows its use in climate monitoring.
November is the final transition month for Northern Hemisphere Fall (and Southern Hemisphere Spring). As such the ITCZ rainfall band and the summer monsoon rain of South Asia have moved southward as seen in global mean rainfall for this month (see Fig. 1, top panel). In midlatitudes precipitation maxima associated with extratropical cyclone tracks are evident in the North Pacific and Atlantic and extending southeast from southern Africa and Brazil.
Relative to the climatology for November, the pattern of precipitation anomalies across the globe for November 2020 (Fig. 1, middle panel) show the results of various phenomena. The most intense feature in this map is the strong positive anomaly over the Caribbean Sea, associated mainly with heavy rains accompanying hurricanes Eta early in the month and Iota a few weeks later. Eta affected central America, Cuba and Florida. Hurricane Iota was the most intense (Category 5) storm ever so late in the season and hit the coast of Nicaragua within a few miles of Eta with devastating effect. The active Atlantic season is related to warm SSTs in the region, but is also associated with La Niña conditions in the Pacific, where colder than normal SSTs in the central/eastern Pacific affect the precipitation there and beyond. The relatively cool SSTs along the Equator in the central Pacific result in the intense negative anomaly there, with the ITCZ shifted northward slightly from its normal November position as indicated by the accompanying, very narrow positive anomaly just on the north side of the negative feature. To the west, over the Maritime Continent, generally positive anomalies exist as expected with La Niña, but interspersed with negative features. This central Pacific (negative) and Maritime Continent (positive) rainfall anomaly couplet is the signature of La Niña.
Further afield other anomaly features are typical of La Niña conditions, including the positive features in the Caribbean and over the eastern region of Brazil. The negative anomalies over the southern U.S. and extending out into the Pacific are also partially related to La Niña and this is reinforcing the drought conditions in the southwest U.S. and Mexico. This is especially evident in the percentage anomaly map (Fig. 1, bottom panel). In the Indian Ocean and over Australia the pattern is not typical La Niña. For Australia La Niña usually is associated with reasonable rainfall, but for this month the middle and bottom panels show generally rainfall deficits and during this month eastern Australia suffered through record high temperatures and wildfires.
Over Eurasia an interesting pattern of precipitation anomalies exist for November (see Fig. 1, middle and bottom panels), indicating a predominance of storm tracks and rainfall across Scandinavia and the Mediterranean, with drier conditions in between, across central latitudes from France, across Germany and Poland and even further to the east. The region of rainfall deficits for this month has added to the on-going drought across that region. In a similar manner, the November rainfall deficits over South America south of 20°S have continued the drought conditions there.
Small-scale features, often related to single events, can sometimes be detected in the anomaly fields, especially if they happen in climatologically dry areas. Examples can be seen this month in the eastern Pacific just north of the ITCZ, best seen in the bottom panel of Fig. 1, where tropical cyclone tracks are evident exiting the ITCZ. Another feature to look for is the east-west oriented feature in the Arabian Sea associated with Cyclone Gati travelling westward and hitting Somalia in the Horn of Africa, producing heavy rain and flooding along the northern coast of that country.
September–November Summary
Figure 2 shows the global precipitation map for the months of September through November of 2020 and the associated anomalies. An average over a few months in this case gives a good summary of this transition season mean map with the usual tropical and higher latitude features very evident. The anomaly map in the bottom panel shows a fairly typical pattern for a moderate La Nina with the negative anomalies right along the Equator over the coolest waters and generally rainfall excess centered over Borneo and extending into surrounding areas. The narrow positive area just north of the Equator over the central and eastern Pacific indicates the ITCZ is shifted slightly to the north. Strong positive anomalies over the western Indian Ocean and over eastern China are related to tropical cyclone activity in the early part of the period. Tropical cyclones and other travelling convective systems are the reason for the positive anomaly pattern extending from western Africa across the Atlantic at low latitude with two branches headed north in the central Atlantic and especially through the Caribbean up through the Gulf of Mexico and through the eastern U.S. The western U.S. is dominated by negative anomalies that are connected to a strong pattern extending to the west-southwest all the way to the Philippines. These general patterns of anomalies are a combination of inter-annual fluctuations combined with longer-term inter-decadal and trend effects (associated with global warming) with the ITCZ increasing in rain intensity and the sub-tropics drying, part of the wet-getting-wetter and dry-getting-drier phenomenon. Australia and South America are also affected in a similar fashion.
Background discussion of long-term means, variations and trends of global precipitation can be found in Adler et al. (2017).
References
- Adler, R., G. Gu, M. Sapiano, J. Wang, G. Huffman 2017. Global Precipitation: Means, Variations and Trends During the Satellite Era (1979-2014). Surveys in Geophysics 38: 679-699, doi:10.1007/s10712-017-9416-4
- Adler, R., M. Sapiano, G. Huffman, J. Wang, G. Gu, D. Bolvin, L. Chiu, U. Schneider, A. Becker, E. Nelkin, P. Xie, R. Ferraro, D. Shin, 2018. The Global Precipitation Climatology Project (GPCP) Monthly Analysis (New Version 2.3) and a Review of 2017 Global Precipitation. Atmosphere. 9(4), 138; doi:10.3390/atmos9040138
- Gu, G., and R. Adler, 2022. Observed Variability and Trends in Global Precipitation During 1979-2020. Climate Dynamics, doi:10.1007/s00382-022-06567-9
- Huang, B., Peter W. Thorne, et. al, 2017: Extended Reconstructed Sea Surface Temperature version 5 (ERSSTv5), Upgrades, validations, and intercomparisons. J. Climate, doi: 10.1175/JCLI-D-16-0836.1
- Huang, B., V.F. Banzon, E. Freeman, J. Lawrimore, W. Liu, T.C. Peterson, T.M. Smith, P.W. Thorne, S.D. Woodruff, and H-M. Zhang, 2016: Extended Reconstructed Sea Surface Temperature Version 4 (ERSST.v4). Part I: Upgrades and Intercomparisons. J. Climate, 28, 911-930, doi:10.1175/JCLI-D-14-00006.1.
- Menne, M. J., C. N. Williams, B.E. Gleason, J. J Rennie, and J. H. Lawrimore, 2018: The Global Historical Climatology Network Monthly Temperature Dataset, Version 4. J. Climate, in press. https://doi.org/10.1175/JCLI-D-18-0094.1.
- Peterson, T.C. and R.S. Vose, 1997: An Overview of the Global Historical Climatology Network Database. Bull. Amer. Meteorol. Soc., 78, 2837-2849.
- Vose, R., B. Huang, X. Yin, D. Arndt, D. R. Easterling, J. H. Lawrimore, M. J. Menne, A. Sanchez-Lugo, and H. M. Zhang, 2021. Implementing Full Spatial Coverage in NOAA's Global Temperature Analysis. Geophysical Research Letters 48(10), e2020GL090873; doi:10.1029/2020gl090873.
 NOAA's National Centers for Environmental Information
