Introduction
Temperature anomalies and percentiles are shown on the gridded maps below. The anomaly map on the left is a product of a merged land surface temperature (Global Historical Climatology Network, GHCN) and sea surface temperature (ERSST version 5) anomaly analysis. Temperature anomalies for land and ocean are analyzed separately and then merged to form the global analysis. For more information, please visit NCEI's Global Surface Temperature Anomalies page. The percentile map on the right provides additional information by placing the temperature anomaly observed for a specific place and time period into historical perspective, showing how the most current month, season or year compares with the past.
Temperature
In the atmosphere, 500-millibar height pressure anomalies correlate well with temperatures at the Earth's surface. The average position of the upper-level ridges of high pressure and troughs of low pressure—depicted by positive and negative 500-millibar height anomalies on the October 2020 map—is generally reflected by areas of positive and negative temperature anomalies at the surface, respectively.
Monthly Temperature: October 2020
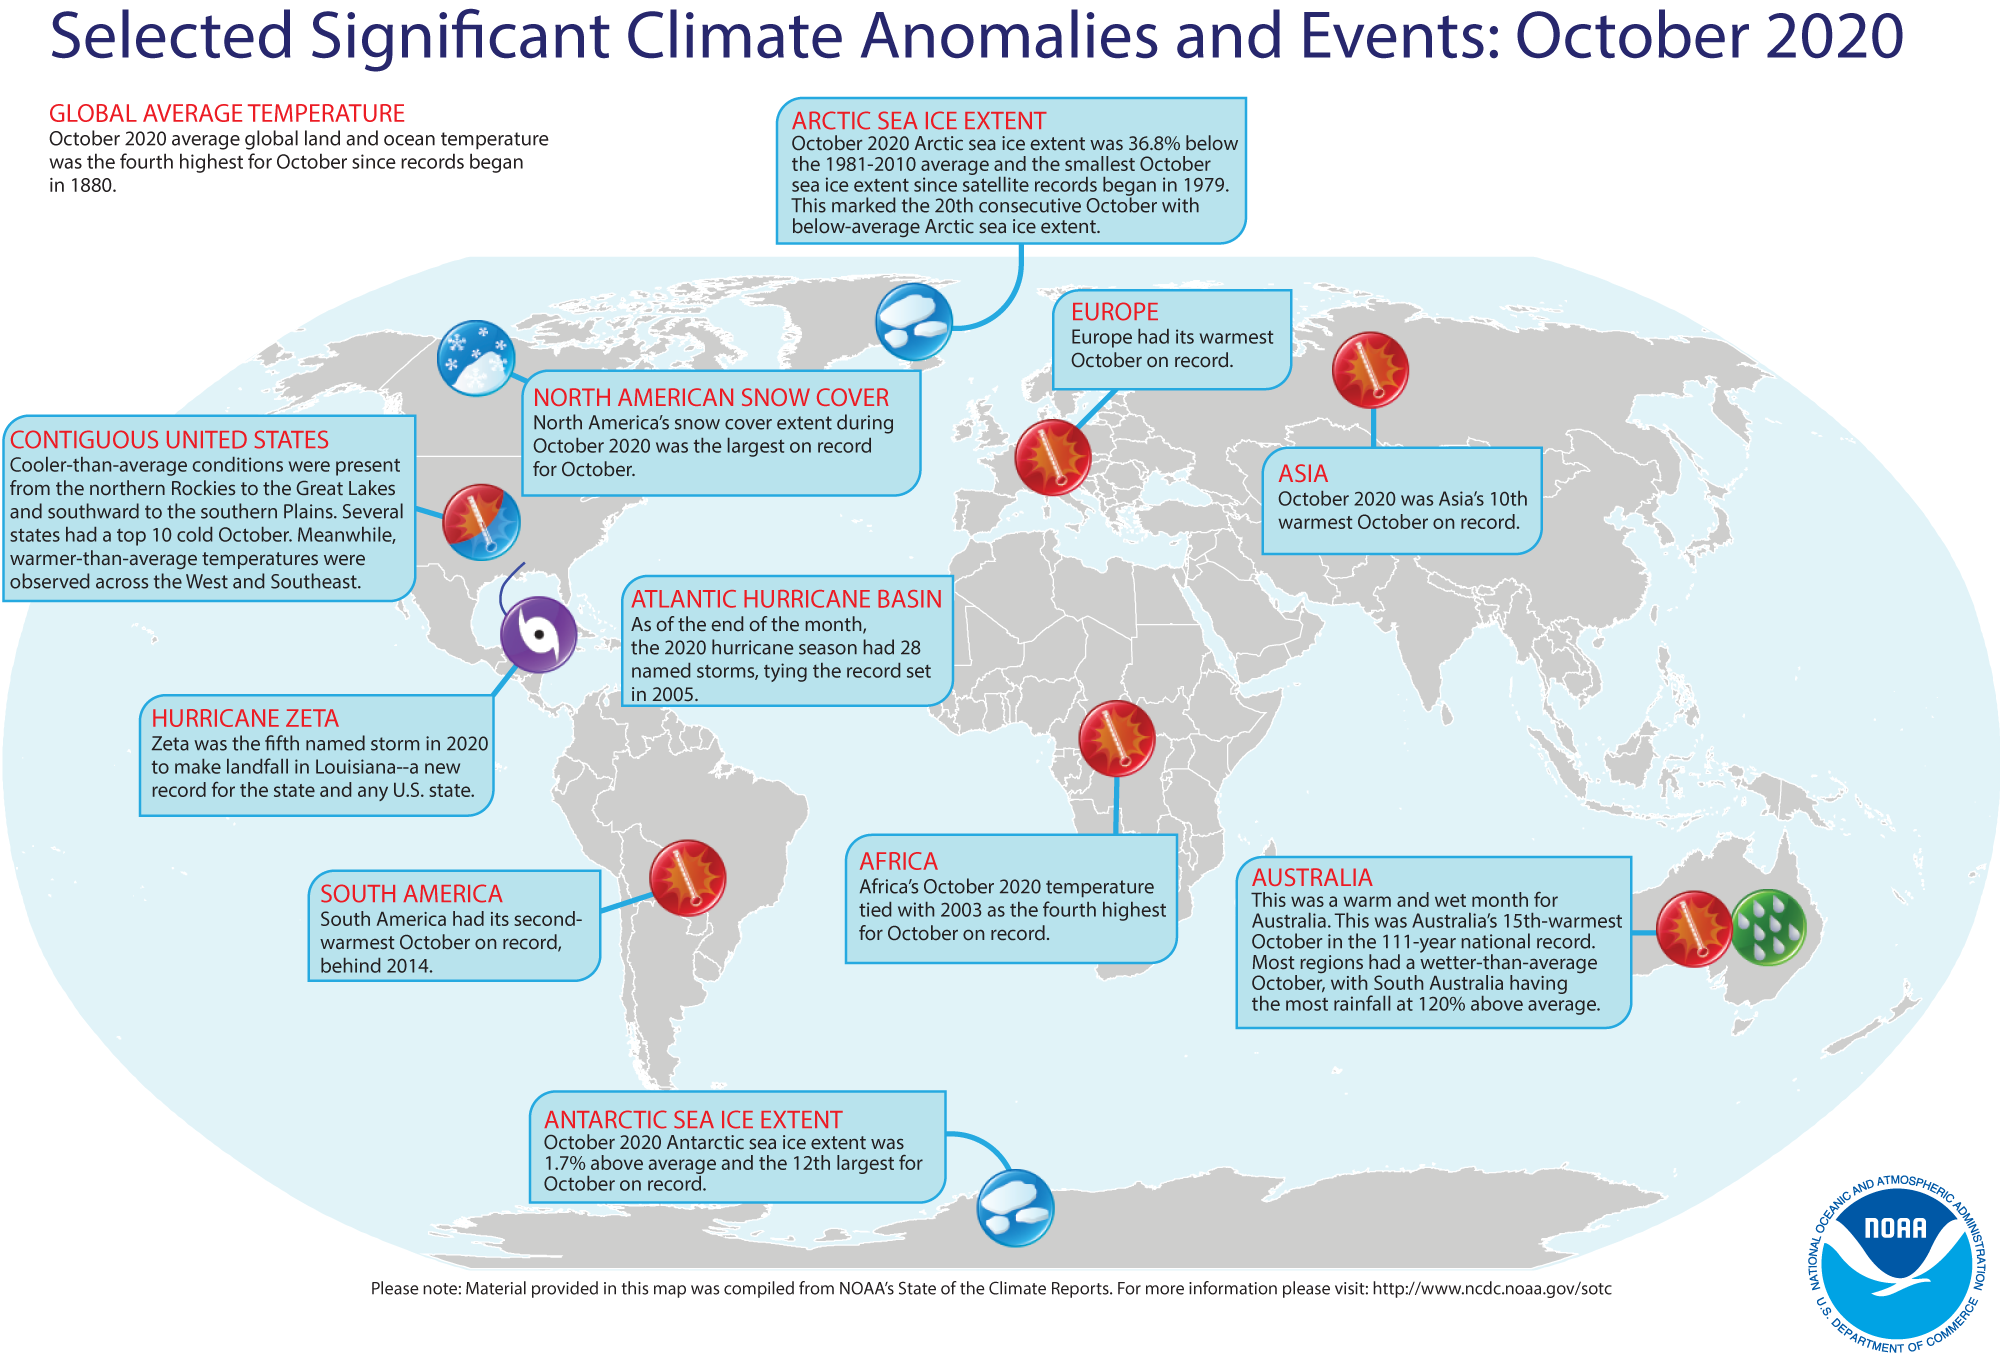
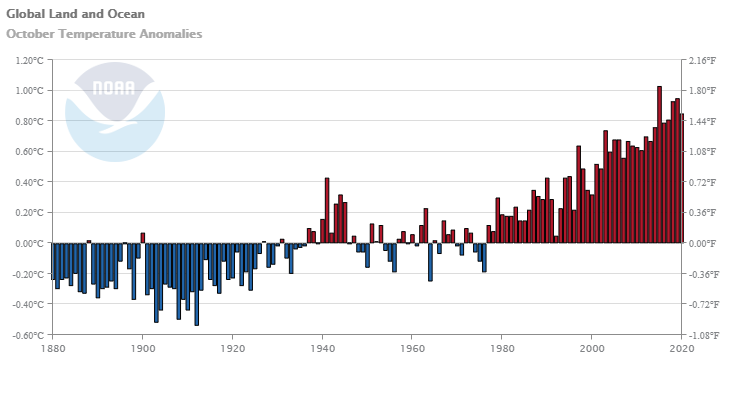
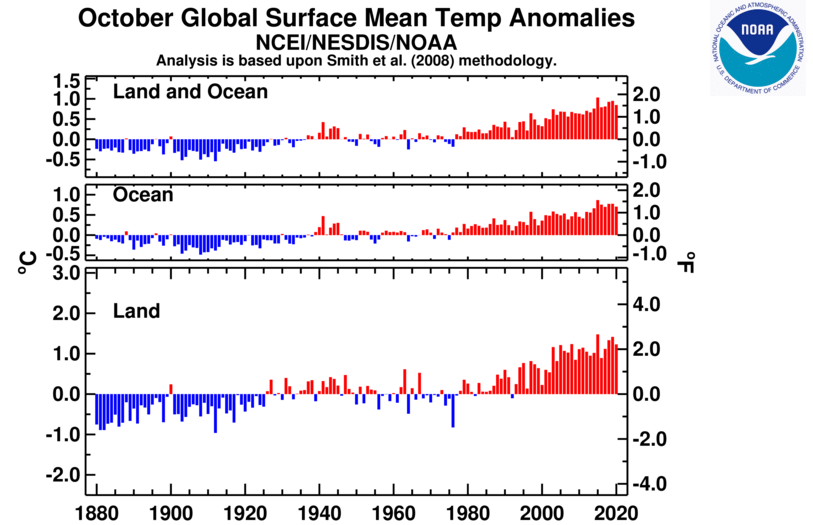
The October 2020 global land and ocean surface temperature was the fourth highest for October since global records began in 1880 at 0.85°C (1.53°F) above the 20th century average of 14.0°C (57.1°F). Only Octobers of 2015 (+1.03°C / +1.85°F), 2019 (+0.95°C / +1.71°F), and 2018 (+0.93°C / +1.67°F) were warmer. The ten warmest Octobers have occurred since 2005, while the seven highest October temperature departures from average have occurred in the last seven years (2014–2020). October 2020 also marks the 44th consecutive October and the 430th consecutive month with temperatures, at least nominally, above the 20th century average.
During the month, warmer-than-average temperatures were observed across a large portion of the world, with record warm October temperatures across parts of the eastern and western North Pacific Ocean, southern North America, South America, eastern Europe, northern Middle East, eastern Mediterranean Sea, southern Asia, and in small areas across the Indian and Atlantic oceans. Overall, about 6.80% of the world's land and ocean surfaces had a record-warm October temperature. This value tied with 2016 as the second highest October percentage since records began in 1951, behind October of 2015 (19.78%). Cooler-than-average October temperatures were observed across much of Canada, the central contiguous U.S., western Europe, and across parts of southern and central Asia, the central and eastern tropical Pacific Ocean, the eastern South Pacific Ocean, and the southwestern Indian Ocean. However, no land or ocean areas had record cold October temperatures.


The global land-only surface temperature for October was the fifth highest on record at 1.23°C (2.21°F) above average. Meanwhile, the global ocean-only surface temperature departure of 0.70°C (1.26°F) tied with 2017 as the fifth highest for October since global records began in 1880.
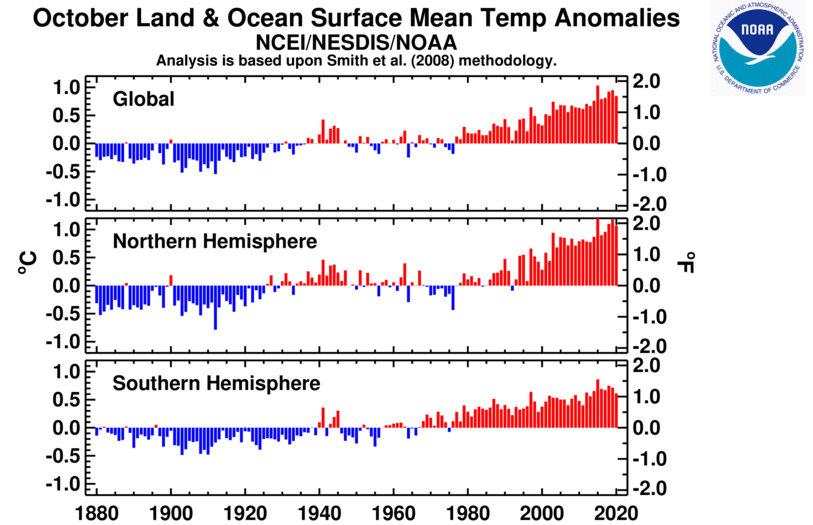
According to NCEI's regional analysis, Europe had its warmest October on record, with a temperature departure of +2.17°C (+3.91°F). This surpassed the previous record set in 2001 by 0.06°C (0.11°F). South America's October temperature departure of +1.62°C (+2.92°F) was the second highest for October since regional records began in 1910. Only October of 2014 was warmer at 1.66°C (2.99°F). Africa, Asia, and the Caribbean and Hawaiian regions' October 2020 temperature departures ranked among the 10 highest for October on record. Meanwhile, North America had a near-average October temperature anomaly at -0.03°C (-0.05°F).
| October | Anomaly | Rank (out of 141 years) | Records | ||||
|---|---|---|---|---|---|---|---|
| °C | °F | Year(s) | °C | °F | |||
| Global | |||||||
| Land | +1.23 ± 0.19 | +2.21 ± 0.34 | Warmest | 5th | 2015 | +1.48 | +2.66 |
| Coolest | 137th | 1912 | -0.96 | -1.73 | |||
| Ocean | +0.70 ± 0.15 | +1.26 ± 0.27 | Warmest | 5th | 2015 | +0.87 | +1.57 |
| Coolest | 137th | 1908 | -0.48 | -0.86 | |||
| Ties: 2017 | |||||||
| Land and Ocean | +0.85 ± 0.15 | +1.53 ± 0.27 | Warmest | 4th | 2015 | +1.03 | +1.85 |
| Coolest | 138th | 1912 | -0.54 | -0.97 | |||
| Northern Hemisphere | |||||||
| Land | +1.17 ± 0.23 | +2.11 ± 0.41 | Warmest | 9th | 2015 | +1.40 | +2.52 |
| Coolest | 133rd | 1912 | -1.28 | -2.30 | |||
| Ocean | +1.01 ± 0.15 | +1.82 ± 0.27 | Warmest | 3rd | 2015 | +1.09 | +1.96 |
| Coolest | 139th | 1892 | -0.54 | -0.97 | |||
| Land and Ocean | +1.07 ± 0.19 | +1.93 ± 0.34 | Warmest | 4th | 2015 | +1.20 | +2.16 |
| Coolest | 138th | 1912 | -0.79 | -1.42 | |||
| Southern Hemisphere | |||||||
| Land | +1.40 ± 0.12 | +2.52 ± 0.22 | Warmest | 4th | 2015 | +1.69 | +3.04 |
| Coolest | 138th | 1880 | -0.90 | -1.62 | |||
| Ocean | +0.46 ± 0.15 | +0.83 ± 0.27 | Warmest | 14th | 2015 | +0.70 | +1.26 |
| Coolest | 128th | 1903 | -0.45 | -0.81 | |||
| Ties: 2002 | |||||||
| Land and Ocean | +0.61 ± 0.14 | +1.10 ± 0.25 | Warmest | 9th | 2015 | +0.86 | +1.55 |
| Coolest | 133rd | 1903 | -0.49 | -0.88 | |||
| Arctic | |||||||
| Land and Ocean | +2.01 ± 0.49 | +3.62 ± 0.88 | Warmest | 3rd | 2018 | +2.32 | +4.18 |
| Coolest | 139th | 1912 | -1.51 | -2.72 | |||
The most current data can be accessed via the Global Surface Temperature Anomalies page.
Select national information is highlighted below. Please note that different countries report anomalies with respect to different base periods. The information provided here is based directly upon these data:
- Spain's October 2020 temperature was 0.9°C (1.62°F) above average—the coldest October since 2010.
- New Zealand's nationwide temperature of 13.2°C (55.8°F) was 1.2°C (2.2°F) above the 1981–2010 average—this was the highest October temperature since 2001 and the fifth highest since national records began in 1909.
- Australia's October 2020 mean temperature was 1.05°C (1.89°F) above the 1961–1990 average and the 15th warmest October in the nation's 111-year record. Regionally, Victoria had its third warmest minimum temperature on record at 1.62°C (2.92°F) above average. However, no other state had a top ten warm mean, maximum, or minimum temperature.
Year-to-date Temperature: January–October 2020
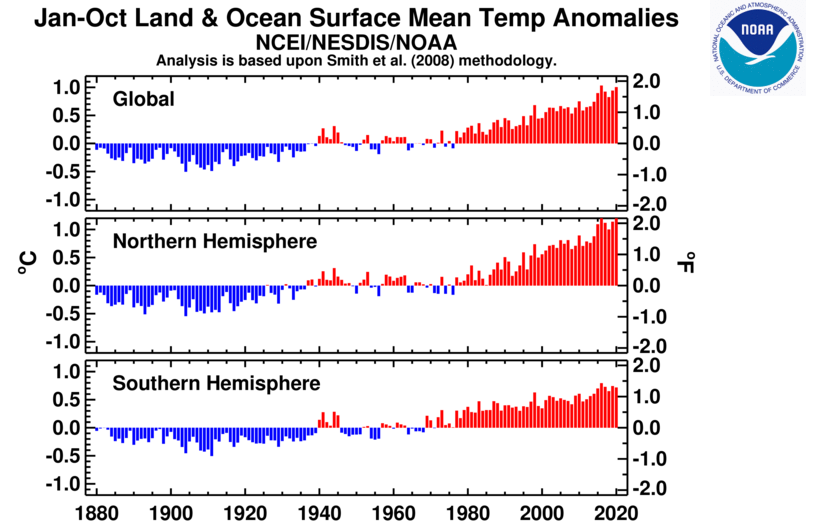
The first ten months of the year were warmer than average across much of the globe. Record warm January–October temperature departures were widespread across northern and southeastern Asia and across parts of Central and South America, Europe, Indian, and parts of the Pacific and Atlantic oceans. Averaged as a whole, this was the second warmest January–October for global land and ocean, with a temperature departure at 1.0°C (1.8°F) above the 20th century average. This value is only 0.03°C (0.05°F) shy of tying the record set in January–October 2016. According to our Global Annual Temperature Rankings Outlook, the year 2020 is very likely to rank among the three warmest years on record.

The global land-only January–October 2020 temperature departure of +1.60°C (+2.88°F) tied with 2016 as the highest temperature for January–October on record. The global ocean-only surface temperature was the second highest on record, behind the record set in 2016. The Northern Hemisphere land and ocean surface temperature was 1.29°C (2.32°F) above average and the highest on record for the January–October period, exceeding the previous record set in 2019 by 0.02°C (0.04°F). Meanwhile, the Southern Hemisphere had its fourth warmest such period on record.


Regionally, Europe and Asia had their warmest January–October period on record. Europe's January–October temperature was 2.12°C (3.82°F) above the 20th century average, surpassing the previous record set in 2018 by 0.18°C (0.32°F). Europe's five warmest January–October periods have occurred since 2014. Asia's January–October temperature departure of 2.21°C (3.98°F) exceeded the previous record of 1.80°C (3.2°F) set in 2016 by 0.41°C (0.74°F).
South America and the Caribbean region had their second warmest January–October period, while Africa and Oceania had their fifth and sixth highest such period on record, respectively.
Spain had its second warmest year-to-date period at 1.0°C (1.8°F) above average. Only January–October 2017 was warmer at +1.3°C (+2.3°F).
| January–October | Anomaly | Rank (out of 141 years) | Records | ||||
|---|---|---|---|---|---|---|---|
| °C | °F | Year(s) | °C | °F | |||
| Global | |||||||
| Land | +1.60 ± 0.17 | +2.88 ± 0.31 | Warmest | 1st | 2016, 2020 | +1.60 | +2.88 |
| Coolest | 141st | 1884 | -0.73 | -1.31 | |||
| Ties: 2016 | |||||||
| Ocean | +0.78 ± 0.18 | +1.40 ± 0.32 | Warmest | 2nd | 2016 | +0.82 | +1.48 |
| Coolest | 140th | 1904 | -0.48 | -0.86 | |||
| Land and Ocean | +1.00 ± 0.17 | +1.80 ± 0.31 | Warmest | 2nd | 2016 | +1.03 | +1.85 |
| Coolest | 140th | 1904 | -0.50 | -0.90 | |||
| Northern Hemisphere | |||||||
| Land | +1.75 ± 0.18 | +3.15 ± 0.32 | Warmest | 2nd | 2016 | +1.77 | +3.19 |
| Coolest | 140th | 1884 | -0.83 | -1.49 | |||
| Ocean | +1.00 ± 0.18 | +1.80 ± 0.32 | Warmest | 1st | 2020 | +1.00 | +1.80 |
| Coolest | 141st | 1904 | -0.52 | -0.94 | |||
| Land and Ocean | +1.29 ± 0.18 | +2.32 ± 0.32 | Warmest | 1st | 2020 | +1.29 | +2.32 |
| Coolest | 141st | 1904 | -0.54 | -0.97 | |||
| Southern Hemisphere | |||||||
| Land | +1.24 ± 0.15 | +2.23 ± 0.27 | Warmest | 2nd | 2019 | +1.30 | +2.34 |
| Coolest | 140th | 1917 | -0.79 | -1.42 | |||
| Ocean | +0.62 ± 0.18 | +1.12 ± 0.32 | Warmest | 4th | 2016 | +0.72 | +1.30 |
| Coolest | 138th | 1911 | -0.47 | -0.85 | |||
| Land and Ocean | +0.72 ± 0.17 | +1.30 ± 0.31 | Warmest | 4th | 2016 | +0.79 | +1.42 |
| Coolest | 138th | 1911 | -0.50 | -0.90 | |||
| Arctic | |||||||
| Land and Ocean | +2.15 ± 0.22 | +3.87 ± 0.40 | Warmest | 2nd | 2016 | +2.49 | +4.48 |
| Coolest | 140th | 1902 | -1.21 | -2.18 | |||
| Ties: 2019 | |||||||

Precipitation
October Precipitation
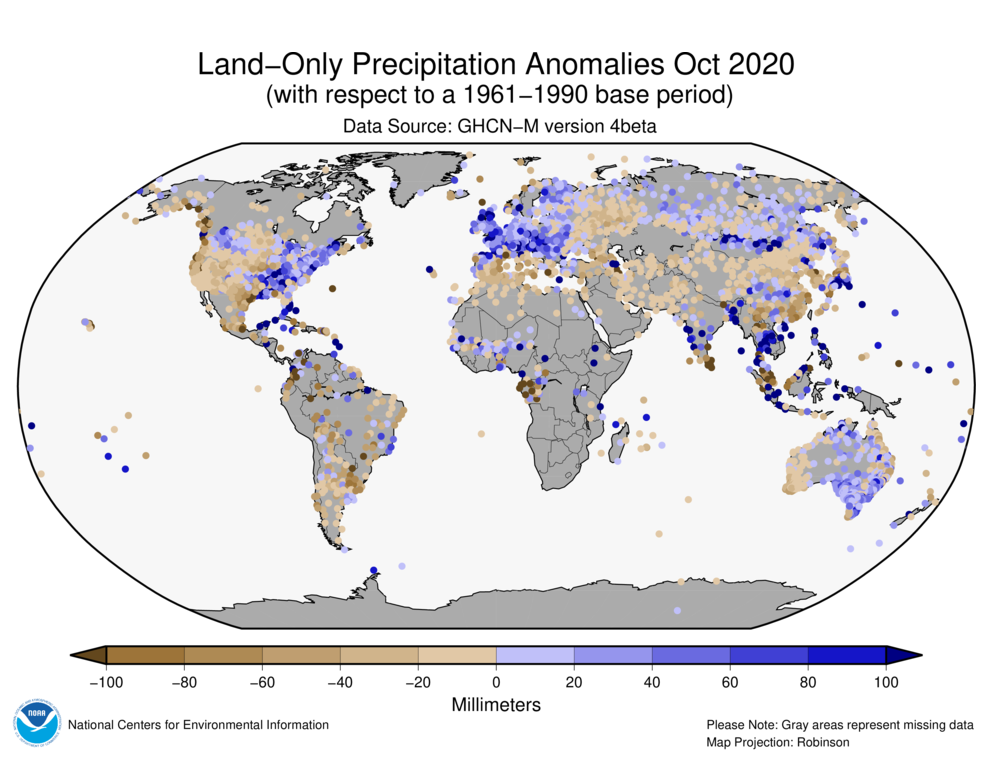
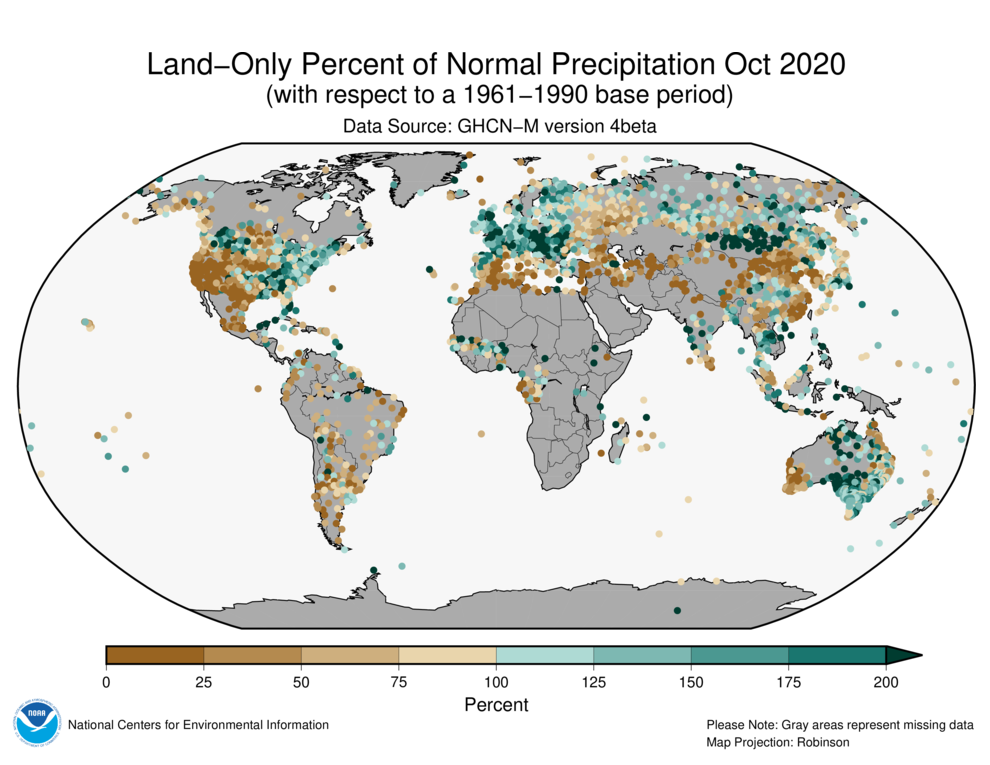
The maps shown above represent precipitation percent of normal (left, using a base period of 1961–1990) and precipitation percentiles (right, using the period of record) based on the GHCN dataset of land surface stations. As is typical, precipitation anomalies during October 2020 varied significantly around the world. October 2020 precipitation was generally drier than normal across parts of the western contiguous U.S., Mexico, South America, southern Europe, western Russia, northern Africa, southern Asia, and southwestern Australia. Wetter-than-average conditions were present across parts of northwestern and eastern contiguous U.S., central and northern Europe, central and eastern Russia, parts of India, southeastern Asia, and eastern Australia.
The United Kingdom had its fifth wettest October since national records began in 1862, with 142% of average rainfall for the month.
October 2020 was a wet month for Australia, receiving 35% above-average precipitation for the month. Most regions had a wetter-than-average month, with South Australia having the most rainfall at 120% above average and its ninth wettest October on record. Western Australia was the only region to have slightly below-average precipitation.
Global Precipitation Climatology Project (GPCP)
The following analysis is based upon the Global Precipitation Climatology Project (GPCP) Interim Climate Data Record. It is provided courtesy of the GPCP Principal Investigator team at the University of Maryland.
The Global Precipitation Climatology Project (GPCP) monthly data set is a long-term (1979-present) analysis (Adler et al., 2018) using a combination of satellite and gauge information. An interim GPCP analysis completed within ~10 days of the end of the month allows its use in climate monitoring.

The transitional season of October is marked in Figure 1 (top panel) by the retreat of the southwest monsoon in South Asia, an active ITCZ and mid-latitude storm tracks. The most intense feature in the mean map for this month is in the South China Sea and over Indochina, where a very strong maximum of about 15 mm/d (over 450 mm for the month) stands out. The anomaly map (Figure 1, middle panel) shows a large area of heavier than normal rainfall centered there. The core of this feature is related to frequent tropical cyclones (at least four) during the month tracking across the area from the Western Pacific into and across the South China Sea, producing flooding in the Philippine Islands and especially in Vietnam, Laos and Cambodia.
Although the South China sea feature is associated with tropical cyclones moving through the area, it is also associated with the larger-scale feature of the current La Niña, with cooler than normal SSTs along the Equator in the central Pacific. As is usual with La Niñas the Maritime Continent and surrounding areas have surplus rainfall, although in this case the center of the surplus is shifted a little to the north from what is often the case. However, to the east where one would expect a clear rainfall deficit near the dateline along the Equator with La Niña conditions, the ITCZ is still showing a positive anomaly, although surrounded by areas of rainfall deficits. The negative anomaly pattern in the Indian Ocean is also typical of La Niña as is Australia showing welcome springtime rainfall over most of its area (see middle and bottom panels of Fig. 1).
In the eastern Pacific the ITCZ is generally weak, with negative anomalies, very different from the last few months. To the north, across the sub-tropics from the western Pacific above the equator, across the region of Hawaii, and into the southwest U.S., a broad area of precipitation deficit exists as over the last six months or so. The broad area of negative rainfall anomalies is broken up by swaths of positive anomalies related to multiple storm tracks, including those of E. Pac. Tropical cyclones. The continuing drought in the western U.S. is connected to this very large-scale feature which is a combination of precipitation trends in this ocean-to-land region and for 2020 an inter-annual dip. All this has led to a very dry western U.S. and a terrible wildfire season, with very large fires in Colorado and California in October.
The Atlantic hurricane season has been very active, with a record setting number of named storms, helped by warm SSTs and the on-going La Niña. The geographical distribution of storms (and rainfall) is, of course, not uniform across the Atlantic with a focus of storms in the Caribbean and Gulf of Mexico during October (see middle and bottom panels). These storms tended to batter the Yucatan peninsula before coming across to land in the U.S. Hurricane Delta took that route and ended up dumping 445 mm of rain in Louisiana in early October and Hurricane Zeta followed suit at the end of the month wetting down the southeastern U.S.
Western Europe and Scandinavia had above average precipitation this month helping to relieve some drought conditions. Further to the east dry conditions in October across the Arabian peninsula, through Iran and surrounding regions added to the existing drought in that region.
Background discussion of long-term means, variations and trends of global precipitation can be found in Adler et al. (2017).
References
- Adler, R., G. Gu, M. Sapiano, J. Wang, G. Huffman 2017. Global Precipitation: Means, Variations and Trends During the Satellite Era (1979-2014). Surveys in Geophysics 38: 679-699, doi:10.1007/s10712-017-9416-4
- Adler, R., M. Sapiano, G. Huffman, J. Wang, G. Gu, D. Bolvin, L. Chiu, U. Schneider, A. Becker, E. Nelkin, P. Xie, R. Ferraro, D. Shin, 2018. The Global Precipitation Climatology Project (GPCP) Monthly Analysis (New Version 2.3) and a Review of 2017 Global Precipitation. Atmosphere. 9(4), 138; doi:10.3390/atmos9040138
- Gu, G., and R. Adler, 2022. Observed Variability and Trends in Global Precipitation During 1979-2020. Climate Dynamics, doi:10.1007/s00382-022-06567-9
- Huang, B., Peter W. Thorne, et. al, 2017: Extended Reconstructed Sea Surface Temperature version 5 (ERSSTv5), Upgrades, validations, and intercomparisons. J. Climate, doi: 10.1175/JCLI-D-16-0836.1
- Huang, B., V.F. Banzon, E. Freeman, J. Lawrimore, W. Liu, T.C. Peterson, T.M. Smith, P.W. Thorne, S.D. Woodruff, and H-M. Zhang, 2016: Extended Reconstructed Sea Surface Temperature Version 4 (ERSST.v4). Part I: Upgrades and Intercomparisons. J. Climate, 28, 911-930, doi:10.1175/JCLI-D-14-00006.1.
- Menne, M. J., C. N. Williams, B.E. Gleason, J. J Rennie, and J. H. Lawrimore, 2018: The Global Historical Climatology Network Monthly Temperature Dataset, Version 4. J. Climate, in press. https://doi.org/10.1175/JCLI-D-18-0094.1.
- Peterson, T.C. and R.S. Vose, 1997: An Overview of the Global Historical Climatology Network Database. Bull. Amer. Meteorol. Soc., 78, 2837-2849.
- Vose, R., B. Huang, X. Yin, D. Arndt, D. R. Easterling, J. H. Lawrimore, M. J. Menne, A. Sanchez-Lugo, and H. M. Zhang, 2021. Implementing Full Spatial Coverage in NOAA's Global Temperature Analysis. Geophysical Research Letters 48(10), e2020GL090873; doi:10.1029/2020gl090873.