Introduction
Temperature anomalies and percentiles are shown on the gridded maps below. The anomaly map on the left is a product of a merged land surface temperature (Global Historical Climatology Network, GHCN) and sea surface temperature (ERSST version 5) anomaly analysis. Temperature anomalies for land and ocean are analyzed separately and then merged to form the global analysis. For more information, please visit NCEI's Global Surface Temperature Anomalies page. The percentile map on the right provides additional information by placing the temperature anomaly observed for a specific place and time period into historical perspective, showing how the most current month, season or year compares with the past.
Temperature
In the atmosphere, 500-millibar height pressure anomalies correlate well with temperatures at the Earth's surface. The average position of the upper-level ridges of high pressure and troughs of low pressure—depicted by positive and negative 500-millibar height anomalies on the March 2020 map—is generally reflected by areas of positive and negative temperature anomalies at the surface, respectively.
Monthly Temperature: March 2020
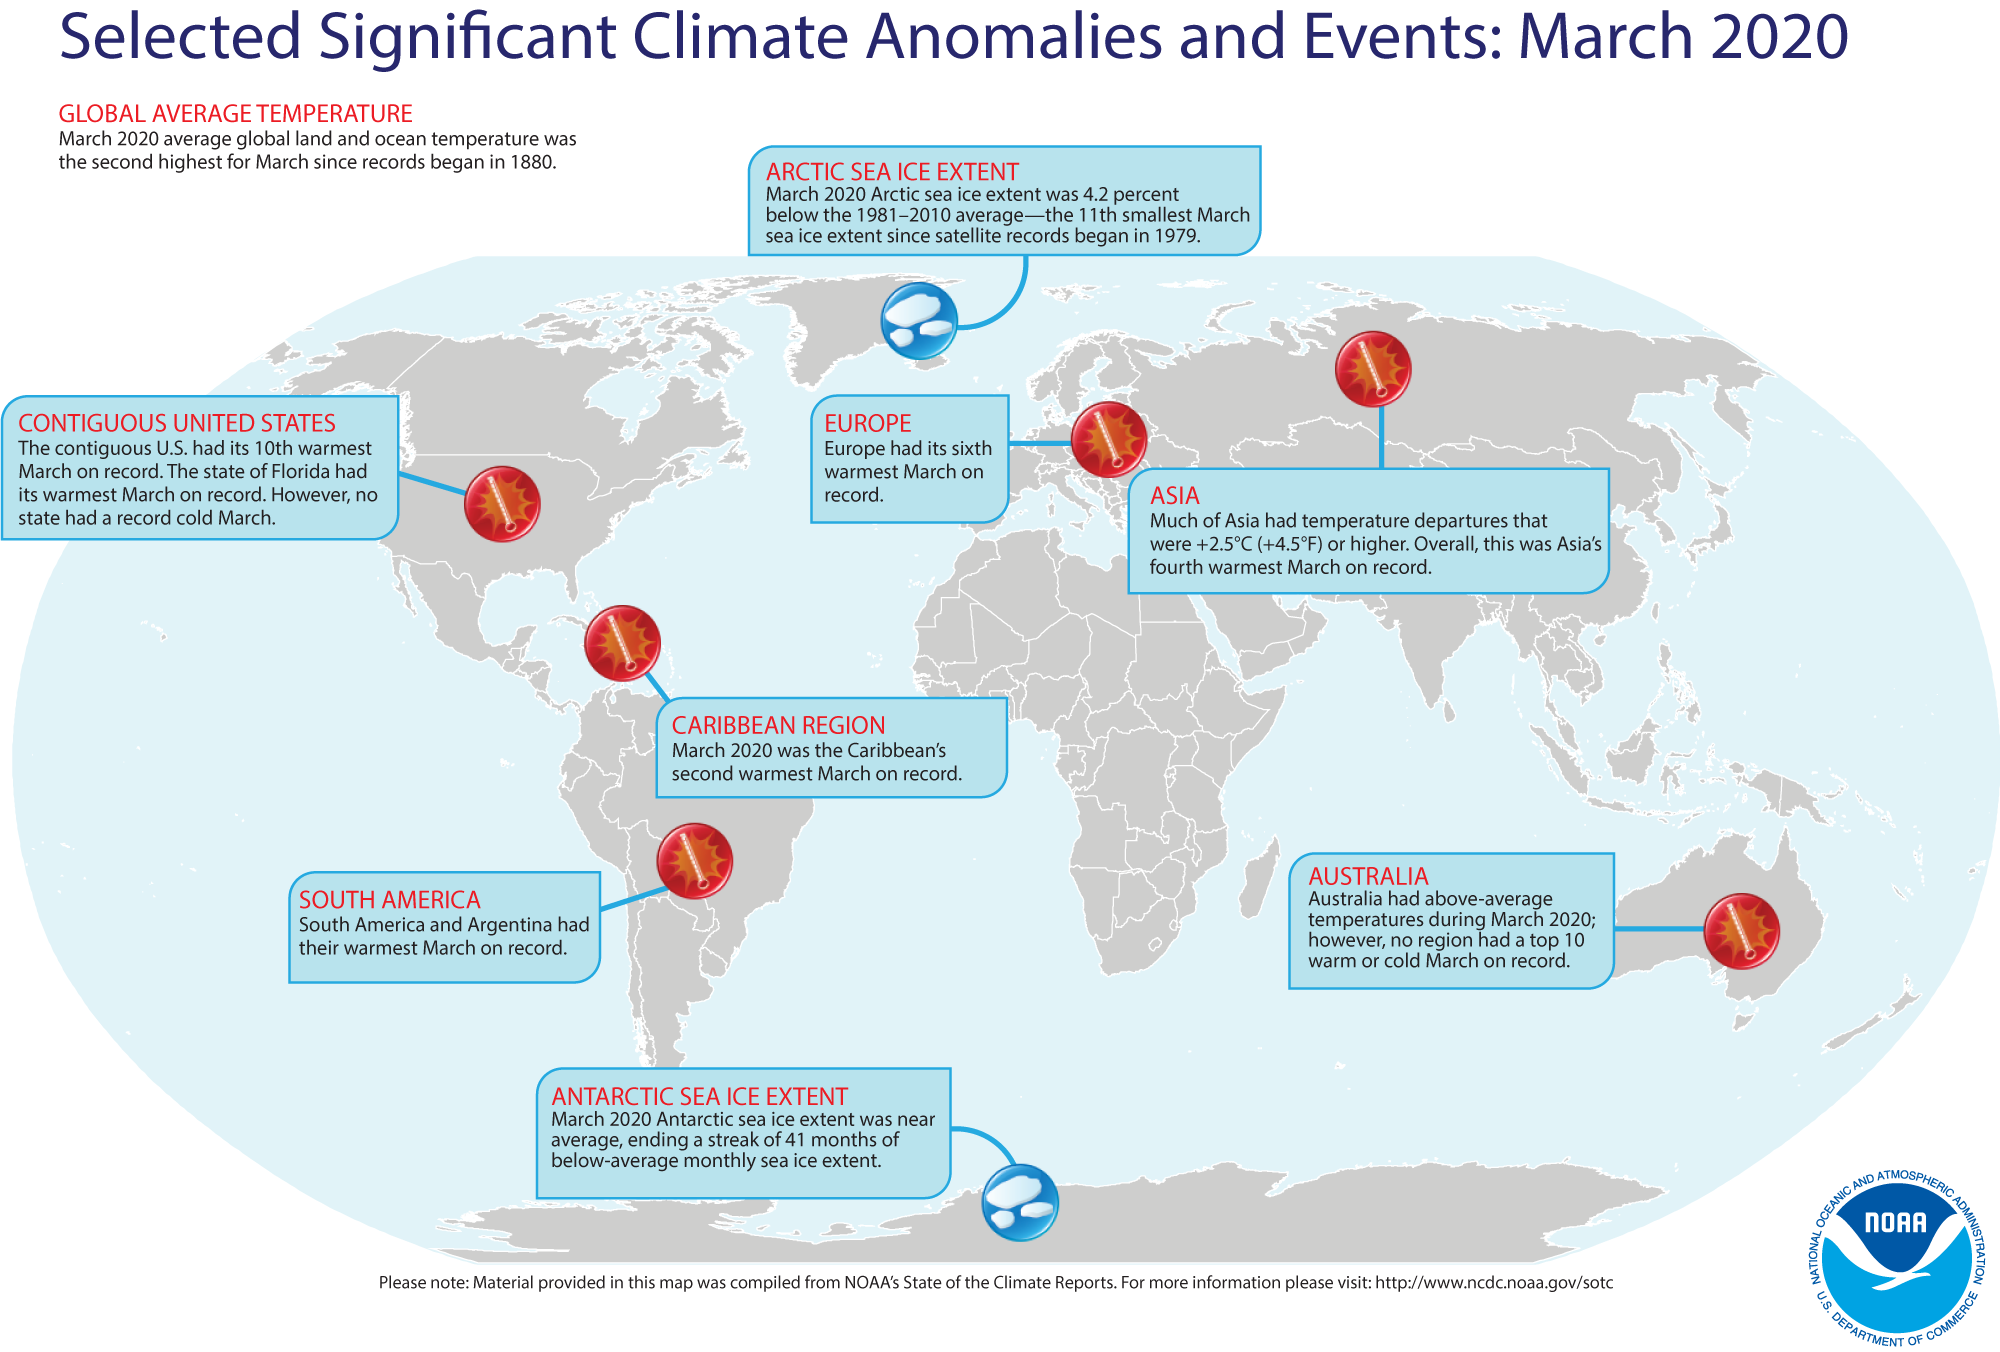
March 2020 was characterized by warmer-than-average conditions across much of the globe. The most notable warm March temperatures were present across much of Asia, the eastern half of the contiguous U.S., and southern South America where temperatures were 2.0°C (3.6°F) above average or higher. Some ocean areas were notable as well, including parts of the tropical Atlantic Ocean, central Indian Ocean, and parts of the northern and southwestern Pacific Ocean, where temperatures were 1.5°C (2.7°F) above average or higher. The most notable cool temperatures departures were present across Canada, Alaska, northern India, parts of the North Atlantic Ocean, and the Antarctic.


Record-warm March surface temperatures were present across parts of the Atlantic, Indian, and western Pacific oceans, as well as parts of southern North America, South America, Asia, and Africa. Overall, March 2020 had 8.17% of the world's land and ocean surfaces having a record high March temperature, considering a 1951 start date, when global coverage grew. This was the second highest percentage of record-warm March temperatures of that era. Only March 2016 had a higher percentage with 15.47%. One small area across the North Atlantic, representing 0.06% of the globe, had a record-cold March temperature.
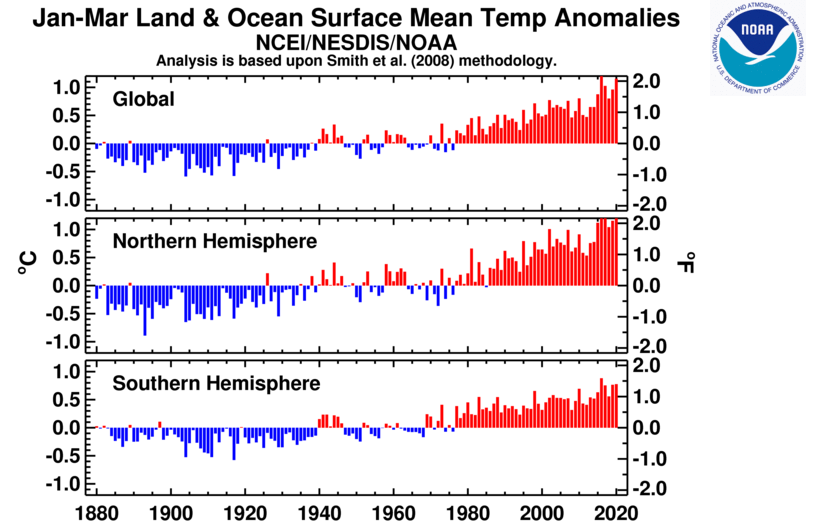
Averaged as a whole, the global land and ocean surface temperature for March 2020 was 1.16°C (2.09°F) above the 20th century average of 12.7°C (54.9°F) and the second highest in the 141-year record. Only March 2016 was warmer at 1.31°C (2.36°F). The 10 warmest Marches have all occurred since 1990, with Marches of 2016, 2017, 2019, and 2020 having a global land and ocean surface temperature departure from average above 1.0°C (1.8°F). The March 2020 global land and ocean surface temperature departure tied with February 2020 and December 2015 as the third highest monthly temperature departure from average in the 1,683-month record. Only February and March 2016, when a strong El Niño was present in the tropical Pacific Ocean, had higher temperature departures.

March 2020 marked the 44th consecutive March and the 423rd consecutive month with temperatures, at least nominally, above the 20th century average. According to NOAA's Climate Prediction Center, ENSO-neutral conditions were present across the tropical Pacific Ocean during March 2020. The March 2020 global land and ocean surface temperature departure from average tied with February 2020 as the highest monthly temperature departure without an El Niño present in the tropical Pacific Ocean. The three highest ENSO neutral temperature departures from average have all occurred in 2020. CPC states that ENSO-neutral is favored during the Northern Hemisphere spring (Southern Hemisphere fall). This forecast focuses on the ocean surface temperature between 5°N and 5°S latitude and 170°W to 120°W longitude, called the Niño 3.4 region.
The global land-only and global ocean-only temperature departures from average for March 2020 were also near-record warm, behind the record set in March 2016. The global land-only March 2020 temperature departure of +2.05°C (+3.69°F) was also the fifth highest for any month for land surfaces in the 1,683-month record. The 10 highest monthly land-only temperature departures have occurred since December 2015. Meanwhile, the March 2020 global ocean-only temperature departure of +0.83°C (+1.49°F) tied with February 2016 and July 2019 as the seventh highest for any month for ocean surface on record.
Regionally, South America and the Gulf of Mexico had their warmest March on record, surpassing their previous records set in 2010 and 1945, respectively. This was also South America's fifth and the Gulf of Mexico's fourth highest temperature departure for any month in the regional 1,323-month record. The Caribbean had its second highest March on record at 0.90°C (1.62°F) above average. Only March 2016 was warmer. Meanwhile, Europe, Africa, and Asia had a March temperature that ranked among their nine highest on record.
| March | Anomaly | Rank (out of 141 years) | Records | ||||
|---|---|---|---|---|---|---|---|
| °C | °F | Year(s) | °C | °F | |||
| Global | |||||||
| Land | +2.05 ± 0.11 | +3.69 ± 0.20 | Warmest | 2nd | 2016 | +2.52 | +4.54 |
| Coolest | 140th | 1898 | -1.61 | -2.90 | |||
| Ocean | +0.83 ± 0.14 | +1.49 ± 0.25 | Warmest | 2nd | 2016 | +0.86 | +1.55 |
| Coolest | 140th | 1904, 1911 | -0.50 | -0.90 | |||
| Land and Ocean | +1.16 ± 0.14 | +2.09 ± 0.25 | Warmest | 2nd | 2016 | +1.31 | +2.36 |
| Coolest | 140th | 1898 | -0.66 | -1.19 | |||
| Northern Hemisphere | |||||||
| Land | +2.42 ± 0.18 | +4.36 ± 0.32 | Warmest | 2nd | 2016 | +2.96 | +5.33 |
| Coolest | 140th | 1898 | -2.03 | -3.65 | |||
| Ocean | +0.96 ± 0.13 | +1.73 ± 0.23 | Warmest | 1st | 2020 | +0.96 | +1.73 |
| Coolest | 141st | 1904 | -0.55 | -0.99 | |||
| Land and Ocean | +1.52 ± 0.13 | +2.74 ± 0.23 | Warmest | 2nd | 2016 | +1.69 | +3.04 |
| Coolest | 140th | 1898 | -0.94 | -1.69 | |||
| Southern Hemisphere | |||||||
| Land | +1.10 ± 0.14 | +1.98 ± 0.25 | Warmest | 5th | 2016 | +1.39 | +2.50 |
| Coolest | 137th | 1885 | -1.00 | -1.80 | |||
| Ties: 2015 | |||||||
| Ocean | +0.74 ± 0.15 | +1.33 ± 0.27 | Warmest | 2nd | 2016 | +0.83 | +1.49 |
| Coolest | 140th | 1911 | -0.54 | -0.97 | |||
| Land and Ocean | +0.80 ± 0.14 | +1.44 ± 0.25 | Warmest | 3rd | 2016 | +0.92 | +1.66 |
| Coolest | 139th | 1911 | -0.56 | -1.01 | |||
| Ties: 2019 | |||||||
| Arctic | |||||||
| Land and Ocean | +2.83 ± 0.42 | +5.09 ± 0.76 | Warmest | 7th | 2019 | +4.15 | +7.47 |
| Coolest | 135th | 1902 | -3.74 | -6.73 | |||


The most current data can be accessed via the Global Surface Temperature Anomalies page.
Select national information is highlighted below. Please note that different countries report anomalies with respect to different base periods. The information provided here is based directly upon these data:
- France had an average temperature of 9.4°C (48.9°F), which is 0.7°C (1.26°F) above the 1981–2010 average. March 2020 marked the 10th consecutive month with national temperatures above average and, according to Meteo France, this was the first time since national records began in 1900 that France has had 10 consecutive months with monthly temperatures above average.
- According to European information compiled by the Swedish Meteorological and Hydrological Institute, Moscow (Russia's capital) had its second warmest March since records began in 1821, while Estonia had a top five warm March on record.
- Hong Kong's March 2020 mean temperature was the second highest on record at 21.3°C (70.3°F) or 2.2°C (4.0°F) above average. The average minimum and maximum temperatures were second and fifth highest on record at 2.5°C (4.5°F) and 2.4°C (4.32°F) above average, respectively.
- Argentina had its warmest March in the nation's 60-year record, with a temperature departure from average at +2.5°C (+4.5°F). This value surpassed the previous March record set in 1980. This was also the highest monthly temperature departure since May 1967 (+2.8°C / +5.0°F).
- The national mean temperature for Australia during March 2020 was above average at +0.67°C (+1.21°F) and tied as the 21st warmest March since national records began in 1910. Regionally, Queensland, South Australia, Western Australia, and the Northern Territory had a warmer-than-average March temperature, while New South Wales, Victoria, and Tasmania had near- to cooler-than-average March temperatures. Western Australia had the largest positive temperature departure from average at +1.23°C (+2.21°F), which was the 12th highest March temperature in the 111-year record. However, no region had a top 10 warm or cold March on record. According to Australia's Bureau of Meteorology, the very warm waters east of Queensland during February and March led to a very widespread bleaching across the Great Barrier Reef.
Year-to-date Temperature: January–March 2020
The global land and ocean surface temperature for the first three months of the year was near-record warm, with a temperature departure from average at +1.15°C (+2.07°F). January–March 2016 was warmer by 0.08°C (0.14°F). According to NCEI's annual temperature outlook, the year 2020 is almost certain to rank among the five warmest years on record. The global land-only and global ocean-only temperature departures for January–March were also the second highest on record, trailing behind the record set in 2016.

The first three months of the year were characterized by warmer-than-average conditions across much of the globe. The most notable warm January–March temperature departures were across much of eastern Europe and Asia, where temperatures were at least 4.0°C (7.2°F) above average or higher. The most notable cool temperature departures were present across Alaska and western parts of Canada. Record-warm temperature departures during January–March 2020 were present across parts of Europe, Asia, Central and South America, as well as the Atlantic, Indian, and western Pacific oceans. However, no land or ocean areas had record-cold January–March temperatures.
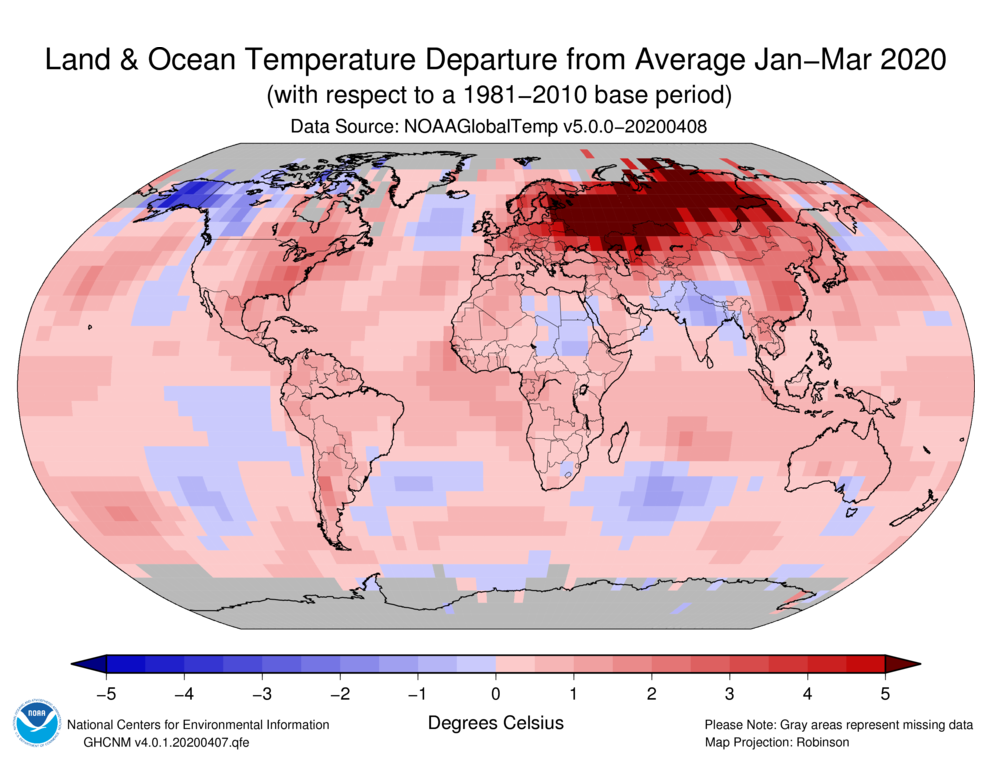

The January–March 2020 temperatures for Europe and Asia were the highest in the 111-year record. Europe's temperature departure from average of +3.20°C (+5.76°F) exceeded the previous record set in 1990 by 0.46°C (0.83°F) and marked the first time the three-month period of January–March surpassed 3.0°C (5.4°F). Asia's January–March 2020 temperature departure of +3.66°C (+6.59°F) was 0.25°C (0.45°F) higher than the now second highest January–March of 2002 and marked only the second time the January–March temperatures were above 3.0°C (5.4°F).
South America and the Caribbean region had their third warmest year-to-date on record.
| January–March | Anomaly | Rank (out of 141 years) | Records | ||||
|---|---|---|---|---|---|---|---|
| °C | °F | Year(s) | °C | °F | |||
| Global | |||||||
| Land | +2.13 ± 0.16 | +3.83 ± 0.29 | Warmest | 2nd | 2016 | +2.20 | +3.96 |
| Coolest | 140th | 1893 | -1.28 | -2.30 | |||
| Ocean | +0.79 ± 0.15 | +1.42 ± 0.27 | Warmest | 2nd | 2016 | +0.87 | +1.57 |
| Coolest | 140th | 1904 | -0.51 | -0.92 | |||
| Land and Ocean | +1.15 ± 0.16 | +2.07 ± 0.29 | Warmest | 2nd | 2016 | +1.23 | +2.21 |
| Coolest | 140th | 1904 | -0.59 | -1.06 | |||
| Northern Hemisphere | |||||||
| Land | +2.52 ± 0.20 | +4.54 ± 0.36 | Warmest | 2nd | 2016 | +2.53 | +4.55 |
| Coolest | 140th | 1893 | -1.56 | -2.81 | |||
| Ocean | +0.92 ± 0.15 | +1.66 ± 0.27 | Warmest | 2nd | 2016 | +0.98 | +1.76 |
| Coolest | 140th | 1904 | -0.56 | -1.01 | |||
| Land and Ocean | +1.53 ± 0.16 | +2.75 ± 0.29 | Warmest | 2nd | 2016 | +1.57 | +2.83 |
| Coolest | 140th | 1893 | -0.89 | -1.60 | |||
| Southern Hemisphere | |||||||
| Land | +1.15 ± 0.14 | +2.07 ± 0.25 | Warmest | 3rd | 2016 | +1.38 | +2.48 |
| Coolest | 139th | 1918 | -0.83 | -1.49 | |||
| Ocean | +0.71 ± 0.16 | +1.28 ± 0.29 | Warmest | 2nd | 2016 | +0.79 | +1.42 |
| Coolest | 140th | 1917 | -0.52 | -0.94 | |||
| Land and Ocean | +0.78 ± 0.15 | +1.40 ± 0.27 | Warmest | 2nd | 2016 | +0.88 | +1.58 |
| Coolest | 140th | 1917 | -0.58 | -1.04 | |||
| Arctic | |||||||
| Land and Ocean | +2.58 ± 0.48 | +4.64 ± 0.86 | Warmest | 4th | 2016 | +3.50 | +6.30 |
| Coolest | 138th | 1966 | -2.55 | -4.59 | |||

Precipitation
March Precipitation
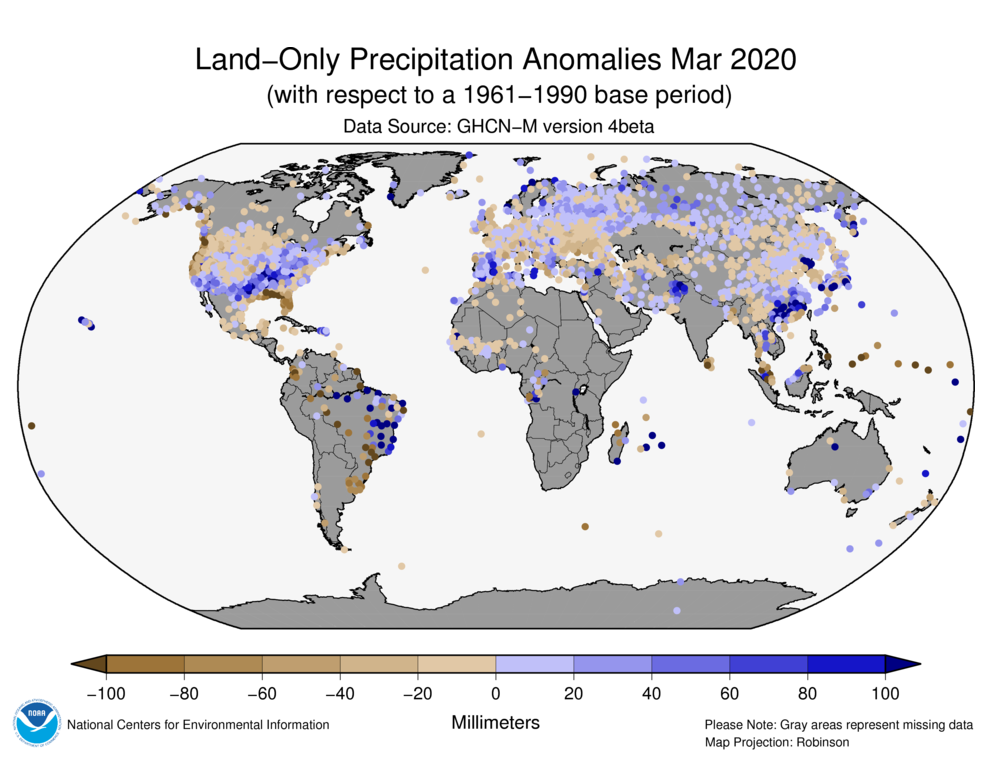

The maps shown above represent precipitation percent of normal (left, using a base period of 1961–1990) and precipitation percentiles (right, using the period of record) based on the GHCN dataset of land surface stations. As is typical, precipitation anomalies during March 2020 varied significantly around the world. March 2020 precipitation was generally drier than normal across parts of the contiguous U.S. Northwest and the Northern Tier, and along the U.S. and Mexico's Gulf Coast, southern Brazil, Uruguay, eastern Europe, eastern Asia, and northern New Zealand. Wetter-than-average conditions were present across parts of Alaska, the southwestern contiguous U.S. up into the Great Lakes, northeastern Brazil, Spain, northern Scandinavia, and across parts of Asia.
Select national information is highlighted below. (Please note that different countries report anomalies with respect to different base periods. The information provided here is based directly upon these data):
- Spain had its seventh wettest March since national records began in 1965 with an average precipitation total of 92 mm (3.62 inches), which is nearly twice the monthly precipitation 1981–2010 normal of 47 mm (1.85 inches). Several locations across Spain set new daily and monthly precipitation records.
- Australia as a whole had a drier-than-average March on record at 15% below average. New South Wales and Tasmania were the only regions to have above-average conditions during March 2020 at 46% and 45% above average, respectively. Several locations across Tasmania had their highest March total rainfall, associated to the passage of the extratropical cyclone Esther.
Global Precipitation Climatology Project (GPCP)
The following analysis is based upon the Global Precipitation Climatology Project (GPCP) Interim Climate Data Record. It is provided courtesy of the GPCP Principal Investigator team at the University of Maryland.
The Global Precipitation Climatology Project (GPCP) monthly data set is a long-term (1979-present) analysis (Adler et al., 2018) using a combination of satellite and gauge information. An interim GPCP analysis completed within ~10 days of the end of the month allows its use in climate monitoring.

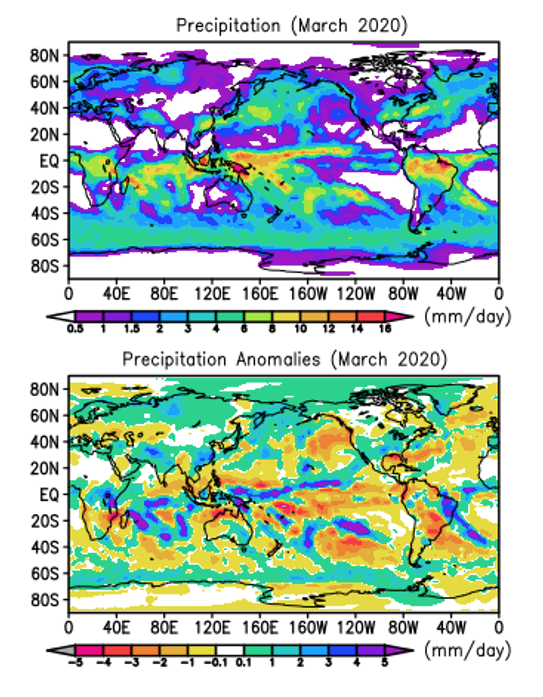
The transition towards spring in the Northern Hemisphere and autumn in the Southern Hemisphere is noted with a subtle northward shift of precipitation features (see Fig. 1a) with a broad rainfall feature extending from the eastern Indian Ocean across Indonesia into the western Pacific Ocean, with tropical land maxima over eastern Africa and South America. All these features are still mainly at or south of the Equator. In the eastern Pacific the first hint of the NH springtime double ITCZ can be discerned. At higher latitudes mid-latitude precipitation features extend to the northeast from China and the U.S. and to the southeast in the South Pacific and off of South America.
In terms of rainfall anomalies for March in the tropics (Fig. 1b) the features are smaller scale than last month starting with a north-south, wet-dry couplet over eastern Africa, continuing the flooding there in Kenya and surrounding countries, but now over a more restricted zone, with Mozambique now the center of the dry area, instead of the devastating floods of last March.
The Indian Ocean is also a scene of small-scale variations, some of which are related to seasonal, but very active tropical cyclone tracks across the area seen as the narrow positive rain anomalies. Over Australia rains in the southeast are still appreciated no doubt, but the monsoon has already retreated northward leaving a rain deficit along the northern coastal territories. A narrow, positive rainfall anomaly extends from the Maritime Continent into the western Pacific with dry anomalies on each side. This feature is co-located with a significant SST warm anomaly right along the Equator. Warm temperatures (above normal) are also evident to the southeast from the Equator to the east of New Zealand, which also has helped tropical cyclone formation and movement which can be detected in the narrow, northwest to southeast positive anomaly features east of Australia.
Further to the east, west of South America, the double ITCZ is weakly evident in Fig. 1a, but is actually better defined in the anomaly field (Fig. 1b) by the parallel east-west oriented negative anomaly features at and just south of the Equator. Over South America heavy rain has continued this month over extreme eastern Brazil with the feature extending southeastward into the South Atlantic. The rest of the continent is dominated by areas of rainfall deficit.
In the northern sub-tropics rainfall features and associated positive anomalies are noted in northwest India through Pakistan into Iran and over eastern China. Even the Hawaiian Islands were affected by a mid-latitude Kona storm stalling over the region and producing significant flooding in the islands and a small, but intense monthly rainfall anomaly in the figure.
At higher latitudes in the North Pacific the mid-latitude maximum extending from China to Alaska has an anomaly field indicating a general shift to the north with negative anomalies along the south side of the feature from the Philippines to the coast of the U.S. A similar pattern is noted in the North Atlantic extending back to the Gulf of Mexico and the immediate Gulf coast of the U.S.
An interesting narrow anomaly feature can be seen connecting the ITCZ southeast of Hawaii with above average precipitation over northern Mexico and most of the contiguous U.S. with a peak in the south-central U.S., where flooding has been prevalent in the lower Mississippi River basin. This type of tropical-mid-latitude connection is a common moisture source for the western U.S. and beyond.
Although the global precipitation trend is near zero, there are significant regional trends (Adler et al., 2017). Fig. 2 shows the long-term (1979-2020) precipitation trend map for March. Comparison of this trend map for April with the anomaly map for March 2020 shows some areas of same sign agreement, for example over the western and eastern parts of the tropical Pacific, the Indian Ocean and high latitude Eurasia. This indicates that the anomalies for this March are tending to reinforce the trend directions in these general areas. This is not the case for the positive anomaly feature described in the previous paragraph which is going against the long-term April trend in this region.
Background discussion of long-term means, variations and trends of global precipitation can be found in Adler et al. (2017).
Ocean Heat Content
Ocean Heat Content (OHC) is essential for understanding and modeling global climate since > 90% of excess heat in the Earth's system is absorbed by the ocean. Further, expansion due to increased ocean heat contributes to sea level rise. Change in OHC is calculated from the difference of observed temperature profiles from the long-term mean.
| Basin | 0-700 meters | Rank (1955-2023) | |||||
|---|---|---|---|---|---|---|
| Entire Basin | Northern Hemisphere | Southern Hemisphere | ||||
| Atlantic | 8.056 | 4th | 4.445 | 5th | 3.611 | 2nd |
| Indian | 3.662 | 6th | 0.674 | 4th | 2.988 | 7th |
| Pacific | 7.513 | 4th | 3.635 | 5th | 3.879 | 4th |
| World | 19.231 | 3rd | 8.754 | 4th | 10.477 | 3rd |
| Source: Basin time series of heat content | ||||||

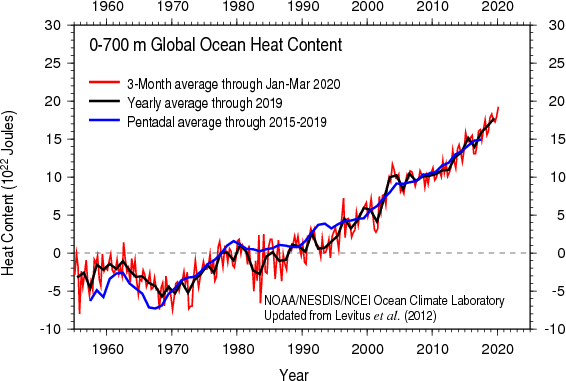
Global OHC for January–March 2020 was the highest January–March OHC, as well as the highest quarterly OHC, in our records, which extend back to 1955. Overall, the latest quarterly OHC reveals widespread warmer than normal, i.e. the 1955–2006 mean, conditions, a situation observed since the end of 2016. Cool conditions, < -10x105 J/m3, appear in the Bay of Bengal and the eastern South Indian Ocean. In contrast, warmer than normal conditions, > 30x105 J/m3, exist in the tropical western and central Indian Ocean. Cooler, < -10x105 J/m3, conditions continue to exist in the tropical and subtropical western Pacific Ocean, with the cool signal extending northeastward into the central North Pacific Ocean. Cool conditions also exist in the subtropical South Pacific Ocean. Much warmer, > 30x105 J/m3, than normal conditions are observed in high latitudes in the Drake Passage, Baffin Bay, and the northeastern coast of Greenland, while cooler than normal conditions persist in the subpolar North Atlantic Ocean south of Greenland and Iceland. Much higher, > 30x105 J/m3, than normal OHC conditions are observed in the Gulf of Mexico, the Gulf Stream/North Atlantic Current, the Northwestern Pacific Ocean, the Southwestern Atlantic Ocean, and the Tasman Sea.
References
- Menne, M. J., C. N. Williams, B.E. Gleason, J. J Rennie, and J. H. Lawrimore, 2018: The Global Historical Climatology Network Monthly Temperature Dataset, Version 4. J. Climate, in press. https://doi.org/10.1175/JCLI-D-18-0094.1.
- Huang, B., Peter W. Thorne, et. al, 2017: Extended Reconstructed Sea Surface Temperature version 5 (ERSSTv5), Upgrades, validations, and intercomparisons. J. Climate, doi: 10.1175/JCLI-D-16-0836.1
- Peterson, T.C. and R.S. Vose, 1997: An Overview of the Global Historical Climatology Network Database. Bull. Amer. Meteorol. Soc., 78, 2837-2849.
- Huang, B., V.F. Banzon, E. Freeman, J. Lawrimore, W. Liu, T.C. Peterson, T.M. Smith, P.W. Thorne, S.D. Woodruff, and H-M. Zhang, 2016: Extended Reconstructed Sea Surface Temperature Version 4 (ERSST.v4). Part I: Upgrades and Intercomparisons. J. Climate, 28, 911-930.
- Adler, R., G. Gu, M. Sapiano, J. Wang, G. Huffman 2017. Global Precipitation: Means, Variations and Trends During the Satellite Era (1979-2014). Surveys in Geophysics 38: 679-699, doi:10.1007/s10712-017-9416-4
- Adler, R., M. Sapiano, G. Huffman, J. Wang, G. Gu, D. Bolvin, L. Chiu, U. Schneider, A. Becker, E. Nelkin, P. Xie, R. Ferraro, D. Shin, 2018. The Global Precipitation Climatology Project (GPCP) Monthly Analysis (New Version 2.3) and a Review of 2017 Global Precipitation. Atmosphere. 9(4), 138; doi:10.3390/atmos9040138