Introduction
PLEASE NOTE: With the May 2019 global report and data release, the National Centers for Environmental Information transitioned to an improved version of NOAA's Global Temperature data set (NOAAGlobalTemp version 5), which includes the updated versions of its global land (GHCNm version 4.0.1) and ocean (ERSST version 5) data sets. Please note that anomalies and ranks reflect the historical record according to these updated versions. Historical months and years may differ from what was reported in previous years. Please visit our Commonly Asked Questions for additional information.
Temperature anomalies and percentiles are shown on the gridded maps below. The anomaly map on the left is a product of a merged land surface temperature (Global Historical Climatology Network, GHCN) and sea surface temperature (ERSST version 5) anomaly analysis. Temperature anomalies for land and ocean are analyzed separately and then merged to form the global analysis. For more information, please visit NCEI's Global Surface Temperature Anomalies page. The percentile map on the right provides additional information by placing the temperature anomaly observed for a specific place and time period into historical perspective, showing how the most current month, season or year compares with the past.
Temperature
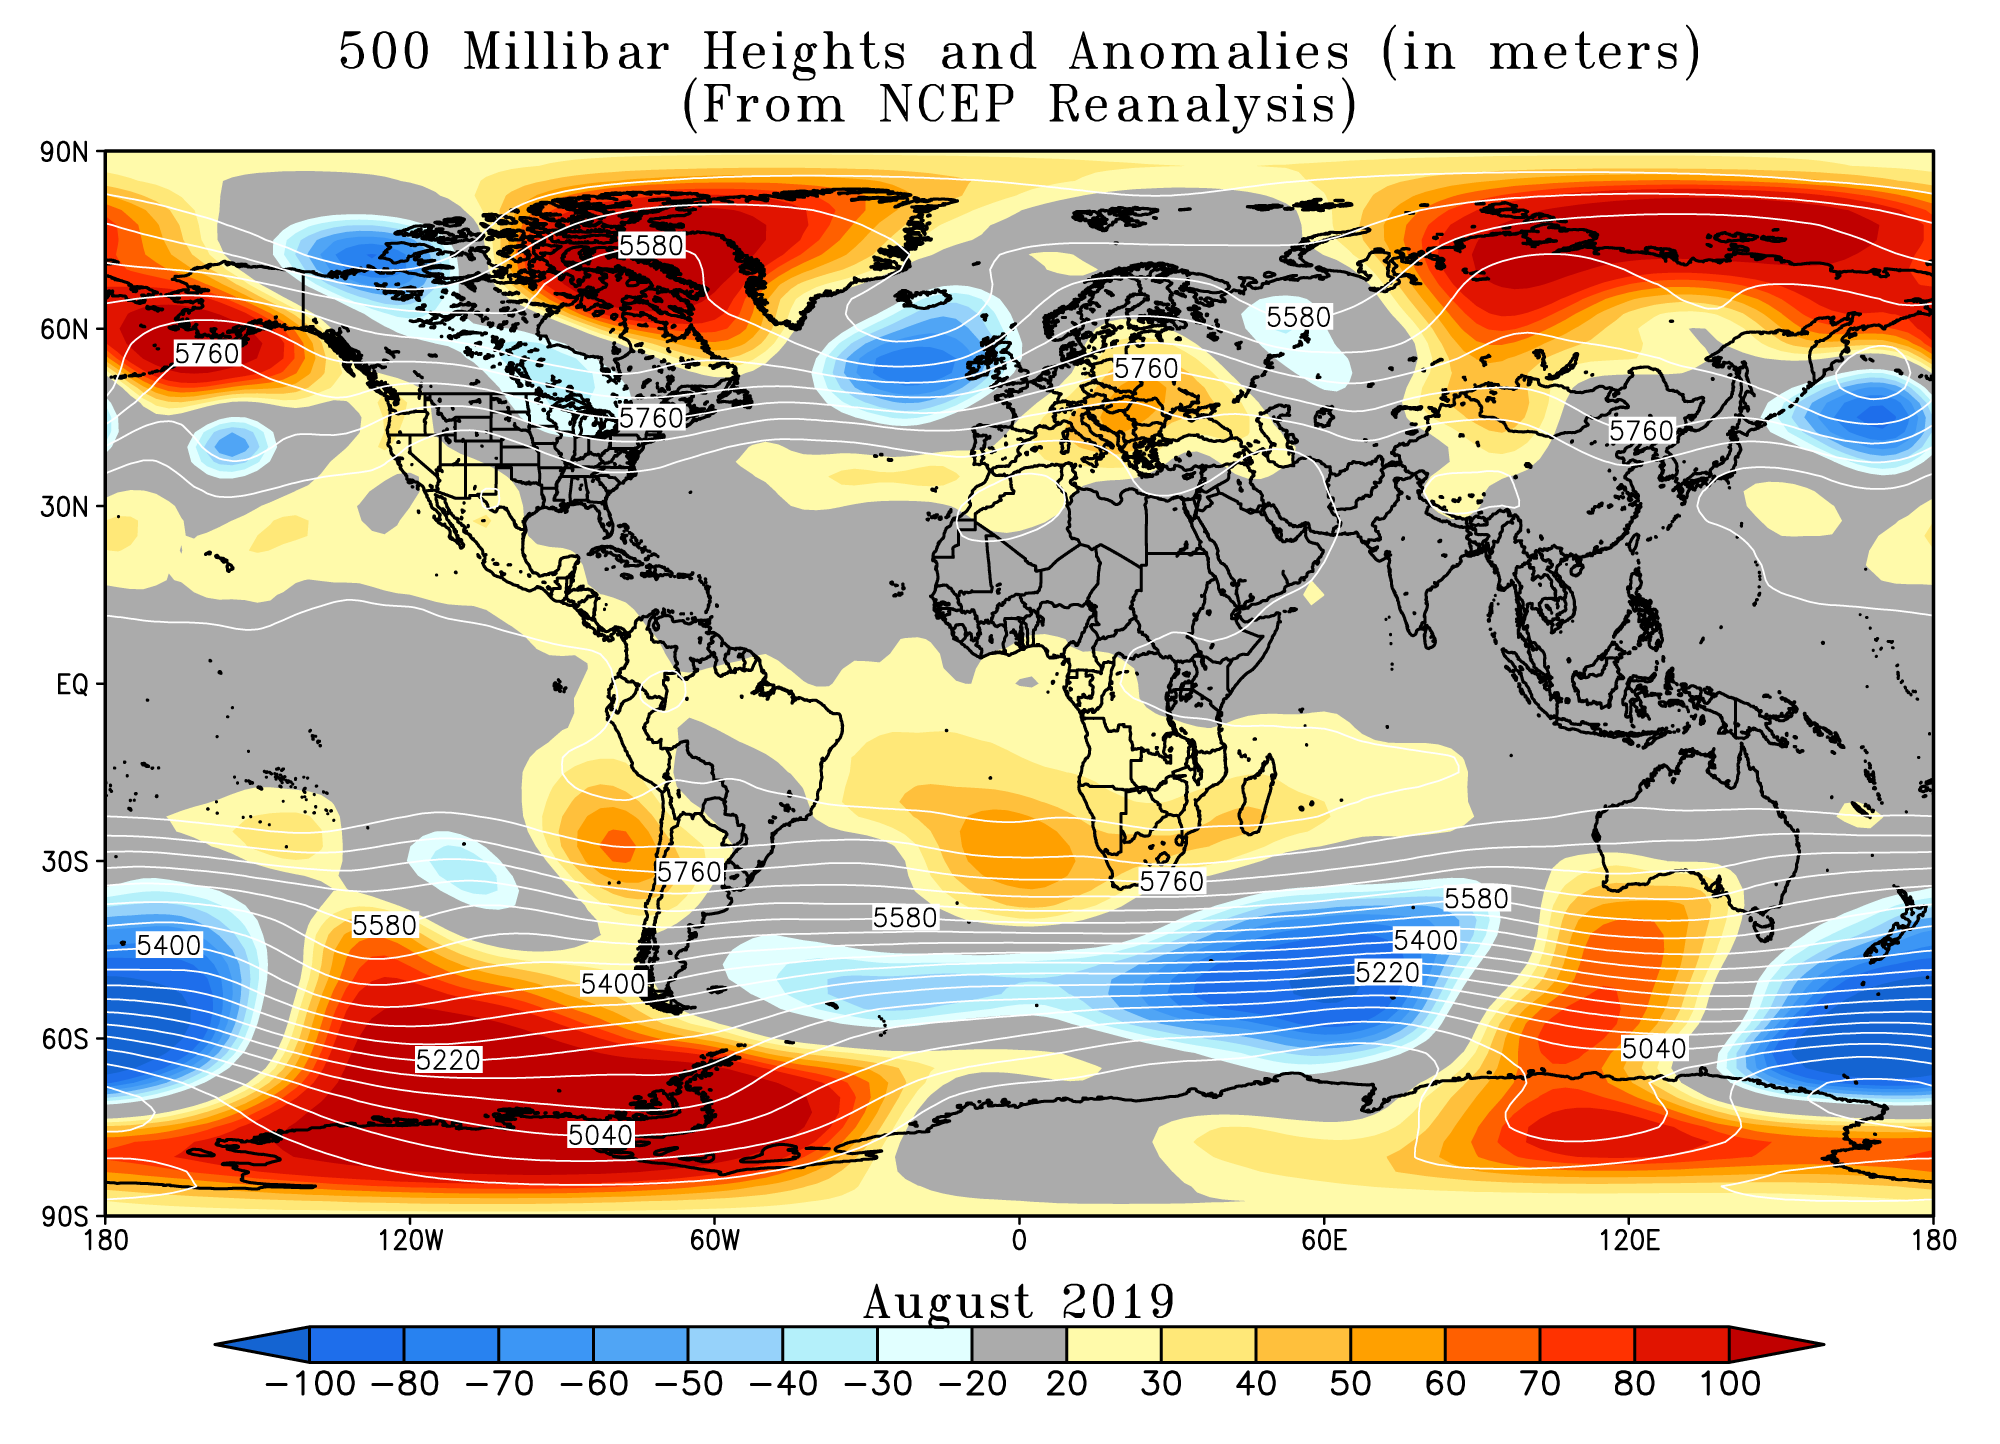
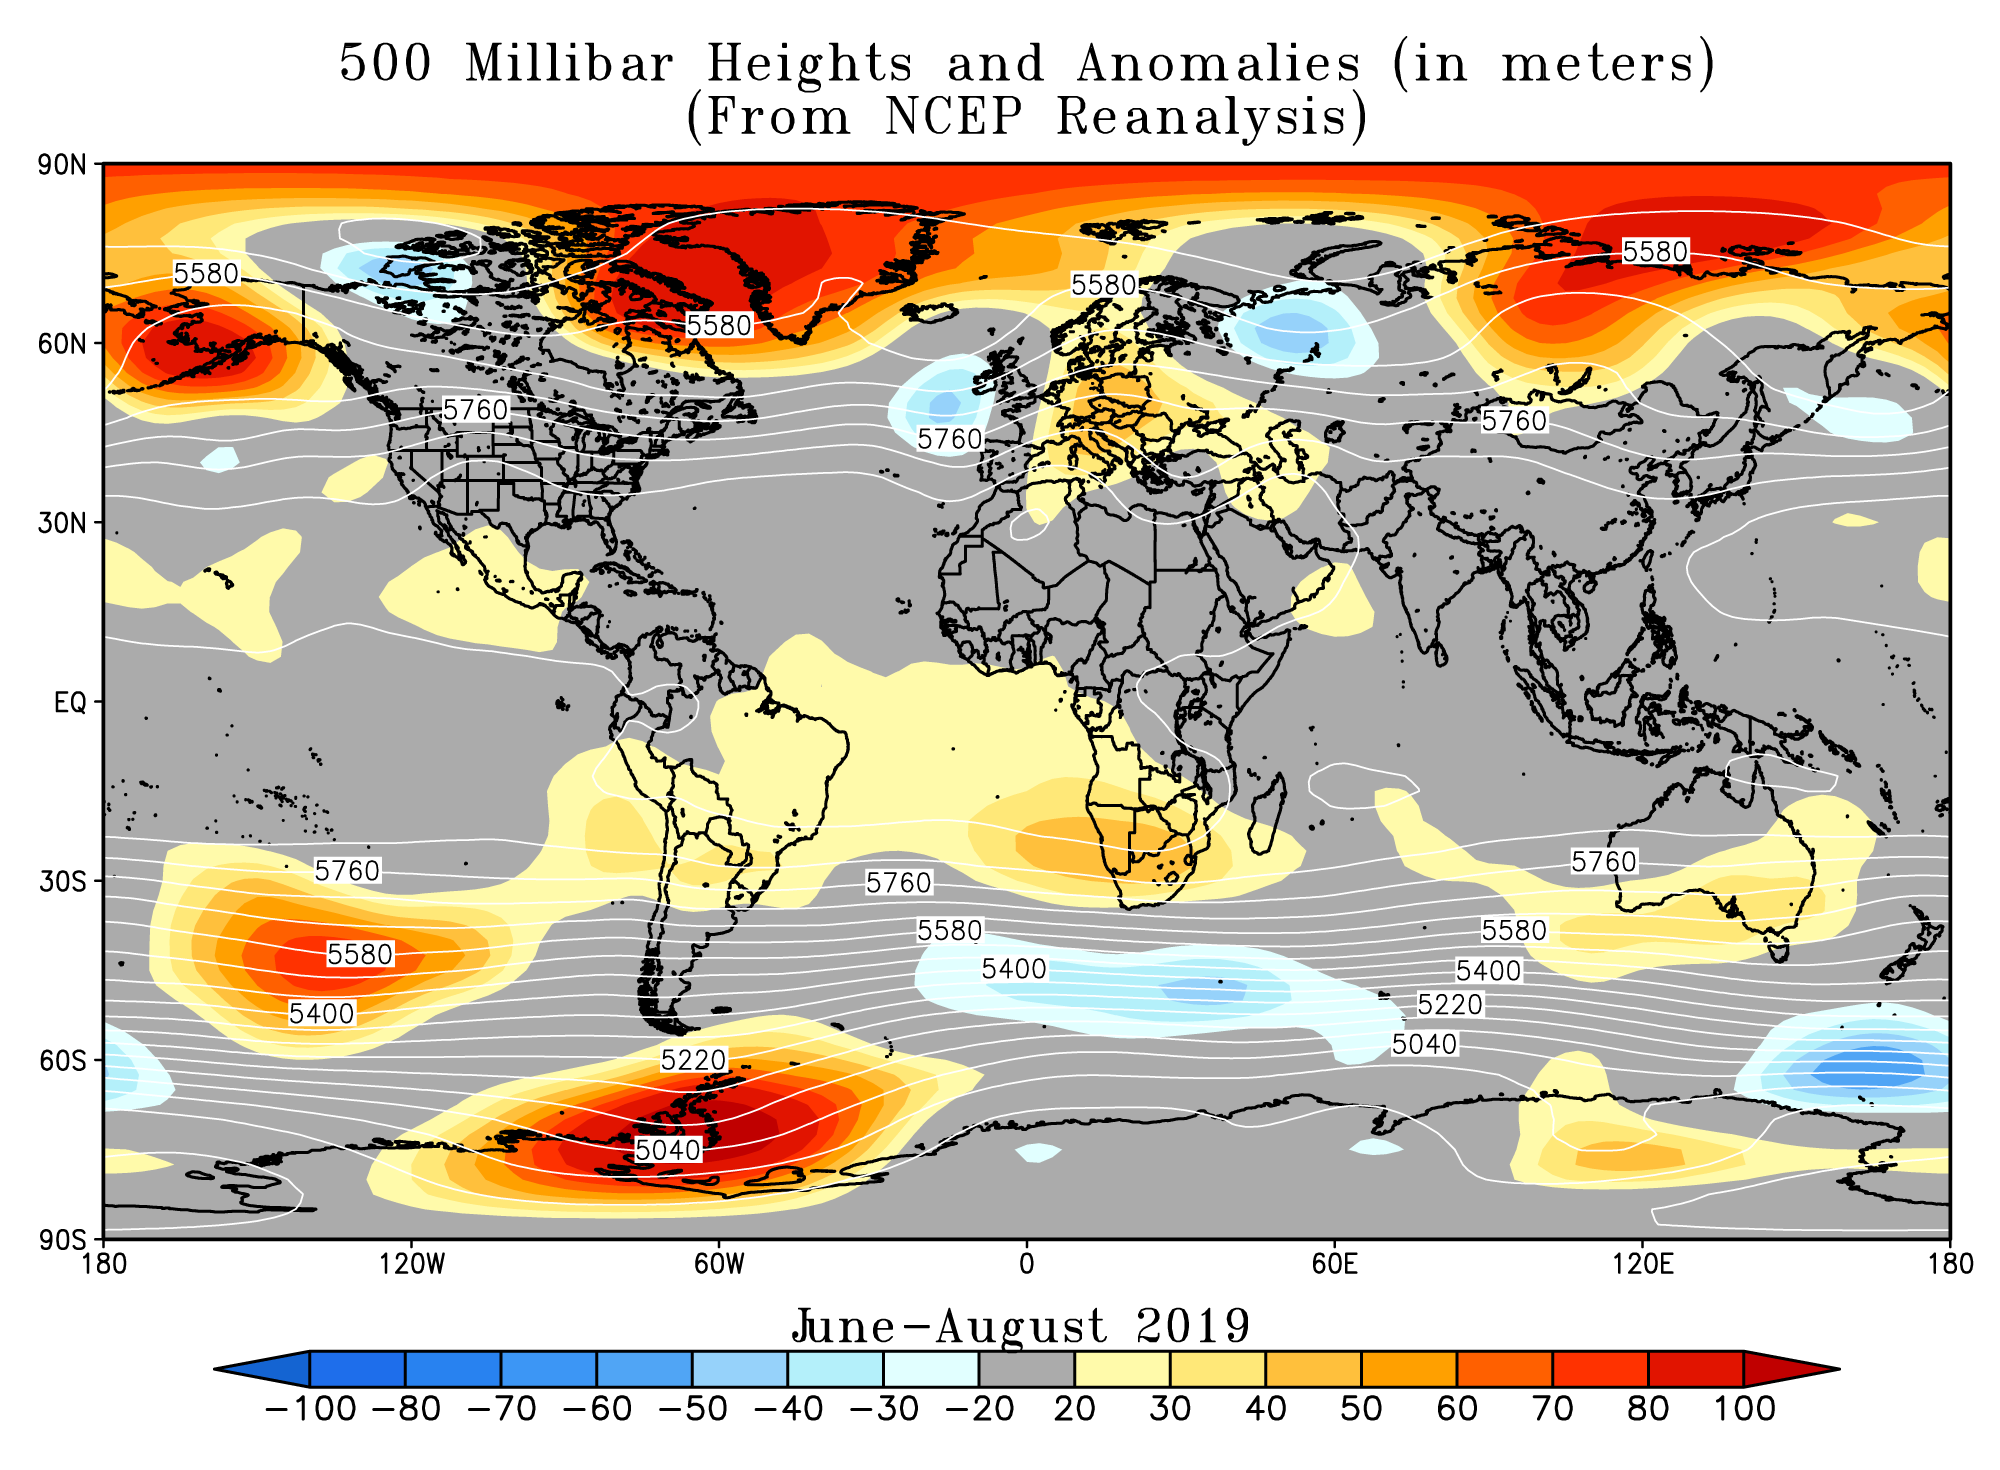
In the atmosphere, 500-millibar height pressure anomalies correlate well with temperatures at the Earth's surface. The average position of the upper-level ridges of high pressure and troughs of low pressure—depicted by positive and negative 500-millibar height anomalies on the August 2019 and June– August 2019 maps—is generally reflected by areas of positive and negative temperature anomalies at the surface, respectively.
Monthly Temperature: August 2019
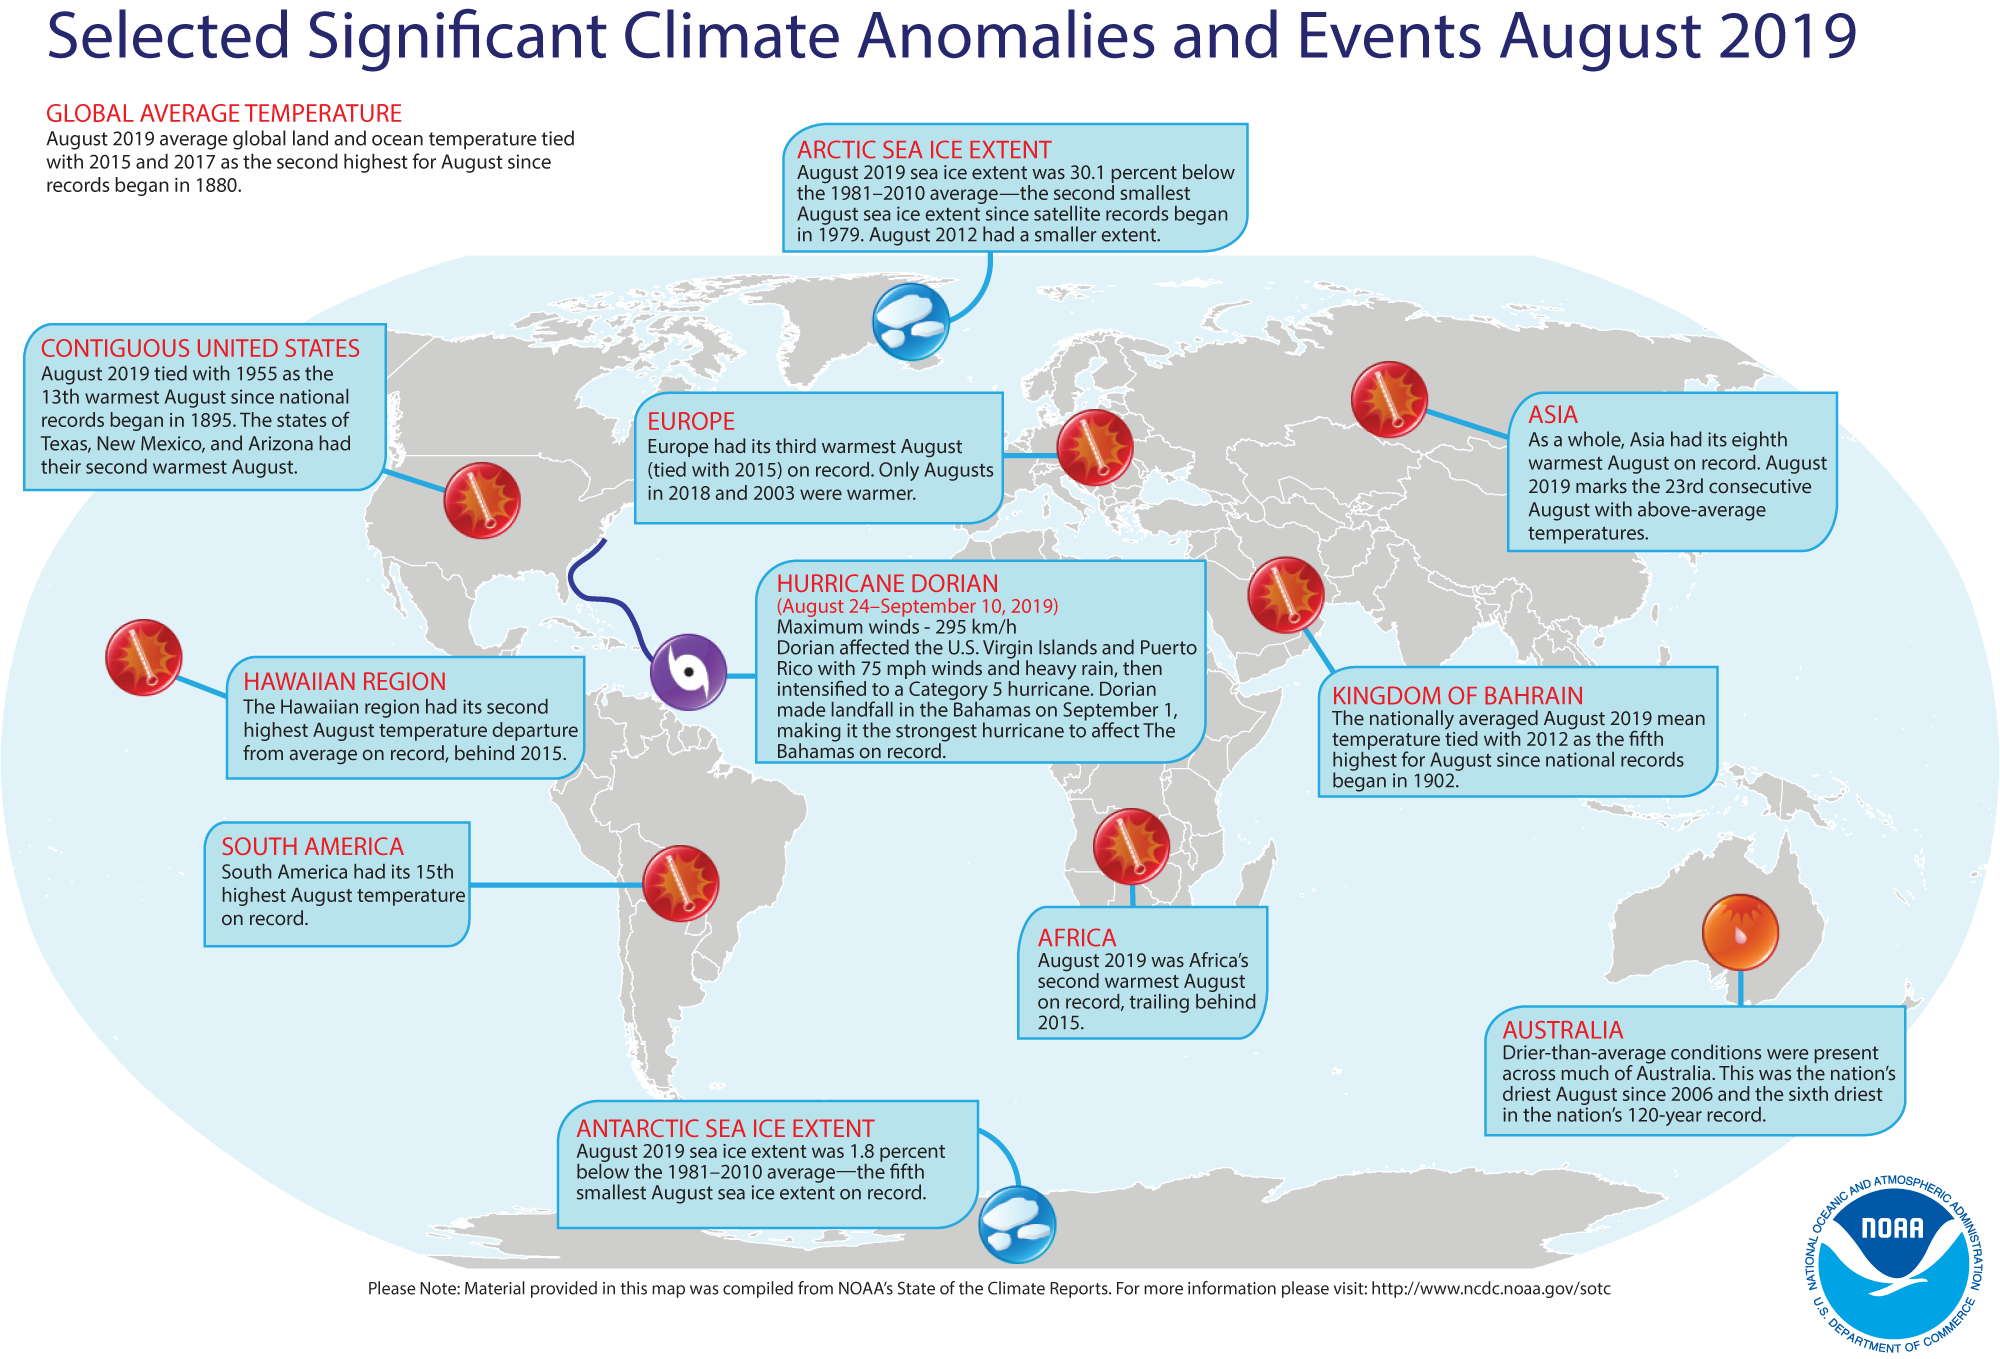
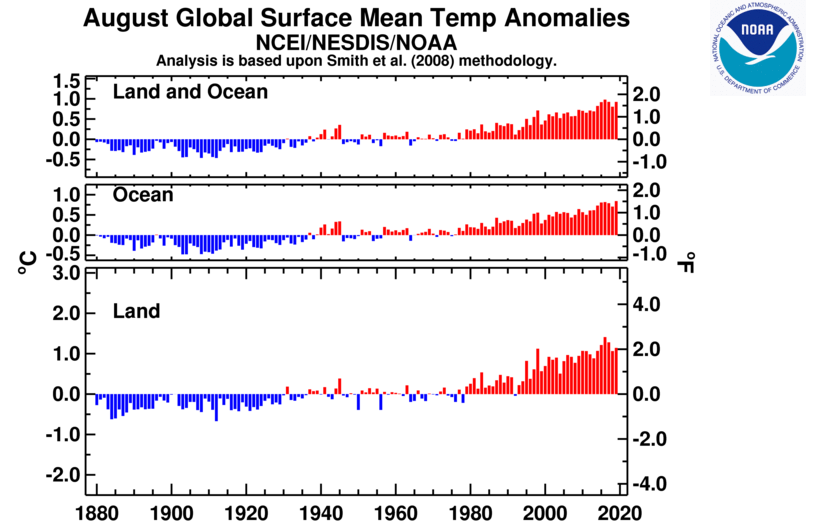
The combined global land and ocean surface temperature for August 2019 was 0.92°C (1.66°F) above the 20th century average of 15.6°C (60.1°F) and tied with 2015 and 2017 as the second highest August temperature departure from average since global records began in 1880. This value is 0.06°C (0.11°F) less than the record warm August set in 2016. Nine of the 10 highest August land and ocean surface temperatures have occurred since 2009, with the five warmest Augusts occurring since 2014. August 1998 is the only August from the 20th century to be among the 10 warmest Augusts on record.

The global land-only surface temperature for August 2019 was the fourth highest August global land-only temperature in the 140-year record at 1.14°C (2.05°F) above the 20th century average of 13.8°C (56.9°F), trailing behind 2016, 2017, and 2015. Meanwhile the global ocean-only temperature departure from average for August 2019 was the highest on record at 0.84°C (1.51°F) above the 20th century average of 16.4°C (61.4°F). The August 2019 global ocean-only temperature exceeded the previous record set in 2016 by 0.02°C (0.04°F). This value also tied with September 2015 as the sixth highest monthly temperature departure from all months (1,676 months) on record. The 10 highest monthly global ocean surface temperature departures from average have occurred since September 2015.
| Rank 1 = Warmest Period of Record: 1880–2019 |
Month + Year | Anomaly °C | Anomaly °F |
|---|---|---|---|
| 1 | January 2016 | 0.91 | 1.64 |
| 2 (tied) | October 2015 | 0.87 | 1.57 |
| 2 (tied) | November 2015 | 0.87 | 1.57 |
| 4 | March 2016 | 0.86 | 1.55 |
| 5 | December 2015 | 0.85 | 1.53 |
| 6 (tied) | September 2015 | 0.84 | 1.51 |
| 6 (tied) | August 2019 | 0.84 | 1.51 |
| 8 (tied) | February 2016 | 0.83 | 1.49 |
| 8 (tied) | July 2019 | 0.83 | 1.49 |
| 10 (tied) | July 2016 | 0.82 | 1.48 |
| 10 (tied) | August 2016 | 0.82 | 1.48 |
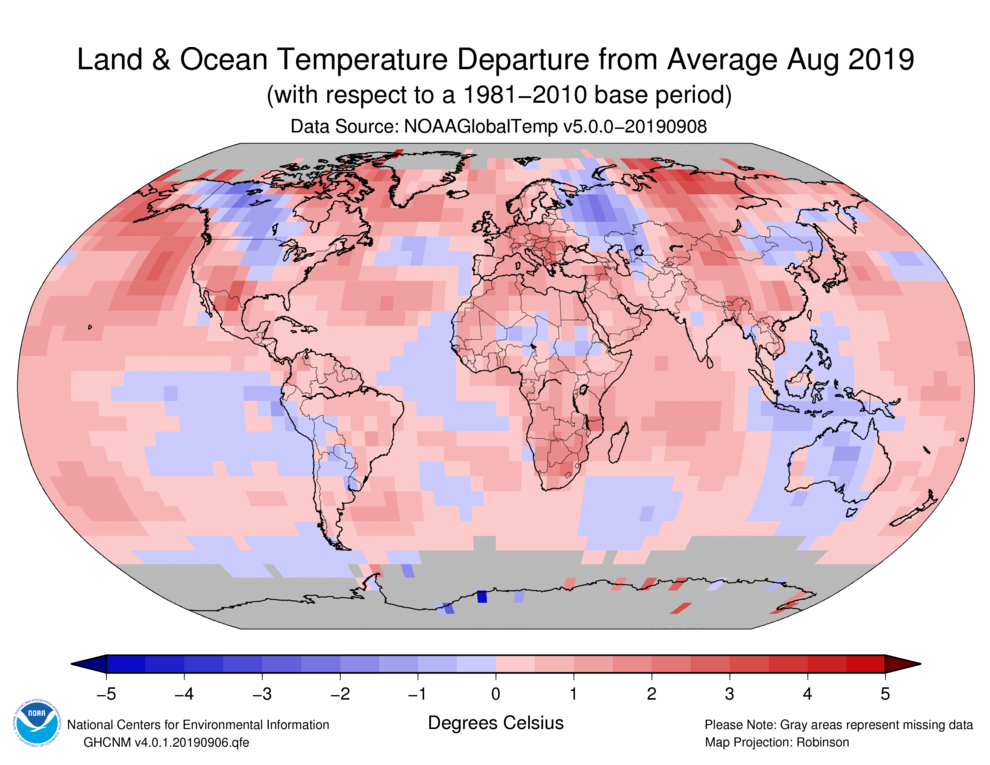

August, which marks the end of the Northern (Southern) Hemisphere's meteorological summer (winter), was characterized by warmer-than-average conditions across much of the world's land and ocean surfaces. The most notable temperature departures from average during August 2019 were present across parts of the North Pacific Ocean, the Bering Sea, northern Canada, the south-central contiguous U.S., the Baffin Bay, central Europe, north-central Russia, as well as parts of southern Africa and eastern Antarctica, where temperatures were at least 1.5°C (2.7°F) above the 1981–2010 average. The most notable cool temperature departures from average occurred across parts of northwestern Canada and western Russia. Temperature departures for these locations were at least 1.5°C (2.7°F) below average or cooler. Record warm August temperature departures from average prevailed across parts of northern and western Pacific Ocean, the Bering Sea, northern and southern parts of North America, the Atlantic Ocean, and Indian Ocean as well as parts of Africa, and central Asia. No land or ocean areas had record-cold August temperatures.
Regionally, Europe, Africa, the Gulf of Mexico, and the Hawaiian region had a temperature departure from average that ranked among the five warmest August since continental records began in 1910. Of note, Africa and the Hawaiian region had their second warmest August on record at +1.50°C (+2.70°F) and +1.27°C (2.29°F), respectively. August 2015 was Africa's (+1.66°C / +2.99°F) and the Hawaiian region's (+1.63°C / +2.93°F) warmest August in the 110-year record.
| August | Anomaly | Rank (out of 140 years) | Records | ||||
|---|---|---|---|---|---|---|---|
| °C | °F | Year(s) | °C | °F | |||
| Global | |||||||
| Land | +1.14 ± 0.24 | +2.05 ± 0.43 | Warmest | 4th | 2016 | +1.41 | +2.54 |
| Coolest | 137th | 1912 | -0.67 | -1.21 | |||
| Ocean | +0.84 ± 0.14 | +1.51 ± 0.25 | Warmest | 1st | 2019 | +0.84 | +1.51 |
| Coolest | 140th | 1903 | -0.48 | -0.86 | |||
| Land and Ocean | +0.92 ± 0.16 | +1.66 ± 0.29 | Warmest | 2nd | 2016 | +0.98 | +1.76 |
| Coolest | 139th | 1908, 1912 | -0.46 | -0.83 | |||
| Ties: 2015, 2017 | |||||||
| Northern Hemisphere | |||||||
| Land | +1.18 ± 0.26 | +2.12 ± 0.47 | Warmest | 4th | 2016 | +1.41 | +2.54 |
| Coolest | 137th | 1884 | -0.91 | -1.64 | |||
| Ocean | +1.12 ± 0.13 | +2.02 ± 0.23 | Warmest | 1st | 2019 | +1.12 | +2.02 |
| Coolest | 140th | 1903 | -0.57 | -1.03 | |||
| Land and Ocean | +1.14 ± 0.20 | +2.05 ± 0.36 | Warmest | 2nd | 2016 | +1.16 | +2.09 |
| Coolest | 139th | 1912 | -0.64 | -1.15 | |||
| Southern Hemisphere | |||||||
| Land | +1.05 ± 0.13 | +1.89 ± 0.23 | Warmest | 7th | 2016 | +1.43 | +2.57 |
| Coolest | 134th | 1891 | -0.88 | -1.58 | |||
| Ocean | +0.63 ± 0.16 | +1.13 ± 0.29 | Warmest | 2nd | 2016 | +0.67 | +1.21 |
| Coolest | 139th | 1911 | -0.42 | -0.76 | |||
| Land and Ocean | +0.70 ± 0.14 | +1.26 ± 0.25 | Warmest | 4th | 2016 | +0.79 | +1.42 |
| Coolest | 137th | 1911 | -0.44 | -0.79 | |||
| Arctic | |||||||
| Land and Ocean | +1.55 ± 0.30 | +2.79 ± 0.54 | Warmest | 3rd | 2016 | +1.73 | +3.11 |
| Coolest | 138th | 1912 | -1.06 | -1.91 | |||

The most current data can be accessed via the Global Surface Temperature Anomalies page.
Select national information is highlighted below. Please note that different countries report anomalies with respect to different base periods. The information provided here is based directly upon these data:
- According to the National Weather Service in San Juan, Puerto Rico, August 2019 tied with 2017 and 1995 as the third warmest August for the San Juan area with a mean temperature of 84.5°F (29.2°C). This value trails behnd the years 1980 (85.0°F / 29.4°C) and 1982 (84.6°F / 29.2°C).
- According to Mexico's Servicio Nacional Meteorológico, August 2019 was Mexico's warmest August and the warmest month for all months on record, with a national mean temperature of 27.0°C (80.6°F) or 3.3°C (5.9°F) above the 1981–2010 average. This value exceeded the previous monthly record of 26.8°C (80.2°F) set in June 2017. Regionally, 12 Mexican states had their warmest August on record.
- Spain had its 10th warmest August since national records began in 1965 at 0.9°C (1.6°C) above the 1981–2010 average. According to Spain's Agencia Estatal de Meteorología, eight of the 10 warmest Augusts on record have occurred since 2009.
- Austria's August 2019 temperature was 1.8°C (3.2°F) above the 1981–2010 average and ranked among the ten warmest Augusts in the nation's 253-year record.
- The Kingdom of Bahrain's August 2019 mean temperature of 35.9°C (96.6°F) was 1.9°C (3.4°F) above average and tied with August 2012 as fifth warmest August since national records began in 1902.
- Near-to-cooler-than-average conditions were present across much of Australia during August 2019, while warmer-than-average conditions remained across the western and eastern coasts. Averaged as a whole, August 2019 was Australia's 40th warmest August on record at 0.26°C (0.47°F) above the 1961–1990 average. Australia's mean and maximum temperatures for August 2019 were warmer than average at 0.26°C (0.47°F) and 0.75°C (1.35°F) above the 1961–1990 average. Meanwhile, the nation's minimum temperature was cooler than average at -0.23°C (-0.41°F). No region had a top ten warm or cool August.
ENSO-neutral persisted during August 2019. According to NOAA's Climate Prediction Center, ENSO-neutral is favored during the Northern Hemisphere winter (Southern Hemisphere summer). This forecast focuses on the ocean surface temperatures between 5°N and 5°S latitude and 170°W to 120°W longitude, called the Niño 3.4 region.
Seasonal Temperature: June–August 2019
The June–August period is defined as the Northern Hemisphere's meteorological summer and the Southern Hemisphere's meteorological winter.
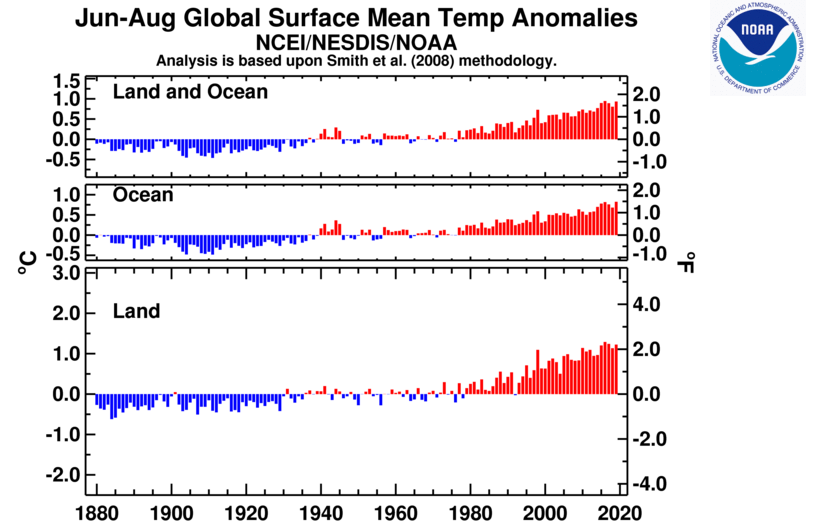
The June–August 2019 period was the second warmest such period in the 140-year record at 0.93°C (1.67°F) above the 20th century average of 15.6°C (60.1°F). This value trails behind June–August 2016 by 0.02°C (0.04°F). Nine of the ten highest June–August global land and ocean surface temperatures have occurred since 2009. June–August of 1998 is the only such period in the 20th century among the ten highest values on record.

The global land-only June–August temperature of 1.22°C (2.20°F) above the 20th century average of 13.8°C (56.9°F) was the third highest such period on record, falling behind 2016 (+1.29°C / +2.32°F) and 2017 (+1.24°C / +2.23°F). Meanwhile, the global ocean-only surface temperature departure from average tied with 2016 as the highest such period on record at 0.82°C (1.48°F) above the 20th century average of 16.4°C (61.5°F). This marks the second time since global records began in 1880 that the global ocean-only June–August temperature was at least 0.80°C (1.44°F) above average or higher.
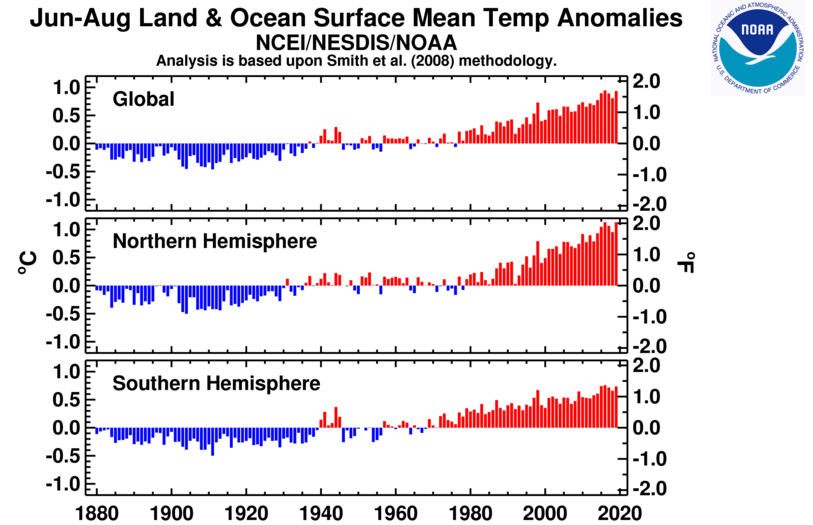
The Northern Hemisphere's global land and ocean surface temperature for summer was 1.13°C (2.03°F) above average, tying with 2016 as the warmest summer on record. The Northern Hemisphere's five warmest summers have all occurred in the last five years. The Southern Hemisphere global land and ocean surface temperature for their winter tied with 2015 as the second highest winter temperature in the 140-year record at 0.74°C (1.33°F) above average. Winter 2016 was warmer by +0.02°C (0.04°F).
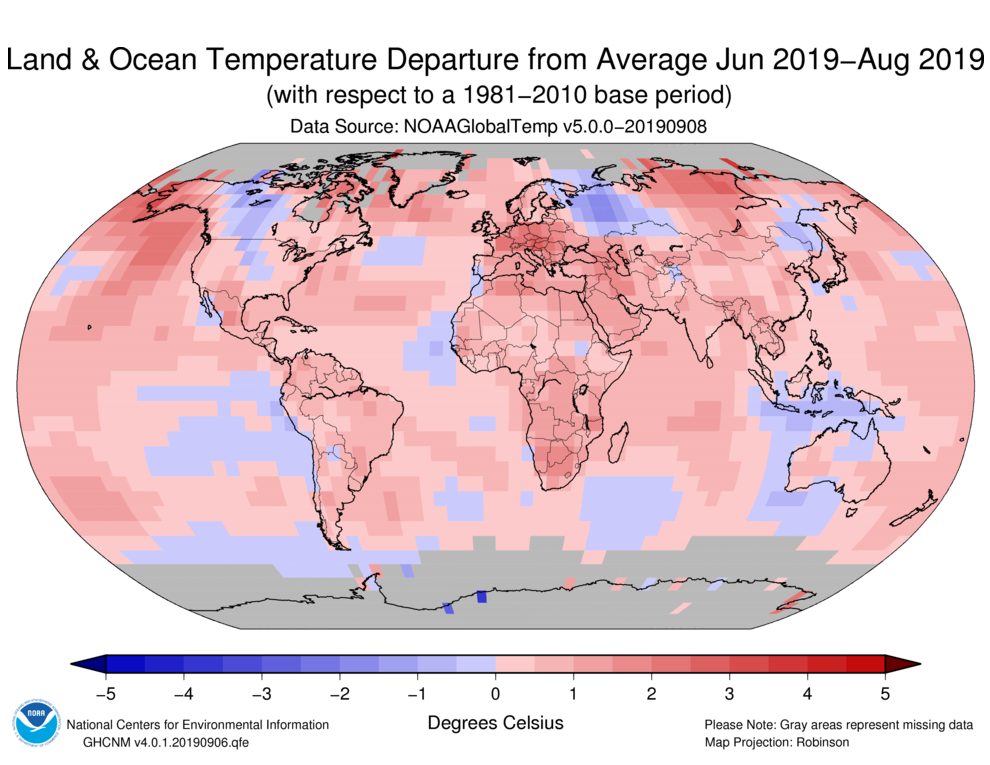
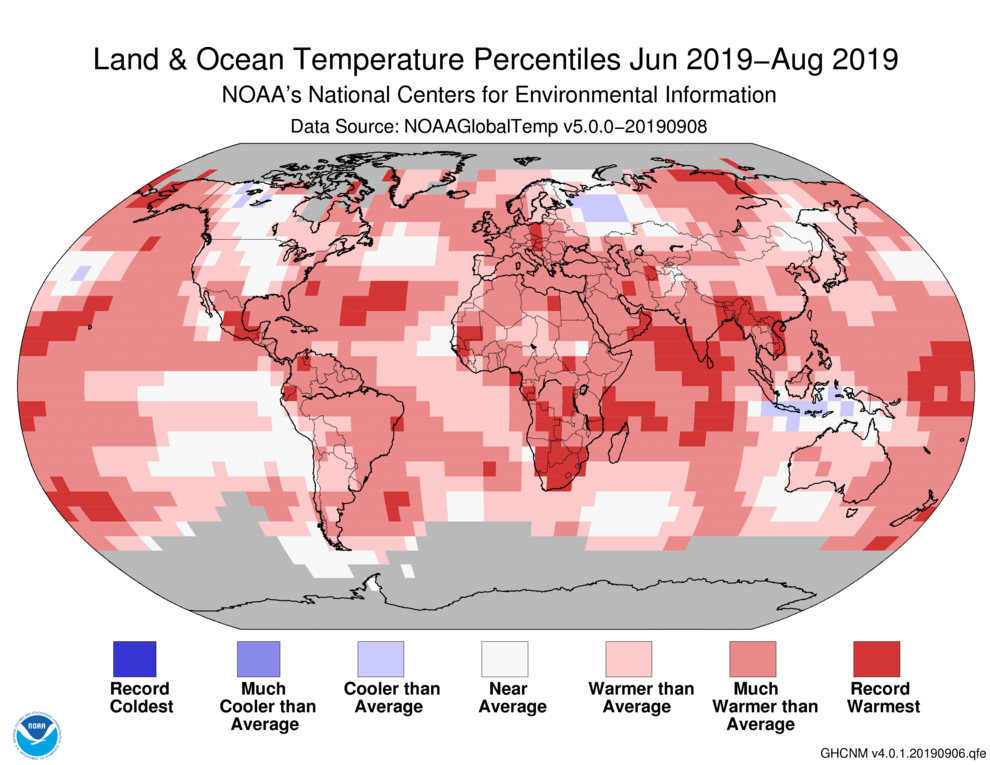
During this three-month period, much of the global land and ocean surfaces had warmer-than-average conditions. Similar to the August 2019 land and ocean map, the most notable temperature departures from averages were present across the North Pacific Ocean, the Bering Sea, northern Canada, central Europe, and northern Russia, where temperatures were at least 1.5°C (2.7°F) above the 1981–2010 average. The most notable cool temperatures during June–August 2019 were in western Canada, western Russia, and Indonesia, where temperatures were 1.0°C (1.8°F) below average or cooler. Record high temperatures were observed across parts of the western coast of Alaska, the Bering Sea, western Pacific Ocean, Mexico, the Atlantic Ocean, western and southern Africa, northern Indian Ocean, and across parts of South America, Europe, and Asia. However, no land or ocean areas had a record-cold June–August temperature.
Regionally, South America, Europe, Africa, the Gulf of Mexico, and the Hawaiian region had a June–August temperature departure from average that ranked among the three warmest such period on record. Africa had its warmest June–August on record at +1.49°C (2.68°F), surpassing the previous record set in 2015 by just 0.01°C (0.02°F). Europe had a summer temperature departure from average of +2.01°C (+3.62°F)—the second warmest summer on record, trailing behind 2018 by 0.27°C (0.49°F). The Gulf of Mexico and the Hawaiian regions also had their second warmest June–August period on record at +1.00°C (+1.80°F) and +1.28°C (2.30°F), respectively.
Select national information is highlighted below. Please note that different countries report anomalies with respect to different base periods. The information provided here is based directly upon these data:
- Summer 2019 was the third warmest summer for France at 1.7°C (3.1°F) above the 1981–2010 average. Only the summers of 2003 (+3.2°C / +5.8°F) and 2018 (+2.0°C / +3.6°F) were warmer.
- Austria's summer temperature was 2.7°C (4.9°F) above average and was the second warmest summer in the nation's 253-year record. This value was only 0.1°C (0.2°F) less than the record warm summer set in 2003. Seven of Austria's ten warmest summers have occurred since 2003. Several locations across Austria had record warm summer temperatures, including Bad Gastein, Eisenstadt, Klagenfurt, among others.
- Germany also had its third warmest summer since national records began in 1881. The nation's June–August 2019 temperature of 19.2°C (66.6°F) was 2.1°C (3.8°F) above the 1981–2010 average. The summers of 2003 (19.7°C / 67.5°F) and 2018 (19.3°C / 66.7°F) were warmer.
- Hong Kong had a much-warmer-than-average summer, with a mean temperature of 29.2°C (84.6°F) and the third highest summer mean temperature on record. The maximum and minimum temperatures were also above average, resulting in the fourth and second warmest on record, respectively.
- Australia had its 15th warmest winter mean temperature since national records began in 1910 with a nationally-averaged temperature of 0.71°C (1.28°F) above the 1961–1990 average. Regionally, Western Australia and New South Wales had their sixth and eighth warmest winter mean temperature on record, respectively. The nation's maximum temperature departure from average was +1.17°C (+2.11°F)—the sixth highest winter maximum temperature on record for Australia. Western Australia had its second highest winter temperature on record at 1.64°C (2.95°F) above average, trailing behind the record warm winter set in 2017 (+2.02°C / +3.64°F).
- New Zealand's winter 2019 temperature was 9.0°C (48.2°F), which is 0.6°C (1.1°F) above the 1981–2010 average and the seventh warmest winter on record.
| June–August | Anomaly | Rank (out of 140 years) | Records | ||||
|---|---|---|---|---|---|---|---|
| °C | °F | Year(s) | °C | °F | |||
| Global | |||||||
| Land | +1.22 ± 0.23 | +2.20 ± 0.41 | Warmest | 3rd | 2016 | +1.29 | +2.32 |
| Coolest | 138th | 1884 | -0.62 | -1.12 | |||
| Ocean | +0.82 ± 0.15 | +1.48 ± 0.27 | Warmest | 1st | 2016, 2019 | +0.82 | +1.48 |
| Coolest | 140th | 1904, 1911 | -0.48 | -0.86 | |||
| Ties: 2016 | |||||||
| Land and Ocean | +0.93 ± 0.17 | +1.67 ± 0.31 | Warmest | 2nd | 2016 | +0.95 | +1.71 |
| Coolest | 139th | 1911 | -0.46 | -0.83 | |||
| Northern Hemisphere | |||||||
| Land | +1.23 ± 0.23 | +2.21 ± 0.41 | Warmest | 5th | 2016 | +1.37 | +2.47 |
| Coolest | 136th | 1884 | -0.70 | -1.26 | |||
| Ties: 2018 | |||||||
| Ocean | +1.06 ± 0.14 | +1.91 ± 0.25 | Warmest | 1st | 2019 | +1.06 | +1.91 |
| Coolest | 140th | 1904 | -0.55 | -0.99 | |||
| Land and Ocean | +1.13 ± 0.19 | +2.03 ± 0.34 | Warmest | 1st | 2016, 2019 | +1.13 | +2.03 |
| Coolest | 140th | 1904 | -0.50 | -0.90 | |||
| Ties: 2016 | |||||||
| Southern Hemisphere | |||||||
| Land | +1.21 ± 0.13 | +2.18 ± 0.23 | Warmest | 3rd | 2015 | +1.32 | +2.38 |
| Coolest | 138th | 1891 | -0.83 | -1.49 | |||
| Ocean | +0.64 ± 0.16 | +1.15 ± 0.29 | Warmest | 2nd | 2016 | +0.69 | +1.24 |
| Coolest | 139th | 1911 | -0.45 | -0.81 | |||
| Land and Ocean | +0.74 ± 0.15 | +1.33 ± 0.27 | Warmest | 2nd | 2016 | +0.76 | +1.37 |
| Coolest | 139th | 1911 | -0.50 | -0.90 | |||
| Ties: 2015 | |||||||
| Arctic | |||||||
| Land and Ocean | +1.55 ± 0.17 | +2.79 ± 0.31 | Warmest | 3rd | 2016 | +1.86 | +3.35 |
| Coolest | 138th | 1884 | -0.93 | -1.67 | |||
Year-to-date Temperature: January–August 2019
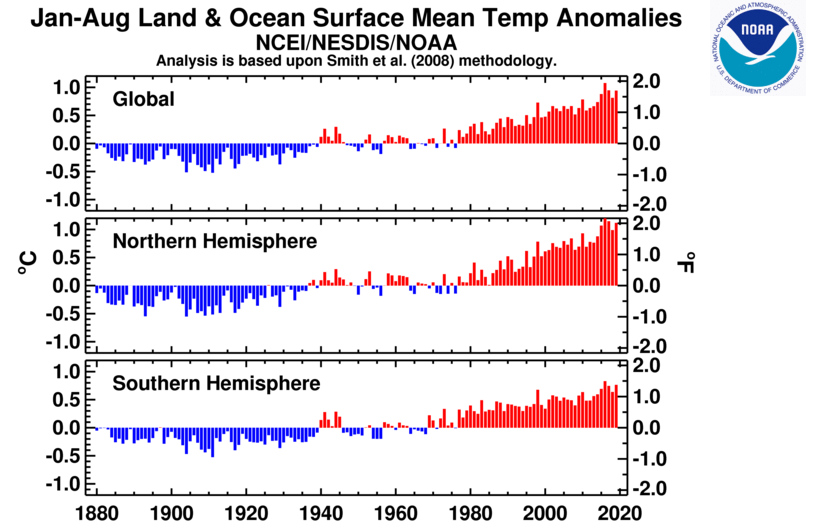
The global land and ocean surface temperature for the first eight months of the year was 0.94°C (1.69°F) above the 20th century average of 14.0°C (57.3°F) and the third highest such period in the 140-year record, trailing behind 2016 and 2017 by 0.14°C (0.25°F) and 0.01°C (0.02°F), respectively. According to NCEI's global annual temperature ranking outlook, it is virtually certain that 2019 will end among the top five warm years, and will most likely finish among the 2nd, 3rd, or 4th warmest year on record.

The global land-only surface temperature for the year-to-date was also the third highest on record at +1.42°C (2.56°F). Only 2016 (+1.73°C / +3.11°F) and 2017 (+1.49°C / +2.68°F) were warmer. The year-to-date global averaged sea surface temperature was 0.76°C (+1.37°F) above average and the second highest on record, trailing behind 2016 by 0.07°C (0.13°F).


The year-to-date period was characterized by warmer-than-average conditions across much of the globe's land and ocean surface. Notable warm temperatures were present across much of Alaska, northwestern Canada, and central Russia, where temperatures were at least 2.5°C (4.5°F) above average. The most notable cooler-than-average temperatures were present across much of the contiguous United States and the southern half of Canada, with temperatures at least 1.0°C (1.8°F) below average or cooler. Record-warm temperatures during the year-to-date period were present across parts of the southern half of Africa, Australia, Alaska, Mexico and Asia, as well as across New Zealand and its surrounding ocean, western Indian Ocean and North Pacific Ocean. No land or ocean areas had record-cold temperatures during January–August 2019.
Regionally, South America, Europe, Africa, Asia, Oceania, and the Hawaiian region had a January–August temperature that ranked among the five highest on record.
Select national information is highlighted below. Please note that different countries report anomalies with respect to different base periods. The information provided here is based directly upon these data:
- The January–August 2019 mean temperature for Australia was the second warmest such period on record, according to Australia's Bureau of Meteorology.
| January–August | Anomaly | Rank (out of 140 years) | Records | ||||
|---|---|---|---|---|---|---|---|
| °C | °F | Year(s) | °C | °F | |||
| Global | |||||||
| Land | +1.42 ± 0.18 | +2.56 ± 0.32 | Warmest | 3rd | 2016 | +1.73 | +3.11 |
| Coolest | 138th | 1885 | -0.73 | -1.31 | |||
| Ocean | +0.76 ± 0.18 | +1.37 ± 0.32 | Warmest | 2nd | 2016 | +0.83 | +1.49 |
| Coolest | 139th | 1904, 1911 | -0.50 | -0.90 | |||
| Land and Ocean | +0.94 ± 0.17 | +1.69 ± 0.31 | Warmest | 3rd | 2016 | +1.08 | +1.94 |
| Coolest | 138th | 1911 | -0.52 | -0.94 | |||
| Northern Hemisphere | |||||||
| Land | +1.45 ± 0.21 | +2.61 ± 0.38 | Warmest | 4th | 2016 | +1.91 | +3.44 |
| Coolest | 137th | 1884 | -0.81 | -1.46 | |||
| Ocean | +0.91 ± 0.17 | +1.64 ± 0.31 | Warmest | 2nd | 2016 | +0.96 | +1.73 |
| Coolest | 139th | 1904 | -0.53 | -0.95 | |||
| Land and Ocean | +1.12 ± 0.18 | +2.02 ± 0.32 | Warmest | 3rd | 2016 | +1.32 | +2.38 |
| Coolest | 138th | 1893, 1904 | -0.55 | -0.99 | |||
| Southern Hemisphere | |||||||
| Land | +1.32 ± 0.14 | +2.38 ± 0.25 | Warmest | 1st | 2019 | +1.32 | +2.38 |
| Coolest | 140th | 1917 | -0.82 | -1.48 | |||
| Ocean | +0.66 ± 0.18 | +1.19 ± 0.32 | Warmest | 3rd | 2016 | +0.74 | +1.33 |
| Coolest | 138th | 1911 | -0.50 | -0.90 | |||
| Land and Ocean | +0.76 ± 0.17 | +1.37 ± 0.31 | Warmest | 2nd | 2016 | +0.83 | +1.49 |
| Coolest | 139th | 1911 | -0.52 | -0.94 | |||
| Arctic | |||||||
| Land and Ocean | +2.23 ± 0.23 | +4.01 ± 0.41 | Warmest | 2nd | 2016 | +2.64 | +4.75 |
| Coolest | 139th | 1902 | -1.31 | -2.36 | |||

Precipitation
August Precipitation


The maps shown above represent precipitation percent of normal (left, using a base period of 1961–1990) and precipitation percentiles (right, using the period of record) based on the GHCN dataset of land surface stations. As is typical, precipitation anomalies during August 2019 varied significantly around the world. August precipitation was generally drier than normal across parts of the west and south-central contiguous U.S., Mexico, southern South America, southern Europe, northeastern Russia, western Mongolia, western and southern China, as well as parts of Australia and the southeastern Pacific Islands. Wetter-than-normal conditions were notable across the central and southeastern contiguous U.S., northern Alaska, northern Europe, western Africa, western Russia, eastern Mongolia, India, and Japan.
Select national information is highlighted below. (Please note that different countries report anomalies with respect to different base periods. The information provided here is based directly upon these data):
- Drier-than-average conditions were present across much of Australia. Averaged as a whole, this was the nation's driest August since 2006 and the sixth driest since national precipitation records began in 1900 at 54% below average. Regionally, New South Wales had its driest August since 1995 and the fifth driest on record. The Northern Territory had no precipitation during the month of August.
June–August Precipitation


June–August precipitation was generally drier than normal across parts of the western half of the contiguous U.S., southern Chile, northern Argentina, northeastern and southern Brazil, central Europe, central and eastern Russia, Mongolia, southern China, and Australia. Wetter-than-normal conditions were notable across the eastern half of the contiguous U.S., eastern Argentina, the British Isles, southeastern Europe, western Russia, India, and Japan.
Select national information is highlighted below. (Please note that different countries report anomalies with respect to different base periods. The information provided here is based directly upon these data):
- Winter 2019 was characterized by drier-than-average conditions across much of Australia. This resulted in the lowest winter precipitation since 2002 and the ninth lowest since national precipitation records began in 1900 at 43% below average. Regionally, New South Wales, Northern Territory, and South Australia had a winter precipitation total that ranked among the 10 driest winters on record. Tasmania was the only region with above-average conditions at 13% above average.
References
- Menne, M. J., C. N. Williams, B.E. Gleason, J. J Rennie, and J. H. Lawrimore, 2018: The Global Historical Climatology Network Monthly Temperature Dataset, Version 4. J. Climate, in press. https://doi.org/10.1175/JCLI-D-18-0094.1.
- Huang, B., Peter W. Thorne, et. al, 2017: Extended Reconstructed Sea Surface Temperature version 5 (ERSSTv5), Upgrades, validations, and intercomparisons. J. Climate, doi: 10.1175/JCLI-D-16-0836.1
- Peterson, T.C. and R.S. Vose, 1997: An Overview of the Global Historical Climatology Network Database. Bull. Amer. Meteorol. Soc., 78, 2837-2849.
- Huang, B., V.F. Banzon, E. Freeman, J. Lawrimore, W. Liu, T.C. Peterson, T.M. Smith, P.W. Thorne, S.D. Woodruff, and H-M. Zhang, 2016: Extended Reconstructed Sea Surface Temperature Version 4 (ERSST.v4). Part I: Upgrades and Intercomparisons. J. Climate, 28, 911-930.