Introduction
Temperature anomalies and percentiles are shown on the gridded maps below. The anomaly map on the left is a product of a merged land surface temperature (Global Historical Climatology Network, GHCN) and sea surface temperature (ERSST.v4) anomaly analysis as described in Huang et al. (2018). Temperature anomalies for land and ocean are analyzed separately and then merged to form the global analysis. For more information, please visit NCEI's Global Surface Temperature Anomalies page. The percentile map on the right provides additional information by placing the temperature anomaly observed for a specific place and time period into historical perspective, showing how the most current month, season or year compares with the past.
Supplemental December 2018 Information
Temperatures
In the atmosphere, 500-millibar height pressure anomalies correlate well with temperatures at the Earth's surface. The average position of the upper-level ridges of high pressure and troughs of low pressure—depicted by positive and negative 500-millibar height anomalies on the December 2018 map—is generally reflected by areas of positive and negative temperature anomalies at the surface, respectively.
December


The global land and ocean surface temperature for December 2018 was the second highest since global records began in 1880 at 0.86°C (1.55°F) above the 20th century average. This value trails behind the record year 2015 by 0.27°C (0.49°F).
Notable warm temperature anomalies were observed across much of North America, northern Russia, and Australia, where temperatures were 3.0°C (5.4°F) above average or higher. Of note, parts of the southwestern Indian Ocean had temperatures that were at least 1.0°C (1.8°F) above average or higher. Record warm temperatures were mainly present across much of the Southern Hemisphere, specifically across much of Australia, the southwestern Indian Ocean and across parts of the northwestern Indian Ocean, and the south Atlantic, off the eastern coast of Argentina. According to Australia's Bureau of Meteorology, Australia had its warmest December on record with a mean temperature that was 2.13°C (3.83°F) above the 1961–1990 average. Notable cool temperatures were present across much of central Asia and Far East Russia where temperature departures were -3.0°C (-5.4°F) or lower. However, no land or ocean areas had record cold December temperatures.
The global land-only surface temperature was 1.17°C (2.11°F) above average, tying with 1939 as the eighth highest December temperature on record. Meanwhile, the global ocean-only temperature was also second highest on record at +0.75°C (+1.35°F).
Three of six continents had a December temperature that ranked among the seven highest on record. Of note, Oceania had its warmest December on record at 1.90°C (3.42°F) above average. This was 0.40°C (0.72°F) higher than the previous record set in 1972. South America and Asia had their coolest December since 2011 and 2012, respectively.
Regionally, the Hawaiian Region had its warmest December since 1995 and the fourth warmest since regional records began in 1910. The Caribbean Islands December 2018 temperature tied with 2012 and 1942 as the ninth warmest December on record. Meanwhile, The Atlantic Main Development Region had its coolest December since 2000.
ENSO-neutral persisted during December 2018. According to NOAA's Climate Prediction Center, El Niño is expected to form and continue through the Northern Hemisphere spring (Southern Hemisphere autumn). This forecast focuses on the ocean surface temperatures between 5°N and 5°S latitude and 170°W to 120°W longitude, called the Niño 3.4 region.
| December | Anomaly | Rank (out of 139 years) | Records | ||||
|---|---|---|---|---|---|---|---|
| °C | °F | Year(s) | °C | °F | |||
| Global | |||||||
| Land | +1.17 ± 0.13 | +2.11 ± 0.23 | Warmest | 8th | 2015 | +1.89 | +3.40 |
| Coolest | 132nd | 1929 | -1.24 | -2.23 | |||
| Ties: 1939 | |||||||
| Ocean | +0.75 ± 0.15 | +1.35 ± 0.27 | Warmest | 2nd | 2015 | +0.85 | +1.53 |
| Coolest | 138th | 1910 | -0.48 | -0.86 | |||
| Land and Ocean | +0.86 ± 0.14 | +1.55 ± 0.25 | Warmest | 2nd | 2015 | +1.13 | +2.03 |
| Coolest | 138th | 1910, 1916 | -0.57 | -1.03 | |||
| Northern Hemisphere | |||||||
| Land | +1.14 ± 0.13 | +2.05 ± 0.23 | Warmest | 14th | 2015 | +2.08 | +3.74 |
| Coolest | 126th | 1917, 1929 | -1.54 | -2.77 | |||
| Ocean | +0.83 ± 0.15 | +1.49 ± 0.27 | Warmest | 2nd | 2015 | +0.98 | +1.76 |
| Coolest | 138th | 1910 | -0.46 | -0.83 | |||
| Land and Ocean | +0.95 ± 0.13 | +1.71 ± 0.23 | Warmest | 5th | 2015 | +1.40 | +2.52 |
| Coolest | 135th | 1917 | -0.73 | -1.31 | |||
| Ties: 2003 | |||||||
| Southern Hemisphere | |||||||
| Land | +1.23 ± 0.12 | +2.21 ± 0.22 | Warmest | 2nd | 2015 | +1.38 | +2.48 |
| Coolest | 138th | 1903 | -0.77 | -1.39 | |||
| Ocean | +0.68 ± 0.15 | +1.22 ± 0.27 | Warmest | 2nd | 2015 | +0.75 | +1.35 |
| Coolest | 138th | 1910 | -0.51 | -0.92 | |||
| Land and Ocean | +0.77 ± 0.14 | +1.39 ± 0.25 | Warmest | 2nd | 2015 | +0.85 | +1.53 |
| Coolest | 138th | 1910 | -0.52 | -0.94 | |||
| Arctic | |||||||
| Land and Ocean | +2.13 ± 0.48 | +3.83 ± 0.86 | Warmest | 10th | 2017 | +3.05 | +5.49 |
| Coolest | 130th | 1916 | -2.73 | -4.91 | |||

The most current data can be accessed via the Global Surface Temperature Anomalies page.
Year-to-date (January–December)

Please refer to the NCEI State of the Climate Annual Global Analysis report for additional information.
| January–December | Anomaly | Rank (out of 139 years) | Records | ||||
|---|---|---|---|---|---|---|---|
| °C | °F | Year(s) | °C | °F | |||
| Global | |||||||
| Land | +1.12 ± 0.14 | +2.02 ± 0.25 | Warmest | 4th | 2016 | +1.45 | +2.61 |
| Coolest | 136th | 1884 | -0.62 | -1.12 | |||
| Ocean | +0.66 ± 0.16 | +1.19 ± 0.29 | Warmest | 4th | 2016 | +0.76 | +1.37 |
| Coolest | 136th | 1909 | -0.45 | -0.81 | |||
| Land and Ocean | +0.79 ± 0.15 | +1.42 ± 0.27 | Warmest | 4th | 2016 | +0.95 | +1.71 |
| Coolest | 136th | 1908 | -0.44 | -0.79 | |||
| Northern Hemisphere | |||||||
| Land | +1.18 ± 0.16 | +2.12 ± 0.29 | Warmest | 5th | 2016 | +1.59 | +2.86 |
| Coolest | 135th | 1884 | -0.70 | -1.26 | |||
| Ocean | +0.75 ± 0.16 | +1.35 ± 0.29 | Warmest | 5th | 2015 | +0.89 | +1.60 |
| Coolest | 135th | 1908, 1909 | -0.47 | -0.85 | |||
| Land and Ocean | +0.92 ± 0.15 | +1.66 ± 0.27 | Warmest | 4th | 2016 | +1.14 | +2.05 |
| Coolest | 136th | 1908 | -0.47 | -0.85 | |||
| Southern Hemisphere | |||||||
| Land | +0.97 ± 0.11 | +1.75 ± 0.20 | Warmest | 4th | 2015 | +1.10 | +1.98 |
| Coolest | 136th | 1917 | -0.64 | -1.15 | |||
| Ocean | +0.58 ± 0.16 | +1.04 ± 0.29 | Warmest | 3rd | 2016 | +0.69 | +1.24 |
| Coolest | 137th | 1911 | -0.43 | -0.77 | |||
| Ties: 2017 | |||||||
| Land and Ocean | +0.65 ± 0.15 | +1.17 ± 0.27 | Warmest | 4th | 2016 | +0.75 | +1.35 |
| Coolest | 136th | 1911 | -0.44 | -0.79 | |||
| Arctic | |||||||
| Land and Ocean | +1.40 ± 0.11 | +2.52 ± 0.20 | Warmest | 8th | 2016 | +2.08 | +3.74 |
| Coolest | 132nd | 1902 | -1.26 | -2.27 | |||


The most current data can be accessed via the Global Surface Temperature Anomalies page.
Precipitation
December
The maps below represent precipitation percent of normal (left, using a base period of 1961–1990) and precipitation percentiles (right, using the period of record) based on the GHCN dataset of land surface stations. As is typical, precipitation anomalies during December 2018 varied significantly around the world. Drier-than-average conditions were present across much of the western contiguous U.S., Canada, southern South America, northern and southern parts of Africa, Spain, eastern Mongolia, eastern Russia, and across much of Australia. Wetter-than-average conditions were observed across the eastern half of the contiguous U.S., northeastern Argentina, central and eastern Europe, South Korea, and southern parts of Japan.

Ocean Heat Content
Ocean Heat Content (OHC) is essential for understanding and modeling global climate since > 90% of excess heat in the Earth's system is absorbed by the ocean. Further, expansion due to increased ocean heat contributes to sea level rise. Change in OHC is calculated from the difference of observed temperature profiles from the long-term mean.
| Basin | 0-700 meters | Rank (1955-2023) | |||||
|---|---|---|---|---|---|---|
| Entire Basin | Northern Hemisphere | Southern Hemisphere | ||||
| Atlantic | 7.115 | 6th | 4.046 | 5th | 3.069 | 6th |
| Indian | 3.878 | 10th | 0.538 | 14th | 3.340 | 8th |
| Pacific | 6.788 | 4th | 2.786 | 7th | 4.002 | 1st |
| World | 17.797 | 5th | 7.386 | 7th | 10.411 | 4th |
| Source: Basin time series of heat content | ||||||

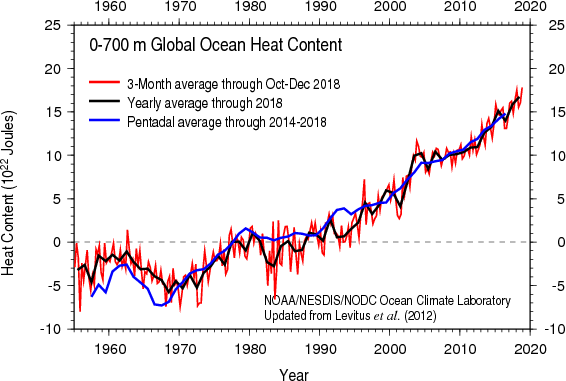
Global ocean heat content (OHC) for October–December 2018 was the highest October–December OHC, as well as the highest quarterly OHC, in our records, which extend back to 1955. In fact, 2018 was the warmest year on record for the World Ocean. Overall, the latest quarterly OHC reveals widespread warmer than normal, i.e. the 1955–2006 mean, conditions, a situation observed since the end of 2016. As in the previous two quarters, warmer than normal conditions, about 10x105 J/m3, notably occupy the entire equatorial Pacific Ocean. In contrast, much cooler, < -20x105 J/m3, than normal conditions continue to extend eastward from the Philippines in the subtropical western and central North Pacific Ocean. Much higher, > 30x105 J/m3, than normal OHC conditions are observed in the Barents Sea, the Gulf Stream/North Atlantic Current, the Brazil Current, the Kuroshio Current/Kuroshio Extension, and along the northern Antarctic Cirumpolar Current in the Indian Ocean. Much cooler than normal conditions persist in the subpolar North Atlantic Ocean south of Greenland and Iceland, and in the southern Norwegian Sea.
References
December
- Peterson, T.C. and R.S. Vose, 1997: An Overview of the Global Historical Climatology Network Database. Bull. Amer. Meteorol. Soc., 78, 2837-2849.
- Huang, B., V.F. Banzon, E. Freeman, J. Lawrimore, W. Liu, T.C. Peterson, T.M. Smith, P.W. Thorne, S.D. Woodruff, and H-M. Zhang, 2018: Extended Reconstructed Sea Surface Temperature Version 4 (ERSST.v4). Part I: Upgrades and Intercomparisons. J. Climate, 28, 911-930.