
Introduction
Temperature anomalies and percentiles are shown on the gridded maps below. The anomaly map on the left is a product of a merged land surface temperature (Global Historical Climatology Network, GHCN) and sea surface temperature (ERSST.v4) anomaly analysis as described in Huang et al. (2016). Temperature anomalies for land and ocean are analyzed separately and then merged to form the global analysis. For more information, please visit NCEI's Global Surface Temperature Anomalies page. The percentile map on the right provides additional information by placing the temperature anomaly observed for a specific place and time period into historical perspective, showing how the most current month, season or year compares with the past.
Temperatures
In the atmosphere, 500-millibar height pressure anomalies correlate well with temperatures at the Earth's surface. The average position of the upper-level ridges of high pressure and troughs of low pressure—depicted by positive and negative 500-millibar height anomalies on the November 2018 and September–November 2018 maps—is generally reflected by areas of positive and negative temperature anomalies at the surface, respectively.
November


The month was characterized by warmer- to much-warmer-than-average conditions across much of the globe. The most notable temperature departures from average during November 2018 were present across the Northern Hemisphere land, with much of Alaska, western Canada, Scandinavia and parts of eastern Russia with temperatures that were 3.0°C (5.4°F) above average or higher. Meanwhile, much of the contiguous U.S. and central and eastern Canada, and parts of northern and central Asia had temperature departures from average that were 2.0°C (3.6°F) below average or cooler. The most notable ocean temperatures were observed in the South Atlantic Ocean, south of South Africa, where temperatures were 1.5°C (2.7°F) above average or higher and record warm for this region. Additional areas with record warmth included parts of the Barents Sea, central Atlantic Ocean, and parts of western Pacific Ocean. No land or ocean areas had record cold November temperatures. Averaged as a whole, the November 2018 global land and ocean average surface temperature tied with 2004 and 2016 as the fifth highest November temperature since global records began in 1880 at 0.75°C (1.35°F) above the 20th century average. November 2015 is the warmest November with a global land and ocean temperature at 0.96°C (1.73°F) above the 20th century average. November 2018 also marks 42nd consecutive November and the 407th consecutive month with temperatures, at least nominally, above the 20th century average.
The global land-only temperature was 0.83°C (1.49°F) above the 20th century average and was the 16th highest November land temperature in the 139-year record. However, this was the smallest (least warm) November land-only temperature since 2014. Meanwhile, the global ocean-only temperature was the second highest on record, trailing behind 2015 (+0.85°C / +1.53°F), at 0.72°C (1.30°F) above the 20th century average.
According to NCEI's Regional Analysis, South America and Africa had a temperature that ranked among the eight warmest Novembers since continental records began in 1910. North America was the only continent that had an average temperature that was below average, tying with 1971 as the 37th coldest November on record.
The Atlantic Main Development Region (MDR) and the Caribbean Islands had their coolest November temperatures since 2000 and 2012, respectively. Meanwhile, the Hawaiian Region had its third highest November temperature at 0.88°C (1.58°F) on record, behind 1968 (+1.24°C / +2.23°F) and 2015 (+1.01°C / +1.82).
Select national information is highlighted below. Please note that different countries report anomalies with respect to different base periods. The information provided here is based directly upon these data:
- Warmer-than-average conditions were present across much of Australia during November 2018. Australia's nationally-averaged temperature for the month was 0.73°C (1.31°F) above the 1961–1990 average and was the 18th warmest November in the nation's 109-year record. All regions, with the exception of South Australia, had above average temperatures. The most notable warm temperature departure from average occurred in Queensland at +1.42°C (+2.56°F)—the fourth highest November temperature on record. The nation's maximum and minimum temperatures were also warmer than average at +0.53°C (+0.95°F) and +0.93°C (+1.67°F), respectively. Regionally, Queensland, Tasmania, and Northern Territory had a minimum temperature that ranked among the 10 warmest Novembers on record.
- An intense heatwave affected northern Queensland during the last week of November. Several locations set new November temperature records. Of note, maximum temperatures soared to 43.6°C (110.5°F) at Cairns on November 27, which is 6.6°C (11.9°F) higher than the previous record of 37.0°C (98.6°F). According to Australia's Bureau of Meteorology, the death of 4,000 spectacled flying foxes and wild fire activity was associated with the extreme heat.
ENSO-neutral conditions persisted across the tropical Pacific Ocean during November 2018. However, according to NOAA's Climate Prediction Center, El Niño is expected to form and continue through the Northern Hemisphere winter (Southern Hemisphere summer) 2018–19 with ~90% chance. This forecast focuses on the ocean surface temperatures between 5°N and 5°S latitude and 170°W to 120°W longitude, called the Niño 3.4 region.
| November | Anomaly | Rank (out of 139 years) | Records | ||||
|---|---|---|---|---|---|---|---|
| °C | °F | Year(s) | °C | °F | |||
| Global | |||||||
| Land | +0.83 ± 0.25 | +1.49 ± 0.45 | Warmest | 16th | 2010 | +1.60 | +2.88 |
| Coolest | 124th | 1892 | -1.03 | -1.85 | |||
| Ocean | +0.72 ± 0.15 | +1.30 ± 0.27 | Warmest | 2nd | 2015 | +0.85 | +1.53 |
| Coolest | 138th | 1909 | -0.47 | -0.85 | |||
| Land and Ocean | +0.75 ± 0.15 | +1.35 ± 0.27 | Warmest | 5th | 2015 | +0.96 | +1.73 |
| Coolest | 135th | 1907 | -0.51 | -0.92 | |||
| Ties: 2004, 2016 | |||||||
| Northern Hemisphere | |||||||
| Land | +0.80 ± 0.25 | +1.44 ± 0.45 | Warmest | 16th | 2010 | +2.01 | +3.62 |
| Coolest | 124th | 1892 | -1.28 | -2.30 | |||
| Ties: 1999, 2006 | |||||||
| Ocean | +0.83 ± 0.14 | +1.49 ± 0.25 | Warmest | 2nd | 2015 | +1.05 | +1.89 |
| Coolest | 138th | 1909 | -0.51 | -0.92 | |||
| Land and Ocean | +0.82 ± 0.17 | +1.48 ± 0.31 | Warmest | 10th | 2015 | +1.15 | +2.07 |
| Coolest | 130th | 1892 | -0.81 | -1.46 | |||
| Southern Hemisphere | |||||||
| Land | +0.90 ± 0.16 | +1.62 ± 0.29 | Warmest | 9th | 2009 | +1.22 | +2.20 |
| Coolest | 131st | 1917 | -0.78 | -1.40 | |||
| Ties: 2017 | |||||||
| Ocean | +0.64 ± 0.15 | +1.15 ± 0.27 | Warmest | 2nd | 2015 | +0.70 | +1.26 |
| Coolest | 138th | 1924 | -0.50 | -0.90 | |||
| Land and Ocean | +0.69 ± 0.15 | +1.24 ± 0.27 | Warmest | 3rd | 2015 | +0.77 | +1.39 |
| Coolest | 137th | 1924 | -0.51 | -0.92 | |||
| Arctic | |||||||
| Land and Ocean | +1.41 ± 0.82 | +2.54 ± 1.48 | Warmest | 18th | 2010 | +2.45 | +4.41 |
| Coolest | 122nd | 1890 | -2.63 | -4.73 | |||
| Ties: 1996 | |||||||


Seasonal (September–November)
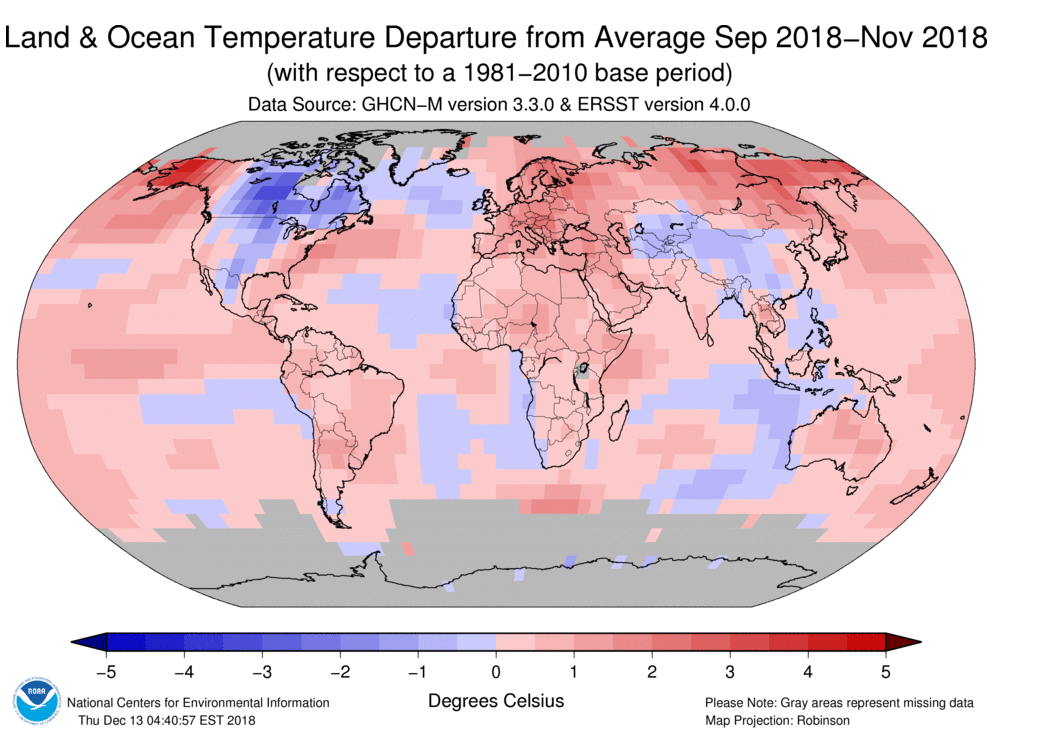
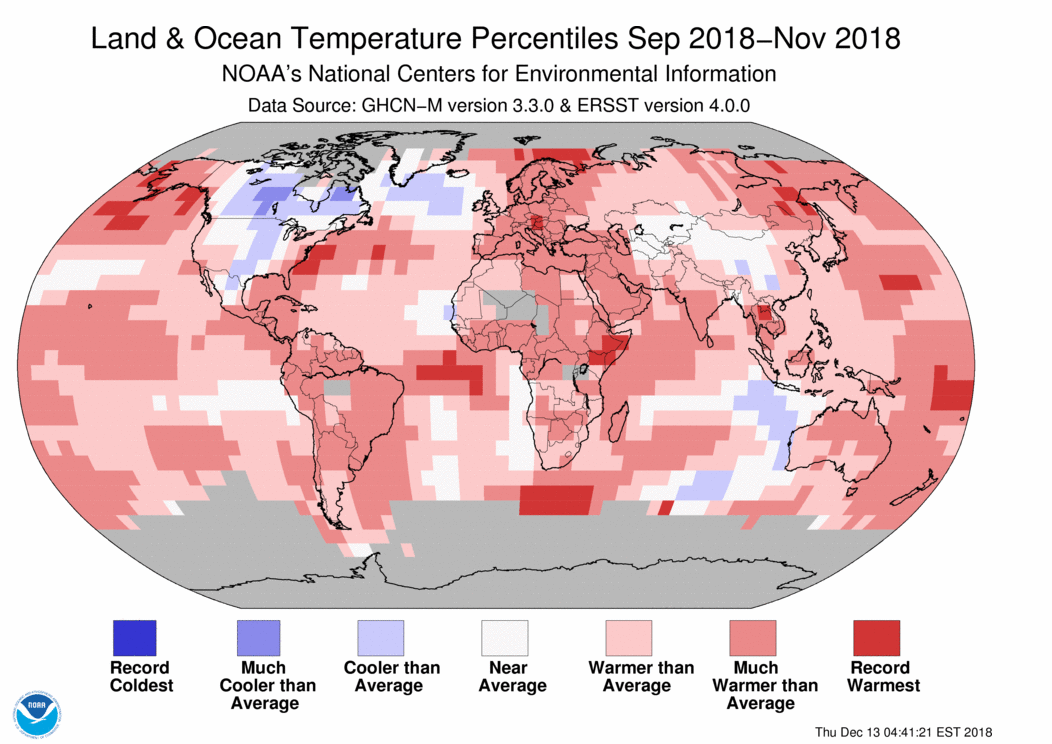
The period of September–November is defined as the Northern Hemisphere's autumn and the Southern Hemisphere's spring.
During September–November 2018, warmer- to much-warmer-than-average conditions were present across much of the world's land and ocean surface, with cooler-than-average conditions limited to Canada, northern Mexico, and most of the contiguous U.S., southern parts of Asia, and parts of the Atlantic Ocean, specifically off the southern coast of Greenland, and eastern Indian Ocean. Record warm temperatures during the three-month period were present across parts of western Alaska and surrounding ocean, the Atlantic Ocean, Barents Sea, eastern Africa, eastern Asia and western Pacific Ocean. No land or ocean areas had record cold temperatures during September–November 2018. Averaged as a whole, the global land and ocean surface temperature for the three month period of September–November 2018 was 0.80°C (1.44°F) above the 20th century average—the second warmest such period in the 139-year record. September–November 2015 was the warmest such period at 0.96°C (1.73°F).
The global ocean-only surface temperature was also the second highest for September–November at 0.72°C (1.30°F) above the 20th century average, trailing behind 2015 by 0.13°C (0.23°F). Meanwhile the global land-only surface temperature was 1.01°C (1.82°F) above average and tied with 2012 and 2016 as the sixth highest September–November on record.
Five of six continents had a September–November 2018 temperature that ranked among the eight warmest such period since continental records began in 1910. Of note, Europe had its second warmest September–November on record at 1.70°C (3.06°F) above average, behind 2006 (+1.75°C / +3.15°F). Meanwhile, North America had its coolest such period since 1996.
The Atlantic MDR and the Caribbean Islands had their coolest September–November since 2002 and 2008, respectively. Meanwhile the Gulf of Mexico's September–November 2018 temperature departure from average of +0.82°C (+1.48°F) tied with 1941 as the second highest such period on record. The Hawaiian Region had its third highest September–November since regional records began in 1910 at 0.96°C (1.73°F) above average.
Select national information is highlighted below. (Please note that different countries report anomalies with respect to different base periods. The information provided here is based directly upon these data):
- Switzerland had its third warmest autumn since national records began in 1864.
- France's September–November 2018 national temperature was 1.0°C (1.8°F) above average and the fourth highest autumn temperature on record, falling behind 2006 (+2.4°C / +4.3°F), 2014 (+2.3°C / +4.1°F), and 2011 (+1.7°C / +3.1°F).
- Australia's spring 2018 temperature was the ninth highest since national records began in 1910 at 1.07°C (1.93°F) above the 1961–1990 average. Regionally, Queensland had its third highest spring temperature on record at 1.42°C (2.56°F) above average. Queensland warmest spring took place in 2013 (+1.81°C / +3.26°F). Tasmania and the Northern Territory had a spring temperature that ranked among the eight highest on record.
| September–November | Anomaly | Rank (out of 139 years) | Records | ||||
|---|---|---|---|---|---|---|---|
| °C | °F | Year(s) | °C | °F | |||
| Global | |||||||
| Land | +1.01 ± 0.22 | +1.82 ± 0.40 | Warmest | 6th | 2015 | +1.26 | +2.27 |
| Coolest | 134th | 1881, 1912 | -0.76 | -1.37 | |||
| Ties: 2012, 2016 | |||||||
| Ocean | +0.72 ± 0.15 | +1.30 ± 0.27 | Warmest | 2nd | 2015 | +0.85 | +1.53 |
| Coolest | 138th | 1909 | -0.46 | -0.83 | |||
| Land and Ocean | +0.80 ± 0.15 | +1.44 ± 0.27 | Warmest | 2nd | 2015 | +0.96 | +1.73 |
| Coolest | 138th | 1912 | -0.48 | -0.86 | |||
| Northern Hemisphere | |||||||
| Land | +1.00 ± 0.22 | +1.80 ± 0.40 | Warmest | 10th | 2005 | +1.32 | +2.38 |
| Coolest | 130th | 1912 | -0.94 | -1.69 | |||
| Ocean | +0.83 ± 0.15 | +1.49 ± 0.27 | Warmest | 4th | 2015 | +1.06 | +1.91 |
| Coolest | 136th | 1909 | -0.51 | -0.92 | |||
| Land and Ocean | +0.89 ± 0.17 | +1.60 ± 0.31 | Warmest | 4th | 2015 | +1.14 | +2.05 |
| Coolest | 136th | 1912 | -0.66 | -1.19 | |||
| Southern Hemisphere | |||||||
| Land | +1.04 ± 0.15 | +1.87 ± 0.27 | Warmest | 4th | 2015 | +1.25 | +2.25 |
| Coolest | 136th | 1883 | -0.59 | -1.06 | |||
| Ties: 2009 | |||||||
| Ocean | +0.63 ± 0.15 | +1.13 ± 0.27 | Warmest | 2nd | 2015 | +0.69 | +1.24 |
| Coolest | 138th | 1924 | -0.42 | -0.76 | |||
| Land and Ocean | +0.70 ± 0.15 | +1.26 ± 0.27 | Warmest | 2nd | 2015 | +0.78 | +1.40 |
| Coolest | 138th | 1908, 1924 | -0.42 | -0.76 | |||
| Arctic | |||||||
| Land and Ocean | +1.52 ± 0.31 | +2.74 ± 0.56 | Warmest | 4th | 2010 | +1.66 | +2.99 |
| Coolest | 136th | 1902 | -1.36 | -2.45 | |||


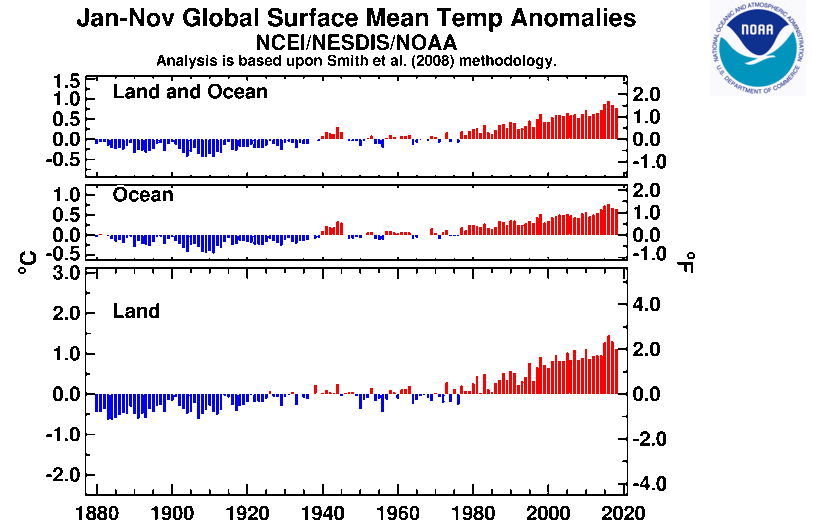
Year-to-date (January–November)


The January–November 2018 period was the fourth warmest such period in the 139-year record for the world's land and ocean surfaces, with an average temperature that was 0.77°C (1.39°F) above the 20th century average. This value was 0.19°C (0.34°F) lower than the record high set in 2016. With one month remaining, the 2018 global land and ocean temperature will very likely to end as the fourth warmest year in the 139-year record.
Most of the world's land and ocean surfaces had warmer- to much-warmer-than-average conditions during the 11-month period. Cooler-than-average conditions were limited to parts of northern Canada and the North Atlantic Ocean, off the southern coast of Greenland. Record warmth was present across parts of the Atlantic Ocean, much of central Europe and surrounding bodies of water, the Barents Sea, Asia, western Pacific Ocean, and New Zealand and its surrounding ocean. No land or ocean areas had record cold temperatures.
The year-to-date global land-only surface temperature was 1.11°C (2.00°F) above average and the fourth highest for January–November in the record. The global ocean-only surface temperature was also fourth highest on record at 0.65°C (1.17°F) above average.
According to NCEI's Regional Analysis, five of six continents had a January–November temperature that ranked among the sixth highest since continental records began in 1910. Of note, Europe had its warmest such period on record at 1.80°C (3.24°F) above average. This value surpassed the previous record set in 2014 by 0.09°C (0.16°F). The Hawaiian Region and the Gulf of Mexico had their third highest January–November temperature on record. Meanwhile, the Atlantic MDR had its coolest year-to-date period since 2001.
| January–November | Anomaly | Rank (out of 139 years) | Records | ||||
|---|---|---|---|---|---|---|---|
| °C | °F | Year(s) | °C | °F | |||
| Global | |||||||
| Land | +1.11 ± 0.15 | +2.00 ± 0.27 | Warmest | 4th | 2016 | +1.45 | +2.61 |
| Coolest | 136th | 1884 | -0.64 | -1.15 | |||
| Ocean | +0.65 ± 0.17 | +1.17 ± 0.31 | Warmest | 4th | 2016 | +0.77 | +1.39 |
| Coolest | 136th | 1911 | -0.46 | -0.83 | |||
| Land and Ocean | +0.77 ± 0.16 | +1.39 ± 0.29 | Warmest | 4th | 2016 | +0.96 | +1.73 |
| Coolest | 136th | 1908, 1911 | -0.45 | -0.81 | |||
| Northern Hemisphere | |||||||
| Land | +1.16 ± 0.18 | +2.09 ± 0.32 | Warmest | 6th | 2016 | +1.59 | +2.86 |
| Coolest | 134th | 1884 | -0.73 | -1.31 | |||
| Ocean | +0.74 ± 0.17 | +1.33 ± 0.31 | Warmest | 5th | 2016 | +0.88 | +1.58 |
| Coolest | 135th | 1908, 1909 | -0.48 | -0.86 | |||
| Land and Ocean | +0.90 ± 0.16 | +1.62 ± 0.29 | Warmest | 4th | 2016 | +1.15 | +2.07 |
| Coolest | 136th | 1908 | -0.48 | -0.86 | |||
| Southern Hemisphere | |||||||
| Land | +0.98 ± 0.12 | +1.76 ± 0.22 | Warmest | 4th | 2017 | +1.11 | +2.00 |
| Coolest | 136th | 1917 | -0.64 | -1.15 | |||
| Ocean | +0.57 ± 0.17 | +1.03 ± 0.31 | Warmest | 4th | 2016 | +0.70 | +1.26 |
| Coolest | 136th | 1911 | -0.46 | -0.83 | |||
| Land and Ocean | +0.64 ± 0.16 | +1.15 ± 0.29 | Warmest | 4th | 2016 | +0.76 | +1.37 |
| Coolest | 136th | 1911 | -0.47 | -0.85 | |||
| Arctic | |||||||
| Land and Ocean | +1.31 ± 0.13 | +2.36 ± 0.23 | Warmest | 9th | 2016 | +2.12 | +3.82 |
| Coolest | 131st | 1902 | -1.17 | -2.11 | |||

Precipitation
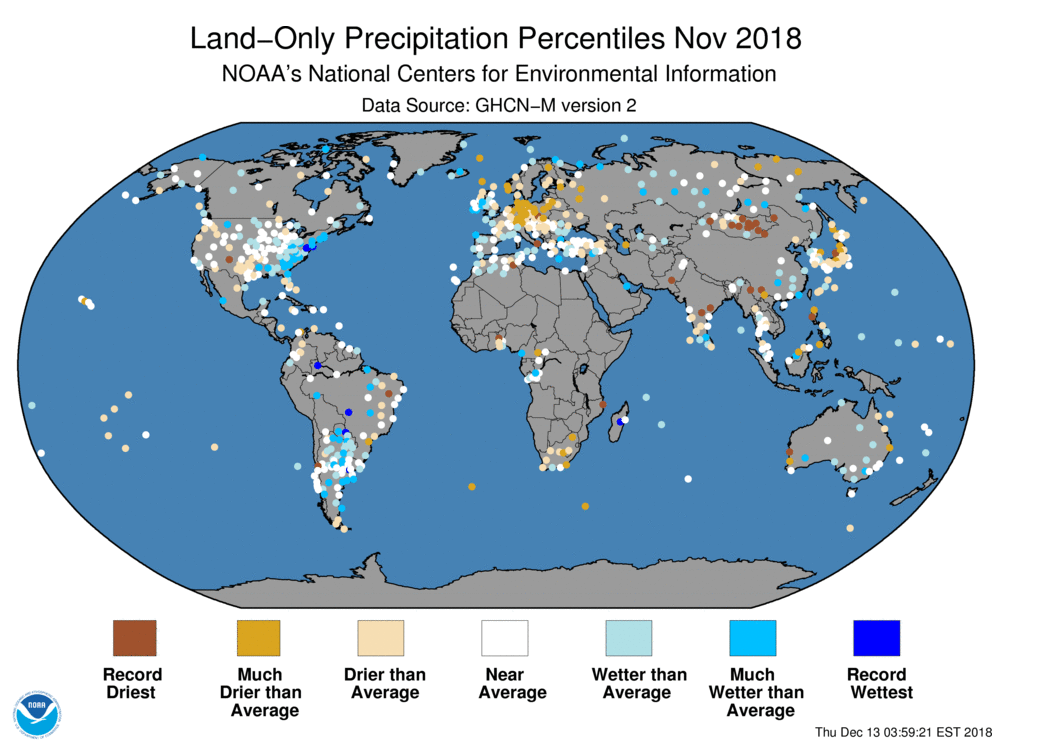
November
The maps below represent precipitation percent of normal (left, using a base period of 1961–1990) and precipitation percentiles (right, using the period of record) based on the GHCN dataset of land surface stations. As is typical, precipitation anomalies during November 2018 varied significantly around the world. November precipitation was generally drier than normal across the central and western contiguous U.S., northeastern Brazil, central Europe, Japan, and across parts of southern and eastern Asia. Wetter-than-normal conditions were notable across the north-central and eastern contiguous U.S., southern South America, western Europe, and across parts of Australia and western and central Russia.
Select national information is highlighted below. (Please note that different countries report anomalies with respect to different base periods. The information provided here is based directly upon these data):
- Drier-than-average conditions were present across much of the Island of Fiji during November 2018. According to Fiji's Meteorological Service, 20 of 25 stations had below- to well-below-average precipitation during the month, with the remaining five stations experiencing near- to above-average conditions. The Rotuma station observed a monthly total of 89.9 mm (3.5 inches) of rainfall during November 2018, which is 192.2 mm (7.6 inches) less than its November normal precipitation total of 282.1 mm (11.1 inches) and Rotuma's lowest November rainfall total on record, surpassing the previous record set in 1998.

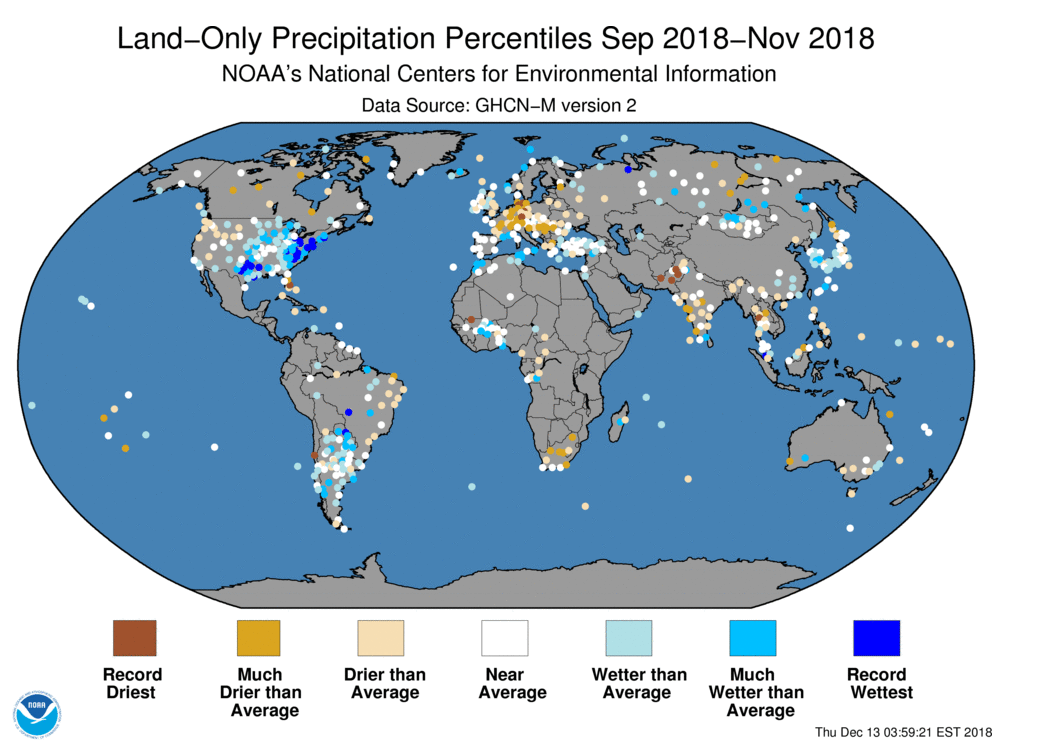
Seasonal (September–November)
Northern Hemisphere summer / Southern Hemisphere winter precipitation was generally drier than normal across Canada, the western contiguous U.S., northeastern Brazil, central Europe, India, Pakistan, central Russia, and Mongolia. Wetter-than-normal conditions were notable across the eastern half of the contiguous U.S., southern South America, western and southeastern parts of Europe, western and eastern parts of Russia, South Korea, and southern Japan.

References
- Peterson, T.C. and R.S. Vose, 1997: An Overview of the Global Historical Climatology Network Database. Bull. Amer. Meteorol. Soc., 78, 2837-2849.
- Huang, B., V.F. Banzon, E. Freeman, J. Lawrimore, W. Liu, T.C. Peterson, T.M. Smith, P.W. Thorne, S.D. Woodruff, and H-M. Zhang, 2016: Extended Reconstructed Sea Surface Temperature Version 4 (ERSST.v4). Part I: Upgrades and Intercomparisons. J. Climate, 28, 911-930.