
Introduction
Temperature anomalies and percentiles are shown on the gridded maps below. The anomaly map on the left is a product of a merged land surface temperature (Global Historical Climatology Network, GHCN) and sea surface temperature (ERSST.v4) anomaly analysis as described in Huang et al. (2016). Temperature anomalies for land and ocean are analyzed separately and then merged to form the global analysis. For more information, please visit NCEI's Global Surface Temperature Anomalies page. The percentile map on the right provides additional information by placing the temperature anomaly observed for a specific place and time period into historical perspective, showing how the most current month, season or year compares with the past.
Temperatures
In the atmosphere, 500-millibar height pressure anomalies correlate well with temperatures at the Earth's surface. The average position of the upper-level ridges of high pressure and troughs of low pressure—depicted by positive and negative 500-millibar height anomalies on the  August 2017 and
 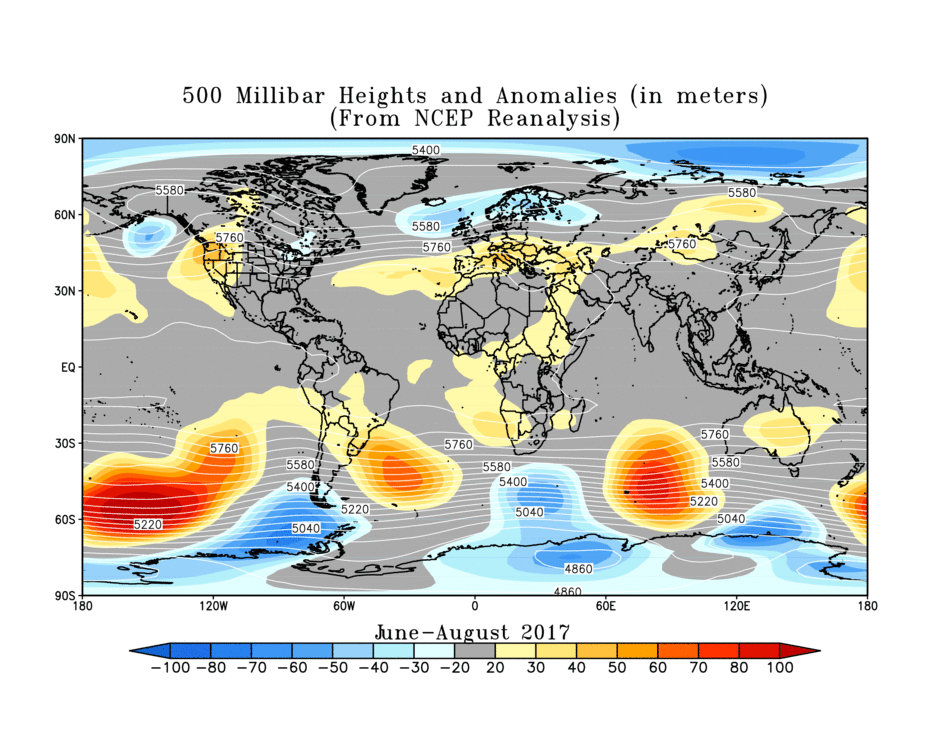 June–August 2017 maps—is generally reflected by areas of positive and negative temperature anomalies at the surface, respectively.
August

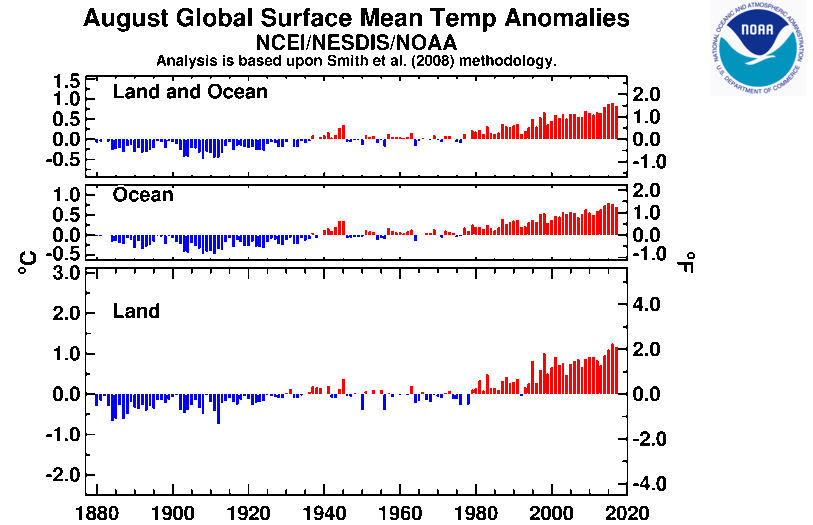
The August 2017 global land and ocean temperature was 0.83°C (1.49°F) above the 20th century average of 15.6°C (60.1°F) and the third highest August global temperature in the 138-year record, behind 2016 (+0.90°C / +1.62°F) and 2015 (+0.88°C / +1.58°F). Nine of the ten highest August global temperature departures from average have occurred since 2005, with only one year from the 20th century (1998) among the top 10 warmest Augusts on record. August 2017 also marks the 41st consecutive August and the 392nd consecutive month with a global temperature at least nominally above the 20th century average.
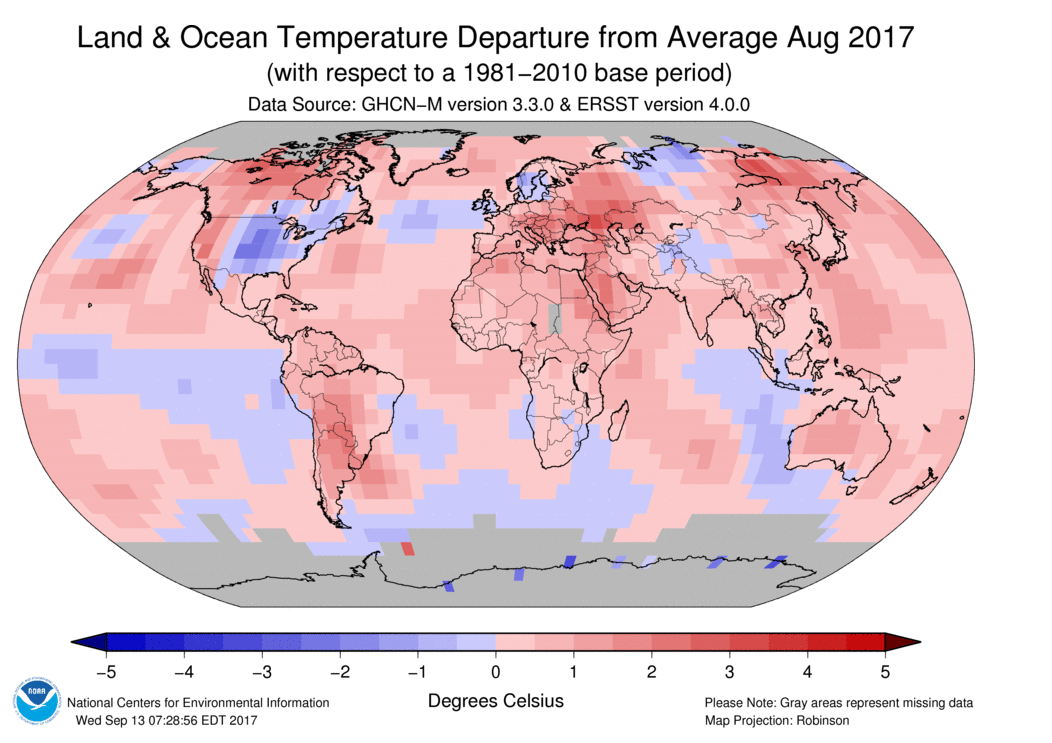
The month was characterized by warmer-than-average conditions engulfing much of the world's land and ocean surface, with the most notable warm temperature departures from average across the western contiguous U.S., central and western Canada, southeastern Europe, the Middle East, western and eastern Russia, and southern South America where temperature departures from average were +1.0°C (+1.8°F) or greater. Several locations, such as northern South America, the Middle East, and southern and southeastern Asia had record warm August temperatures. Meanwhile, very limited land surface areas had near to much-cooler-than-average temperatures during August 2017, and these areas include the central and eastern half of the contiguous U.S., northwestern Alaska, parts of Scandinavia and northern and central Asia. No land areas had record cold August temperatures. Averaged as a whole, the global land surface temperature for August 2017 was 1.17°C (2.11°F) above the 20th century average of 13.8°C (56.9°F)—the second highest August global land surface temperature since records began in 1880, behind 2016 by 0.08°C (0.14°F). Regionally, five of six continents had a top five warm August temperature, with Africa having its second warmest August temperature since continental records began in 1910. Meanwhile, North America had its smallest temperature departure from average since 2009 and the 22nd highest August temperature in the 108-year continental record.
Select national information is highlighted below. Please note that different countries report anomalies with respect to different base periods. The information provided here is based directly upon these data:
- The national average temperature for Portugal for August 2017 was the ninth highest August temperature since 2000 at 23.03°C (73.45°F) or 0.88°C (1.58°F) above average. Portugal's daytime (maximum) temperature was also warmer than average at 2.06°C (3.71°F) above average and the seventh highest August maximum temperature since 2000. Meanwhile, nighttime (minimum) temperatures were below average at -0.31°C (-0.56°F). During August 11–26, there were several days with maximum temperatures above 30°C (86°F). Of note, on August 20th 90% of the meteorological stations had a maximum temperature exceeding 30°C (86°F), with 27% of those observing maximum temperatures above 40°C (104°F). Meanwhile, 25% of stations across the nation recorded minimum temperatures equal to or greater than 20°C (68°F) during August 20–21.
- Above to much-above-average temperatures were present across much of Spain during August 2017. The national temperature of 24.9°C (76.8°F) for August 2017 was 1.0°C (1.8°F) above the 1981–2010 average and the eighth highest August temperature since 1965.
- Parts of the British Isles and Scandinavia had near to below-average temperatures during August 2017. The United Kingdom had an average temperature of 14.5°C (58.1°F), which is 0.4°C (0.7°F) below the 1981–2010 average.
- Warmer-than-average conditions also affected Austria during August 2017. The national temperature for Austria during August 2017 was 1.9°C (3.4°F) above average—the fifth highest August temperature in the 251-year record.
- The Kingdom of Bahrain's August 2017 mean temperature was the highest August mean temperature since national mean temperature records began in 1902 at 36.6°C (97.9°F) or 2.6°C (4.7°F) above average. This value is only 0.01°C (0.02°F) higher than the previous record set in 1998. The nation's maximum and minimum temperatures for the month were also the highest since 1946 at 3.4°C (6.1°F) and 2.7°C (4.9°F) above average, respectively. The nation also set a new record for the number of days with maximum temperatures above 40.0°C (104.0°F), with a total of 24 during August 2017. The previous records set in 2015 and again in 2016 had a total of 23 days.
- Australia as a whole had a national mean temperature that was 1.04°C (1.87°F) above the 1961–1990 average and the ninth highest August temperature in the 108-year record. Regionally, Queensland and Western Australia had a top 10 warm August. Tasmania and Victoria were the only regions that experienced cooler-than-average temperatures during the month. Australia's maximum (daytime) temperature was also warmer-than-average, ending up as the eighth highest on record at 1.75°C (3.15°F) above average. Queensland, Western Australia, and the Northern Territory had a top eight warm August maximum temperature on record. Regionally, minimum (nighttime) temperatures varied throughout the nation, with New South Wales, Victoria, Tasmania, and the Northern Territory experiencing cooler-than-average conditions, while Queensland, South Australia, and Western Australia had above-average August minimum temperatures. Of note, the minimum temperature of -10.4°C (13.3°F) recorded at Mount Hotham, Victoria on August 28 was the lowest August temperature at any Victoria site since 1974.
- August 2017 temperatures were warmer-than-average in New Zealand. Temperatures across the nation ranged between 0.51°C (0.92°F) to 1.20°C (2.16°F) above the 1981–2010 average, with several locations observing record or near-record temperatures for the month. The national averaged August 2017 temperature was 10.1°C (50.2°F), which is 1.3°C (2.3°F) above average and the third highest August temperature since national records began in 1909, behind 2013 (highest) and 2009 (second highest).
Warmer- to much-warmer-than-average conditions were present across much of the world's ocean surface during August 2017, with several areas scattered across all major oceans experiencing record warmth. Near- to cooler-than-average conditions were limited to the eastern and central tropical Pacific Ocean, the northern Pacific Ocean, the northern Atlantic Ocean, southeastern Pacific Ocean, and across the southern Atlantic Ocean, as well as parts of the eastern Indian Ocean. No ocean areas had record cold August temperatures. Overall, the global sea surface temperature for August 2017 was 0.71°C (1.28°F) above average and the fourth highest August temperature since 1880. The last five years (2013–2017) are among the top five years with the highest global ocean temperatures on record.
ENSO-neutral conditions continued to be present across the tropical Pacific Ocean during August 2017, with near- to below-average conditions throughout the central and eastern tropical Pacific Ocean. According to NOAA's Climate Prediction Center, there is an increasing chance (~55–60%) of La Niña during the Northern Hemisphere fall and winter (Southern Hemisphere spring and summer) 2017–18. This forecast focuses on the ocean surface temperatures between 5°N and 5°S latitude and 170°W to 120°W longitude, called the Niño 3.4 region.
| August | Anomaly | Rank (out of 138 years) | Records | ||||
|---|---|---|---|---|---|---|---|
| °C | °F | Year(s) | °C | °F | |||
| Global | |||||||
| Land | +1.17 ± 0.23 | +2.11 ± 0.41 | Warmest | 2nd | 2016 | +1.25 | +2.25 |
| Coolest | 137th | 1912 | -0.74 | -1.33 | |||
| Ocean | +0.71 ± 0.14 | +1.28 ± 0.25 | Warmest | 4th | 2015 | +0.79 | +1.42 |
| Coolest | 135th | 1908 | -0.48 | -0.86 | |||
| Land and Ocean | +0.83 ± 0.16 | +1.49 ± 0.29 | Warmest | 3rd | 2016 | +0.90 | +1.62 |
| Coolest | 136th | 1908 | -0.48 | -0.86 | |||
| Northern Hemisphere | |||||||
| Land | +1.17 ± 0.21 | +2.11 ± 0.38 | Warmest | 2nd | 2016 | +1.27 | +2.29 |
| Coolest | 137th | 1912 | -0.95 | -1.71 | |||
| Ocean | +0.92 ± 0.13 | +1.66 ± 0.23 | Warmest | 4th | 2015 | +1.03 | +1.85 |
| Coolest | 135th | 1908 | -0.60 | -1.08 | |||
| Land and Ocean | +1.01 ± 0.17 | +1.82 ± 0.31 | Warmest | 3rd | 2016 | +1.06 | +1.91 |
| Coolest | 136th | 1912 | -0.64 | -1.15 | |||
| Southern Hemisphere | |||||||
| Land | +1.19 ± 0.15 | +2.14 ± 0.27 | Warmest | 3rd | 2009 | +1.39 | +2.50 |
| Coolest | 136th | 1902 | -0.79 | -1.42 | |||
| Ocean | +0.54 ± 0.15 | +0.97 ± 0.27 | Warmest | 6th | 2016 | +0.63 | +1.13 |
| Coolest | 133rd | 1911 | -0.42 | -0.76 | |||
| Ties: 2013 | |||||||
| Land and Ocean | +0.64 ± 0.14 | +1.15 ± 0.25 | Warmest | 4th | 2016 | +0.73 | +1.31 |
| Coolest | 135th | 1911 | -0.45 | -0.81 | |||
| Arctic | |||||||
| Land and Ocean | +1.22 ± 0.26 | +2.20 ± 0.47 | Warmest | 2nd | 2014 | +1.24 | +2.23 |
| Coolest | 137th | 1885 | -1.07 | -1.93 | |||

The most current data can be accessed via the Global Surface Temperature Anomalies page.
Seasonal (June–August)


The period of June–August is defined as the Northern Hemisphere's summer and the Southern Hemisphere's winter.
The seasonal global land and ocean temperature for June–August 2017 was third highest such period since global records began in 1880 at 0.81°C (1.46°F) above the 20th century average of 15.6°C (60.1°F). This value falls behind the record year 2016 by 0.08°C (0.14°F) and 2015 by 0.05°C (0.09°F). Warmer- to much-warmer-than-average conditions were present across much of the land and ocean surfaces during the season, with record warmth across the Middle East, western tropical Pacific Ocean, Madagascar, and western and central Indian Ocean, and scattered across parts of the contiguous U.S., South America, Africa, Asia, central Pacific Ocean, and the Atlantic Ocean. Near- to cooler-than-average conditions were limited to the eastern parts of North America, parts of Eurasia, central tropical and northern Pacific Ocean, the North Atlantic Ocean (south of Greenland), eastern Indian Ocean, and the southern oceans. No land or ocean areas had record cold June–August temperatures.
The average temperature across the land surfaces was 1.15°C (2.07°F) above the 20th century average of 13.8°C (56.9°F) and the second highest June–August period in the 138-year record, behind the record year 2016 by 0.04°C (0.07°F). Regionally, all six continents had a top seven warm June–August, with Africa having its highest June–August period since continental records began in 1910. Across the oceans, the seasonal average of 0.69°C (1.24°F) above the 20th century average of 16.4°C (61.5°F) was the fourth highest for such period on record.
Select national information is highlighted below. (Please note that different countries report anomalies with respect to different base periods. The information provided here is based directly upon these data):
- Above-average temperatures affected Portugal during June–August 2017 period, resulting in the ninth highest summer temperature (22.70°C / 72.86°F) since 1931 with a temperature departure from average of 1.43°C (2.57°F). According to the Portuguese Institute for Sea and Atmosphere, six of the ten highest summer average temperature records have occurred since 2000. Portugal's national average maximum temperature was 30.22°C (86.40°F) or 2.59°C (4.66°F) above average and the third highest summer maximum temperature since 1931. Minimum temperatures were also above average at 15.18°C (59.32°F) or 0.31°C (0.56°F).
- Summer 2017 was 1.5°C (2.7°F) above average for France, tying with 2015 as the second highest summer since national records began in 1900, behind the record set in 2003 (+3.2°C / 5.8°F).
- Austria had its third warmest June–August period since national records began in 1767, with a temperature departure from average of 2.0°C (3.6°F) above average. This value is behind 2003 by 0.9°C (1.6°F) and 2015 by 0.4°C (0.7°F). Austria's eleven warmest summers have occurred since 2000.
- Australia had its fifth highest winter temperature at 1.11°C (2.0°F) above the 1961–2010 average. Much of the warmth felt across the nation during the three-month period was mainly driven by unusually warm maximum (daytime) temperatures. The nationally-averaged maximum temperature for winter 2017 was 1.90°C (3.42°F) above average and the highest winter temperature in the nation's 108-year record. This value surpassed the previous record set in 2009 by +0.30°C (+0.54°F). Regionally, Queensland and Western Australia had the second and third highest mean temperature on record, respectively, while the Northern Territory had the ninth highest mean temperature during winter 2017. In terms of Maximum temperatures, Queensland, Western Australia, and Northern Territory had their highest maximum temperature for the season, with New South Wales and South Australia having a top three warm winter on record.
- New Zealand's national winter 2017 temperature was 8.9°C (48.0°F) or 0.5°C (0.9°F) above the 1981–2010 average. This was the 11th highest winter temperature in the nation's 109-year record. Several locations across Central Otago had a mean temperature greater than 1.20°C (2.16°F) above average. Of note, Lauder had its highest winter temperature record since records began in 1924 at 1.8°C (3.2°F) above average. Also, Lauder's average minimum temperature for the three-month season was 0.0°C (32°F)—marking the first time this location did not have an average minimum temperature below freezing.
| June–August | Anomaly | Rank (out of 138 years) | Records | ||||
|---|---|---|---|---|---|---|---|
| °C | °F | Year(s) | °C | °F | |||
| Global | |||||||
| Land | +1.15 ± 0.20 | +2.07 ± 0.36 | Warmest | 2nd | 2016 | +1.19 | +2.14 |
| Coolest | 137th | 1884 | -0.60 | -1.08 | |||
| Ocean | +0.69 ± 0.15 | +1.24 ± 0.27 | Warmest | 4th | 2016 | +0.77 | +1.39 |
| Coolest | 135th | 1911 | -0.48 | -0.86 | |||
| Land and Ocean | +0.81 ± 0.17 | +1.46 ± 0.31 | Warmest | 3rd | 2016 | +0.89 | +1.60 |
| Coolest | 136th | 1911 | -0.45 | -0.81 | |||
| Northern Hemisphere | |||||||
| Land | +1.15 ± 0.19 | +2.07 ± 0.34 | Warmest | 4th | 2016 | +1.27 | +2.29 |
| Coolest | 135th | 1884 | -0.72 | -1.30 | |||
| Ocean | +0.87 ± 0.14 | +1.57 ± 0.25 | Warmest | 4th | 2015 | +0.94 | +1.69 |
| Coolest | 135th | 1908 | -0.54 | -0.97 | |||
| Land and Ocean | +0.98 ± 0.18 | +1.76 ± 0.32 | Warmest | 3rd | 2016 | +1.06 | +1.91 |
| Coolest | 136th | 1904 | -0.51 | -0.92 | |||
| Southern Hemisphere | |||||||
| Land | +1.16 ± 0.14 | +2.09 ± 0.25 | Warmest | 1st | 2017 | +1.16 | +2.09 |
| Coolest | 138th | 1894 | -0.73 | -1.31 | |||
| Ocean | +0.55 ± 0.16 | +0.99 ± 0.29 | Warmest | 5th | 2016 | +0.66 | +1.19 |
| Coolest | 134th | 1911 | -0.47 | -0.85 | |||
| Ties: 2014 | |||||||
| Land and Ocean | +0.65 ± 0.15 | +1.17 ± 0.27 | Warmest | 3rd | 2015, 2016 | +0.71 | +1.28 |
| Coolest | 136th | 1911 | -0.50 | -0.90 | |||
| Ties: 2009 | |||||||
| Arctic | |||||||
| Land and Ocean | +1.07 ± 0.15 | +1.93 ± 0.27 | Warmest | 6th | 2016 | +1.49 | +2.68 |
| Coolest | 133rd | 1885 | -0.95 | -1.71 | |||
| Ties: 2013 | |||||||


The most current data can be accessed via the Global Surface Temperature Anomalies page.
Year-to-date (January–August)


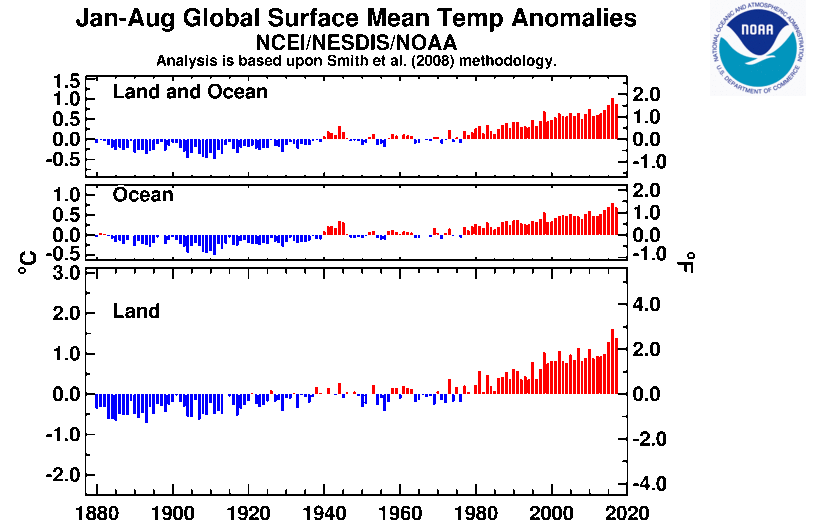
The global land and ocean surface temperature for the first eight months of the year ranked as the second highest in the 138-year record at 0.88°C (1.58°F) above the 20th century average of 14.0°C (57.3°F)—falling behind 2016 by 0.13°C (0.23°F), but ahead of 2015 by 0.03°C (0.05°F). Based on three simple scenarios, 2017 will likely end up as the third warmest year on record.
The first eight months of the year were characterized by warmer- to much-warmer-than-average conditions engulfing much of the land and ocean surfaces, with very limited areas experiencing near to cooler than average conditions. Record warmth was spread across western Europe and surrounding oceans, eastern Africa, Madagascar, western Indian Ocean, across parts of eastern Asia, western and central tropical Pacific Ocean, as well as parts of the Barents Sea and the Gulf of Mexico. No areas had record cold January–August 2017 temperatures. Regionally, all six continents had a top eight warm year-to-date, with South America having its second highest January–August period on record, behind 2015. The global land surface temperature for the year-to-date was 1.39°C (2.50°F) above the 20th century average of 9.0°C (48.1°F)— the second highest such period on record behind 2016 by 0.22°C (0.40°F). The ocean surface temperature tied with 2015 as the second highest on record at 0.69°C (1.24°F) above the 20th century average of 16.1°C (61.1°F), behind 2016 by 0.10°C (0.18°F).
| January–August | Anomaly | Rank (out of 138 years) | Records | ||||
|---|---|---|---|---|---|---|---|
| °C | °F | Year(s) | °C | °F | |||
| Global | |||||||
| Land | +1.39 ± 0.18 | +2.50 ± 0.32 | Warmest | 2nd | 2016 | +1.61 | +2.90 |
| Coolest | 137th | 1893 | -0.71 | -1.28 | |||
| Ocean | +0.69 ± 0.18 | +1.24 ± 0.32 | Warmest | 2nd | 2016 | +0.79 | +1.42 |
| Coolest | 137th | 1911 | -0.50 | -0.90 | |||
| Ties: 2015 | |||||||
| Land and Ocean | +0.88 ± 0.18 | +1.58 ± 0.32 | Warmest | 2nd | 2016 | +1.01 | +1.82 |
| Coolest | 137th | 1911 | -0.50 | -0.90 | |||
| Northern Hemisphere | |||||||
| Land | +1.52 ± 0.21 | +2.74 ± 0.38 | Warmest | 2nd | 2016 | +1.79 | +3.22 |
| Coolest | 137th | 1893 | -0.81 | -1.46 | |||
| Ocean | +0.79 ± 0.17 | +1.42 ± 0.31 | Warmest | 3rd | 2016 | +0.89 | +1.60 |
| Coolest | 136th | 1904, 1911 | -0.48 | -0.86 | |||
| Land and Ocean | +1.07 ± 0.18 | +1.93 ± 0.32 | Warmest | 2nd | 2016 | +1.23 | +2.21 |
| Coolest | 137th | 1893 | -0.53 | -0.95 | |||
| Southern Hemisphere | |||||||
| Land | +1.04 ± 0.14 | +1.87 ± 0.25 | Warmest | 2nd | 2016 | +1.14 | +2.05 |
| Coolest | 137th | 1917 | -0.71 | -1.28 | |||
| Ocean | +0.62 ± 0.18 | +1.12 ± 0.32 | Warmest | 2nd | 2016 | +0.73 | +1.31 |
| Coolest | 137th | 1911 | -0.50 | -0.90 | |||
| Land and Ocean | +0.69 ± 0.17 | +1.24 ± 0.31 | Warmest | 2nd | 2016 | +0.79 | +1.42 |
| Coolest | 137th | 1911 | -0.52 | -0.94 | |||
| Arctic | |||||||
| Land and Ocean | +1.78 ± 0.18 | +3.20 ± 0.32 | Warmest | 2nd | 2016 | +2.35 | +4.23 |
| Coolest | 137th | 1888 | -1.17 | -2.11 | |||

The most current data can be accessed via the Global Surface Temperature Anomalies page.
Precipitation
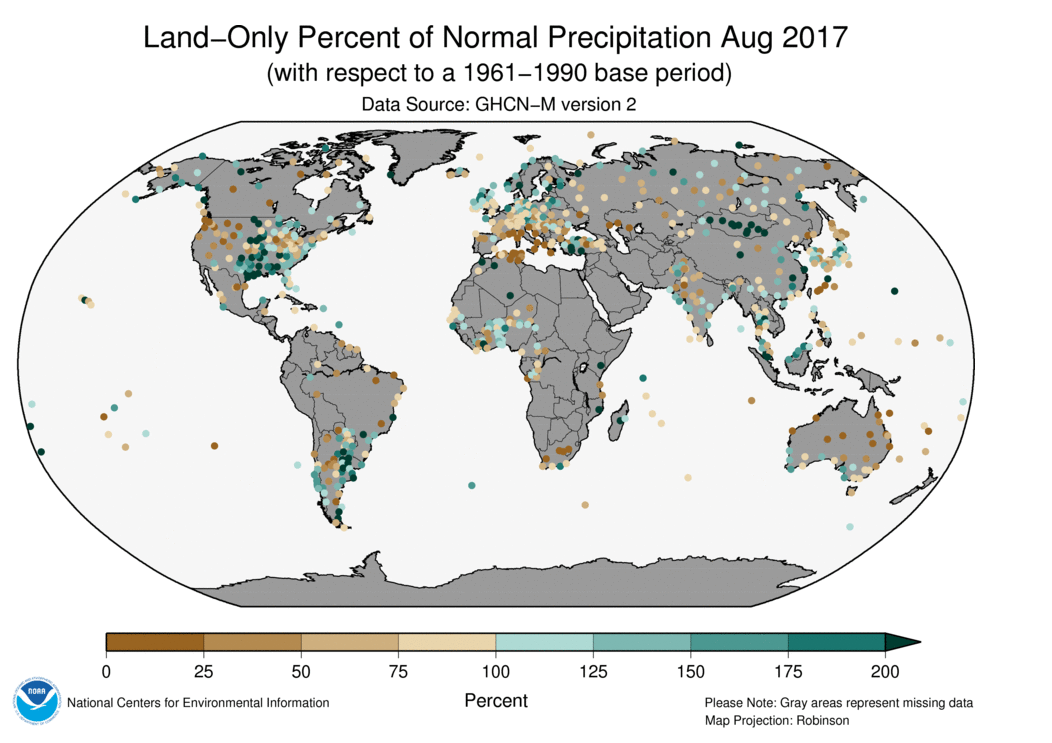
August
The maps below represent precipitation percent of normal (left, using a base period of 1961–1990) and precipitation percentiles (right, using the period of record) based on the GHCN dataset of land surface stations. As is typical, precipitation anomalies vary significantly around the world. August precipitation was generally drier than normal across the western half of the contiguous U.S., northern and northeastern South America, as well as parts of northern and central Argentina, much of Australia, central Europe, northern Japan and scattered across northern Asia and northwestern India. Wetter-than-normal conditions were notable across the central and southeastern contiguous U.S., southern South America, northern and eastern Europe, southern India, southern Japan, Mongolia, and scattered across Russia and China.
Select national information is highlighted below. (Please note that different countries report anomalies with respect to different base periods. The information provided here is based directly upon these data):
- According to the Portuguese Institute for Sea and Atmosphere, drier-than-average conditions continued to affect Portugal during August 2017, with an average precipitation total of 8.2 mm (0.32 inch) or 60% of August's normal precipitation. Overall nearly 60% of the nation was in severe drought, with 0.7% of the nation experiencing extreme drought during August 2017.
- Rainfall totals across Ireland varied greatly, ranging between 75% of average to 181% of average. Of note, the stations located at Malin Head, Co Donegal and Newport, Co Mayo had their wettest August since 1992 and 2009, respectively. On August 22, thunderstorms brought copious rainfall amounts to Malin Head, Co Donegal, which received a total of 63.0 mm (2.48 inches) of rain in a 6-hour period, which is a third of its monthly total and thus becoming the station's wettest day since 1955.
- Precipitation varied greatly across the Island of Fiji during August 2017. According to Fiji's Meteorological Service, eight of 24 stations had below-average precipitation, ten stations reported average precipitation, five had above-average rainfall, and only one recorded well-above-average conditions. Two notable rainfall events during August 14–16 and August 20–24, associated with the passage of a low pressure system, brought much needed rain to the Western Division, which experienced drought conditions since April 2017.

Seasonal (June–August)
Precipitation varies greatly around the globe. During the three month season of June–August 2017, wetter-than-average precipitation was observed across the eastern half of the contiguous U.S., Alaska, central and southern Argentina, northern Europe, India, northern Africa, Mongolia, China, and scattered across western and central Russia. Drier-than-average conditions were present across the western half of the contiguous U.S., northern Argentina, northeastern Brazil, southern Europe, Australia, and scattered across southern Japan and Russia.
- Dry conditions plagued Portugal during summer 2017, with a national precipitation total of 23 mm (0.91 inch) or 40% of the seasonal average. This was the seventh driest summer since 1931 and the third driest since 2000.
- Summer 2017 was dry across much of France, with little to no precipitation across the Mediterranean regions and Corsica. The dry conditions, combined with very warm temperatures, resulted in exceptional surface dryness across Provence, Alpes, Côte d'Azur, and Corsica.
- Near- to drier-than-average conditions plagued much of Australia during the three month period, with the nation having its lowest precipitation total since 2002 and the ninth driest winter in the nation's 11-year precipitation record at 36.7 mm (1.4 inches) or 57% of average. All regions had below-average precipitation totals during June–August 2017, with New South Wales also having its lowest precipitation total since 2002 and the tenth lowest on record.
- Denmark's June–August 2017 precipitation total of 268 mm (10.6 inches) was the highest winter precipitation since 2011 and ranked as the 11th wettest winter since national records began in 1874.
- Precipitation totals during winter 2017 varied across New Zealand, with above-average conditions across parts of the South Island, while below-average conditions were present across parts of Southland. Oamaru, South Island had its wettest winter since records began in 1941 at 285 mm (11.2 inches) or 247% of the season's normal precipitation.


References
- Peterson, T.C. and R.S. Vose, 1997: An Overview of the Global Historical Climatology Network Database. Bull. Amer. Meteorol. Soc., 78, 2837-2849.
- Huang, B., V.F. Banzon, E. Freeman, J. Lawrimore, W. Liu, T.C. Peterson, T.M. Smith, P.W. Thorne, S.D. Woodruff, and H-M. Zhang, 2016: Extended Reconstructed Sea Surface Temperature Version 4 (ERSST.v4). Part I: Upgrades and Intercomparisons. J. Climate, 28, 911-930.