Introduction
Temperature anomalies and percentiles are shown on the gridded maps below. The anomaly map on the left is a product of a merged land surface temperature (Global Historical Climatology Network, GHCN) and sea surface temperature (ERSST.v4) anomaly analysis as described in Huang et al. (2016). Temperature anomalies for land and ocean are analyzed separately and then merged to form the global analysis. For more information, please visit NCEI's Global Surface Temperature Anomalies page. The percentile map on the right provides additional information by placing the temperature anomaly observed for a specific place and time period into historical perspective, showing how the most current month, season or year compares with the past.
Temperatures
In the atmosphere, 500-millibar height pressure anomalies correlate well with temperatures at the Earth's surface. The average position of the upper-level ridges of high pressure and troughs of low pressure—depicted by positive and negative 500-millibar height anomalies on the  June 2017 map—is generally reflected by areas of positive and negative temperature anomalies at the surface, respectively.
June
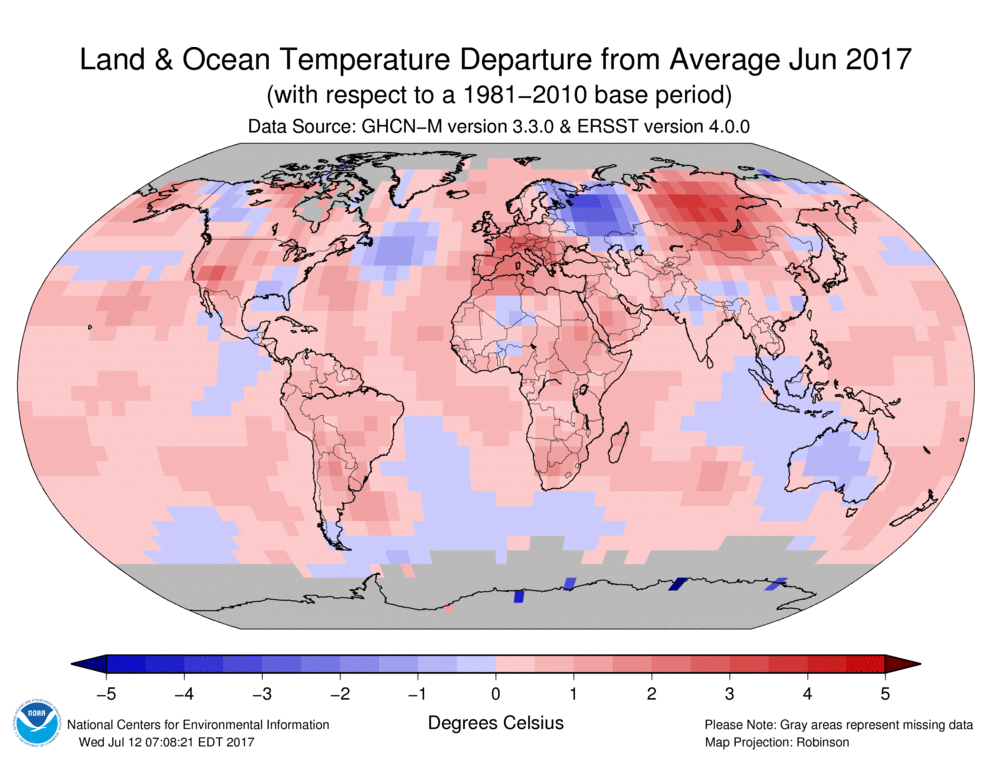
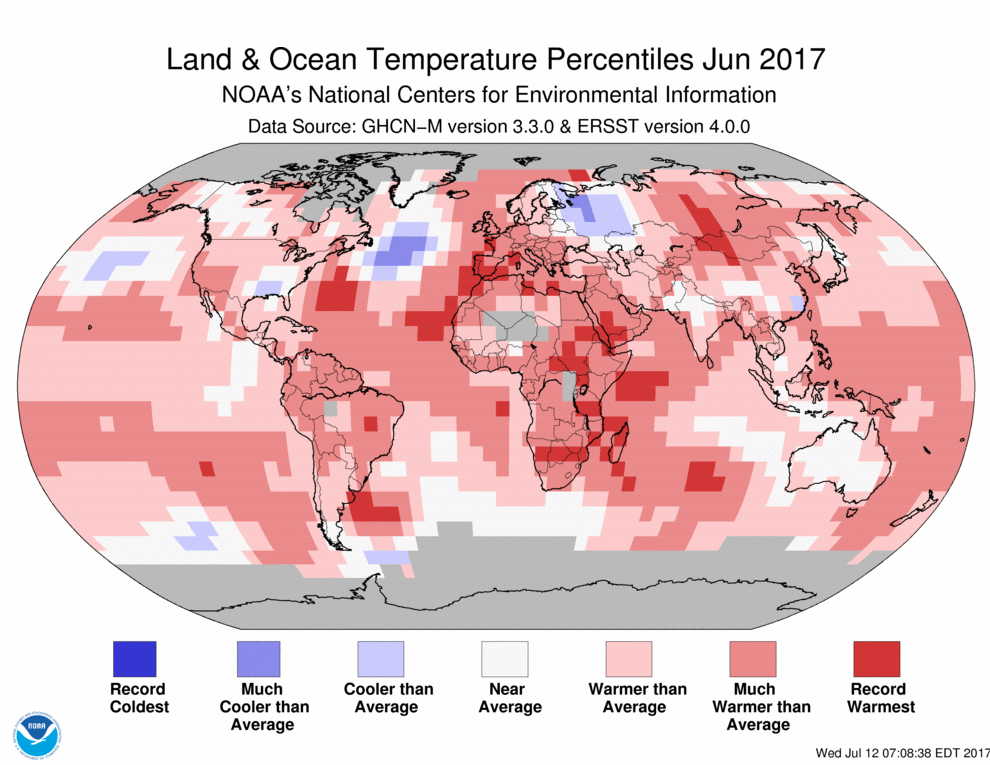
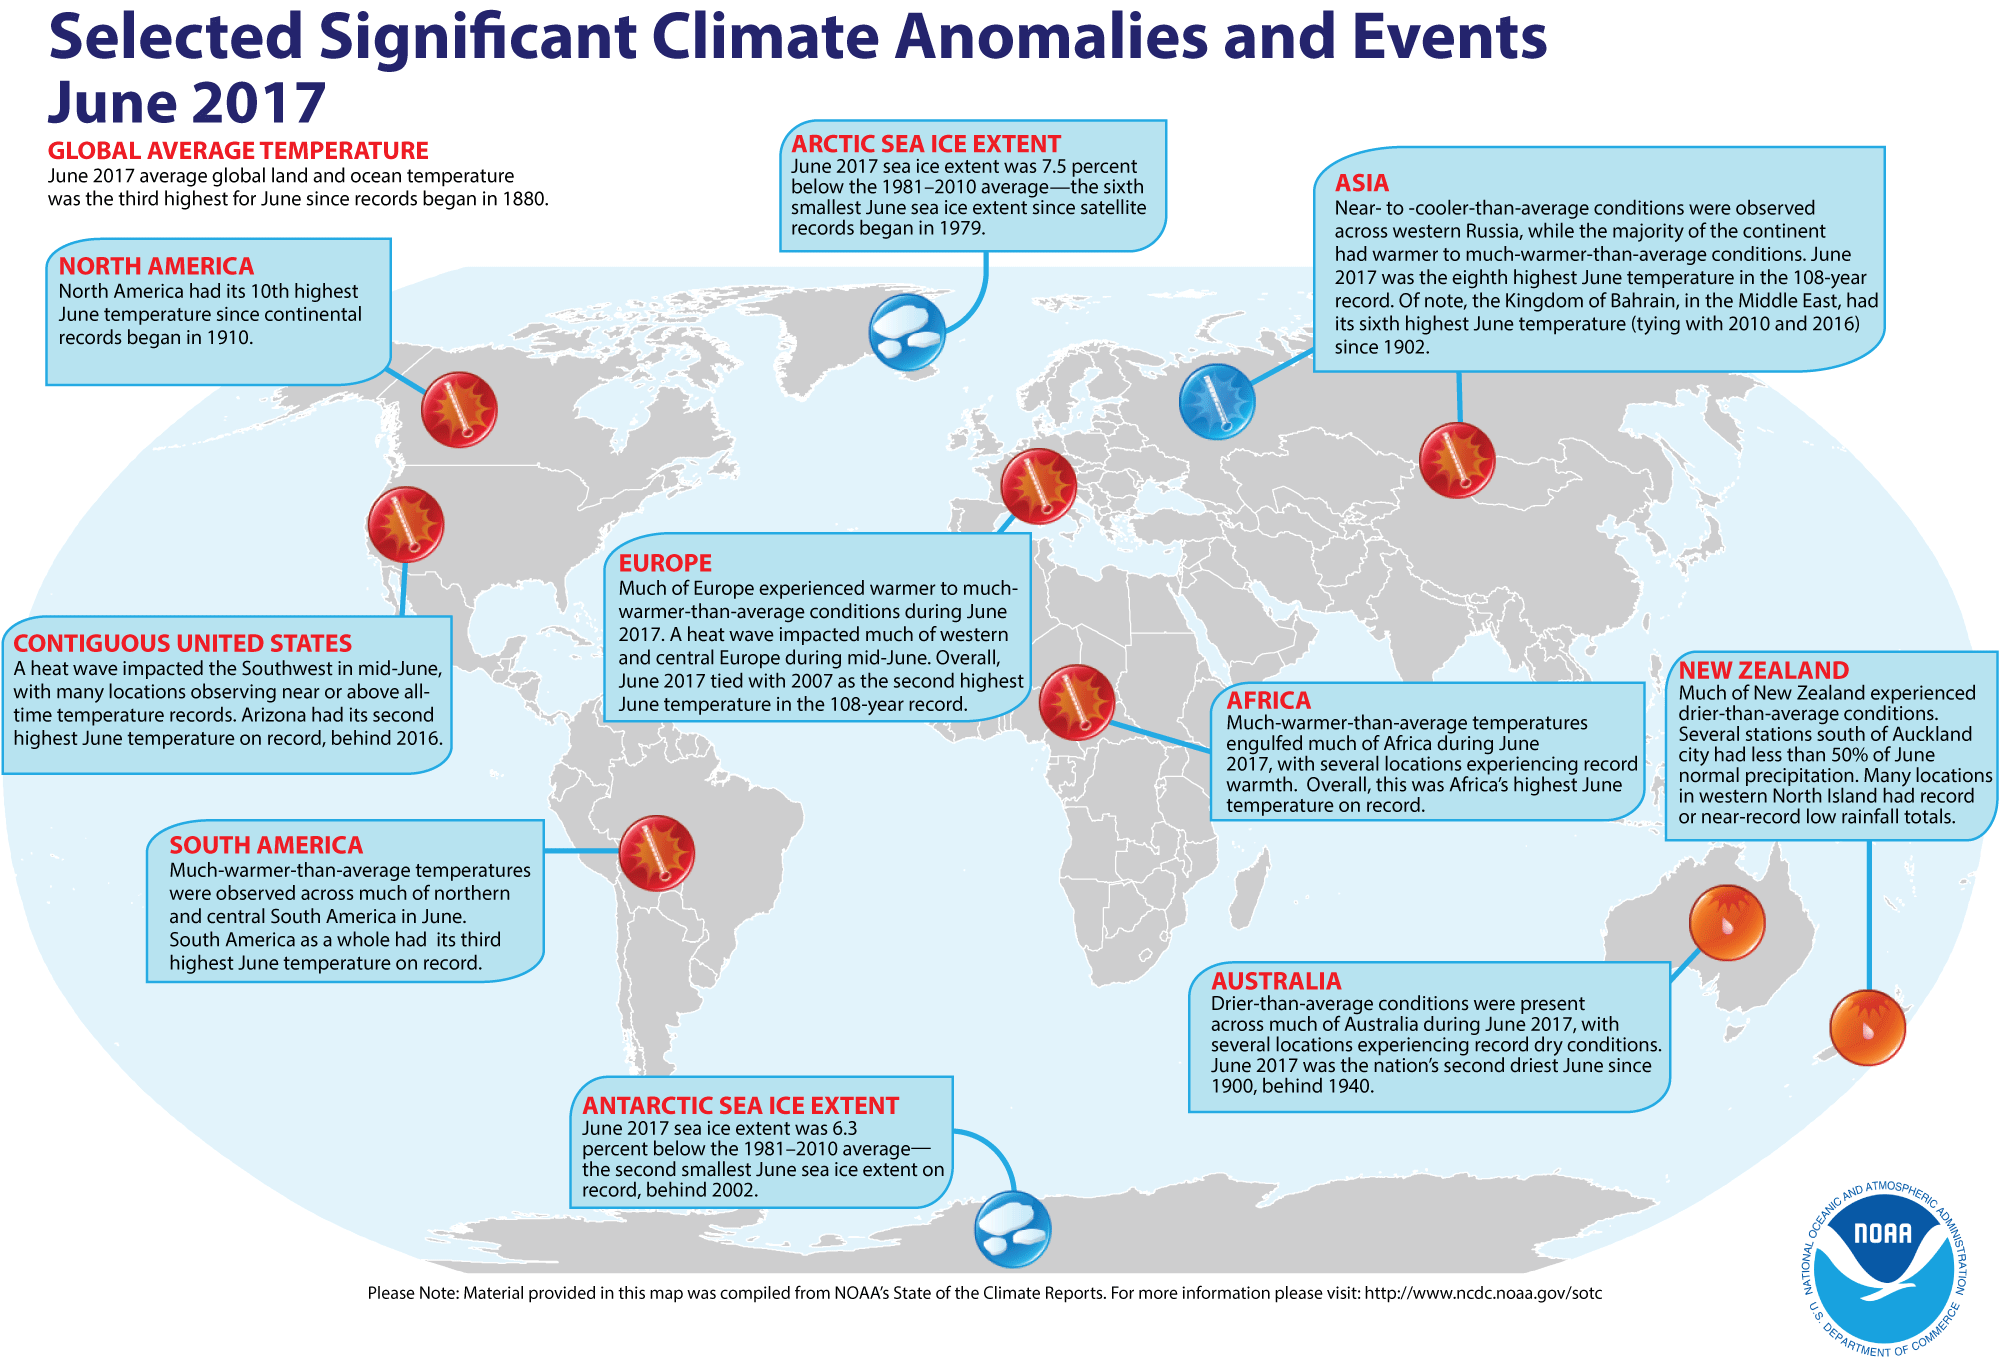
June 2017 was characterized by warmer to much-warmer-than-average conditions across much of the world's land and ocean surface. The most notable warm temperature departure from average were present across much of central Asia, western and central Europe, and the southwestern contiguous U.S. where temperature departures from average were 2.0°C (3.6°F) or greater. Record warmth was observed across parts of the northern and southern Atlantic Ocean, specifically near the U.S. eastern coast, the African west coast and the southern South America east coast, central Asia and scattered across parts of Africa, western Europe, the Middle East, Brazil, and western Indian Ocean. Meanwhile, near to cooler-than-average conditions were observed across eastern Scandinavia, western Russia and parts of Russia's Far East, western Canada, eastern Alaska, the southeastern U.S., Australia, and across parts of southern Asia and Antarctica. Across the oceans, the northern Atlantic Ocean had the most notable cool temperature departure from average, with temperatures 0.5°C to 1.0°C (0.9°F to 1.8°F) below the 1981–2010 average. No land or ocean areas had record cold June temperatures.
Overall, the combined global land and ocean surface temperature for June 2017 was 0.82°C (1.48°F) above the 20th century average of 15.5°C (59.9°F) and the third highest June temperature in the 138-year record, behind 2016 (+0.92°C / +1.66°F) and 2015 (+0.89°C / +1.60). June 2017 marks the 41st consecutive June and the 390th consecutive month with temperatures at least nominally above the 20th century average.
Similarly, the global land temperature for June 2017 was 1.15°C (2.07°F) above the 20th century average of 13.3°C (55.9°F). This was the fourth highest June global land temperature in the 138-year record, behind 2016 (+1.29°C / +2.32°F), 2015 (+1.28°C / +2.30°F), and 2012 (+1.22°C / +2.20°F). June 2017 was the 35th consecutive June with temperatures at least nominally above average. The last time global land surface temperatures were below average in June was in 1982. According to NCEI's Regional Analysis, five of six continents had a top ten warm June, with Africa experiencing its warmest June since continental records began in 1910.
Select national information is highlighted below. Please note that different countries report anomalies with respect to different base periods. The information provided here is based directly upon these data:
- Much of Europe experienced warmer to much-warmer-than-average temperatures, with several locations experiencing record warmth. A heat wave impacted much of western and central Europe during mid-June, with several locations reporting temperatures 30.0°C (86.0°F) or higher. Europe's June 2017 continental temperature was 1.77°C (3.19°F) above the 1901–2000 average and tied with 2007 as the second highest June temperature since continental records began in 1910, behind 2003 (+1.91°C / +3.44°F).
- Portugal's mean temperature for June 2017 was 22.34°C (72.21°F) or 2.92°C (5.26°F) above average and the third highest June temperature since national records began in 1931, trailing behind 2004 (23.25°C / 73.85°F) and 2005 (22.81°C / 73.06°F). The nation's maximum and minimum June 2017 temperature ranked among the third (+4.21°C / +7.58°F) and fourth (+1.61°C / +2.90°F) highest on record, respectively. During the month, Portugal experienced much-above-average daily temperatures due to a heat wave that plagued most of Europe mid-month. The highest June daily temperature for the nation was observed on June 17th when temperatures soared to 29.4°C (84.92°F), which is 10.0°C (18.0°F) above average. According to The Portuguese Institute for Sea and Atmosphere, 90% of Portugal's stations observed maximum temperatures over 30.0°C (86.0°F) during June 16–19, with 50% of stations recording maximum temperatures over 40.0°C (104.0°F) on June 17th. Meanwhile, 50% of stations had minimum temperatures equal to or higher than 20.0°C (68.0°F) during June 17–19.
- Much-above-average temperatures were observed across much of Spain during June 2017, resulting in a national average temperature 3.0°C (5.4°F) above the 1981–2010 average temperature of 21.1°C (70.0°F). This was the highest June temperature since 1965, surpassing the previous record set in 2003 by 0.10°C (0.18°F).
- June 2017 temperature for the United Kingdom was 14.5°C (58.1°F), which is 1.5°C (2.7°F) above the 1981–2010 average and tying as the fifth highest June since national records began in 1910. Regionally, June 2017 was among the top five warmest in the 108-year record for England (+1.9°C / +3.4°F; second highest behind 1976) and Wales (+1.5°C / +2.7°F; fifth highest June on record). The U.K. was also impacted by the heat wave during June 17–21, with maximum temperatures surpassing 30.0°C (86.0°F) somewhere in England and Wales. This marked the first time an event like this one happened in June since 1995. The highest maximum temperature observed during the event was 34.5°C (94.1°F) set on June 21 at the Heathrow Airport—U.K.'s highest June maximum temperature since 1976. According to the U.K.'s Met Office, the heat was blamed for the death of two teenage boys who drowned in separate reservoirs. The heat also affected train services and roads in Cambridgeshire and Norfolk were reportedly starting to melt.
- The Netherlands had above-average June temperatures, with an average national temperature of 18.0°C (64.4°F), which is 2.4°C (4.3°F) above average. The June 2017 national temperature tied with 1976 as the highest June temperature since national records began in 1901.
- In France, June 2017 was characterized by very warm temperatures across the nation, resulting in the second warmest June since national records began in 1900. The June 2017 national average temperature of 21.2°C (70.2°F) was 2.8°C (5.0°F) above the 1981–2010 average. This value trails behind the record June of 2003 by 1.3°C (2.3°F). France also experienced a heat wave during June 18–22, with June 21 marking France's hottest June day in 70 years when the national maximum temperature rose to 26.4°C (79.5°F). The previous hottest June day was 28 June 2005 (26.1°C / 79.0°F). Several locations recorded daily temperatures that were 7.0°C–15.0°C (12.6°F–27.0°F) above average and thus setting new monthly temperature records.
- The national average June 2017 temperature for Switzerland was 15.2°C (59.4°F) or 3.4°C (6.1°F) above the 1981–2010 average and the second highest June temperature since national records began in 1864. Switzerland's highest June average temperature of 17.3°C (63.1°F) was set in 2003. Switzerland was also affected by the heat wave during June 19–24, with several locations recording their warmest minimum temperatures since 1981. Twenty-one sites across the nation also recorded their warmest June day on record during June 23 or June 24.
- Austria had its second warmest June in its 251-year record with a national average temperature 3.3°C (5.9°F) above the 1981–2010 average, behind 2003 by 1.0°C (1.8°F). Several locations across Austria observed ten consecutive hot days as the heat wave affected much of western and central Europe during mid-June. Hot days are defined as days with a maximum temperature equal to or greater than 30.0°C (86.0°F). June 2012 still holds the record for the longest heat wave with 14 consecutives hot days.
- Even though the majority of Europe experienced warmer-than-average temperatures, parts of eastern Scandinavia had near to cooler-than-average conditions during June 2017. Eastern parts of Finland observed temperatures that were 1.5°C (2.9°F) to 2.5°C (4.5°F) below average.
- Australia's mean temperature for June 2017 was 0.47°C (0.85°F) above the 1961–1990 average and ranked among the top 30 warmest Junes in the nation's 108-year record. The nation's above-average mean temperature was mainly driven by the very warm maximum temperatures observed across much of the nation. The average maximum temperature for Australia was 1.33°C (°F) above average and the seventh highest June maximum temperature since records began in 1910. Regionally, Queensland had its highest June maximum temperature since 2001 and the ninth highest in the 108-year record, while Western Australia had its third highest June maximum temperature at 1.72°C (°F) above average. Meanwhile, minimum temperatures were cooler than average for the nation, with a national average of -0.40°C (°F). South Australia had its seventh lowest June minimum temperature on record at -1.77°C (°F).
- The Kingdom of Bahrain recorded a mean temperature of 34.5°C (94.1°F) for June 2017, which is 2.1°C (3.8°F) above average and tying with 2010 and 2016 as the sixth highest June temperature since national records began in 1902. Daytime (maximum) and nighttime (minimum) temperatures were also much warmer than average, with the national June 2017 mean temperature (30.5°C / 86.9°F) tying with 2016 as the sixth highest since 1946.
Across the oceans, the average global ocean surface temperature during June 2017 was 0.70°C (1.26°F) above the 20th century average of 16.4°C (61.5°F)—the third highest June temperature since global records began in 1880, behind 2016 (+0.78°C / +1.40°F) and 2015 (+0.74°C / +1.33°F). June 2017 marks the 41st consecutive June that the global sea surface temperature was nominally above the 20th century average.
ENSO-neutral conditions continued to be present across the equatorial Pacific Ocean during June 2017. According to NOAA's Climate Prediction Center, ENSO-neutral is favored during the Northern Hemisphere winter (Southern Hemisphere summer) 2017–18. This forecast focuses on the ocean surface temperatures between 5°N and 5°S latitude and 170°W to 120°W longitude, called the Niño 3.4 region.
| June | Anomaly | Rank (out of 138 years) | Records | ||||
|---|---|---|---|---|---|---|---|
| °C | °F | Year(s) | °C | °F | |||
| Global | |||||||
| Land | +1.15 ± 0.13 | +2.07 ± 0.23 | Warmest | 4th | 2016 | +1.29 | +2.32 |
| Coolest | 135th | 1907 | -0.66 | -1.19 | |||
| Ocean | +0.70 ± 0.14 | +1.26 ± 0.25 | Warmest | 3rd | 2016 | +0.78 | +1.40 |
| Coolest | 136th | 1911 | -0.48 | -0.86 | |||
| Land and Ocean | +0.82 ± 0.14 | +1.48 ± 0.25 | Warmest | 3rd | 2016 | +0.92 | +1.66 |
| Coolest | 136th | 1911 | -0.45 | -0.81 | |||
| Northern Hemisphere | |||||||
| Land | +1.19 ± 0.13 | +2.14 ± 0.23 | Warmest | 5th | 2012 | +1.42 | +2.56 |
| Coolest | 134th | 1907 | -0.70 | -1.26 | |||
| Ocean | +0.80 ± 0.14 | +1.44 ± 0.25 | Warmest | 4th | 2016 | +0.92 | +1.66 |
| Coolest | 135th | 1913 | -0.53 | -0.95 | |||
| Land and Ocean | +0.94 ± 0.15 | +1.69 ± 0.27 | Warmest | 3rd | 2016 | +1.11 | +2.00 |
| Coolest | 136th | 1913 | -0.53 | -0.95 | |||
| Southern Hemisphere | |||||||
| Land | +1.05 ± 0.16 | +1.89 ± 0.29 | Warmest | 5th | 2015 | +1.33 | +2.39 |
| Coolest | 134th | 1911 | -1.08 | -1.94 | |||
| Ocean | +0.64 ± 0.15 | +1.15 ± 0.27 | Warmest | 2nd | 2016 | +0.68 | +1.22 |
| Coolest | 137th | 1911 | -0.53 | -0.95 | |||
| Ties: 2015 | |||||||
| Land and Ocean | +0.70 ± 0.14 | +1.26 ± 0.25 | Warmest | 3rd | 2015 | +0.75 | +1.35 |
| Coolest | 136th | 1911 | -0.61 | -1.10 | |||
| Arctic | |||||||
| Land and Ocean | +1.19 ± 0.22 | +2.14 ± 0.40 | Warmest | 8th | 2016 | +1.87 | +3.37 |
| Coolest | 131st | 1885 | -1.39 | -2.50 | |||


The most current data can be accessed via the Global Surface Temperature Anomalies page.
Year-to-date (January–June)
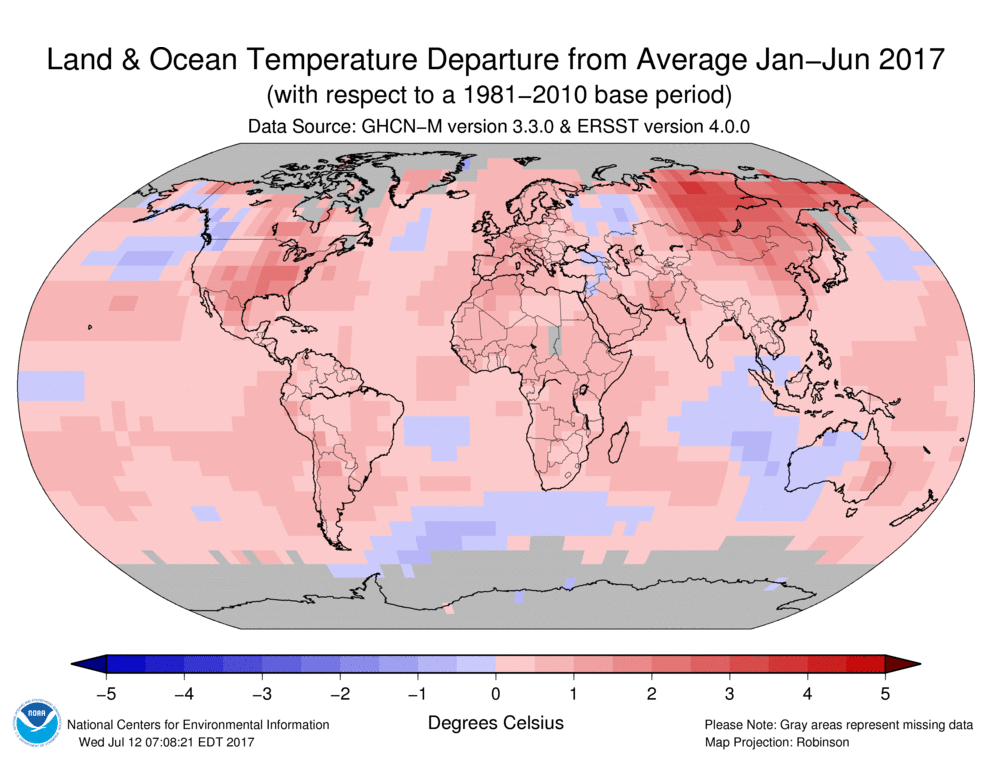
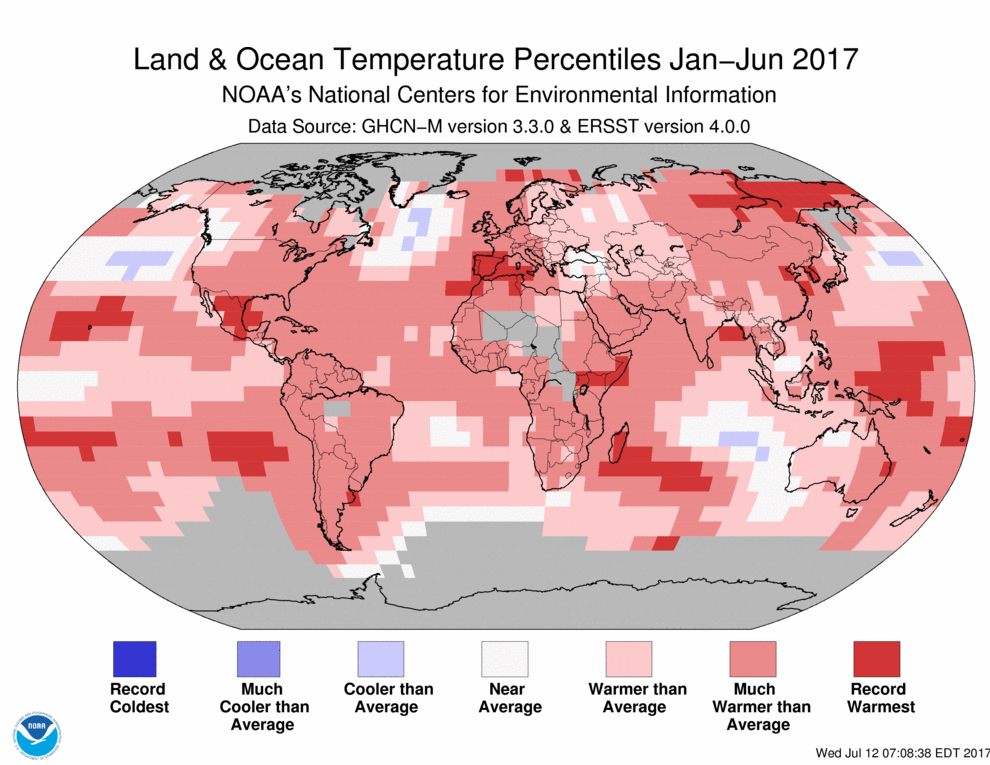
The first six months of 2017 have each ranked among the top three warmest months on record, giving way to the second highest January–June period in the 138-year record at 0.91°C (1.64°F) above the 20th century average of 13.5°C (56.3°F), behind the record year of 2016 by 0.16°C (0.29°F), but ahead of 2015 by 0.05°C (0.09°F).
Much of the world's land and ocean surfaces had warmer to much-warmer-than-average conditions during the January–June 2017 period, with limited areas experiencing near to cooler-than-average conditions. Record warmth across the land surface was observed across much of Mexico, western Europe, eastern Russia, South Korea, Madagascar, and some areas across northern and east central Africa, eastern China, and eastern Australia. Across the oceans, record warmth was present across parts of the Pacific Ocean, specifically western, central and south-eastern areas, western parts of the Gulf of Mexico, and western Indian Ocean. No land or ocean areas experienced record cold June temperatures.
According to NCEI's Regional Analysis, five of six continents had a top ten warm January–June period, with South America experiencing its second highest January–June temperature (tied with 2010), behind 2015. The global land surface temperature was 1.49°C (2.68°F) above the 20th century average of 7.3°C (45.0°F) and the second highest value for the year-to-date, behind 2016 by 0.31°C (0.56°F). The global ocean surface temperature was also the second highest such period at 0.70°C (1.26°F) above the 20th century average of 16.1°C (60.9°F).
| January–June | Anomaly | Rank (out of 138 years) | Records | ||||
|---|---|---|---|---|---|---|---|
| °C | °F | Year(s) | °C | °F | |||
| Global | |||||||
| Land | +1.49 ± 0.16 | +2.68 ± 0.29 | Warmest | 2nd | 2016 | +1.80 | +3.24 |
| Coolest | 137th | 1893 | -0.86 | -1.55 | |||
| Ocean | +0.70 ± 0.17 | +1.26 ± 0.31 | Warmest | 2nd | 2016 | +0.80 | +1.44 |
| Coolest | 137th | 1911 | -0.50 | -0.90 | |||
| Land and Ocean | +0.91 ± 0.17 | +1.64 ± 0.31 | Warmest | 2nd | 2016 | +1.07 | +1.93 |
| Coolest | 137th | 1911 | -0.52 | -0.94 | |||
| Northern Hemisphere | |||||||
| Land | +1.65 ± 0.20 | +2.97 ± 0.36 | Warmest | 2nd | 2016 | +1.99 | +3.58 |
| Coolest | 137th | 1893 | -0.97 | -1.75 | |||
| Ocean | +0.75 ± 0.16 | +1.35 ± 0.29 | Warmest | 2nd | 2016 | +0.87 | +1.57 |
| Coolest | 137th | 1904, 1911 | -0.46 | -0.83 | |||
| Land and Ocean | +1.09 ± 0.17 | +1.96 ± 0.31 | Warmest | 2nd | 2016 | +1.29 | +2.32 |
| Coolest | 137th | 1893 | -0.60 | -1.08 | |||
| Southern Hemisphere | |||||||
| Land | +1.06 ± 0.15 | +1.91 ± 0.27 | Warmest | 4th | 2016 | +1.30 | +2.34 |
| Coolest | 135th | 1917 | -0.90 | -1.62 | |||
| Ocean | +0.67 ± 0.17 | +1.21 ± 0.31 | Warmest | 2nd | 2016 | +0.76 | +1.37 |
| Coolest | 137th | 1911 | -0.53 | -0.95 | |||
| Land and Ocean | +0.73 ± 0.17 | +1.31 ± 0.31 | Warmest | 2nd | 2016 | +0.84 | +1.51 |
| Coolest | 137th | 1911 | -0.56 | -1.01 | |||
| Arctic | |||||||
| Land and Ocean | +2.01 ± 0.22 | +3.62 ± 0.40 | Warmest | 2nd | 2016 | +2.66 | +4.79 |
| Coolest | 137th | 1888 | -1.48 | -2.66 | |||


The most current data can be accessed via the Global Surface Temperature Anomalies page.
Precipitation
June
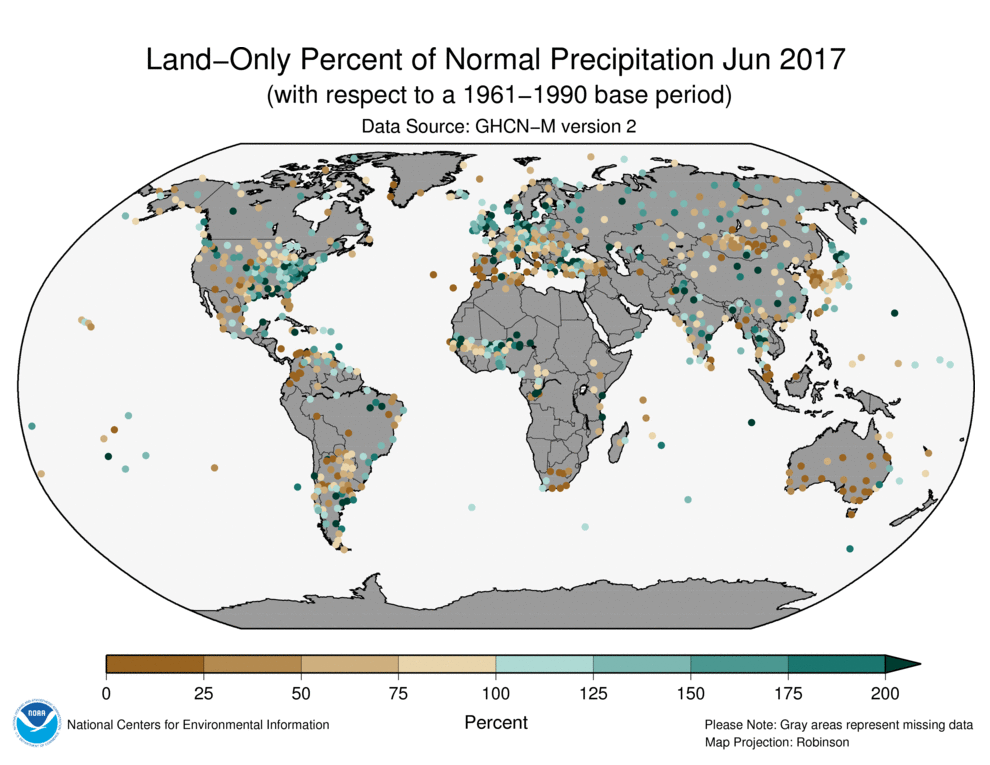
The maps below represent precipitation percent of normal (left, using a base period of 1961–1990) and precipitation percentiles (right, using the period of record) based on the GHCN dataset of land surface stations. As is typical, precipitation anomalies during June 2017 varied significantly around the world. June 2017 precipitation was generally drier than normal across the central and western contiguous U.S., northern and central Mexico, northern Colombia, northeastern Brazil, Paraguay, northern Argentina, Spain and across parts of central and southeastern Europe, Mongolia, the Korean Peninsula, southern Africa, and much of Australia. Wetter-than-normal conditions were notable across much of the eastern contiguous U.S., central and southern Argentina, southern Chile, northern Europe, western Africa, western and central Russia, across central and southern China, India, and northern Japan.

Select national information is highlighted below. (Please note that different countries report anomalies with respect to different base periods. The information provided here is based directly upon these data):
- Portugal experienced very dry conditions during June 2017, receiving only 9.6 mm (0.38 inch) or 30% of its June normal precipitation. According to The Portuguese Institute for Sea and Atmosphere, most of the nation was experiencing drought conditions at the end of the month with 72.3% of the country experiencing severe drought and 7.3% having extreme drought.
- Wetter-than-average conditions were observed across much of the United Kingdom, with several locations recording nearly double their June normal precipitation. Overall, June 2017 was the sixth wettest June (113.7 mm / 4.48 inches or 155% of June normal precipitation)since national records began in 1910. Regionally, Scotland had its wettest June in its 108-year record, receiving 178% of its June normal precipitation.
- Severe thunderstorms brought torrential rain to France's south-central department of Haute-Loire on June 13th, with several southern communes being the most affected. According to Meteo France, the Landos-Charbon station received a total of 123 mm (4.84 inches) of precipitation in one hour. To put it in perspective, this value represents 48 days of rain and is more than twice the 100-year return period. The total amount of precipitation for the event was 226 mm (8.90 inches) or nearly three months of rain.
- Below-average precipitation was observed across much of the Island of Fiji during June 2017. According to Fiji's Meteorological Service, 10 of the 24 stations observed well-below-average conditions during the month, with nine stations reporting below-average conditions and two stations observing above-average rainfall. Suppressed rainfall over the nation was in part due to the South Pacific Convergence Zone being further north during the month.
- Much of Australia experienced drier-than-average conditions during June 2017, with several locations experiencing record dry conditions. Overall, the national precipitation total of 8.8 mm (0.35 inch) was only 38% of June's normal precipitation, resulting in the second driest June since national precipitation records began in 1900 behind 1940 (8.0 mm / 0.31 inch). Over 100 stations across the nation reported their lowest June rainfall total on record. Regionally, Victoria had its driest June on record at 13.7 mm (0.54 inch) or 23% of June's normal rainfall; Tasmania had its seventh driest June; and Western Australia had its 9th driest.
- Extreme heat and lack of precipitation contributed to Austria experiencing extreme dryness during June 2017. Austria as a whole had 70% of normal June precipitation. Regionally, parts of the northern and eastern Austria received 45% of normal June precipitation.
- Drier-than-average conditions plagued much of New Zealand during June 2017. Several stations south of Auckland city had less than 50% of June normal precipitation, with two stations in Auckland city recording their lowest June precipitation on record. Many other locations in the western North Island had record or near-record low rainfall totals.
April–June 2017
Ocean Heat Content
Ocean Heat Content (OHC) is essential for understanding and modeling global climate since > 90% of excess heat in the Earth's system is absorbed by the ocean. Further, expansion due to increased ocean heat contributes to sea level rise. Change in OHC is calculated from the difference of observed temperature profiles from the long-term mean.
| Basin | 0-700 meters | Rank (1955-2023) | |||||
|---|---|---|---|---|---|---|
| Entire Basin | Northern Hemisphere | Southern Hemisphere | ||||
| Atlantic | 6.550 | 7th | 3.876 | 6th | 2.674 | 7th |
| Indian | 2.948 | 11th | 0.485 | 14th | 2.463 | 7th |
| Pacific | 6.725 | 5th | 3.792 | 2nd | 2.933 | 8th |
| World | 16.228 | 6th | 8.158 | 4th | 8.070 | 8th |
| Source: Basin time series of heat content | ||||||

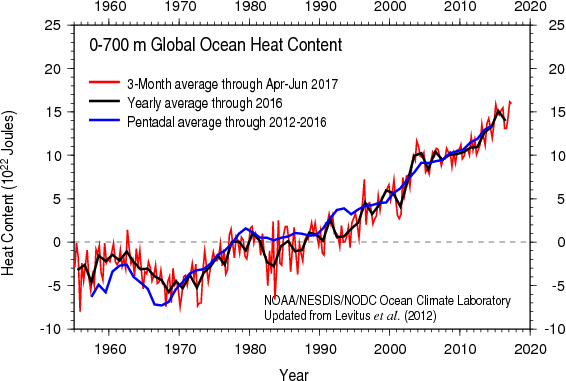
Global OHC for April–June 2017 was the highest April–June OHC since records began in 1955. Overall, the April–June 2017 OHC reveals widespread warmer than normal conditions, a situation observed since the last quarter of 2016. Much higher, > 20x105 J/m3, than long-term mean OHC conditions were remarkable at high latitudes, i.e. in the Norwegian Sea and Barents Sea, in the northwestern Weddell Sea, and along the coast of Antarctica in the Indian and Pacific Ocean sectors. Much higher than normal OHC was also observed in the Gulf Stream/North Atlantic Current, the western Gulf of Mexico and the Caribbean Sea, and the Brazil Current. Cooler than normal conditions were present in the Loop Current, the subpolar North Atlantic Ocean south of Greenland and Iceland, the subtropical South Indian Ocean, the central South Pacific Ocean, and along the Antarctic Circumpolar Current in the Indian and Pacific Ocean sectors.
References
- Peterson, T.C. and R.S. Vose, 1997: An Overview of the Global Historical Climatology Network Database. Bull. Amer. Meteorol. Soc., 78, 2837-2849.
- Huang, B., V.F. Banzon, E. Freeman, J. Lawrimore, W. Liu, T.C. Peterson, T.M. Smith, P.W. Thorne, S.D. Woodruff, and H-M. Zhang, 2016: Extended Reconstructed Sea Surface Temperature Version 4 (ERSST.v4). Part I: Upgrades and Intercomparisons. J. Climate, 28, 911-930.