Introduction
Temperature anomalies and percentiles are shown on the gridded maps below. The anomaly map on the left is a product of a merged land surface temperature (Global Historical Climatology Network, GHCN) and sea surface temperature (ERSST.v4) anomaly analysis as described in Huang et al. (2016). Temperature anomalies for land and ocean are analyzed separately and then merged to form the global analysis. For more information, please visit NCEI's Global Surface Temperature Anomalies page. The percentile map on the right provides additional information by placing the temperature anomaly observed for a specific place and time period into historical perspective, showing how the most current month, season or year compares with the past.
Temperatures
In the atmosphere, 500-millibar height pressure anomalies correlate well with temperatures at the Earth's surface. The average position of the upper-level ridges of high pressure and troughs of low pressure—depicted by positive and negative 500-millibar height anomalies on the  March 2017 and
 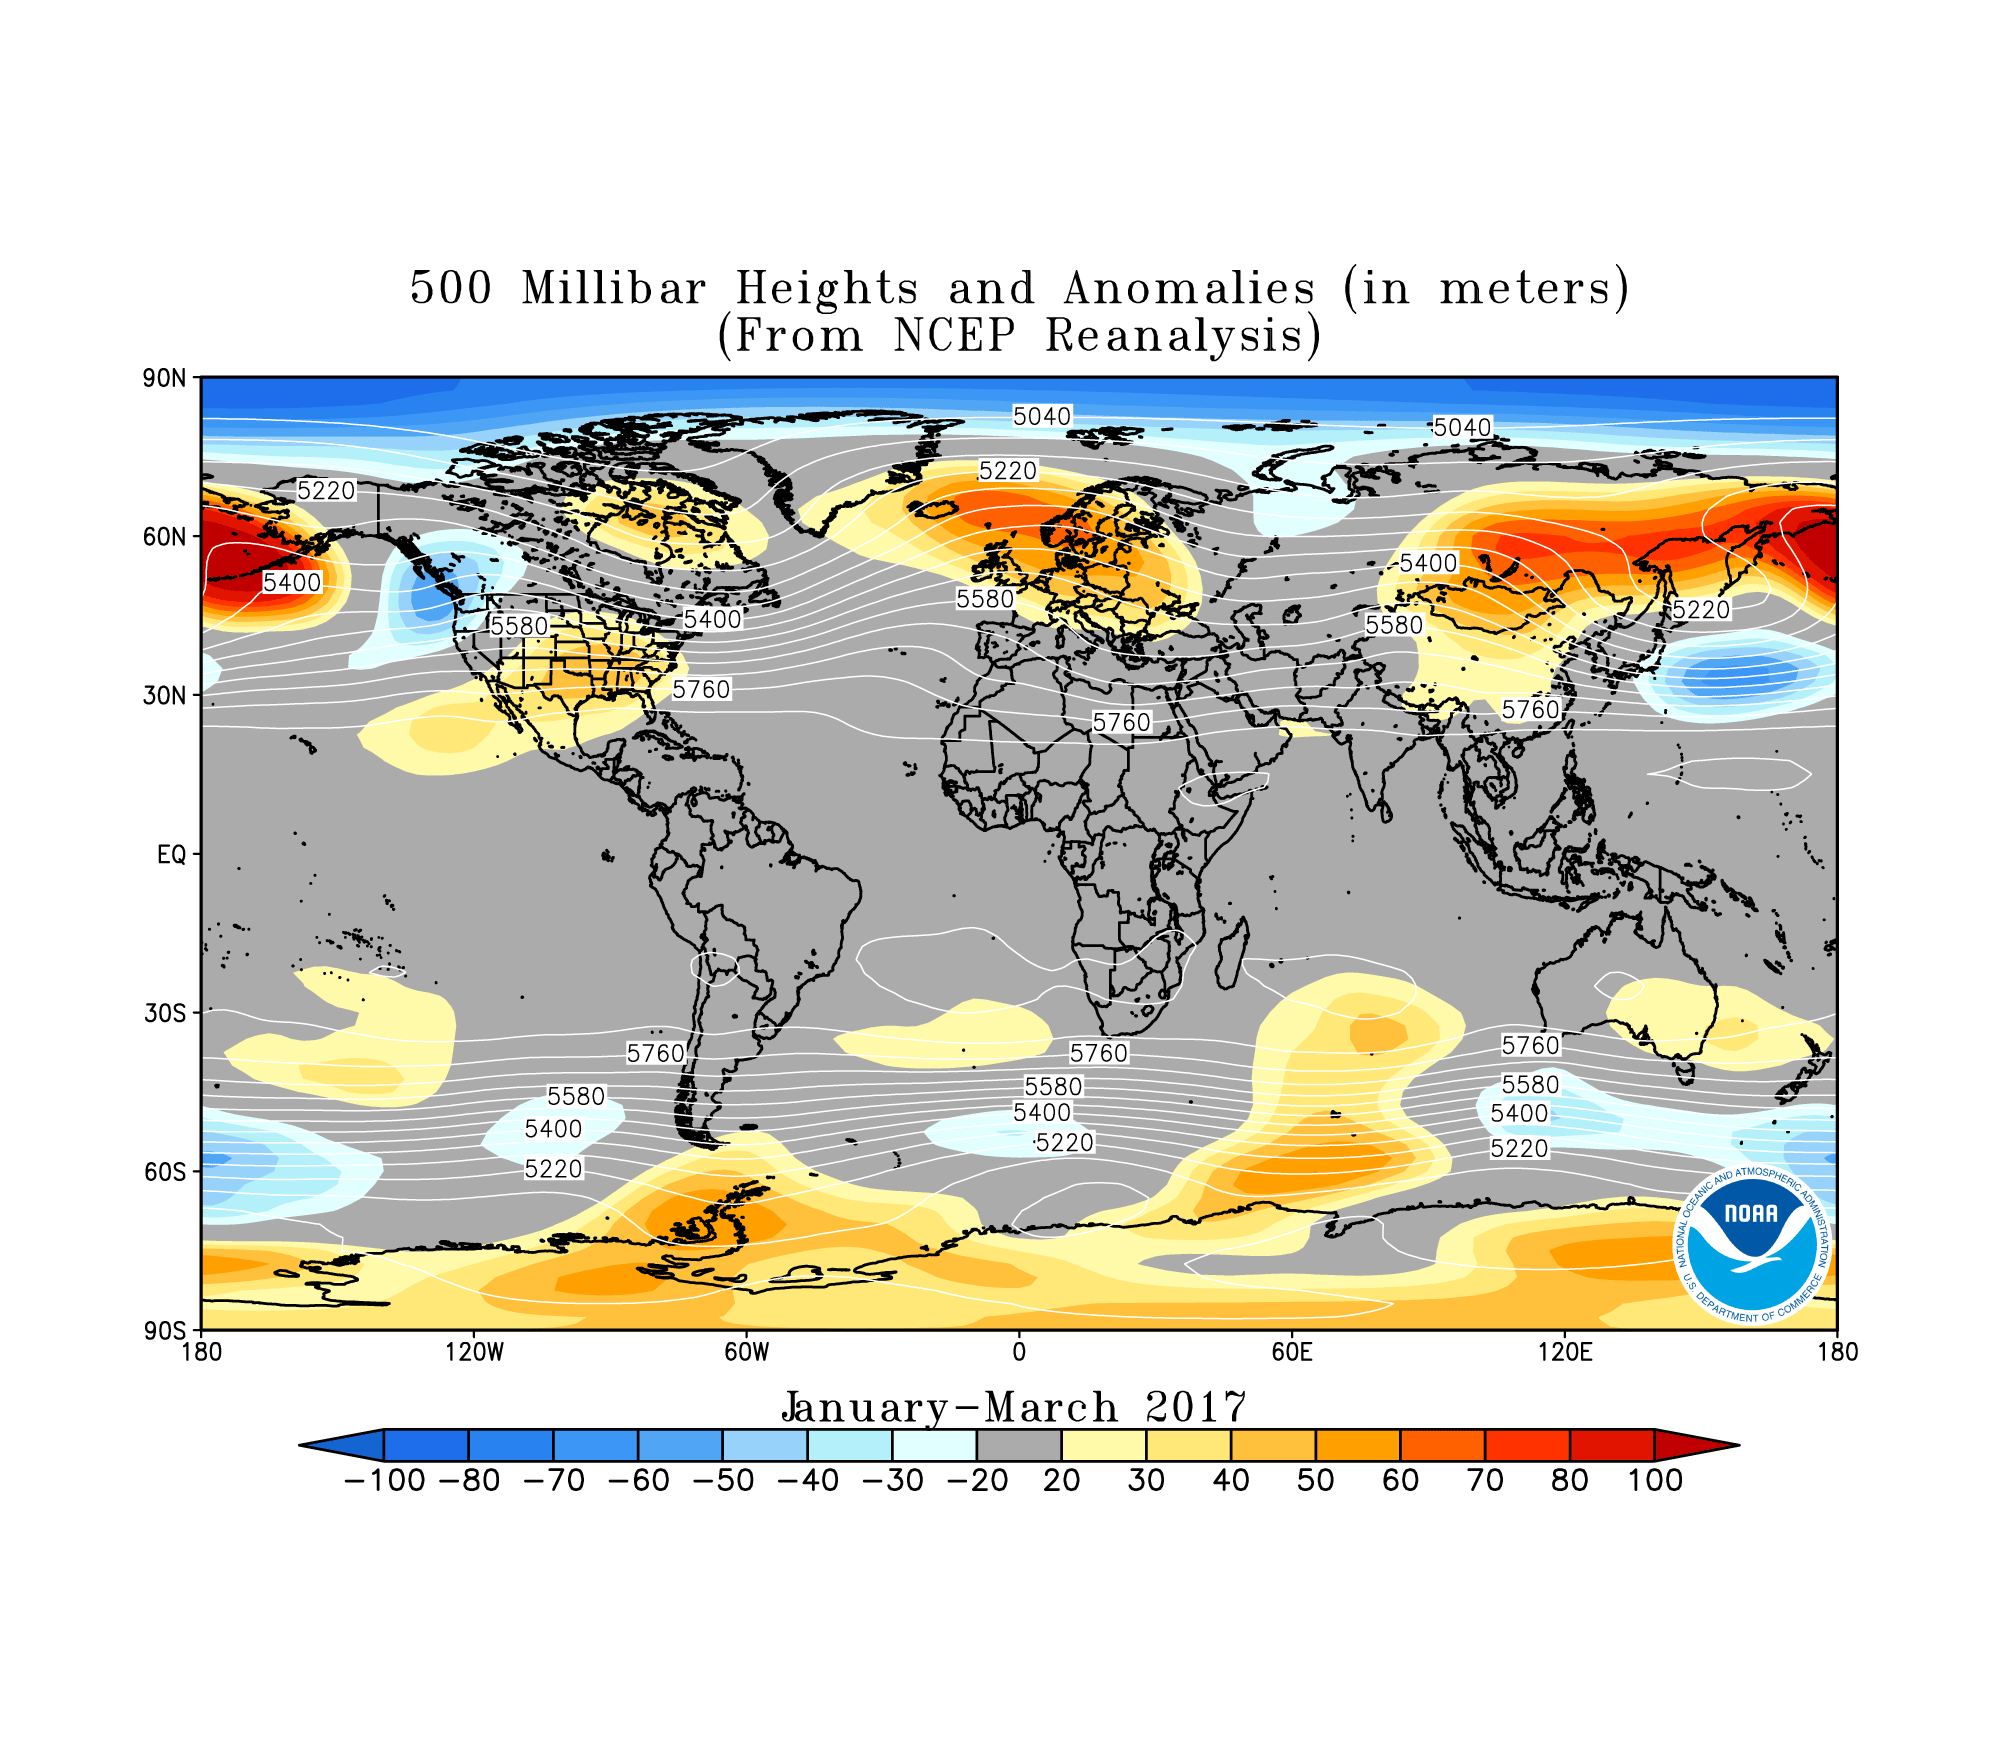 January–March 2017 maps—is generally reflected by areas of positive and negative temperature anomalies at the surface, respectively.
March


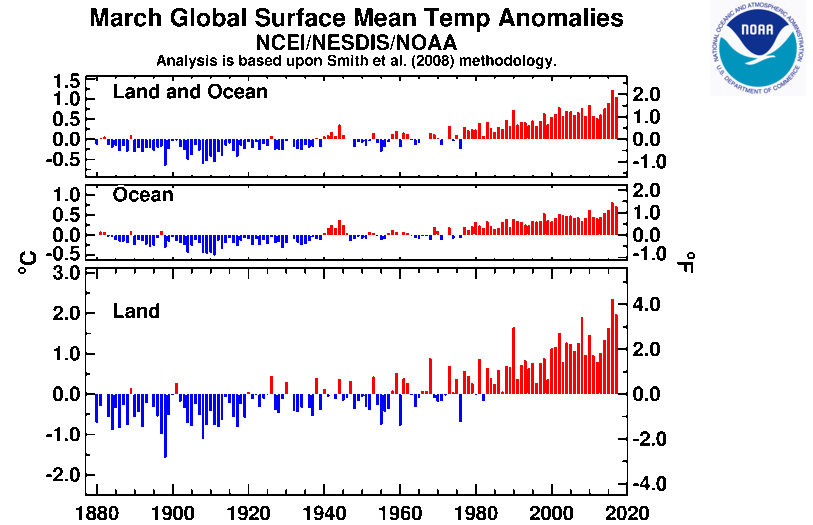
The combined global average temperature over the land and ocean surfaces for March 2017 was 1.05°C (1.89°F) above the 20th century average of 12.7°C (54.9°F). This was the second highest for March since global temperature records began in 1880, behind the record year 2016 by 0.18°C (0.32°F) and ahead of 2015 by +0.15°C (+0.27°F). March 2017 marks the first time since April 2016 that the global land and ocean temperature departure from average was greater than 1.0°C (1.8°F) and the first time the monthly temperature departure from average surpasses 1.0°C (1.8°F) in the absence of an El Niño episode in the tropical Pacific Ocean. Overall, March 2017 tied with January 2016 as the fifth highest monthly global land and ocean temperature departure from average on record (1,647 monthly records). The record monthly temperature departure of 1.23°C (2.21°F) was set in March 2016.
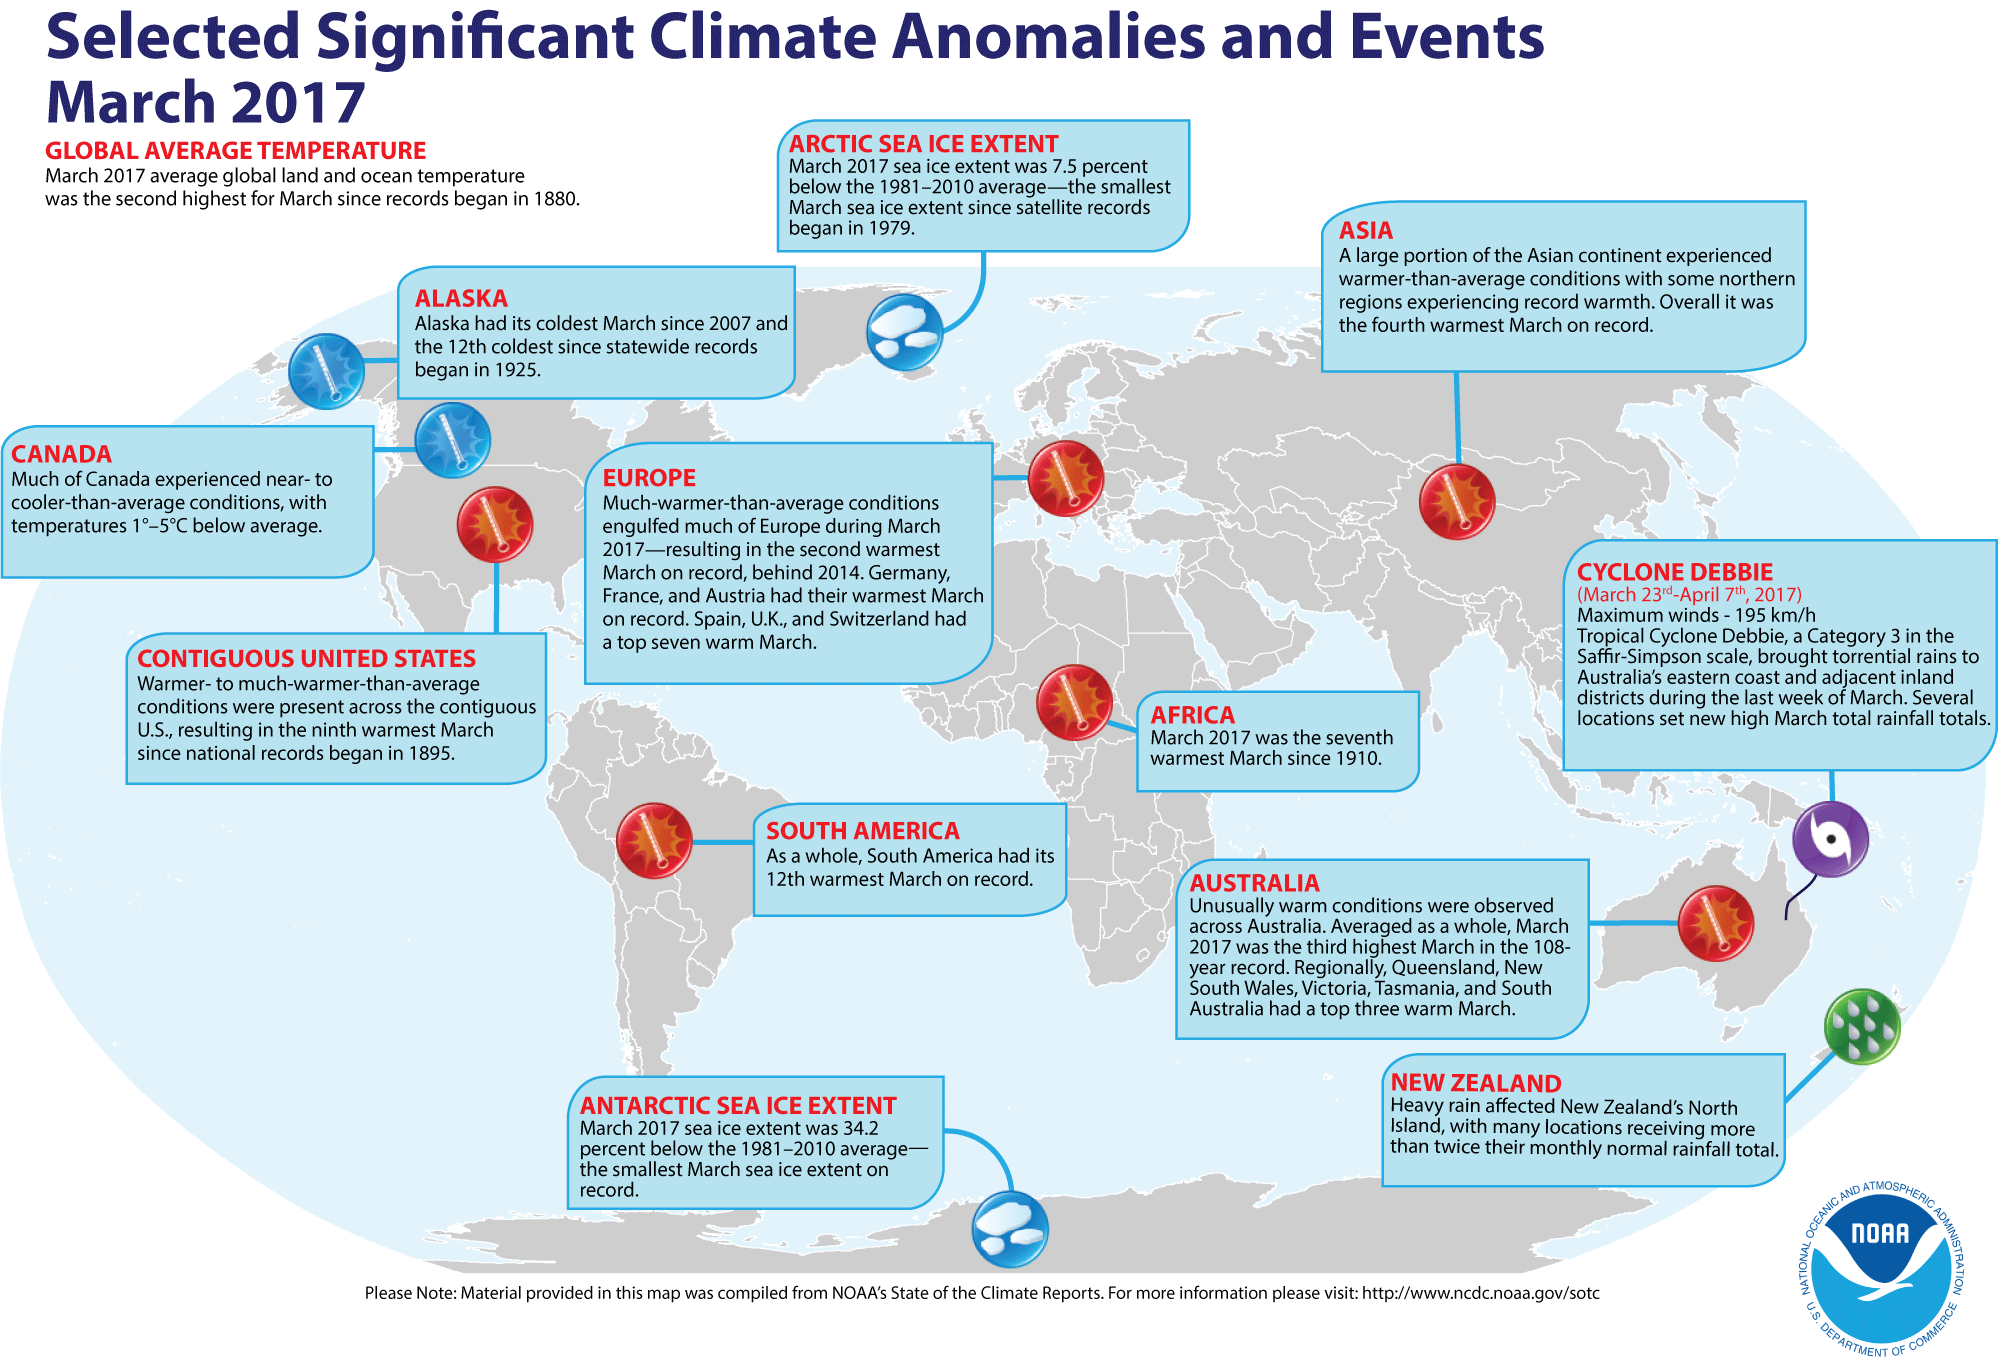
March 2017 was characterized by warmer- to much-warmer-than-average conditions across much of Earth's surface. The most notable warm temperature departures from the 1981–2010 average were recorded across the contiguous U.S., Europe, Russia, Mongolia, and Australia, where temperature departures were +3.0°C (+5.4°F) or greater. Some areas in northern and eastern Russia, central Australia, and the south-central contiguous U.S. had a record warm March. Near- to cooler-than-average conditions were present across Canada, Alaska, China, and parts of central Asia, with the most notable cool March temperature departures across western Canada and Alaska (-3.0°C / -5.4°F or lower). However, no land area had a record cold March. According to NCEI's Regional Analysis, four of the six continents had at least a top seven warm March since continental records began in 1910, with Europe and Oceania having their second warmest March on record.
The average global land surface temperature was 1.98°C (3.56°F)—the second highest March global land temperature on record, trailing behind the record set in 2016 (+2.36°C / +4.25°F) and ahead of 2008 by +0.07°C (+0.13°F). This was also the third highest land monthly temperature among all months (1,647) on record, behind March 2016 and February 2016 (+2.25°C / +4.05°F).
Select national information is highlighted below. Please note that different countries report anomalies with respect to different base periods. The information provided here is based directly upon these data:
- North America had cooler-than-average temperatures across Alaska and Canada, while the contiguous U.S. and Mexico had warmer-than-average conditions during March 2017. Overall, the March 2017 average temperature for North America was +0.88°C (+1.58°F)—the coolest March since 2014 and the 30th highest March since continental averages began in 1910.
- Alaska had its coldest March since 2007 and the 12th coldest since statewide records began in 1925.
- Much of Canada experienced near- to cooler-than-average conditions during March 2017, with temperatures 1.0°C–5.0°C (1.8°F–9.0°F) below the 1981–2010 average.
- In contrast, the contiguous U.S. had warmer- to much-warmer-than-average conditions, resulting in its ninth warmest March since national records began in 1895.
- Much-warmer-than-average conditions engulfed much of Europe during March 2017, resulting in the second highest March temperature since continental records began in 1910, behind 2014.
- Spain's March 2017 national temperature was 12.2°C (54.0°F) or 0.9°C (1.6°F) above the 1981–2010 average—the seventh warmest March since 1965.
- The United Kingdom's mean temperature was 7.3°C (45.1°F) and 1.8°C (3.2°F) above the 1981–2010 average. March 2017 tied as the fifth highest March temperature since the nation's records began in 1910. Regionally, England had its warmest March since 1957 and the third highest on record.
- March 2017 average temperature for France was 2.3°C (4.1°F) above the 1981–2010 average, tying with March 1957 as the warmest March in its 118-year record.
- Germany also had its warmest March on record. The monthly national average temperature of 7.2°C (45.0°F) was 2.9°C (5.2°F) above the 1981–2010 average. This value surpassed the previous records set in 1938 and 1989 by +0.2°C (+0.4°F).
- Austria also observed its warmest March in its 251-year record. The monthly temperature was 3.5°C (6.3°F) above the 1981–2010 average. This value surpasses the previous record set in 1994 by +0.1°C (+0.2°F). Several locations, including Vienna, Graz, St. Andra, and St. Pölten, set new warm March temperature records.
- The mean March temperature for Switzerland was the second highest since national records began in 1864, behind 1994 by 0.2°C (0.4°F).
- Of note, Ireland, Finland, and Sweden also experienced above-average March temperatures. Stations in Ireland had their highest March temperatures in five years. Sweden and Denmark observed unusually warm temperatures at the end of the month, recording maximum temperatures above 20°C (68°F). In Denmark, a near-record March maximum temperature was recorded when temperatures soared to 21.5°C (70.7°F) in Karup. The only other time temperatures were this high was in March 1990, when the Danish record of 22.2°C (72.0°F) was set. Records in Denmark extend back to 1874. Several stations across Sweden also set new warm March temperature records, with Uppsala recording a temperature of 20.2°C (68.4°F) on 26 March 2017, exceeding the previous record set on 22 March 2012 by +1.2°C (2.2°F). This is the third highest March temperature on record for central Sweden.
- Oceania was characterized by much-warmer-than-average conditions during March 2017. The March 2017 average temperature for Oceania was 1.81°C (3.26°F) above the 1910–2000 average and the second highest March on record, behind 2016.
- Australia experienced unusually warm conditions during the month. Averaged as a whole, the March 2017 average mean temperature was 1.66°C (3.0°F) above the 1961–1990 average and the third highest in their 108-year record. The national maximum and minimum temperatures during March 2017 were second highest, behind 1986 and 2016, respectively. Regionally, Queensland, New South Wales, Victoria, Tasmania, and South Australia had a top three warm March, with Victoria recording its warmest March on record, surpassing the previous record set in 2016 by +0.41°C (0.74°F).
- Warmer- to much-warmer-than-average conditions affected New Zealand. The national average temperature was 16.0°C (60.1°F) or 0.3°C (0.5°F) above the 1981–2010 average.
Much of the world's oceans surfaces also experienced warmer- to much-warmer-than-average conditions during March 2017. Record warmth was limited to sparse areas across the central, eastern and western equatorial, and southern Pacific Ocean, southern Atlantic Ocean, and southwestern Indian Ocean. Near- to cooler-than-average conditions were observed across the North and Central Pacific Ocean, North Atlantic (south of Greenland), eastern Indian Ocean, and parts of the central and southern Atlantic Ocean. No ocean areas had a record cold March.
Averaged as a whole, the March 2017 global sea surface temperature was 0.71°C (1.28°F) above the 20th century average of 15.9°C (60.7°F). This was the second highest March in the 138-year record, behind 2016 by 0.10°C (0.18°F) and ahead of 2015 by +0.08°C (0.14°F). The global ocean surface temperature for March 2017 was the highest for any month since October 2016 (+0.72°C / +1.30°F).
ENSO-neutral conditions continued to be present across the equatorial Pacific Ocean during March 2017. According to NOAA's Climate Prediction Center, ENSO-neutral conditions are favored to persist through the Northern Hemisphere spring (Southern Hemisphere fall) 2017, with increasing chances for El Niño development by later summar and fall. This forecast focuses on the ocean surface temperatures between 5°N and 5°S latitude and 170°W to 120°W longitude, called the Niño 3.4 region.
| March | Anomaly | Rank (out of 138 years) | Records | ||||
|---|---|---|---|---|---|---|---|
| °C | °F | Year(s) | °C | °F | |||
| Global | |||||||
| Land | +1.98 ± 0.11 | +3.56 ± 0.20 | Warmest | 2nd | 2016 | +2.36 | +4.25 |
| Coolest | 137th | 1898 | -1.58 | -2.84 | |||
| Ocean | +0.71 ± 0.14 | +1.28 ± 0.25 | Warmest | 2nd | 2016 | +0.81 | +1.46 |
| Coolest | 137th | 1911 | -0.51 | -0.92 | |||
| Land and Ocean | +1.05 ± 0.14 | +1.89 ± 0.25 | Warmest | 2nd | 2016 | +1.23 | +2.21 |
| Coolest | 137th | 1898 | -0.65 | -1.17 | |||
| Northern Hemisphere | |||||||
| Land | +2.27 ± 0.18 | +4.09 ± 0.32 | Warmest | 3rd | 2016 | +2.74 | +4.93 |
| Coolest | 136th | 1898 | -1.98 | -3.56 | |||
| Ocean | +0.72 ± 0.13 | +1.30 ± 0.23 | Warmest | 2nd | 2016 | +0.80 | +1.44 |
| Coolest | 137th | 1909 | -0.51 | -0.92 | |||
| Land and Ocean | +1.30 ± 0.13 | +2.34 ± 0.23 | Warmest | 2nd | 2016 | +1.54 | +2.77 |
| Coolest | 137th | 1898 | -0.89 | -1.60 | |||
| Southern Hemisphere | |||||||
| Land | +1.24 ± 0.13 | +2.23 ± 0.23 | Warmest | 2nd | 2016 | +1.39 | +2.50 |
| Coolest | 137th | 1904, 1910 | -0.91 | -1.64 | |||
| Ocean | +0.71 ± 0.15 | +1.28 ± 0.27 | Warmest | 2nd | 2016 | +0.83 | +1.49 |
| Coolest | 137th | 1911 | -0.56 | -1.01 | |||
| Land and Ocean | +0.79 ± 0.14 | +1.42 ± 0.25 | Warmest | 2nd | 2016 | +0.91 | +1.64 |
| Coolest | 137th | 1911 | -0.58 | -1.04 | |||
| Arctic | |||||||
| Land and Ocean | +3.82 ± 0.21 | +6.88 ± 0.38 | Warmest | 1st | 2017 | +3.82 | +6.88 |
| Coolest | 138th | 1902 | -3.44 | -6.19 | |||

The most current data can be accessed via the Global Surface Temperature Anomalies page.
Year-to-date (January–March)


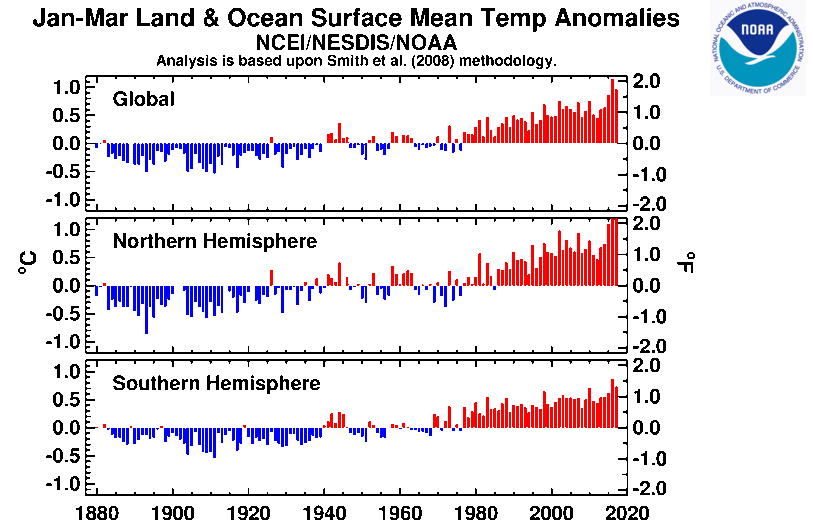
The global land and ocean surface temperature during the first quarter of the year (January–March) was 0.97°C (1.75°F) above the 20th century average of 12.3°C (54.1°F)—the second highest such period in the 138-year record. This value trails behind the record year set in 2016 by 0.18°C (0.32°F), but +0.15°C (+0.27°F) higher than 2015.
The global land surface temperature during January–March 2017 was also the second highest on record at 1.75°C (3.15°F) above the 20th century average of 3.7°C (38.5°F). This value was behind the record warm 2016 by 0.31°C (0.56°F), but surpassed the now third warmest such period (2015) by +0.19°C (0.34°F). The first three months of the year were characterized by warmer- to much-warmer-than-average conditions across most of the Earth's land surface, with the most notable warm temperature departures across North America and much of northern Asia, where temperatures were 3.0°C (5.4°F) above average or higher. Record warm temperatures were observed across the south-central contiguous U.S., across much of Mexico, eastern Russia, and eastern Australia. Near- to cooler-than-average conditions were limited to Alaska and parts of western Canada and the western contiguous U.S. and scattered across parts of northern Africa, southeastern Europe, and the Middle East. No land areas had a record cold March. According to NCEI's Global Regional Analysis, five of the six continents had a top five warm January–March period, with South America (tied with 1998) and Oceania having their third warmest year-to-date since continental records began in 1910. Europe had its coldest January –March period since 2013.
The average global sea surface temperature for January–March 2017 was 0.68°C (1.22°F) above the 20th century average of 15.9°C (60.6°F)—also the second highest in the 138–year record, behind 2016 by 0.14°C (0.25°F) and 0.07°C (0.13°F) higher than 2010. Warmer- to much-warmer-than-average conditions engulfed much of the Earth's ocean surfaces, with record warmth observed across parts of western, central, and eastern Pacific Ocean, western Indian Ocean, and scattered across parts of central and the southern Atlantic Ocean. Near- to cooler-than-average temperatures were recorded across the North and Central Pacific Ocean, central and eastern Indian Ocean, the northern and southern Atlantic Ocean. No ocean areas had a record cold January–March period.
| January–March | Anomaly | Rank (out of 138 years) | Records | ||||
|---|---|---|---|---|---|---|---|
| °C | °F | Year(s) | °C | °F | |||
| Global | |||||||
| Land | +1.75 ± 0.16 | +3.15 ± 0.29 | Warmest | 2nd | 2016 | +2.06 | +3.71 |
| Coolest | 137th | 1893 | -1.30 | -2.34 | |||
| Ocean | +0.68 ± 0.15 | +1.22 ± 0.27 | Warmest | 2nd | 2016 | +0.82 | +1.48 |
| Coolest | 137th | 1911 | -0.48 | -0.86 | |||
| Land and Ocean | +0.97 ± 0.16 | +1.75 ± 0.29 | Warmest | 2nd | 2016 | +1.15 | +2.07 |
| Coolest | 137th | 1911 | -0.54 | -0.97 | |||
| Northern Hemisphere | |||||||
| Land | +2.01 ± 0.21 | +3.62 ± 0.38 | Warmest | 2nd | 2016 | +2.36 | +4.25 |
| Coolest | 137th | 1893 | -1.59 | -2.86 | |||
| Ocean | +0.71 ± 0.15 | +1.28 ± 0.27 | Warmest | 2nd | 2016 | +0.87 | +1.57 |
| Coolest | 137th | 1909 | -0.46 | -0.83 | |||
| Land and Ocean | +1.20 ± 0.17 | +2.16 ± 0.31 | Warmest | 2nd | 2016 | +1.44 | +2.59 |
| Coolest | 137th | 1893 | -0.87 | -1.57 | |||
| Southern Hemisphere | |||||||
| Land | +1.07 ± 0.14 | +1.93 ± 0.25 | Warmest | 3rd | 2016 | +1.28 | +2.30 |
| Coolest | 136th | 1904 | -0.92 | -1.66 | |||
| Ocean | +0.67 ± 0.16 | +1.21 ± 0.29 | Warmest | 2nd | 2016 | +0.80 | +1.44 |
| Coolest | 137th | 1911 | -0.51 | -0.92 | |||
| Land and Ocean | +0.73 ± 0.15 | +1.31 ± 0.27 | Warmest | 2nd | 2016 | +0.87 | +1.57 |
| Coolest | 137th | 1911 | -0.53 | -0.95 | |||
| Arctic | |||||||
| Land and Ocean | +2.69 ± 0.30 | +4.84 ± 0.54 | Warmest | 2nd | 2016 | +3.21 | +5.78 |
| Coolest | 137th | 1966 | -2.49 | -4.48 | |||

The most current data can be accessed via the Global Surface Temperature Anomalies page.
Precipitation
March
The maps below represent precipitation percent of normal (left, using a base period of 1961–1990) and precipitation percentiles (right, using the period of record) based on the GHCN dataset of land surface stations. As is typical, precipitation anomalies during March 2017 varied significantly around the world. March 2017 precipitation was generally drier than normal across Alaska, the southwestern and southeastern contiguous U.S., northern and southern Africa, central, southern and eastern parts of Asia, and central Australia. Wetter-than-normal conditions were notable across Mexico, the northwestern U.S., central and southern Argentina, eastern Australia, and southeastern parts of Asia.


Select national information is highlighted below. (Please note that different countries report anomalies with respect to different base periods. The information provided here is based directly upon these data):
- According to the North America Drought Monitor, 5.3% of North America was in drought during March 2017. Moderate (D1) to exceptional drought (D4) conditions were present across parts of western Canada, central and eastern parts of the contiguous U.S. and central and southern Mexico.
- An extratropical cyclone brought copious rain to parts of Argentina during the last week of March, setting several new daily and monthly precipitation records. The station Comodoro Rivadavia set a new 24-hour precipitation total record when it observed a total of 232.0 mm of rain on March 30. This surpassed the previous record of 48.3 mm set in 1976. Comodoro Rivadavia also set a new monthly record (320.4 mm), surpassing the previous record of 140.6 mm set in 1946.
- Although the nationally-average precipitation total for Australia was near average, there were marked regional contrasts. Much of the central Australia had below-average conditions, while parts of the west and east had above-average precipitation. Tropical Cyclone Debbie, a Category 3 in the Saffir-Simpson scale, brought torrential rains to Australia's eastern coast and adjacent inland districts during the last week of March, with several locations setting their highest March total rainfall on record. The station Plane Creek Sugar Mill received a total of 1315.6 mm of rain in March 2017—the highest March precipitation total in its 108-year record, surpassing the previous record of 996.4 mm set in 2011. The average March precipitation total for Plane Creek Sugar Mill station is 298.7 mm.
- Heavy rain affected New Zealand's North Island during March 2017, with many locations receiving more than twice their March normal rainfall and several others recording over three times their monthly normal rainfall total. Whangaparaoa, north of Auckland, had a total of 354 mm or nearly five times its March normal total rainfall and it's wettest March since records began in 1946. However, drier-than-average conditions plagued parts of the west and south of the South Island, with Tiwai Point recording 26% of its March normal rainfall—this resulted in its driest March since records began in 1970. Mt. Cook Village and Lake Manapouri had their second driest March since records began in 1928 and 1971, respectively.
Ocean Heat Content
Ocean Heat Content (OHC) is essential for understanding and modeling global climate since > 90% of excess heat in the Earth's system is absorbed by the ocean. Further, expansion due to increased ocean heat contributes to sea level rise. Change in OHC is calculated from the difference of observed temperature profiles from the long-term mean.
| Basin | 0-700 meters | Rank (1955-2023) | |||||
|---|---|---|---|---|---|---|
| Entire Basin | Northern Hemisphere | Southern Hemisphere | ||||
| Atlantic | 6.171 | 8th | 3.613 | 9th | 2.558 | 8th |
| Indian | 2.975 | 11th | 0.635 | 7th | 2.340 | 14th |
| Pacific | 6.870 | 6th | 3.129 | 8th | 3.742 | 5th |
| World | 16.024 | 7th | 7.385 | 7th | 8.639 | 9th |
| Source: Basin time series of heat content | ||||||

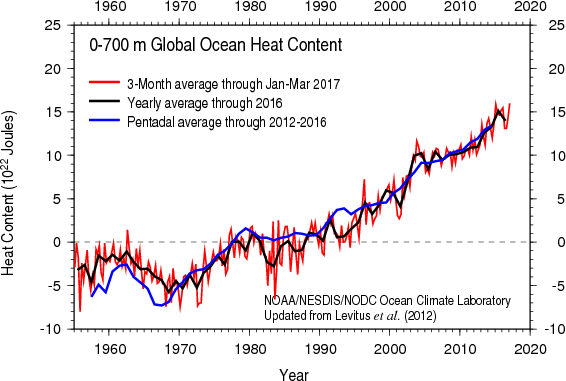
Global OHC for January–March 2017 was the highest January–March OHC in our record. Overall, the latest OHC reveals widespread warmer than normal conditions, a situation already observed in the last quarter of 2016. As during that period, Baffin Bay and the Barents Sea, the Gulf Stream/North Atlantic Current, the Kuroshio Current/Kuroshio Extension, and the Agulhas Current and its retroflection, as well as the western Gulf of Mexico and the Caribbean Sea, show much higher than long-term mean OHC. Cooler than normal conditions existed in the eastern Gulf of Mexico, the subpolar North Atlantic Ocean, the central South Pacific Ocean, and the Weddell Sea. Cooler than normal conditions observed in late 2016, although significantly eroded, still existed in early 2017 in the central North Pacific Ocean, around the Equator in the central Pacific Ocean, and tropical and western South Indian Ocean.
References
- Peterson, T.C. and R.S. Vose, 1997: An Overview of the Global Historical Climatology Network Database. Bull. Amer. Meteorol. Soc., 78, 2837-2849.
- Huang, B., V.F. Banzon, E. Freeman, J. Lawrimore, W. Liu, T.C. Peterson, T.M. Smith, P.W. Thorne, S.D. Woodruff, and H-M. Zhang, 2016: Extended Reconstructed Sea Surface Temperature Version 4 (ERSST.v4). Part I: Upgrades and Intercomparisons. J. Climate, 28, 911-930.