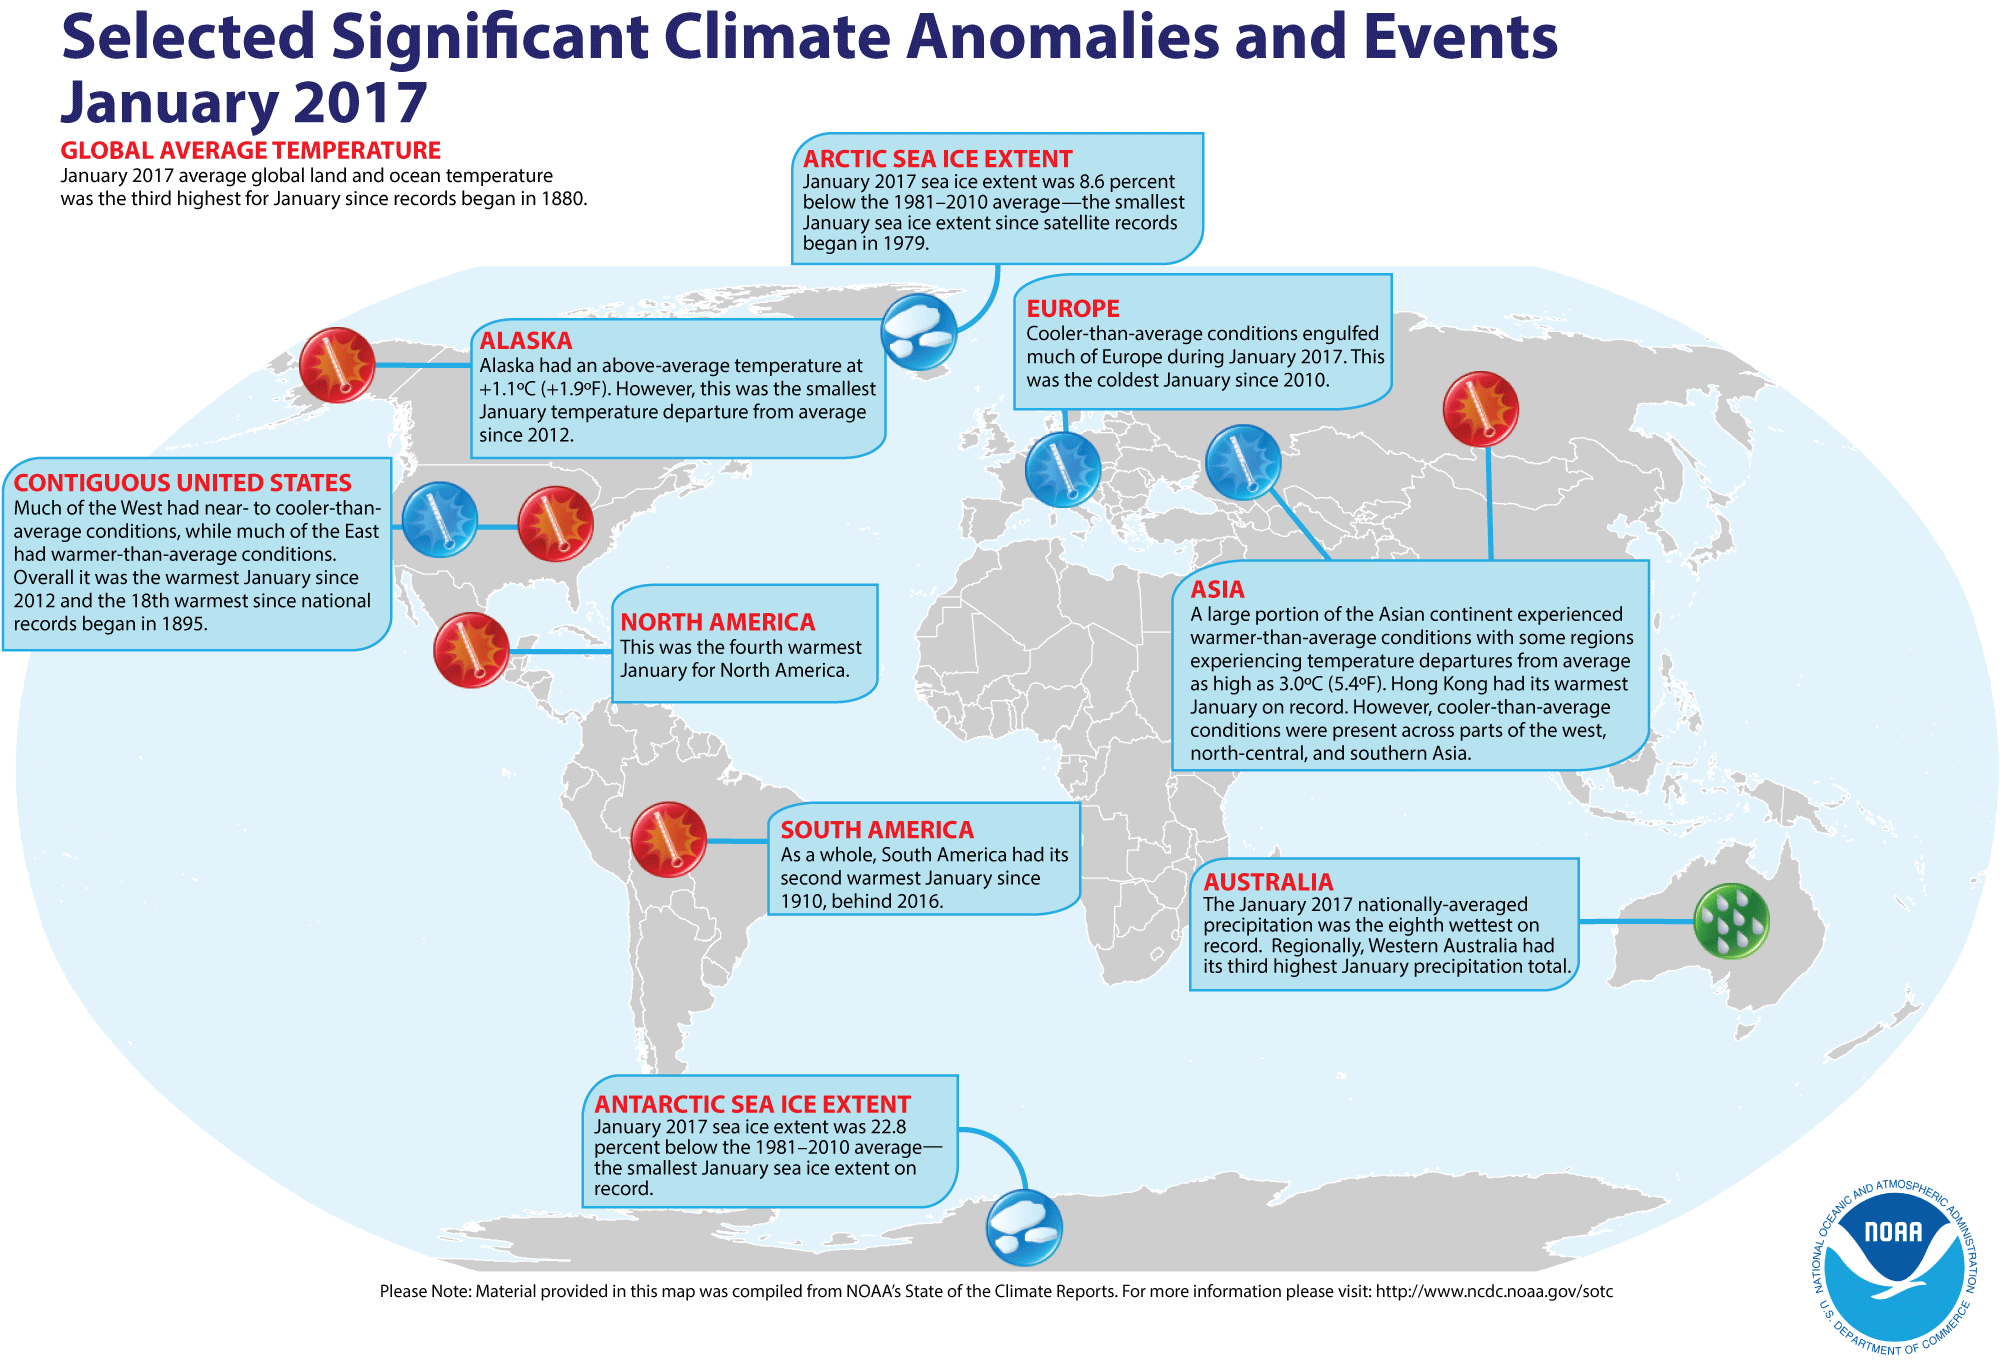
Introduction
Temperature anomalies and percentiles are shown on the gridded maps below. The anomaly map on the left is a product of a merged land surface temperature (Global Historical Climatology Network, GHCN) and sea surface temperature (ERSST.v4) anomaly analysis as described in Huang et al. (2016). Temperature anomalies for land and ocean are analyzed separately and then merged to form the global analysis. For more information, please visit NCDC's Global Surface Temperature Anomalies page. The percentile map on the right provides additional information by placing the temperature anomaly observed for a specific place and time period into historical perspective, showing how the most current month, season or year compares with the past.
The most current data can be accessed via the Global Surface Temperature Anomalies page.
Temperatures
In the atmosphere, 500-millibar height pressure anomalies correlate well with temperatures at the Earth's surface. The average position of the upper-level ridges of high pressure and troughs of low pressure—depicted by positive and negative 500-millibar height anomalies on the  January 2017 map—is generally reflected by areas of positive and negative temperature anomalies at the surface, respectively.
January
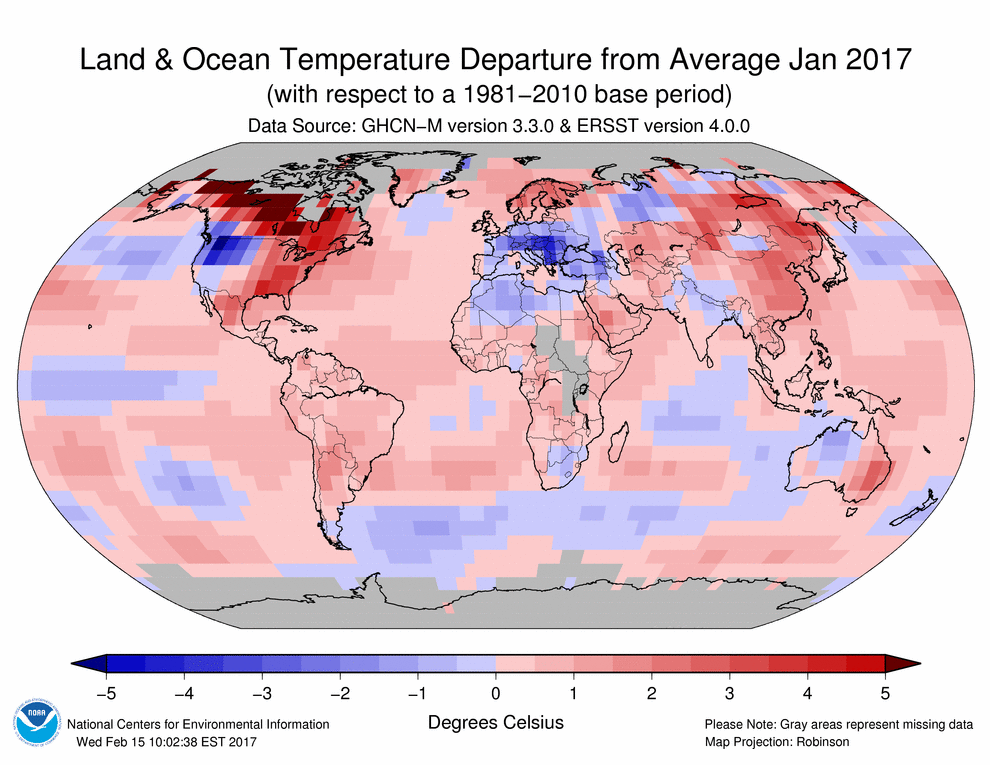

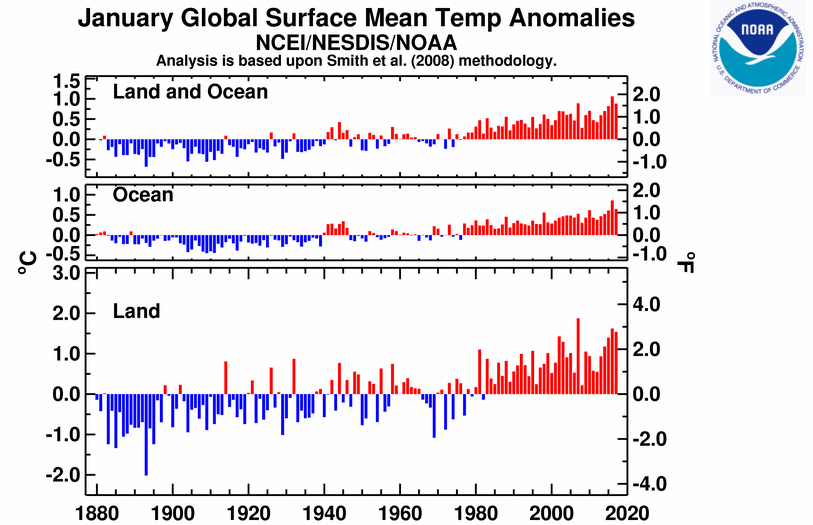
The globally averaged temperature over land and ocean surfaces for January 2017 was 0.88°C (1.58°F) above the 20th century average of 12.0°C (53.6°F). This was the third highest January temperature in the 1880–2017 record, behind 2016 (highest) and 2007 (second highest). Separately, the global land surface temperature was also third highest for the month of January at 1.54°C (2.77°F) above the 20th century average of 2.8°C (37.0°F). The first month of the year was characterized by warmer to much-warmer-than-average conditions across much of the world's land surface, with the largest positive temperature departures from average across the eastern half of the contiguous U.S., eastern Asia, and much of Canada where temperature departures were 3.0°C (5.4°F) or greater. Cooler-than-average conditions were observed across New Zealand, the western half of the contiguous U.S., central and western Australia, northern and southern parts of Africa, western and southern Asia, and much of Europe. The most notable below-average temperature departures from average were observed across the northwestern contiguous U.S. and central Europe (-3.0 °C [-5.4°F] or colder). According to NCEI's Regional analysis, three of the six continents had at least a top six warm January, with South America having its second warmest January since continental records began in 1910, behind 2016. Meanwhile, Europe had its coldest January since 2010.
Select national information is highlighted below:
- The January 2017 mean temperature for Hong Kong, China was 18.5°C (65.3°F) or 2.2°C (4.0°F) above average—the warmest January on record.
- Cold temperatures engulfed much of Europe during January 2017. Austria had one of the coldest Januarys since 1987, while the Netherlands had the coldest January since 2010.
- Above-average temperatures were present across much of eastern Australia, while the western part of Australia had cooler-than-average conditions during January 2017. Averaged as a whole, the Australian mean temperature for January was 0.77°C (1.39°F) above the 1961–1990 average and the 17th highest January temperature in the 108-year record. Regionally, New South Wales had its third warmest January, while Queensland had its sixth warmest on record. Minimum temperatures were also above average. The nation had its third highest January minimum temperature at 1.29°C (2.32°F) above average. Queensland had its second highest minimum temperature, behind 2006, while New South Wales had its fourth highest January minimum temperature on record.
- New Zealand experienced the coldest January temperature since 2014 at 16.4°C (61.5°F), which is 0.7°C (1.3°F) below the 1981–2010 average.
For the oceans, the globally-averaged temperature departure of +0.65°C (+1.17°F) from the 20th century average was the second highest on record for January, behind 2016. Much-warmer-than-average temperatures were present across most of the ocean surfaces, with near- to cooler-than-average conditions across the northern, central, and southern parts of the Pacific Ocean, central Indian Ocean and along the western coast of Australia, and the northern and southern Atlantic Ocean.
According to NOAA's Climate Prediction Center, ENSO-neutral conditions were present during January 2017 and are favored to continue through the Northern Hemisphere spring (March–May) 2017.
| January | Anomaly | Rank (out of 138 years) | Records | ||||
|---|---|---|---|---|---|---|---|
| °C | °F | Year(s) | °C | °F | |||
| Global | |||||||
| Land | +1.54 ± 0.23 | +2.77 ± 0.41 | Warmest | 3rd | 2007 | +1.88 | +3.38 |
| Coolest | 136th | 1893 | -2.01 | -3.62 | |||
| Ocean | +0.65 ± 0.15 | +1.17 ± 0.27 | Warmest | 2nd | 2016 | +0.86 | +1.55 |
| Coolest | 137th | 1909 | -0.45 | -0.81 | |||
| Land and Ocean | +0.88 ± 0.17 | +1.58 ± 0.31 | Warmest | 3rd | 2016 | +1.06 | +1.91 |
| Coolest | 136th | 1893 | -0.68 | -1.22 | |||
| Northern Hemisphere | |||||||
| Land | +1.70 ± 0.30 | +3.06 ± 0.54 | Warmest | 4th | 2007 | +2.28 | +4.10 |
| Coolest | 135th | 1893 | -2.57 | -4.63 | |||
| Ocean | +0.73 ± 0.14 | +1.31 ± 0.25 | Warmest | 2nd | 2016 | +0.95 | +1.71 |
| Coolest | 137th | 1894 | -0.47 | -0.85 | |||
| Land and Ocean | +1.09 ± 0.21 | +1.96 ± 0.38 | Warmest | 3rd | 2016 | +1.24 | +2.23 |
| Coolest | 136th | 1893 | -1.27 | -2.29 | |||
| Southern Hemisphere | |||||||
| Land | +1.12 ± 0.15 | +2.02 ± 0.27 | Warmest | 3rd | 2016 | +1.36 | +2.45 |
| Coolest | 136th | 1904 | -0.96 | -1.73 | |||
| Ocean | +0.60 ± 0.15 | +1.08 ± 0.27 | Warmest | 3rd | 2016 | +0.80 | +1.44 |
| Coolest | 136th | 1909 | -0.47 | -0.85 | |||
| Ties: 1998 | |||||||
| Land and Ocean | +0.67 ± 0.15 | +1.21 ± 0.27 | Warmest | 3rd | 2016 | +0.88 | +1.58 |
| Coolest | 136th | 1904 | -0.51 | -0.92 | |||
| Arctic | |||||||
| Land and Ocean | +2.45 ± 0.60 | +4.41 ± 1.08 | Warmest | 8th | 1981 | +4.38 | +7.88 |
| Coolest | 131st | 1893 | -3.10 | -5.58 | |||

Precipitation
The maps below represent precipitation percent of normal (left) and precipitation percentiles (right) based on the GHCN dataset of land surface stations using a base period of 1961–1990. As is typical, precipitation anomalies during January 2017 varied significantly around the world. Precipitation was especially high across much of the western half of Australia, Alaska, much of the western half of the contiguous U.S. and the Midwest, across southeastern Europe, and scattered across northern and southern South America, and Asia. It was notably dry across the eastern half of the contiguous U.S., northeastern Brazil, parts of southern South America, much of Europe, eastern Asia, and eastern Australia.
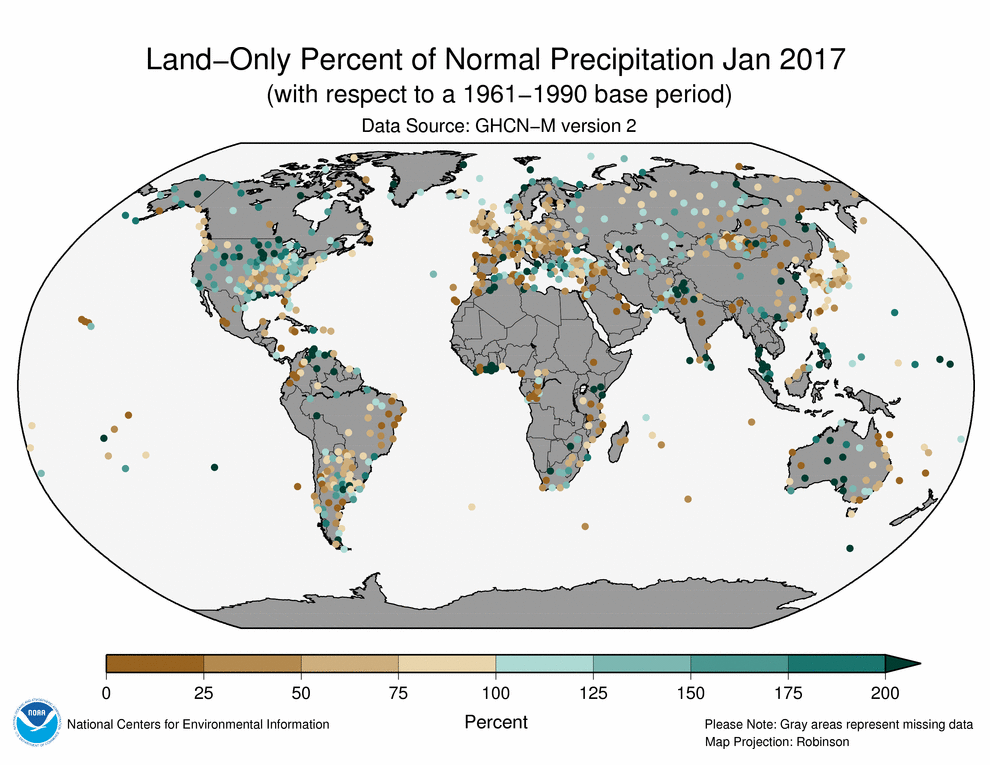

- Australia had its eighth wettest January on record at 57 percent above the 1961–1990 average. Regionally, Western Australia had its third highest January precipitation total at 129 percent above average. South Australia and Northern Territory had a top nine wet January on record.
References
- Peterson, T.C. and R.S. Vose, 1997: An Overview of the Global Historical Climatology Network Database. Bull. Amer. Meteorol. Soc., 78, 2837-2849.
- Huang, B., V.F. Banzon, E. Freeman, J. Lawrimore, W. Liu, T.C. Peterson, T.M. Smith, P.W. Thorne, S.D. Woodruff, and H-M. Zhang, 2016: Extended Reconstructed Sea Surface Temperature Version 4 (ERSST.v4). Part I: Upgrades and Intercomparisons. J. Climate, 28, 911-930.