
Global Highlights
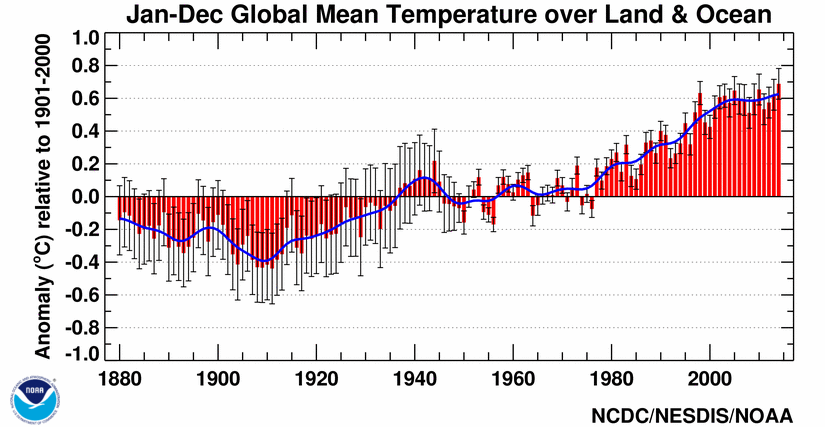
- The year 2014 was the warmest year across global land and ocean surfaces since records began in 1880. The annually-averaged temperature was 0.69°C (1.24°F) above the 20th century average of 13.9°C (57.0°F), easily breaking the previous records of 2005 and 2010 by 0.04°C (0.07°F). This also marks the 38th consecutive year (since 1977) that the yearly global temperature was above average. Including 2014, 9 of the 10 warmest years in the 135-year period of record have occurred in the 21st century. 1998 currently ranks as the fourth warmest year on record.
- The 2014 global average ocean temperature was also record high, at 0.57°C (1.03°F) above the 20th century average of 16.1°C (60.9°F), breaking the previous records of 1998 and 2003 by 0.05°C (0.09°F). Notably, ENSO-neutral conditions were present during all of 2014.
- The 2014 global average land surface temperature was 1.00°C (1.80°F) above the 20th century average of 8.5°C (47.3°F), the fourth highest annual value on record.
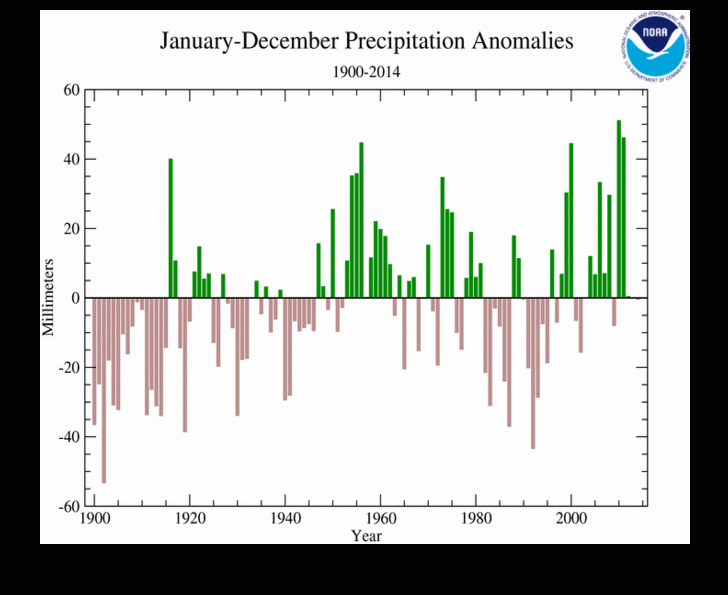
- Precipitation measured at land-based stations around the globe was near average on balance for 2014, at 0.52 mm below the long-term average. However, as is typical, precipitation varied greatly from region to region. This is the third consecutive year with near-average global precipitation at land-based stations.
Global Temperatures
A record warm December sealed the deal to make 2014 the warmest year across the world's land and ocean surfaces since recordkeeping began in 1880. The average temperature for the year was 0.69°C (1.24°F) above the 20th century average of 13.9°C (57.0°F), beating the previous record warmth of 2010 and 2005 by 0.04°C (0.07°F).
This marks the third time in the 21st century a new record high annual temperature has been set or tied and also marks the 38th consecutive year (since 1977) that the annual temperature has been above the long-term average. To date, including 2014, 9 of the 10 warmest years on record have occured during the 21st century. 1998 currently ranks as the fourth warmest year on record.
This is the first time since 1990 the high temperature record was broken in the absence of El Niño conditions at any time during the year in the central and eastern equatorial Pacific Ocean, as indicated by NOAA's CPC Oceanic Niño Index. This phenomenon generally tends to increase global temperatures around the globe, yet conditions remained neutral in this region during the entire year and the globe reached record warmth despite this.
Six months of 2014 (May, June, August, September, October, and December) were record warm, while April was second warmest, January, March, and July were fourth warmest for their respective months, and November was seventh warmest.
Overall, the global annual temperature has increased at an average rate of 0.06°C (0.11°F) per decade since 1880 and at an average rate of 0.16°C (0.28°F) per decade since 1970.
Top 10 Warmest Years (1880–2014)
The following table lists the global combined land and ocean annually-averaged temperature rank and anomaly for each of the 10 warmest years on record.
| Rank 1 = Warmest Period of Record: 1880–2014 |
Year | Anomaly °C | Anomaly °F |
|---|---|---|---|
| 1 | 2014 | 0.69 | 1.24 |
| 2 (tie) | 2010 | 0.65 | 1.17 |
| 2 (tie) | 2005 | 0.65 | 1.17 |
| 4 | 1998 | 0.63 | 1.13 |
| 5 (tie) | 2013 | 0.62 | 1.12 |
| 5 (tie) | 2003 | 0.62 | 1.12 |
| 7 | 2002 | 0.61 | 1.10 |
| 8 | 2006 | 0.60 | 1.08 |
| 9 (tie) | 2009 | 0.59 | 1.06 |
| 9 (tie) | 2007 | 0.59 | 1.06 |
Much of the record warmth for the globe can be attributed to record warmth in the global oceans. The annually-averaged temperature for ocean surfaces around the world was 0.57°C (1.03°F) higher than the 20th century average, easily breaking the previous records of 1998 and 2003 by 0.05°C (0.09°F). The first four months (January–April) each ranked among their seven warmest for their respective months and the following seven consecutive months (May–November) were record warm. The year ended with December third warmest on record for the month.
Prior to 2014, the highest monthly anomaly on record for the global oceans was 0.59°C (1.06°F) above the 20th century average, occurring in June 1998, October 2003, and July 2009. This all-time monthly record was broken in June 2014 (+0.62°C / +1.12°F), then broken again in August (+0.65°C / +1.17°F), and then broken once more in September (+0.66°C / +1.19°F)—that makes three all-time new monthly high global ocean temperature records set in a single calendar year. In fact, every month between May and November 2014 either tied or surpassed the all-time record high anomaly prior to 2014. This length of sustained record and near-record warmth has not been documented since 1997/1998 (record or near-record warm at that time), when a strong El Niño event occurred.
In 2014, the warmth was due to large regions of record warm and much warmer-than-average temperatures in parts of every major ocean basin. Record warmth for the year was particularly notable in the northeastern Pacific Ocean in and around the Gulf of Alaska, much of the western equatorial Pacific, parts of the western North Atlantic and western South Atlantic, and much of the Norwegian and Barents Seas. Nearly the entire Indian Ocean was much warmer than average with a broad swath between Madagascar and Australia record warm. Part of the Atlantic Ocean south of Greenland and the Southern Ocean waters off the southern tip of South America were much cooler than average, with one localized area near Antarctica record cold.
Temperatures were warmer than average across land surfaces as well. The global land temperature for 2014 was 1.00°C (1.80°F) above the 20th century average, the fourth highest annually-averaged value on record.
Because land surfaces generally have low heat capacity relative to oceans, temperature anomalies can vary greatly between months. In 2014, the average monthly land temperature anomaly rose from +0.31°C (+0.56°F) in February to +1.32°C (+2.38°F) in March, a difference of 1.01°C (1.94°F). These anomalies also represent the lowest and highest monthly anomalies observed during 2014. The ocean has a much higher heat capacity than land and thus anomalies tend to vary less over monthly timescales. During the year, the global monthly ocean temperature anomaly ranged from +0.46°C (+0.83°F; January, February) to +0.66°C (+1.19°F; September), a difference of 0.20°C (0.36°F).
| January–December | Anomaly | Rank (out of 135 years) | Records | ||||
|---|---|---|---|---|---|---|---|
| °C | °F | Year(s) | °C | °F | |||
| Global | |||||||
| Land | +1.00 ± 0.20 | +1.80 ± 0.36 | Warmest | 4th | 2007 | +1.08 | +1.94 |
| Coolest | 132nd | 1907 | -0.60 | -1.08 | |||
| Ocean | +0.57 ± 0.04 | +1.03 ± 0.07 | Warmest | 1st | 2014 | +0.57 | +1.03 |
| Coolest | 135th | 1909, 1910 | -0.45 | -0.81 | |||
| Land and Ocean | +0.69 ± 0.09 | +1.24 ± 0.16 | Warmest | 1st | 2014 | +0.69 | +1.24 |
| Coolest | 135th | 1911 | -0.44 | -0.79 | |||
| Northern Hemisphere | |||||||
| Land | +1.03 ± 0.25 | +1.85 ± 0.45 | Warmest | 4th | 2007 | +1.21 | +2.18 |
| Coolest | 132nd | 1884 | -0.68 | -1.22 | |||
| Ocean | +0.65 ± 0.05 | +1.17 ± 0.09 | Warmest | 1st | 2014 | +0.65 | +1.17 |
| Coolest | 135th | 1910 | -0.47 | -0.85 | |||
| Land and Ocean | +0.80 ± 0.15 | +1.44 ± 0.27 | Warmest | 1st | 2014 | +0.80 | +1.44 |
| Coolest | 135th | 1912 | -0.47 | -0.85 | |||
| Southern Hemisphere | |||||||
| Land | +0.93 ± 0.11 | +1.67 ± 0.20 | Warmest | 1st | 2005, 2014 | +0.93 | +1.67 |
| Coolest | 135th | 1917 | -0.69 | -1.24 | |||
| Ties: 2005 | |||||||
| Ocean | +0.52 ± 0.03 | +0.94 ± 0.05 | Warmest | 4th | 1998 | +0.54 | +0.97 |
| Coolest | 132nd | 1911 | -0.46 | -0.83 | |||
| Land and Ocean | +0.58 ± 0.06 | +1.04 ± 0.11 | Warmest | 2nd | 1998 | +0.59 | +1.06 |
| Coolest | 134th | 1911 | -0.47 | -0.85 | |||
| Arctic | |||||||
| Land and Ocean | +1.36 ± 0.17 | +2.45 ± 0.31 | Warmest | 4th | 2007 | +1.49 | +2.68 |
| Coolest | 132nd | 1902 | -1.28 | -2.30 | |||
The 1901-2000 average combined land and ocean annual temperature is 13.9°C (56.9°F), the annually averaged land temperature for the same period is 8.5°C (47.3°F), and the long-term annually averaged sea surface temperature is 16.1°C (60.9°F).
Supplemental Information
- Probabilities related to 2014's historical ranking
- Year-to-date temperature evolution
- Global temperature trend maps
- Various time series of annual temperature data
Regional Temperatures
The following information was compiled from previous NCDC monitoring reports and public reports by National Hydrometeorological Services (NHMSs; peers of the U.S. National Weather Service), including those submitted to inform the Provisional Status of the Climate in 2014 by the World Meteorological Organization. More comprehensive information will be available in the WMO's final Statement, to be released in Spring 2015.
Most areas of the world experienced above-average annual temperatures, as indicated by the Temperature Percentiles map below. Record warmth was observed over various regions of the world's land surfaces, including Far East Russia into western Alaska, the western United States, parts of interior South America, most of Europe stretching into northern Africa, and parts of both eastern and western coastal Australia. It was also much warmer than average across many other land areas all across the globe.
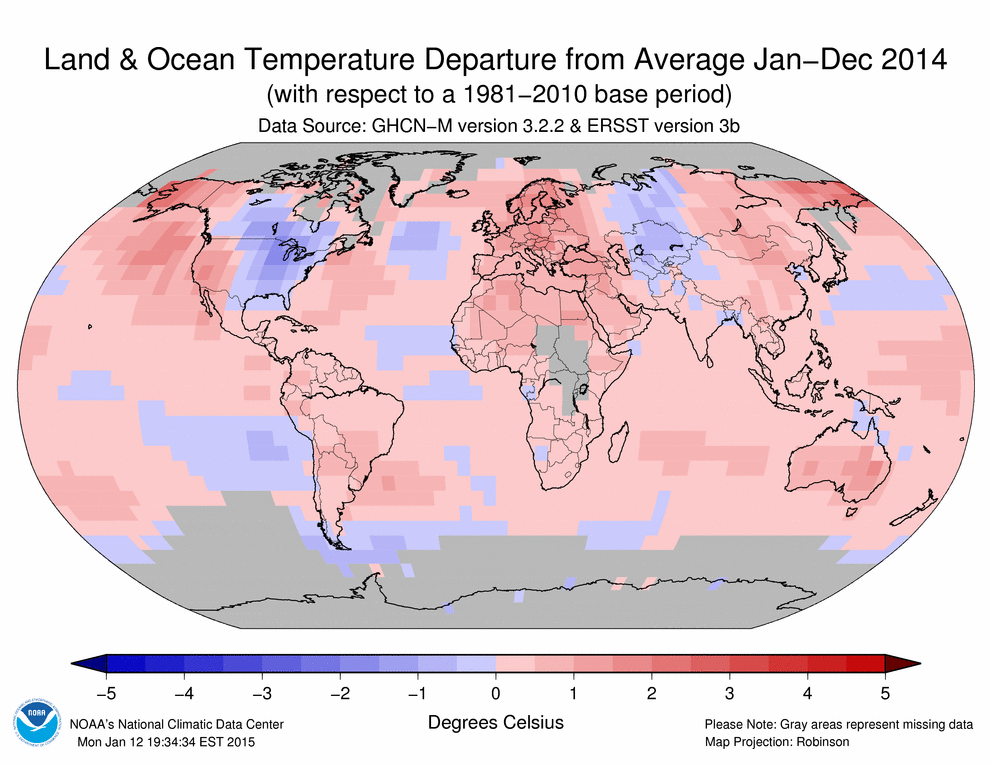

The World Meteorological Organization (WMO) reported that Europe was expected to have its warmest year in at least the past 500 years, surpassing its previous record set in 2007 by 0.3°C (0.5°F). Much of the warmth can be attributed to the second warmest winter on record, followed by a record warm spring for the continent. According to the WMO report, 19 European countries were expected to observe their hottest year on record, including Austria, Belgium, Croatia, the Czech Republic, Denmark, France, Germany, Hungary, Iceland, Italy, Luxembourg, The Netherlands, Norway, Poland, Serbia, Slovakia, Slovenia, Sweden, and the United Kingdom. Indeed, as detailed below, many countries confirmed record or near-record warmth for the year:
- 2014 was the warmest year on record for the United Kingdom since records began in 1910, according to the UK Met Office. The temperature was 1.1°C (2.0°F) higher than the 1981–2010 average, beating the previous record of 2006 by 0.2°C (0.4°F). Further, it was the warmest year on record in the Central England Temperature record, which dates to 1659. The warmth was prevalent throughout most of the year although no single month was record warm, with only August seeing a below-average monthly temperature.
- France also observed its warmest year since its national records commenced in 1900, with an annual temperature 1.2°C (2.2°F) higher than the 1981–2010 average, surpassing the previous record set just three years ago in 2011.
- In Switzerland, 2014 tied with 2011 as warmest on record since its national records began in 1864, with an anunual temperature 1.2°C (2.2°F) above the 1981–2010 average.
- Spain reported that 2014 was its second warmest year on record, just shy of the warmth in 2011, at 1.33°C (2.39°F) higher than the 1971–2000 average. Of note, this near record warmth was observed in the absence of any significant heat waves, according to AEMet.
- Germany also reported its warmest year on record, with a temperature 1.4°C (2.5°F) above the 1981–2010 average and 0.4°C (0.7°F) above the previous record warmth of 2000.
- According to ZAMG, the annually-averaged temperature for Austria was 1.8°C (3.2°F) higher than the 1981–2010 average, making 2014 the warmest year in the 247-year period of record, easily surpassing the previous record set in 1994 by 0.6°C (1.1°F). January, February, March, November, and December were each more than 2.5°C (4.5°F) warmer than their respective monthly average.
- Denmark was record warm in 2014, with the annual temperature surpassing its previous record of 2007 by a substantial 0.5°C (0.9°C). The period of record for this northern European nation dates back 140 years. This also marks the first year with an average temperature in the double digits—10.0°C. Similar to the UK, no one month was record warm, although five months did rank among their five warmest.
- 2014 was also the warmest year for Sweden, which broke its previous record set in 1934 (and tied in 1938 and 1990) by 0.15°C (0.27°F). Stockholm and Uppsala, which both have temperatures records extending back more than 250 years, broke their records by 0.2–0.3°C (0.4–0.7°F), according to SMHI.
- Finland saw its second warmest year on record, with the 2014 temperature 1.6°C (2.9°F) higher than the 1981–2010 average. Regionally, many areas were record warm.
- Regions across Iceland were also warm for the year. The north coast and east of the country observed their warmest annual temperatures since records began in the 1870s and most other areas across the country were second or third warmest on record.
- Peterson, T.C. and R.S. Vose, 1997: An Overview of the Global Historical Climatology Network Database. Bull. Amer. Meteorol. Soc., 78, 2837-2849.
- Quayle, R.G., T.C. Peterson, A.N. Basist, and C. S. Godfrey, 1999: An operational near-real-time global temperature index. Geophys. Res. Lett., 26, 333-335.
- Smith, T.M., and R.W. Reynolds (2005), A global merged land air and sea surface temperature reconstruction based on historical observations (1880-1997), J. Clim., 18, 2021-2036.
- Smith, et al (2008), Improvements to NOAA's Historical Merged Land-Ocean Surface Temperature Analysis (1880-2006), J. Climate., 21, 2283-2293.
Temperatures are rising at a faster pace in the northern latitudes of the Northern Hemisphere compared with other parts of the globe. According to NOAA's 2014 Arctic Report Card, on average the Arctic is warming at more than twice the rate compared with lower latitudes. For the period October 2013–September 2014, the temperature for the Arctic was 1.0°C (1.8°F) higher than the 1981–2010 average. The Finnish Meteorological Institute reports that the average temperature for this country in northern Europe has risen by more than 2°C (3.6°F) since 1849, or 0.14°C (0.25°F) per decade, more than twice the global average. In the past four decades, the rise has accelerated, at 0.2°C (0.36°F) per decade.
In Asia, with national information available through November 2014 and records dating back to 1961, China observed eight months of above-average temperatures, including its second warmest January to begin 2014. With records dating back to 1884, Hong Kong was record warm during both June and July. The temperature was mixed throughout the year in South Korea. The year began with above-average temperatures across the country followed by its second warmest spring in the 42-year period of record. Summer was cooler than average while fall was warmer than average, and the year ended on a cool note with December 2.0°C (3.6°F) below the 1981–2010 average, with the average maximum temperature for the month the fifth lowest on record.
The African continent was also warmer than average overall during 2014. In mid-January a heat wave in South Africa brought record high daily temperatures. Tunisia was impacted by a heatwave in September, while Morocco saw October temperatures more than 3°C (5°F) above average.
In South America, temperatures were much warmer than average across most of the continent. Argentina observed its second warmest year on record, at 0.60°C (1.1°F) above the 1961–1990 average, surpassing 2013 to take this spot in the rankings. All three of the warmest years since national records began in 1961 have occurred in the past three years (2012 record warm and 2013 now third warmest on record).
Following its warmest year on record in 2013, 2014 was the third warmest in the 105-year period of record for Australia, with a mean temperature 0.91°C (1.64°F) higher than the 1961–1990 average, according to the Bureau of Meteorology. Fall (March–May) was the third warmest on record for the country as a whole and spring (September–November) was record warm; only February was cooler than average. The annual warmth was also widespread, with every state except the Northern Territory ranking among its four warmest years on record. The most recent 10-year average (2005–2014) marks the warmest 10-year period since records began in 1910.
In contrast to all other land areas around the world, much of North America had below-average temperatures for much of the year, particularly during early 2014 due to a series of cold Arctic outbreaks and a persistent dip in the jet stream that moved warm air northward into Alaska and northern Europe and cold air southward into North America and central Russia. According to Environment Canada, it was the coldest meteorological winter (December 2013–February 2014) for the country since 1996, but with cold settling in before this official start to winter and remaining after its official end, Canada observed its coldest November–March since national records began in 1948. Record snowfall in some regions also accompanied the cold. Saskatoon had snow on the ground for six straight months, the longest period with continuous snow cover since records began there in 1955. The United States had its 33rd coolest winter in the 120-year period of record, with many states east of the Rockies having their coldest winter since the 1970s. The ice cover over the Great Lakes was the second largest since records began in 1973. On the other side of the dip in the jet stream, however, California was record warm for winter and Alaska was eighth warmest, with its records dating back to 1918. For the year, Alaska and California were both record warm along with two other western states: Nevada and Arizona.
Global Precipitation
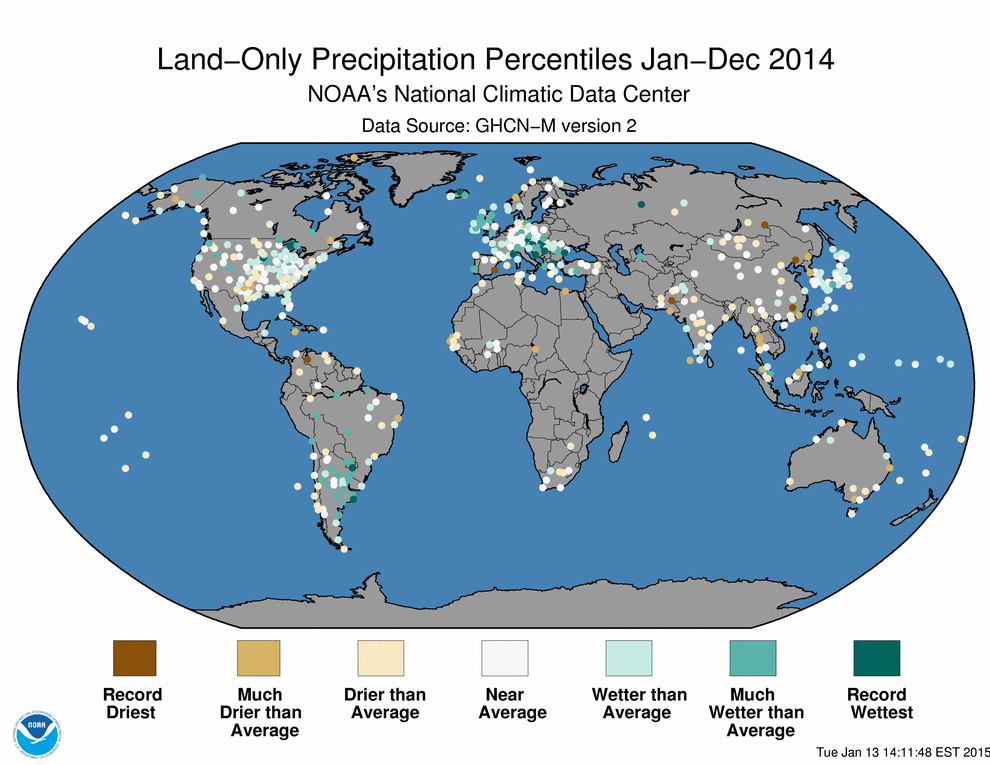
For the third consecutive year, annual precipitation was near average on balance for land-based rain gauges around the globe. Precipitation for 2014 was 0.52 mm (0.02 inch) below the 1961–1990 average of 1,033 mm (40.7 inches). As indicated by the Global Precipitation Percentiles map below, one or more stations in the northern United States, central and southeastern Europe, central Russia, and southern Paraguay were record wet for the year, while one or more stations in southeastern Russia, eastern China, southern Pakistan, southeastern Spain, and western Venezuela were record dry. Also, as discussed below, extreme precipitation and drought events occurred across the world.
At least 12 major winter storms impacted the United Kingdom from mid-December 2013 through mid-February 2014, resulting in its wettest winter on record. It was the wettest winter for both England and Wales, with their records dating back to 1766. The wetness continued and the first eight months of 2014 were the wettest such period on record for the UK. Then, in a quite abrupt shift, high pressure systems brought record dryness for the month of September, with just 20 percent of average rainfall for the month.
Following a dry winter (December–February), March was also dry in Austria. For the period October 2013–March 2014, Austria received 56 percent of average precipitation, marking the driest such period since 1953 and fifth driest since 1820. The story changed as spring progressed and some regions in northern and eastern Austria received record monthly rainfall for May. The region north of Salzburg to Mattersburg observed 230 percent of average May precipitation, the most since records began in 1820.
France had its wettest July since national records began in 1959, receiving double the 1981–2010 average and surpassing the previous record set in 2000. It was also record wet across the adjacent western half of Switzerland, according to MeteoSwiss. In Germany, July precipitation was 150 percent of the 1981–2010 average, marking the 10th wettest July in Germany's 134-year period of record.
Serbia, Bosnia-Herzegovina, Croatia, Romania, Bulgaria, and Slovakia experienced ">severe flooding in May. In June, August, and September, heavy rains again caused flooding more in Bulgaria. In September, southern parts of the Balkan Peninsula received over 250 percent of the monthly average rainfall and, in parts of Turkey, over 500 percent of normal.
In Russia, more than twice the monthly average precipitation fell in the Altai, Khakassia and Tuva republics in late May and early June, causing widespread flooding in the region.
In Japan, heavy rainfall events from July 30 to August 26 were observed throughout the country. The rains were associated with a southward shifting and meandering jet stream and with Typhoons Nakri and Halong. The monthly precipitation over the Pacific side of western Japan for August 2014 was 301 percent of normal, the highest since 1946 when records began.
The onset of the Southwest Asian Monsoon> was nearly a week late in 2014, arriving at Kerala, India on June 6, and in September the withdrawal began later than normal. From June 1 to September 30, India as a whole received 88 percent of average seasonal rainfall for the period. All regions were below average, with Northwest India experiencing the greatest precipitation deficit, receiving 79 percent of average rainfall. In early September, the northern state of Jammu and Kashmir, along with the neighboring region in Pakistan, experienced intense flooding from downpours that brought over a foot of rain. More than 400 residents perished due to the disaster.
During November 21–24, southern Morocco received heavy rainfall that caused severe flooding. The city of Guelmim received 126 mm (4.96 inches) of rain in four days. The November average is 17 mm (0.67 inch) and the annual average is 120 mm (4.72 inches).
The North-West Province of South Africa was declared to be in a state of drought disaster on September 5, 2013. The drought continued into January 2014. The agricultural drought was considered to be the worst since 1933.
Parts of eastern and central Brazil were in a state of severe drought with major water deficits extending back more than two years. The city of São Paulo was particularly affected with a severe shortage of stored water in the Cantareira reservoir that supplies more than 11 million people.
At the beginning of 2014, northeast New South Wales and southeast Queensland in Australia experienced long-term rainfall deficits. Since the end of the 2011/12 La Niña, many of the eastern parts of the country have had below-average-rainfall, and drought conditions have affected inland Queensland for the past two years.
Most of New Zealand's North Island received less than 50 percent of average rainfall during February. Many regions on New Zealand's North Island recorded their third driest March on record, as a large part of the region received less than 50 percent of their average March rainfall.
On April 29–30, torrential rain fell across the southeastern, mid-Atlantic, and northeastern United States. Pensacola, Florida, received a two-day precipitation total of 520 mm (20.47 inches). With 395 mm (15.55 inches) of the total falling on the 29th, this marked the all-time wettest calendar day in Pensacola since records began in 1880, breaking the previous record of 388 mm (15.29 inches), recorded on October 5, 1934 when an unnamed tropical storm impacted the area.
Early winter storms left nearly all of Canada and more than half (50.4 percent) of the United States covered with snow at its peak on November 17. This was the second largest November snow cover extent for Canada, falling shy of the record set just last year. On November 17–21, a major lake effect snow event occurred in the Buffalo, New York area. Up to 224 cm (88 inches) of snow fell, making it one of the Buffalo area's largest snow events in history.