Global Highlights
- The combined average temperature over global land and ocean surfaces for June 2013 tied with 2006 as the fifth highest on record, at 0.64°C (1.15°F) above the 20th century average of 15.5°C (59.9°F).
- The global land surface temperature was 1.05°C (1.89°F) above the 20th century average of 13.3°C (55.9°F), marking the third warmest June on record. For the ocean, the June global sea surface temperature was 0.48°C (0.86°F) above the 20th century average of 16.4°C (61.5°F), the 10th warmest June on record.
- The combined global land and ocean average surface temperature for the January–June period (year-to-date) was 0.59°C (1.06°F) above the 20th century average of 13.5°C (56.3°F), tying with 2003 as the seventh warmest such period on record.
Introduction
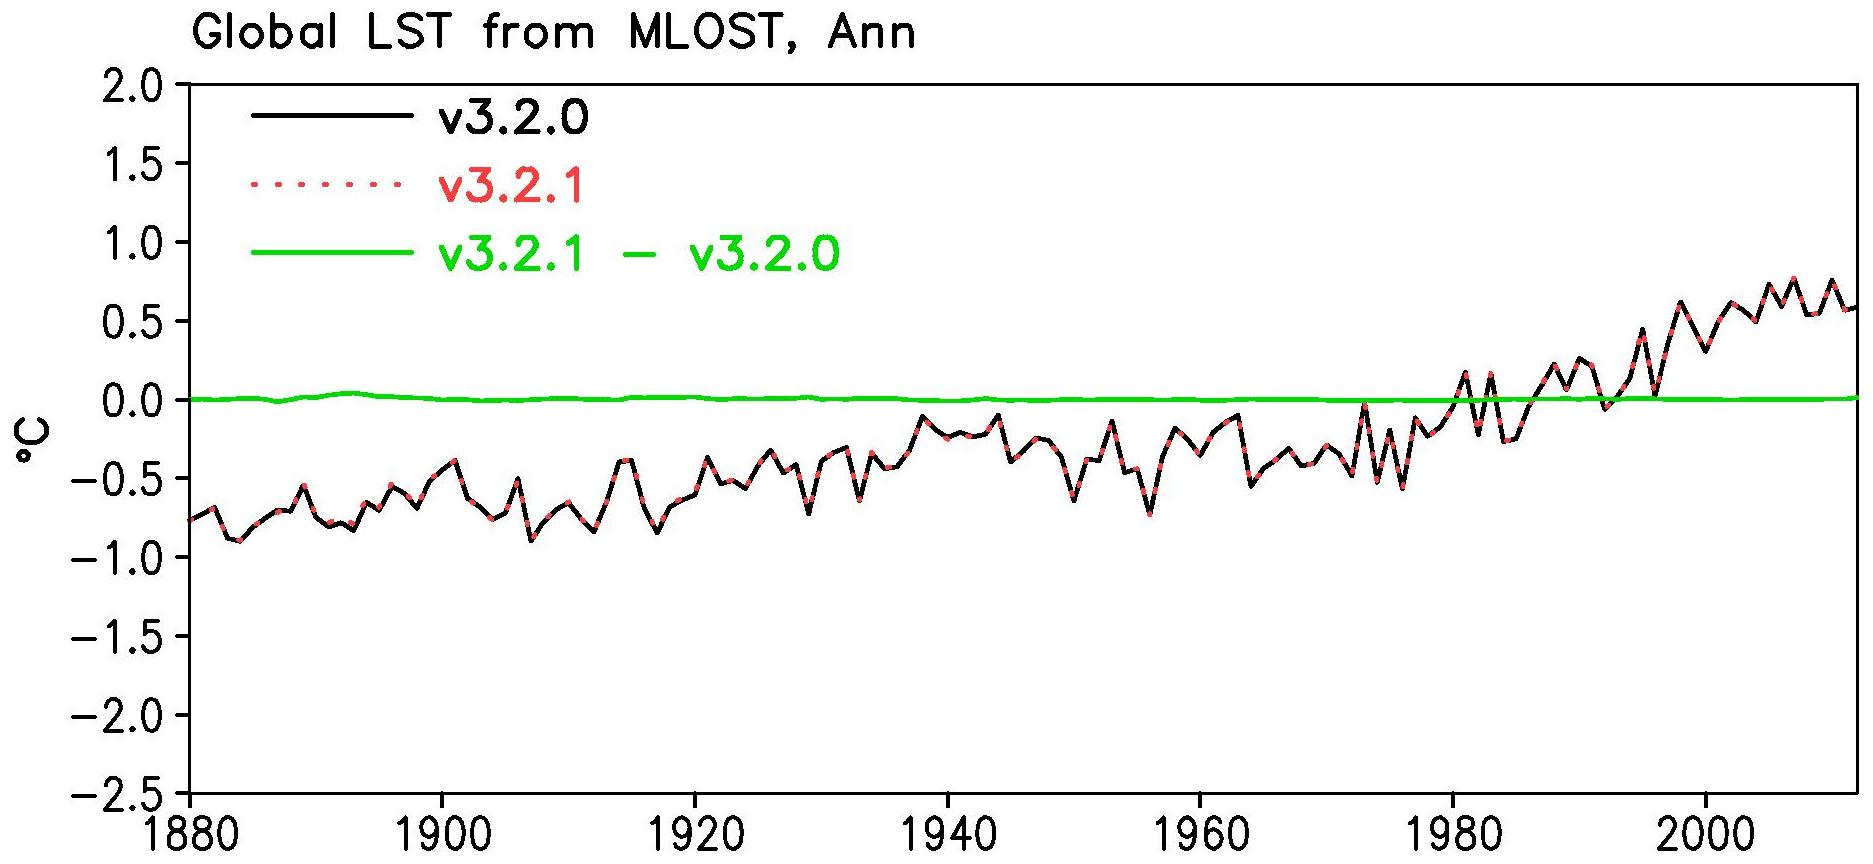
Temperature anomalies and percentiles are shown on the gridded maps below. The anomaly map on the left is a product of a merged land surface temperature (Global Historical Climatology Network, GHCN) and sea surface temperature (ERSST.v3b) anomaly analysis developed by Smith et al. (2008). Temperature anomalies for land and ocean are analyzed separately and then merged to form the global analysis. For more information, please visit NCDC's Global Surface Temperature Anomalies page. The June 2013 Global State of the Climate report introduces percentile maps that complement the information provided by the anomaly maps. These new maps on the right provide additional information by placing the temperature anomaly observed for a specific place and time period into historical perspective, showing how the most current month, season or year compares with the past.
Temperatures
In the atmosphere, 500-millibar height pressure anomalies correlate well with temperatures at the Earth's surface. The average position of the upper-level ridges of high pressure and troughs of low pressure—depicted by positive and negative 500-millibar height anomalies on the  June 2013 map—is generally reflected by areas of positive and negative temperature anomalies at the surface, respectively.
June
June 2013 tied with 2006 as the fifth warmest June across global land and ocean surfaces, at 0.64°C (1.15°F) above the 20th century average of 15.5°C (59.9°F). The warmth was distributed fairly evenly between the hemispheres, with the Northern Hemisphere observing its fifth warmest June on record and the Southern Hemisphere tying with 2002 as sixth warmest. Over land surfaces alone, the average global temperature was 1.05°C (1.89°F) above average, making this the third highest for June on record. According to the Land & Ocean Temperature Percentiles map above, monthly record warmth was observed over much of northern Canada, far northwestern Russia, southern Japan, the Philippines, part of southwestern China, and central southern Africa. It was cooler than average across part of central Asia, central India, western Europe, and far northeastern Canada. No record cold was observed over land areas during the month.
Select national information is highlighted below:- Spain observed its coolest June since 1997, with the average monthly temperature 0.3°C (0.5°F) below the 1971–2000 average. The north central region of the country had the coolest anomalies, with temperatures as much as 2°C (4°F) below average.
- The United Kingdom temperature was 0.2°C (0.4°F) below the long-term average for June; however, it was also the warmest June since 2010 according to the UK Met Office. In England, East Anglia observed its coolest June since 1995.
- Much of Croatia, was warmer than the 1961–1990 average. Scattered areas in the northwestern part of the country were "very warm" (falling within the 91st–98th percentile), according to Drzavni Hirometeoroloski Zavod.
- June was warmer than average across all of Japan, with temperatures ranging from 0.3°C to 1.4°C (0.5°F to 2.5°F) above the 1981–2010 average. According to the Japan Meteorological Agency, Hokuriku in eastern Japan and the southern island of Okinawa had temperatures that were significantly above average.
The June 2013 globally-averaged temperature across ocean surfaces was the 10th highest in the 134-year period of record, at 0.48°C (0.86°F) above the 20th century average. Record warmth was observed in parts of the Arctic Seas, the central Sea of Okhotsk, part of the equatorial western Pacific, and a region in the central southern Pacific. Much of the remainder of the western Pacific was much warmer than average, while the main development region for Atlantic hurricanes (10°N–20°N) was near average to warmer than average, helping make this area conducive for hurricane formation. Across the eastern and central equatorial Pacific Ocean, ENSO conditions remained neutral for the 15th straight month; below-average sea surface temperatures were observed in the eastern equatorial Pacific while near-average temperatures were seen across the central equatorial Pacific. According to NOAA's Climate Prediction Center, neutral conditions are favored into the Northern Hemisphere fall 2013. Images of sea surface temperature conditions are available for all weeks during 2013 from the weekly SST page.
| June | Anomaly | Rank (out of 134 years) | Records | ||||
|---|---|---|---|---|---|---|---|
| °C | °F | Year(s) | °C | °F | |||
| Global | |||||||
| Land | +1.05 ± 0.14 | +1.89 ± 0.25 | Warmest | 3rd | 2012 | +1.19 | +2.14 |
| Coolest | 132nd | 1885, 1907 | -0.64 | -1.15 | |||
| Ocean | +0.48 ± 0.04 | +0.86 ± 0.07 | Warmest | 10th | 1998 | +0.59 | +1.06 |
| Coolest | 125th | 1909, 1911 | -0.50 | -0.90 | |||
| Land and Ocean | +0.64 ± 0.08 | +1.15 ± 0.14 | Warmest | 5th | 2010 | +0.69 | +1.24 |
| Coolest | 130th | 1911 | -0.46 | -0.83 | |||
| Ties: 2006 | |||||||
| Northern Hemisphere | |||||||
| Land | +1.06 ± 0.15 | +1.91 ± 0.27 | Warmest | 5th | 2012 | +1.37 | +2.47 |
| Coolest | 130th | 1907 | -0.72 | -1.30 | |||
| Ocean | +0.53 ± 0.05 | +0.95 ± 0.09 | Warmest | 5th | 2005, 2009 | +0.62 | +1.12 |
| Coolest | 130th | 1910 | -0.53 | -0.95 | |||
| Ties: 2002 | |||||||
| Land and Ocean | +0.73 ± 0.11 | +1.31 ± 0.20 | Warmest | 5th | 2010, 2012 | +0.81 | +1.46 |
| Coolest | 130th | 1913 | -0.52 | -0.94 | |||
| Southern Hemisphere | |||||||
| Land | +1.03 ± 0.14 | +1.85 ± 0.25 | Warmest | 2nd | 2005 | +1.13 | +2.03 |
| Coolest | 133rd | 1911 | -0.91 | -1.64 | |||
| Ocean | +0.45 ± 0.05 | +0.81 ± 0.09 | Warmest | 12th | 1998 | +0.61 | +1.10 |
| Coolest | 123rd | 1911 | -0.55 | -0.99 | |||
| Ties: 2007 | |||||||
| Land and Ocean | +0.54 ± 0.06 | +0.97 ± 0.11 | Warmest | 6th | 1998 | +0.63 | +1.13 |
| Coolest | 129th | 1911 | -0.60 | -1.08 | |||
| Ties: 2002 | |||||||
| Arctic | |||||||
| Land and Ocean | +1.46 ± 0.20 | +2.63 ± 0.36 | Warmest | 2nd | 2012 | +1.52 | +2.74 |
| Coolest | 133rd | 1886 | -1.31 | -2.36 | |||


The most current data may be accessed via the Global Surface Temperature Anomalies page.
Year-to-date (January–June)

With ENSO-neutral conditions present during the first half of 2013, the January–June global temperature across land and ocean surfaces tied with 2003 as the seventh warmest such period, at 0.59°C (1.06°F) above the 20th century average. The global land temperature was the sixth highest for January–June since records began in 1880, with the Southern Hemisphere land areas fourth warmest for the period and the Northern Hemisphere land areas eighth warmest. According to the Land & Ocean Temperature Percentile map above, a region of coastal west Africa, part of Greece, northwestern Iran, much of the southern Philippines, and central and south central Australia were record warm for the period. The global ocean temperature was tied with 2007 and 2009 as the seventh highest for January–June, with the Indian Ocean south of Australia, the Black Sea, small sections of the Arctic Ocean, and part of the equatorial western Pacific having record warmth. No record cold regions over land or water were observed for the January–June period.
| January–June | Anomaly | Rank (out of 134 years) | Records | ||||
|---|---|---|---|---|---|---|---|
| °C | °F | Year(s) | °C | °F | |||
| Global | |||||||
| Land | +1.00 ± 0.21 | +1.80 ± 0.38 | Warmest | 6th | 2007 | +1.24 | +2.23 |
| Coolest | 129th | 1893 | -0.82 | -1.48 | |||
| Ocean | +0.44 ± 0.05 | +0.79 ± 0.09 | Warmest | 7th | 1998 | +0.57 | +1.03 |
| Coolest | 128th | 1911 | -0.51 | -0.92 | |||
| Ties: 2007, 2009 | |||||||
| Land and Ocean | +0.59 ± 0.10 | +1.06 ± 0.18 | Warmest | 7th | 2010 | +0.72 | +1.30 |
| Coolest | 128th | 1911 | -0.52 | -0.94 | |||
| Ties: 2003 | |||||||
| Northern Hemisphere | |||||||
| Land | +1.04 ± 0.23 | +1.87 ± 0.41 | Warmest | 8th | 2007 | +1.42 | +2.56 |
| Coolest | 127th | 1893 | -0.94 | -1.69 | |||
| Ocean | +0.44 ± 0.06 | +0.79 ± 0.11 | Warmest | 7th | 2010 | +0.55 | +0.99 |
| Coolest | 128th | 1910 | -0.48 | -0.86 | |||
| Land and Ocean | +0.67 ± 0.14 | +1.21 ± 0.25 | Warmest | 7th | 2007 | +0.82 | +1.48 |
| Coolest | 128th | 1893 | -0.58 | -1.04 | |||
| Southern Hemisphere | |||||||
| Land | +0.90 ± 0.16 | +1.62 ± 0.29 | Warmest | 4th | 2010 | +1.03 | +1.85 |
| Coolest | 131st | 1917 | -0.88 | -1.58 | |||
| Ocean | +0.44 ± 0.05 | +0.79 ± 0.09 | Warmest | 11th | 1998 | +0.61 | +1.10 |
| Coolest | 124th | 1911 | -0.53 | -0.95 | |||
| Ties: 2011 | |||||||
| Land and Ocean | +0.52 ± 0.07 | +0.94 ± 0.13 | Warmest | 7th | 1998 | +0.66 | +1.19 |
| Coolest | 128th | 1911 | -0.55 | -0.99 | |||
| Arctic | |||||||
| Land and Ocean | +0.71 ± 0.18 | +1.28 ± 0.32 | Warmest | 21st | 2011 | +1.63 | +2.93 |
| Coolest | 114th | 1966 | -1.44 | -2.59 | |||
The most current data may be accessed via the Global Surface Temperature Anomalies page.
Precipitation
The maps below represent precipitation percent of normal (left) and precipitation percentiles (right) based on the GHCN dataset of land surface stations using a base period of 1961–1990. As is typical, precipitation anomalies during June 2013 varied significantly around the world. As indicated by the June precipitation percentiles map below, the eastern United States and much of India were much wetter than average, with record rainfall across portions of India. Record precipitation was also observed in part of central North America and in eastern Europe around Moldova and the Ukraine. Record dryness was present across southeastern Algeria, eastern Niger, and parts of the Ivory Coast and Ghana in Africa, as well as part of the southwestern United States, a region of eastern Australia, and far northwestern Russia.
- Some regions in New Zealand were record wet for June. According to NIWA, eastern and northern parts of the South Island and southern and southeastern parts of the North Island had the most anomalous rainfall, two to four times higher than the monthly average in some regions.
- June was drier than average across the Republic of the Marshall Islands in the western Pacific Ocean as drought gripped the area. A state of disaster had been declared for the northern region on May 8th and was renewed on June 7th, with the atolls of Wotje and Utirik hardest hit. Please visit the June U.S. drought report for more details.
- Northern Austria was wet for June, with rainfall up to 1.5 times higher than average. Several areas, including Bregenz, Rohrbach, Laa an der Thaya, and Vienna observed record monthly precipitation. This contrasts with regions to the south of the Alps, which were dry. Preliminary data indicate that Villach likely had its driest June since local records began in 1888, according to ZAMG.
- Norway had its fourth wettest June since national records began in 1900, with average rainfall 60 percent higher than the monthly average.
- June marks the onset of the southwest Asian monsoon season. For the month, India as a whole received rainfall 27 percent above the 1951–2000 average, according to the India Meteorological Department. Northwest India received nearly double (+97 percent) its June average; flooding devastated regions in Uttarakhand. Only the region of East and Northeast India was below average (-37 percent) for the month.


References
Peterson, T.C. and R.S. Vose, 1997: An Overview of the Global Historical Climatology Network Database. Bull. Amer. Meteorol. Soc., 78, 2837-2849.
Quayle, R.G., T.C. Peterson, A.N. Basist, and C. S. Godfrey, 1999: An operational near-real-time global temperature index. Geophys. Res. Lett., 26, 333-335.
Smith, T.M. and R.W. Reynolds, 2005: A global merged land air and sea surface temperature reconstruction based on historical observations (1880-1997), J. Clim., 18, 2021-2036.
Smith et al., 2008, Improvements to NOAA's Historical Merged Land-Ocean Surface Temperature Analysis (1880-2006), J. Climate., 21, 2283-2293.