Contents of this Section:
Global Highlights
- The combined global land and ocean average surface temperature for March 2010 was the warmest on record at 13.5°C (56.3°F), which is 0.77°C (1.39°F) above the 20th century average of 12.7°C (54.9°F). This was also the 34th consecutive March with global land and ocean temperatures above the 20th century average.
- The March worldwide land surface temperature was 1.36°C (2.45°F) above the 20th century average of 5.0°C (40.8°F)—the fourth warmest on record.
- The worldwide ocean surface temperature was 0.56°C (1.01°F) above the 20th century average of 15.9°C (60.7°F) and the warmest March on record.
- For the year-to-date, the global combined land and ocean surface temperature of 13.0°C (55.3°F) was the fourth warmest January-March period. This value is 0.66°C (1.19°F) above the 20th century average.
Please Note: The data presented in this report are preliminary. Ranks and anomalies may change as more complete data are received and processed. Effective with the July 2009 State of the Climate Report, NCDC transitioned to the new version (version 3b) of the extended reconstructed sea surface temperature (ERSST) dataset. ERSST.v3b is an improved extended SST reconstruction over version 2. For more information about the differences between ERSST.v3b and ERSST.v2 and to access the most current data, please visit NCDC's Global Surface Temperature Anomalies page.
Introduction
Temperature anomalies for March 2010 are shown on the dot maps below. The dot map on the left provides a spatial representation of anomalies calculated from the Global Historical Climatology Network (GHCN) dataset of land surface stations using a 1961-1990 base period. The dot map on the right is a product of a merged land surface and sea surface temperature (SST) anomaly analysis developed by Smith et al. (2008). For the merged land surface and SST analysis, temperature anomalies with respect to the 1971-2000 average for land and ocean are analyzed separately and then merged to form the global analysis. For more information, please visit NCDC's Global Surface Temperature Anomalies page.


March 2010
The combined global land and ocean surface temperature anomaly for March 2010 was 0.77°C (1.39°F) above the 20th century average, resulting in the warmest March since records began in 1880. The previous record was set in 2002 when temperatures were 0.74°C (1.33°F) above the 20th century average. Sea surface temperatures (SST) during March 2010 were warmer than average across much of the world's oceans, with the cooler-than-average conditions across the higher-latitude southern oceans, across parts of the northern Pacific Ocean, and along the western coast of South America. Warmer-than-average conditions were most pronounced in the equatorial portions of the oceans, where the tropical ocean surface temperature (equatorward of 20 degrees latitude) also had its warmest March on record. The March 2010 worldwide SST ranked as the warmest on record, with an anomaly of 0.56°C (1.01°F) above the 20th century average—the previous record was set in 1998. El Niño weakened to moderate strength during March; however, it contributed significantly to the warmth observed in the tropical belt and the overall ocean temperature. According to NOAA's Climate Prediction Center, El Niño is expected to continue through the Northern Hemisphere spring 2010 and transition to ENSO-neutral conditions by the Northern Hemisphere summer 2010.
Did You Know?
Anomalies vs. Temperature
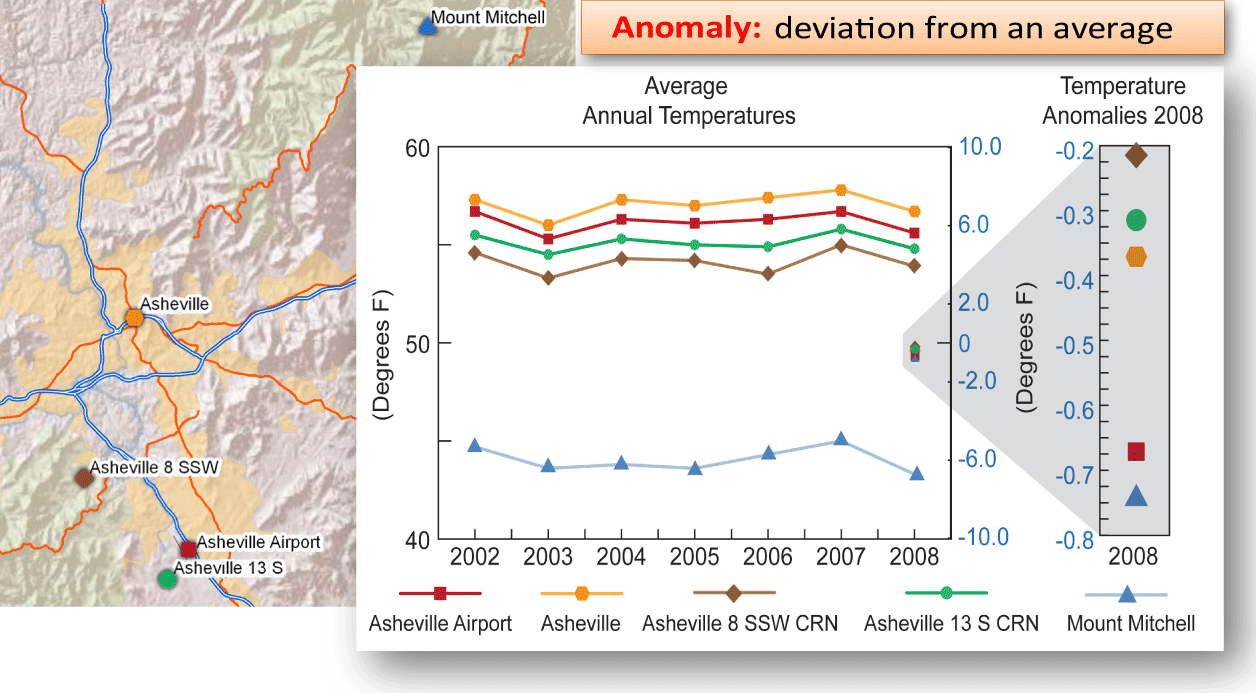
In climate change studies, temperature anomalies are more important than absolute temperature. A temperature anomaly is the difference from an average, or baseline, temperature. The baseline temperature is typically computed by averaging 30 or more years of temperature data. A positive anomaly indicates the observed temperature was warmer than the baseline, while a negative anomaly indicates the observed temperature was cooler than the baseline. When calculating an average of absolute temperatures, things like station location or elevation will have an effect on the data (ex. higher elevations tend to be cooler than lower elevations and urban areas tend to be warmer than rural areas). However, when looking at anomalies, those factors are less critical. For example, a summer month over an area may be cooler than average, both at a mountain top and in a nearby valley, but the absolute temperatures will be quite different at the two locations.
Using anomalies also helps minimize problems when stations are added, removed, or missing from the monitoring network. The above diagram shows absolute temperatures (lines) for five neighboring stations, with the 2008 anomalies as symbols. Notice how all of the anomalies fit into a tiny range when compared to the absolute temperatures. Even if one station were removed from the record, the average anomaly would not change significantly, but the overall average temperature could change significantly depending on which station dropped out of the record. For example, if the coolest station (Mt. Mitchell) were removed from the record, the average absolute temperature would become significantly warmer. However, because its anomaly is similar to the neighboring stations, the average anomaly would change much less.
The worldwide land surface temperature was the fourth warmest on record, with a temperature anomaly of 1.36°C (2.45°F) above the 20th century average. During March 2010, warmer-than-average conditions dominated the globe, with the most prominent warmth in northern Africa, the Middle East, South Asia and Canada. Cooler-than-average conditions were present across Mongolia, central and eastern Russia, northern and western Europe, Mexico, the southeastern U.S., northern Australia, and western Alaska.
Most of Canada was engulfed by abnormally warm conditions during March 2010. Mean temperature records were set or tied across Ontario, Canada, as mean temperatures were 2.5°-8.1°C above the March average, according to Environment Canada.
The March 2010 average temperature across China was 3.4°C (38.1°F), which is 0.02°C (0.04°F) above the 1971-2000 average of 3.2°C (37.8°C)—according to Beijing Climate Center (BCC). It was reported that Tibet experienced its second warmest March temperatures since historic records began in 1951 (Source: BCC).
According to the India Meteorological Department (IMD), many locations across India experienced their warmest March maximum, minimum, or mean temperatures on record. Delhi, India experienced above-average temperatures during March 2010. The average maximum and minimum temperatures for March 2010 were 34.1°C (93.4°F) and 18.6°C (65.5°F)—which is 4.1°C (7.4°F) and 3.2°C (5.8°F) above average, respectively. These were the second warmest March maximum and minimum temperatures, behind 1953 (34.3°C [93.7°F]) and 1916 (18.8 [65.8°F]), respectively. Delhi's average mean temperature during March 2010 was 26.3°C (79.3°F), the second warmest March mean temperature on record, behind 1953 (26.4°C [79.5°F]). Records in Delhi began in 1901. Please see IMD's March 2010 report for additional information.
The March 2010 average temperature for the Northern Hemisphere as a whole (land and ocean surface combined) was 0.92°C (1.66°F) above the 20th century average—the third warmest March on record, behind 2008 (warmest March) and 1990 (second warmest March). The Northern Hemisphere ocean temperature during March 2010 ranked as the warmest March on record, with an anomaly of 0.54°C (0.97°F) above the 20th century average. The previous record was set in 2004 when the Northern Hemisphere March ocean temperature was 0.49°C (0.88°F) above the 20th century average. The March 2010 Northern Hemisphere land temperature was the fourth warmest on record (1.52°C [2.74°F] above the 20th century average).
The average temperature for the Southern Hemisphere as a whole (land and ocean surface combined) was 0.64°C (1.15°F) above the 20th century average—the second warmest March on record, behind 1998. The Southern Hemisphere ocean temperature during March 2010 also represented the second warmest, with an anomaly of 0.59°C (1.06°F) above the 20th century average. The March 2010 Southern Hemisphere land temperature was 0.95°C (1.71°F) above the 20th century average—the warmest on record. The previous record was set in 1998.
Year-to-date (January-March)
The  January-March 2010 map of temperature anomalies shows that for the first three months of the year anomalous warm temperatures were present over much of the world, with the exception of cooler-than-average conditions across the higher-latitude southern oceans, the northern Pacific Ocean, and along the western South American coast, Mongolia, northern China, northern Australia, the south central and southeastern contiguous U.S., northern Mexico, and most of Europe and Russia. The combined global land and ocean surface temperature for January-March period was the fourth warmest on record. This value is 0.66°C (1.19°F) above the 20th century average. Separately, the worldwide land surface temperature ranked as the fifth warmest on record, while the worldwide ocean surface temperature ranked as the second warmest January-March on record—behind 1998.
The average position of the upper-level ridges of high pressure and troughs of low pressure (depicted by positive and negative 500-millibar height anomalies on the  March 2010 map, respectively) are generally reflected by areas of positive and negative temperature anomalies at the surface, respectively. For other Global products, please see the Climate Monitoring Global Products page.
Images of sea surface temperature conditions are available for all weeks during 2009 from the weekly SST page.
Temperature Rankings and Graphics
| March | Anomaly | Rank (out of 131 years) | (Next) Warmest on Record | ||||
|---|---|---|---|---|---|---|---|
| °C | °F | Year | °C | °F | |||
| Global | |||||||
| Land | +1.36 | +2.45 | 4th warmest | 2008 | +1.83 | +3.29 | |
| Ocean | +0.56 | +1.01 | Warmest | (1998) | +0.55 | +0.99 | |
| Land and Ocean | +0.77 | +1.39 | Warmest | (2002) | +0.74 | +1.33 | |
| Northern Hemisphere | |||||||
| Land | +1.52 | +2.74 | 4th warmest | 2008 | +2.34 | +4.21 | |
| Ocean | +0.54 | +0.97 | Warmest | (2004) | +0.49 | +0.88 | |
| Land and Ocean | +0.92 | +1.66 | 3rd warmest | 2008 | +1.07 | +1.93 | |
| Southern Hemisphere | |||||||
| Land | +0.95 | +1.71 | Warmest | (1998) | +0.92 | +1.66 | |
| Ocean | +0.59 | +1.06 | 2nd warmest | 1998 | +0.61 | +1.10 | |
| Land and Ocean | +0.64 | +1.15 | 2nd warmest | 1998 | +0.65 | +1.17 | |
*Signifies a tie


| January–March | Anomaly | Rank (out of 131 years) | (Next) Warmest on Record | ||||
|---|---|---|---|---|---|---|---|
| °C | °F | Year | °C | °F | |||
| Global | |||||||
| Land | +0.99 | +1.78 | 5th warmest | 2002 | +1.41 | +2.54 | |
| Ocean | +0.54 | +0.97 | 2nd warmest | 1998 | +0.56 | +1.01 | |
| Land and Ocean | +0.66 | +1.19 | 4th warmest | 2002 | +0.72 | +1.30 | |
| Northern Hemisphere | |||||||
| Land | +1.02 | +1.84 | 7th warmest* | 2002 | +1.80 | +3.24 | |
| Ocean | +0.52 | +0.94 | 2nd warmest | 1998 | +0.53 | +0.95 | |
| Land and Ocean | +0.72 | +1.30 | 4th warmest* | 2002 | +0.94 | +1.69 | |
| Southern Hemisphere | |||||||
| Land | +0.91 | +1.64 | Warmest | (1998) | +0.83 | +1.49 | |
| Ocean | +0.57 | +1.03 | 2nd warmest | 1998 | +0.59 | +1.06 | |
| Land and Ocean | +0.62 | +1.12 | Warmest* | (2003) | +0.56 | +1.01 | |
*Signifies a tie


The most current data may be accessed via the Global Surface Temperature Anomalies page.
Precipitation
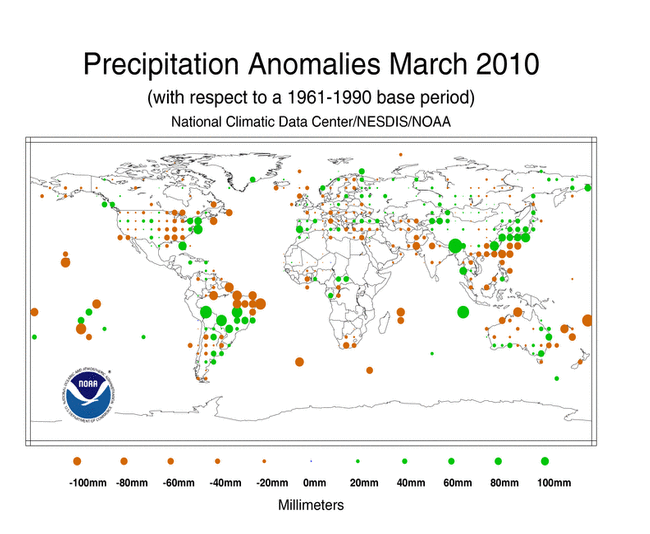
The maps below represent anomaly values based on the GHCN dataset of land surface stations using a base period of 1961-1990. Precipitation anomalies on a month-to-month basis are often highly variable across the globe and even within regions. The areas with the wettest anomalies during March 2010 included the southern half of Brazil, the northeastern contiguous U.S., and parts of eastern Asia. The driest anomalies during March 2010 were present across the northern half of Brazil, the Hawaiian Islands, the southern Pacific Islands, and parts of Southeast Asia.

According to Beijing Climate Center (BCC), the monthly averaged precipitation in China was 32.3 mm (1.3 inches) during March 2010, just 4.2 mm (0.2 inch) above the 1971-2000 average. Moderate to severe drought continued to affect the provinces of Yunnan, Guizhou, Guangxi, and southern parts of Sichuan during March 2010 . During March 22nd-31st, much needed precipitation (10-50 mm [0.4-2.0 inches]) fell over parts of the drought-stricken areas—mitigating, to some extent, the severe drought. It was also reported that on a provincial level, Xinjiang had its wettest March since records began in 1951 and Jilin and Shanghai had their second wettest March on record. While, Guangxi and Hainan experienced their driest March on record.
During March 2010 Jiangsu, Anhiu, Jiangxi, and Zhejiang had a total of 182.1 mm (7.2 inches) of precipitation. This amount was 40 percent above the 1971-2000 average, ranking as the fifth wettest March for these provinces since records began. Jiangxi and Zhejiang were drenched by heavy rain at the beginning of the month, resulting in rare Northern Hemisphere spring floods. The floods were reported to have caused 1.6 billion yuan (234 million U.S. dollars) in direct economic losses and claimed the lives of four people, according to BCC.
March 2010 was characterized as an extremely dry month for northern and eastern parts of New Zealand's North Island, south Canterbury and Otago. According to New Zealand's National Institute of Water and Atmospheric Research (NIWA), severe soil moisture deficits continued to affect Northland, Auckland, south Canterbury, and Otago regions during the month. Following a record dry February, March 2010 ranked as the driest March on record for the Auckland region. Several cities cross New Zealand experienced a record dry or near record dry month. In contrast, the city of Wellington had its wettest March on record. NIWA reported that a total of 169 mm (6.7 inches) of rain fell in Southwest Cape on March 30th-31st, setting a new March and all-time highest 24-hour rainfall at this location since records began in 1991. Wanganui, a city north of Wellington, also received its highest March 24-hour rainfall total of 27 mm (1.1 inches) since records began in 1987.
Australia as a whole experienced near average rainfall during March 2010 (nine percent below average). However, southern Queensland, inland New South Wales, and Victoria had wetter-than-normal conditions during the month. Victoria and the Murray-Darling Basin had their wettest March since 1989, according to Australia's Bureau of Meteorology.
According to the International Federation of Red Cross and Red Crescent Societies (IFRC), unusual snowfall during winter 2009/2010 and an increase in temperature from -10°C (14°F) to 10°C (50°F) led to rapid snow melt, causing floods during March 22nd-26th in four municipal districts in the Volgograd region of the Russian Federation. Nearly 1,100 homes were flooded, forcing the evacuation of 3,250 people.
Additional details on flooding and drought can also be found on the March 2010 Global Hazards page.
References
Peterson, T.C. and R.S. Vose, 1997: An Overview of the Global Historical Climatology Network Database. Bull. Amer. Meteorol. Soc., 78, 2837-2849.
Quayle, R.G., T.C. Peterson, A.N. Basist, and C. S. Godfrey, 1999: An operational near-real-time global temperature index. Geophys. Res. Lett., 26, 333-335.
Smith, T.M., and R.W. Reynolds (2005), A global merged land air and sea surface temperature reconstruction based on historical observations (1880-1997), J. Clim., 18, 2021-2036.
Smith, et al (2008), Improvements to NOAA's Historical Merged Land-Ocean Surface Temperature Analysis (1880-2006), J. Climate., 21, 2283-2293.