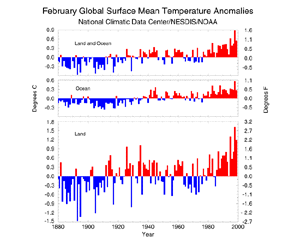
In many areas around the globe, temperature anomalies in February 1999 followed the trend set in January. Unusually warm conditions continued over southeast China, northern Indochina, and portions of southern Australia, New Zealand, northeast Africa, and the Middle East. Most of South America also experienced warmer than normal conditions in February. In contrast, the largest cold anomalies were observed over portions of Europe, northwestern Africa, southern India and northwest Australia, where temperatures averaged 2-4 degrees C below normal.
Temperature
Mean monthly temperature anomalies for February (using a base period 1880-1998) are shown in the figure above. The mean monthly land temperature anomaly for February 1999, 1.18 degrees C, was well above the 1880-1998 average temperature. However, this was over 0.4 degrees C below last year's February mean global land temperature. The ocean temperature anomaly for February 1999, 0.28 degrees C, exhibits a similar drop from the 1998 value, which correspondes to the shift from warm to cold water in the east equatorial Pacific Ocean. The combined land and sea surface temperature anomaly for February 1999, 0.55 degrees C, shown in the top time series, remained well above the mean value, but it exhibits a considerable drop from the February 1998 value.
Large negative anomalies (<-5 C) were recorded in Alaska, while small negative anomalies were scattered throughout parts of Europe. Below average temperatures were also widespread along the southeastern and northwestern coasts of Australia as well as southwestern areas of Africa.
This figure shows the spatial distribution of land surface temperature anomalies in February 1999. Most areas of world experienced temperatures above their long term means (1880-1998). Much above average temperatures (>5 C) were widespread throughout the central US as well as parts of Canada and Russia. Temperatures in the central United States were 5.4 C above average in February. This was the second warmest mean temperature anomaly for this area of the US, second only to the 6.5 C anomaly which occurred in 1954.
larger image
Precipitation
Rainfall in mid and high latitude areas of the Northern Hemisphere averaged near normal. Areas in the 85N-55N latitude band averaged 3.71 mm (0.15 in) above the long term mean. This was a decrease of over 4 mm from last February's average value, and well below the highest average of 20.09 mm which occurred in 1997. Precipitation in the mid-latitude band (55N-30N) was 3.43 mm (0.14 in) below the long-term mean and over 10 mm below last year's average. The greatest negative anomaly for February precipitation in this latitude band was in 1995 at nearly -9.5 mm below the long-term mean.
larger image
Further south in the 30N to 10N latitude band, the precipitation anomaly was -6.7 mm versus 7.3 mm recorded in February 1998. The record negative anomaly for February precipitation in this latitude band was -18.9 mm (0.74 inches) in 1902.
Precipitation patterns that occurred in January 1999 were also predominant in the month of February. Above normal sea surface temperatures in the southwest Pacific continued to enhance precipitation throughout the southwest Pacific Islands.
larger image February precipitation was 153 mm (6.0 inches) above the long term mean for this area. This was 298 mm (11.7 inches) more than fell during February 1998 when precipitation was limited due to the effects of El Niño. Further to the north, precipitation was below average across Japan, Korea and eastern areas of China as a ridge of high pressure continued to restrict the flow of moisture to these regions. There was also below average precipitation throughout the eastern two thirds of the United States.
Precipitation was more than 3 inches below average in many areas of the southeastern US. This was in sharp contrast to areas of the northwestern US that were much wetter than normal. Precipitation in the state of Washington was 100 mm (4.0 in) above average in February. Above average precipitation was also widespread throughout Europe. The precipitation was in the form of snow in the mountains of Italy and Switzerland and contributed to numerous avalanches that resulted in substantial destruction of property and loss of life. For more information, see Extreme Events
Global Surface Wetness
larger image Surface wetness was above normal in February in some portions of central U.S., equatorial Africa, central India, and western Europe. In contrast to these few locations, there were many larger areas with below normal wetness. Many sections of southern Africa and eastern Australia were much drier than normal. There were also extensive areas of dry conditions in eastern China and portions of central U.S. The persistence of unmelting snow cover in eastern Europe resulted in less surface wetness in that area than is normal for February.
 NOAA's National Centers for Environmental Information


