Temperature
In January 2024, the NOAA Global Surface Temperature (NOAAGlobalTemp) dataset version 6.0.0 replaced version 5.1.0. This new version incorporates an artificial neural network (ANN) method to improve the spatial interporlation of monthly land surface air temperatures. The period of record (1850-present) and complete global coverage remain the same as in the previous version of NOAAGlobalTemp. While anomalies and ranks might differ slightly from what was reported previously, the main conclusions regarding global climate change are very similar to the previous version. Please see our Commonly Asked Questions Document and web story for additional information.
NOAA's National Centers for Environmental Information calculates the global temperature anomaly every month based on preliminary data generated from authoritative datasets of temperature observations from around the globe. The major dataset, NOAAGlobalTemp version 6.0.0, updated in 2024, uses comprehensive data collections of increased global area coverage over both land and ocean surfaces. NOAAGlobalTempv6.0.0 is a reconstructed dataset, meaning that the entire period of record is recalculated each month with new data. Based on those new calculations, the new historical data can bring about updates to previously reported values. These factors, together, mean that calculations from the past may be superseded by the most recent data and can affect the numbers reported in the monthly climate reports. The most current reconstruction analysis is always considered the most representative and precise of the climate system, and it is publicly available through Climate at a Glance.
March 2024
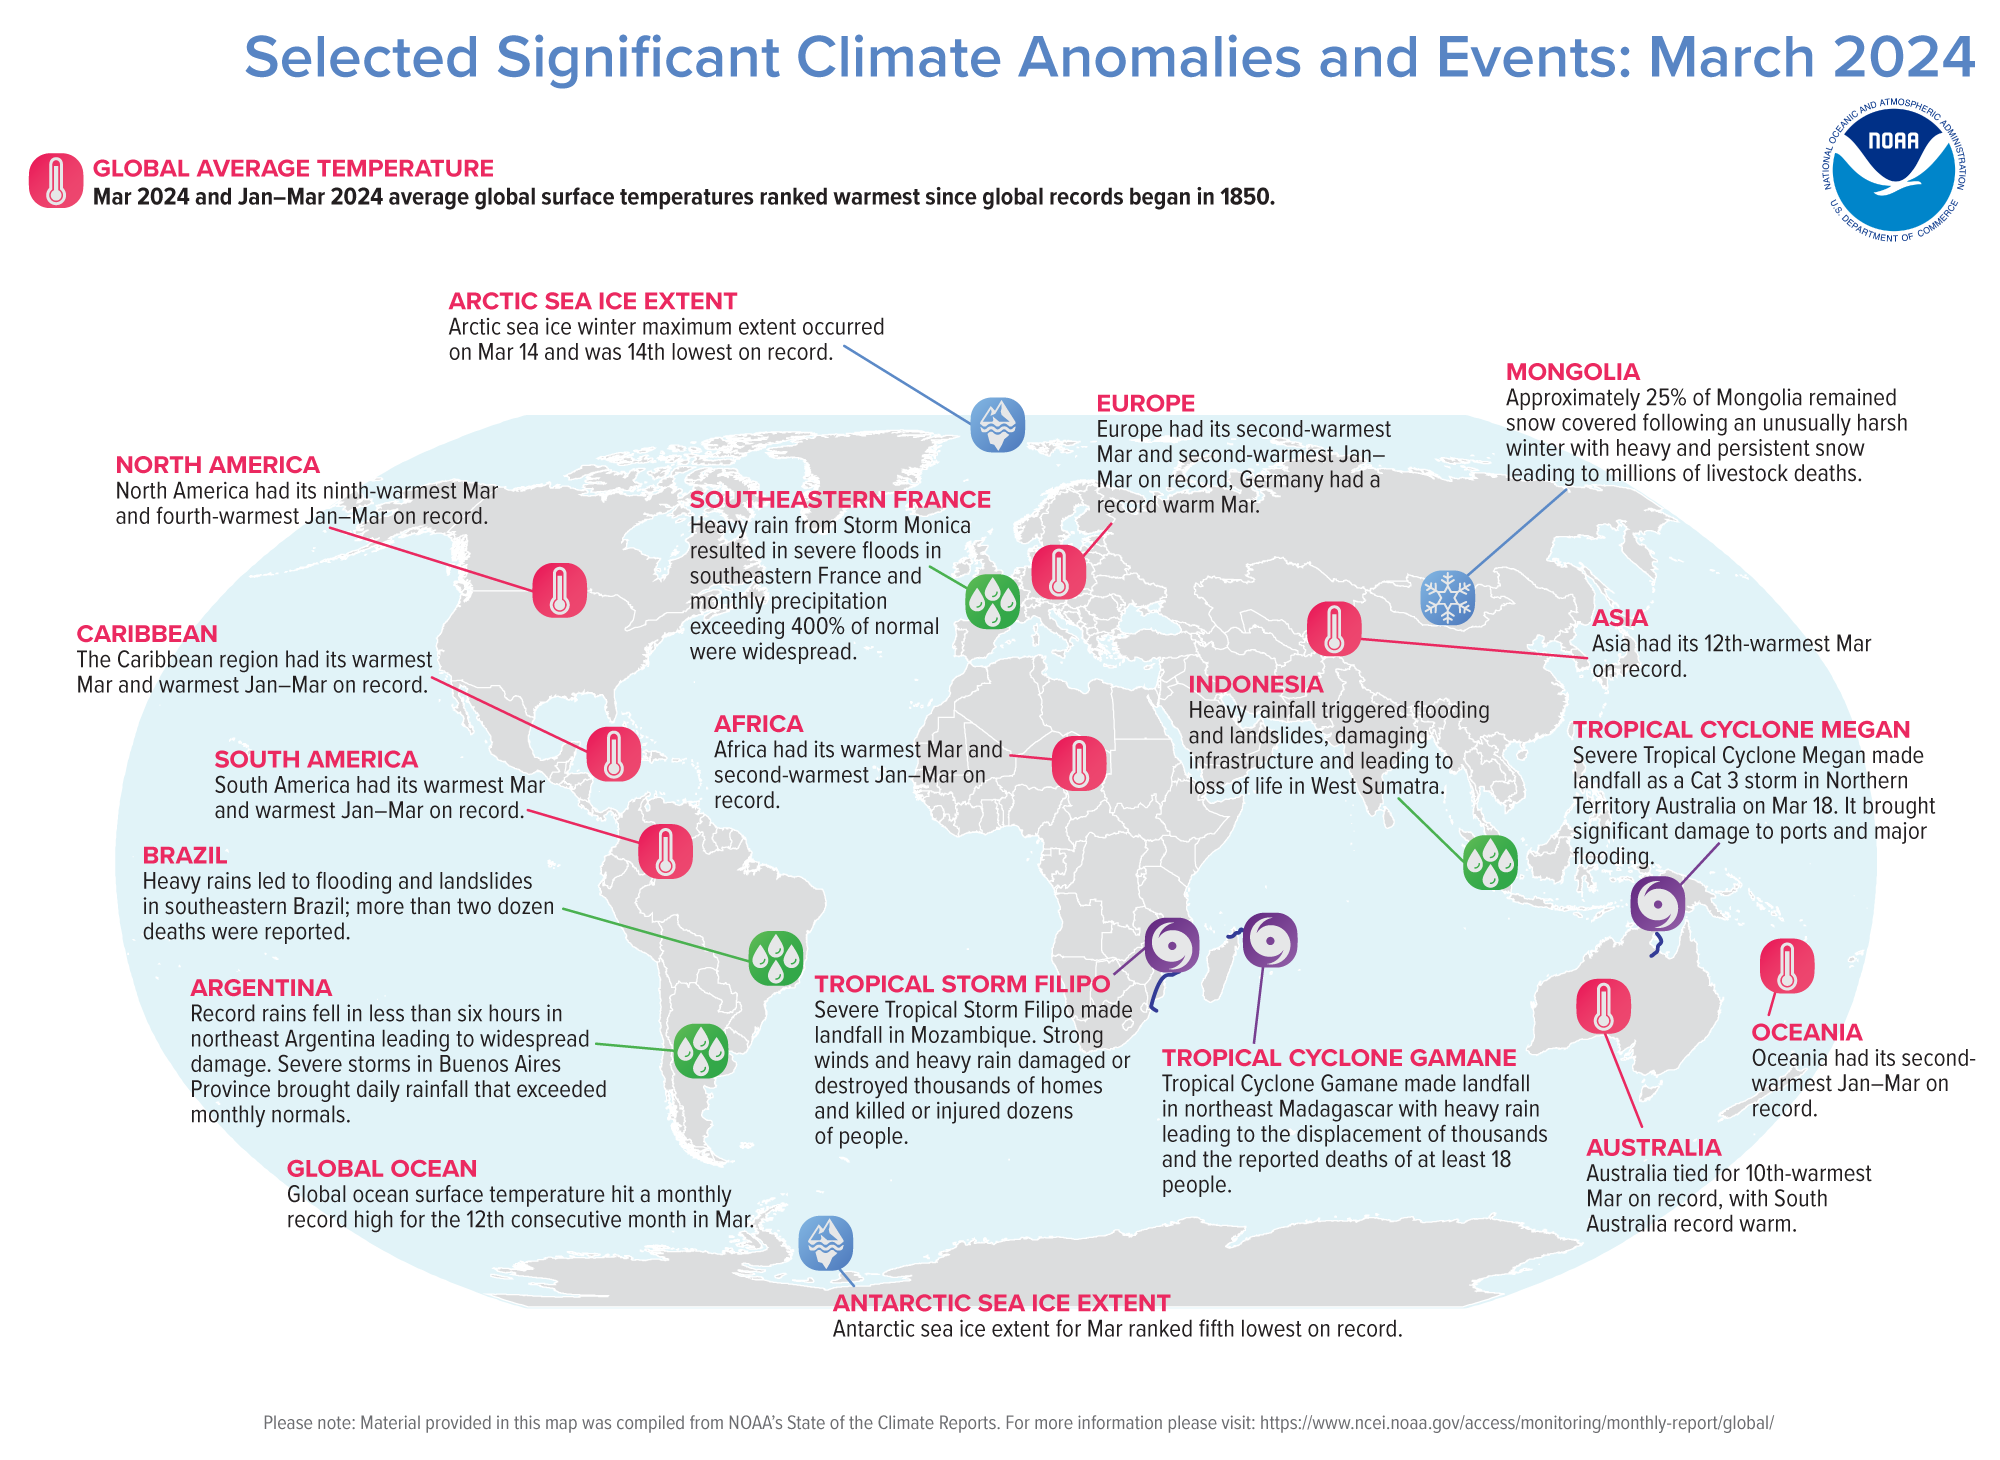
March 2024 was the warmest March on record for the globe in NOAA's 175-year record. The March global surface temperature was 1.35°C (2.43°F) above the 20th-century average of 12.7°C (54.9°F). This is 0.01°C ( °F) warmer than the previous March record set in 2016, and the tenth consecutive month of record-high global temperatures. March 2024 marked the 48th consecutive March with global temperatures, at least nominally, above the 20th-century average.
Global land-only March temperatures ranked fourth-warmest on record at 2.09°C (3.76°F) above average. Ocean-only temperatures ranked warmest on record for March at 1.01°C (1.82°F) above average. This is 0.18°C (0.32°F) warmer than the second warmest March of 2016, and the 12th-consecutive monthly record high. These temperatures occurred as the current El Niño episode nears its end. El Niño conditions that emerged in June 2023 weakened further in March, and according to NOAA's Climate Prediction Center, a transition from El Niño to ENSO–neutral is likely by April-June 2024 (85% chance), with odds of La Niña developing by June–August 2024 (60% chance).
Temperatures were much-above average to record warm throughout much of South America, Africa and western and central Europe. Temperatures were also much warmer-than-average across large parts of the northeastern quadrant of the U.S. and eastern Canada (where monthly anomalies exceeded +3.0°C in many areas). Much warmer-than-average tempertures also occurred in parts of Southwest Asia, central and eastern China, much of the eastern half of Australia, parts of far eastern Russia as well as large parts of West Antarctica. As was the case in February, sea surface temperatures were again above average across much of the northern, western, and equatorial Pacific Ocean. Record-warm March temperatures covered much of the tropical Atlantic Ocean as well as parts of the southern Atlantic and northwestern Indian Ocean. Record warm temperatures covered 10.8% of the world's surface this month.
March temperatures were cooler than the 1991–2020 average across much of the western U.S., south-central Canada, northern Iceland and surrounding waters of the North Atlantic, and northwestern parts of Siberia. Temperatures also were below-average in large parts of western Australia and East Antarctica, and slightly cooler-than-average temperatures stretched from Afghanistan to northeastern parts of India. Sea surface temperatures were below average in the southeastern Pacific and parts of the Southern Ocean. There were no areas of record cold temperatures in March.
In the Northern Hemisphere, March 2024 ranked second warmest on record at 1.68°C (3.02°F) above average, cooler than the March 2016 record of 1.82°C (3.28°F). The Northern Hemisphere land temperature was seventh warmest while the ocean temperature ranked warmest on record for the month. The Southern Hemisphere experienced its warmest March on record at 1.01°C (1.82°F) above average. Both the Southern Hemisphere land temperature and ocean temperature also ranked warmest on record for March.


A smoothed map of blended land and sea surface temperature anomalies is also available.
South America and Africa each had their warmest March while Europe had its 2nd-warmest March on record.
- Much of Central Africa was record warm in March. In South Sudan, widespread daily high temperatures exceeding 38°C persisted across the country, and a two-week nationwide school closure took place due to extremely high forecasted temperatures.
- In Germany March 2024 was the warmest March since records began in 1881, 2.8°C warmer than the 1991–2020 average. It was the second month in a row to set a new monthly record for Germany.
- The lowlands of Austria had a March that was warmest on record in the 258-year history of measurements at 3.4°C above the 1991–2020 average. This followed a February that also was the warmest on record for the lowlands. The persistently warm temperatures led to the earliest apricot blossom date since these records began in 1946, three weeks earlier than average for the 1991–2020 climate period. The mountains of Austria had their 9th warmest March in the 174-year series of mountain measurements, 2.4°C above average.
- March 2024 in France was the sixth warmest such month on record, tied with 2001 and 1981, 1.6°C warmer than the 1991–2020 average.
- Temperatures across the United Kingdom for March were 1.0°C above average based on provisional data. England provisionally recorded its seventh-warmest March on record in a series from 1884.
- In Croatia mean temperatures were in the top ten percentile or higher across the country in March.
- Italy had its sixth-warmest March in a record that began in 1800. The country as a whole was 1.42°C above the 1991–2020 average. Northern Italy was 9th warmest, Central Italy 2nd warmest, and Southern Italy 4th warmest on record
- In Iceland, in contrast to March 2023 which was the coldest such month since 1979, March 2024, was warmer than average in the South, where Reykjavik was 0.5°C above the 1991–2020 average, and generally cooler than average in the North where Akureyri was 0.3°C below average.
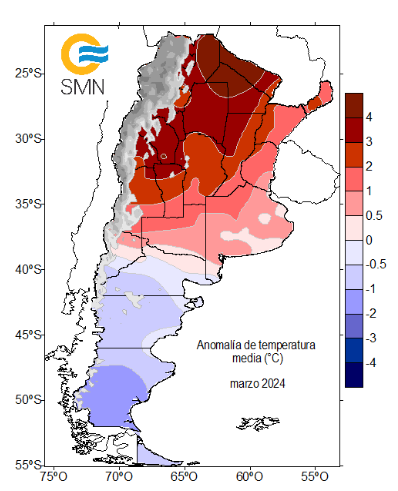
- In Argentina March temperatures were generally below average in the southern half of the country and warmer than average in northern areas. Monthly anomalies exceeding +3°C above the 1991–2020 average were widespread in provinces that included Formosa, Chaco, Santiago del Estero, and parts of Salta, Santa Fe, Tucuman, Catamarca, La Rioja, and San Luis.
Asia had its 12th-warmest March and Oceania its 17th warmest March on record.
- The March 2024 national mean monthly temperature for Pakistan was near average, 0.08°C below the country average of 18.86°C. The hottest day of the month in Pakistan occurred at Shaheed Benazirabad (Sindh), when the high temperature reached 42.5°C (108.5°F) on March 26.
- According to the Hong Kong Observatory, the mean temperature in March 2024 for Hong Kong ranked eighth warmest on record at 1.6°C above the 1991–2020 average.
- Australia recorded a national area-average mean temperature that was 1.11°C above the 1961–1990 average, tied for the 10th-warmest March on record.
North America had its ninth warmest March at 2.08°C (3.74°F) above average.
- The average temperature of the contiguous U.S. in March 2024 was 45.1°F, which is 3.6°F above the 1901-2000 average, ranking it the 17th warmest on record.
- The Caribbean region had its warmest March on record, 1.41°C (2.54°F) above the 1910-2000 average. This is 0.41°C (0.74°F) above the second warmest March of 2016.
| March | Anomaly | Rank (out of 175 years) | Records | ||||
|---|---|---|---|---|---|---|---|
| °C | °F | Year(s) | °C | °F | |||
| Global | |||||||
| Land | +2.09 | +3.76 | Warmest | 4th | 2016 | +2.46 | +4.43 |
| Coolest | 172nd | 1886 | -1.12 | -2.02 | |||
| Ocean | +1.01 | +1.82 | Warmest | 1st | 2024 | +1.01 | +1.82 |
| Coolest | 175th | 1904 | -0.50 | -0.90 | |||
| Land and Ocean | +1.35 | +2.43 | Warmest | 1st | 2024 | +1.35 | +2.43 |
| Coolest | 175th | 1917 | -0.66 | -1.19 | |||
| Northern Hemisphere | |||||||
| Land | +2.39 | +4.30 | Warmest | 7th | 2016 | +3.12 | +5.62 |
| Coolest | 169th | 1912 | -1.54 | -2.77 | |||
| Ocean | +1.14 | +2.05 | Warmest | 1st | 2024 | +1.14 | +2.05 |
| Coolest | 175th | 1910 | -0.55 | -0.99 | |||
| Land and Ocean | +1.68 | +3.02 | Warmest | 2nd | 2016 | +1.82 | +3.28 |
| Coolest | 174th | 1917 | -0.79 | -1.42 | |||
| Southern Hemisphere | |||||||
| Land | +1.41 | +2.54 | Warmest | 1st | 2024 | +1.41 | +2.54 |
| Coolest | 175th | 1885 | -1.22 | -2.20 | |||
| Ocean | +0.92 | +1.66 | Warmest | 1st | 2024 | +0.92 | +1.66 |
| Coolest | 175th | 1911 | -0.51 | -0.92 | |||
| Land and Ocean | +1.01 | +1.82 | Warmest | 1st | 2024 | +1.01 | +1.82 |
| Coolest | 175th | 1911 | -0.54 | -0.97 | |||
| Antarctic | |||||||
| Land and Ocean | +0.24 | +0.43 | Warmest | 38th | 1966 | +1.18 | +2.12 |
| Coolest | 138th | 1960 | -1.25 | -2.25 | |||
| Ties: 1889, 1899 | |||||||
| Arctic | |||||||
| Land and Ocean | +2.42 | +4.36 | Warmest | 11th | 2019 | +4.33 | +7.79 |
| Coolest | 165th | 1902 | -2.92 | -5.26 | |||
500 mb maps
In the atmosphere, 500-millibar height pressure anomalies correlate well with temperatures at the Earth's surface. The average position of the upper-level ridges of high pressure and troughs of low pressure—depicted by positive and negative 500-millibar height anomalies on the map—is generally reflected by areas of positive and negative temperature anomalies at the surface, respectively.

Year-to-date Temperature: January–March 2024
The January–March global surface temperature ranked warmest in the 175-year record at 1.35°C (2.43°F) above the 1901-2000 average of 12.3°C (54.1°F). According to NCEI's statistical analysis, there is a 55% chance that 2024 will rank as the warmest year on record and a 99% chance that it will rank in the top five.
January to March was characterized by widespread much-warmer-than-average and record warm conditions across almost all of South America. Large parts of southern and western Europe also were record warm for the three-month period, and record warm temperatures were widespread in Southwest Asia and many parts of Africa. Much-warmer-than-average temperatures stretched from areas of the central U.S. to eastern Canada and also covered most of the Arctic. Temperatures were much warmer-than-average across most of China, Southeast Asia, and southern Australia. Cooler-than-average temperatures were widespread in Antarctica. Temperatures below the 1991—2020 average also were notable in areas of northern Iceland stretching into east-central Greenland, parts of western North America, much of northern India and Nepal, and small parts of southwestern Russia, eastern Russia, and far eastern Mongolia.
Sea surface temperatures were much warmer-than-average across much of the northern and equatorial Pacific as well as the southwest Pacific. Record-warm sea surface temperatures stretched from the Caribbean Sea across the tropical Atlantic and to the northeastern Atlantic. Record warm temperatures also affected large parts of the Indian Ocean, southern Atlantic and parts of the southwestern Pacific Ocean. The most widespread areas of cooler-than-average sea surface temperatures occurred in the southeastern Pacific, southwestern Indian Ocean and parts of the Southern Ocean.


A smoothed map of blended land and sea surface temperature anomalies is also available.
South America had its warmest January–March year-to-date period, Europe and Africa each their second-warmest, and North America its fourth-warmest. Oceania had its second-warmest January–March period and Asia its 11th warmest. Overall, the Northern Hemisphere had its second-warmest year-to-date, while the Southern Hemisphere had its warmest such period on record.
- The average temperature of the contiguous U.S. for the January-March 2024 period was 39.4°F, which is 4.2°F above the 1901-2000 average, ranking as the fifth warmest on record.
- The Caribbean region had its warmest January-March on record, 1.23°C (2.21°F) above the 1910-2000 average.
- In Spain, preliminary reports indicate the January-March period was likely the warmest since 1961.
| January–March | Anomaly | Rank (out of 175 years) | Records | ||||
|---|---|---|---|---|---|---|---|
| °C | °F | Year(s) | °C | °F | |||
| Global | |||||||
| Land | +2.08 | +3.74 | Warmest | 2nd | 2016 | +2.32 | +4.18 |
| Coolest | 174th | 1893 | -1.04 | -1.87 | |||
| Ocean | +1.03 | +1.85 | Warmest | 1st | 2024 | +1.03 | +1.85 |
| Coolest | 175th | 1917 | -0.50 | -0.90 | |||
| Land and Ocean | +1.35 | +2.43 | Warmest | 1st | 2024 | +1.35 | +2.43 |
| Coolest | 175th | 1917 | -0.60 | -1.08 | |||
| Northern Hemisphere | |||||||
| Land | +2.52 | +4.54 | Warmest | 3rd | 2016 | +2.93 | +5.27 |
| Coolest | 173rd | 1893 | -1.32 | -2.38 | |||
| Ocean | +1.19 | +2.14 | Warmest | 1st | 2024 | +1.19 | +2.14 |
| Coolest | 175th | 1917 | -0.52 | -0.94 | |||
| Land and Ocean | +1.76 | +3.17 | Warmest | 2nd | 2016 | +1.77 | +3.19 |
| Coolest | 174th | 1893 | -0.77 | -1.39 | |||
| Southern Hemisphere | |||||||
| Land | +1.08 | +1.94 | Warmest | 1st | 2024 | +1.08 | +1.94 |
| Coolest | 175th | 1918 | -0.83 | -1.49 | |||
| Ocean | +0.92 | +1.66 | Warmest | 1st | 2024 | +0.92 | +1.66 |
| Coolest | 175th | 1911, 1917 | -0.49 | -0.88 | |||
| Land and Ocean | +0.95 | +1.71 | Warmest | 1st | 2024 | +0.95 | +1.71 |
| Coolest | 175th | 1917 | -0.52 | -0.94 | |||
| Antarctic | |||||||
| Land and Ocean | -0.14 | -0.25 | Warmest | 120th | 1980, 1986 | +0.67 | +1.21 |
| Coolest | 56th | 1960 | -0.70 | -1.26 | |||
| Ties: 1856, 1886 | |||||||
| Arctic | |||||||
| Land and Ocean | +2.98 | +5.36 | Warmest | 6th | 2016 | +4.40 | +7.92 |
| Coolest | 170th | 1966 | -2.70 | -4.86 | |||
| Ties: 2014 | |||||||
Precipitation
The maps shown below represent precipitation percent of normal (left, using a base period of 1961–1990) and precipitation percentiles (right, using the period of record) based on the GHCN dataset of land surface stations.
March 2024


Above-average March precipitation occurred in areas that included much of western Europe, much of central and eastern Russia, areas of central China, large parts of Japan, and much of central and western Australia. Precipitation also was above-average along much of the U.S. East Coast and Deep South, the western contigous U.S. and western Alaska. In South America wetter-than-average conditions were notable in coastal Brazil and northeastern Argentina. Conversely, drier-than-average conditions were widespread in Mexico, Central America, many northern areas of South America, and the Hawaiian Islands. March precipitation also was below-average in much of central and eastern Europe, southern Mongolia, northern and southeastern China, southern and western India, large parts of North Africa and West Africa, as well as much of eastern Australia and New Zealand.
Drought in March
Drought information is based on global drought indicators available at the Global Drought Information System website, and media reports summarized by the National Drought Mitigation Center.
March Overview:
- A significant portion of the world’s agricultural lands was still suffering from low soil moisture and groundwater levels — especially in the Americas, Africa, and Australia — and satellite observations showed stressed vegetation on all continents.
- The GEOGLAM Crop Monitor indicated that agriculture was most threatened in parts of Central and South America, Africa, Europe, and southern Asia.
- The Famine Early Warning System Network (FEWSNet) revealed significant food insecurity continuing in parts of Central and South America, Southwest Asia, and much of Africa.
Europe:
- The western coast of Scandinavia and parts of central to northeast Europe were drier than normal during March 2024, but the rest of Europe was wetter than normal, based on the Standardized Precipitation Index (SPI). Dryness along the Scandinavian coast persisted at the 2- to 12-month time scales. Parts of southeastern Europe were dry at the 2- to 9-month time scales, and dryness expanded across the Mediterranean coast at 3-12 months. Dryness along the Mediterranean coast intensified and spread northward into central Europe at longer time scales (24-72 months).
- Europe had the 11th wettest March, continent-wide, out of 85 years, based on the 1940-2024 ECMWF ERA5 Reanalysis, and the second warmest March out of 115 years, based on the 1910-2024 NOAA/NCEI record. But the continent had the warmest February-March and September-March through April-March (7 time periods). April 2020-March 2024 ranked as the warmest such 48-month period, with the 48-month SPEI showing long-term drought conditions across most of the continent.
- Despite plenty of rainfall in the north and center of France, some parts of the south that received recent heavy rains were still facing water shortages as below-average levels of rain have fallen, in some places for more than a year.
Asia:
- March was dry across parts of Southwest Asia, Southeast to South Asia, northern China to Mongolia, and north-central Siberia, but most of the continent was wetter than normal, with March 2024 ranking as the 29th wettest March, continent-wide, based on the ECMWF ERA5 Reanalysis. These same areas were dry on the 2- to 6-month SPI maps, with the dryness in Southwest Asia increasingly more severe. Spotty areas of dryness were also apparent in parts of Russia at 9-12 months. At 24 to 72 months, the dryness was located more in northern China to Mongolia, much of the Brahmaputra River Basin in southern Asia, parts of the Siberian Arctic coast, and most of Southwest Asia.
- Parts of Asia had near-normal temperatures during March 2024, but most of the continent was warmer than normal with the month ranking as the 12th warmest March, continent-wide, in the NOAA/NCEI record. However, very warm temperatures dominated 2023, with the 7 time periods from October-March through April-March ranking as the second warmest such periods on record.
- According to media reports (Radio New Zealand), Federated States of Micronesia President Wesley Simina declared a national emergency due to severe drought, and sent it to his country's Congress for review.
Africa:
- March was drier than normal in many parts of Africa and it was hotter than normal across most of the continent. Much of northern, western, central, and southern Africa were dry at the 2- to 3-month time scales, with wet areas in between in central and eastern Africa. At 6 to 9 months, the dryness was located across southern Africa, including Madagascar, and western to northern Africa, especially the Maghreb region. These areas, plus parts of central Africa, were dry at 12-72 months.
- The dryness was most severe in southern Africa on the 2- to 12-month SPI maps and in northern Africa (the Maghreb region) at all time scales.
- The continent as a whole had the 29th driest March and 12th driest January-March according to the ECMWF ERA5 Reanalysis. But southern Africa, where short-term drought was most severe, had the 12th driest March and driest January-March.
- Most of the continent was anomalously hot in March, with Africa experiencing the hottest March, as well as the warmest November-March through April-March (all 8 time periods), in the NOAA/NCEI record.
- Excessive warmth dominated 2023 and earlier years. With the last 12-, 24-, 36-, 48-, and 60-month time periods each record hot, continent-wide, most of Africa was in drought or very dry conditions, according to 3- to 48-month SPEI maps. The dryness was especially severe and widespread along the Mediterranean coast, in southern Africa, and in parts of East Africa.
- Models and satellite (GRACE) observations revealed persistent low soil moisture and groundwater in the Maghreb and adjacent northern and western regions, and over much of central to southern Africa.
- Le Monde (France) noted that the Mediterranean is experiencing its second consecutive dry year; Morocco is facing its sixth year with little or no rainfall.
- The Associated Press noted that, by the end of March, the drought in Zimbabwe, Zambia, and Malawi reached Botswana and Angola to the west, and Mozambique and Madagascar to the east.
Australia:
- The southwestern, southeastern, and northeastern corners of Australia were drier than normal in March, while the rest of the continent was wetter than normal. The dryness was more widespread and intense in the west and southeast, and along the east coast, at 9-12 months.
- March 2024 ranked as the third wettest March in the 1900-2024 record, continent-wide, according to the Australian Bureau of Meteorology (BoM).
- According to media reports (Radio New Zealand), a drought was declared in Marlborough, New Zealand, earlier this month, after months of farmers reporting they were struggling with working dry farmland and already starting to work through winter feed. The Australian Broadcasting Corporation reported that February and March have been driest on record for more than 100 years in some parts of Tasmania, including Hobart and King Island.
South America:
- In South America, March was drier than normal in parts of all of the countries, especially from Peru to western Brazil. The 2- to 12-month SPI maps show extreme dryness across Paraguay to western Brazil and along the northern coast of South America, with the dryness intensifying at the longer time scales; many other parts of the continent were dry at these time scales. These areas, as well as the southern third of the continent, were dry at longer time scales (24 to 72 months).
- Almost the entire continent was warmer than normal in March, with the month ranking as the warmest and second driest March in the 1910-2024 NOAA/NCEI record and ECMWF ERA5 Reanalysis, respectively; January-March ranked as the driest such 3-month period and April-March ranked as the driest such 12-month period.
- Excessive heat characterized much of 2023 as well as previous years. The NOAA/NCEI data show South America as having the warmest March back through April-March (all 12 time periods), continent-wide, as well as the warmest 24-month (April 2022-March 2024) through 60-month (April 2019-March 2024) periods.
- This persistent and historic warmth increased evapotranspiration which exacerbated drought conditions. The northern two-thirds of the continent, from northern Argentina and Chile to the northern coast, is in drought at 6-12 months, and virtually the entire continent is in some degree of drought or dryness at longer time scales.
- Satellite observations (GRACE) show dry soils across huge swaths of South America — from the northern coast to southern Brazil, across southern Peru and Bolivia to central Argentina, and southern Chile and Argentina — with low groundwater over these areas and extending further. Satellite analysis (VHI) revealed poor vegetative health across much of the continent, with only a few areas (from eastern Brazil to northeastern Argentina) still normal to healthy.
- According to media reports (Reuters), after 15 years of a devastating drought, reservoirs in Chile are running dry, imperiling access to drinking water in the Andean nation.
- Reuters noted that Venezuela is battling a record number of wildfires as a climate change-driven drought plagues the Amazon rainforest region. Satellites registered more than 30,200 fire points in Venezuela from January to March, the highest level for that period since records started in 1999, according to Brazil's Inpe research agency, which monitors all of South America.
North America:
- In North America, the SPI showed March as drier than normal across much of western Canada and central Mexico to Central America, parts of central to eastern Canada, and parts of the U.S. Pacific Northwest, Great Plains, and Ohio Valley.
- On the 24- to 48-month SPI maps, most of Canada, Mexico, and Central America, and the southern U.S. Plains to Midwest, were dry.
- March 2024 ranked as the 9th warmest and 24th wettest March, continent-wide, in the respective records, while November-March through April-March (all 8 time periods) were the warmest on record.
- The excessive warmth increased evapotranspiration during the warm season months, exacerbating drought conditions — virtually all of Canada, Mexico, and Central America were in some level of drought, according to the SPEI, at the 9- to 36-month time scales.
- Satellite (GRACE) observations revealed extensive areas of low groundwater across much of western to central Canada and parts of eastern Canada, the southwestern U.S. to interior Pacific Northwest, parts of the Mississippi to Ohio Valley, much of Mexico, and almost all of Central America. GRACE observations of soil moisture indicated dry soils across those same areas, except more of central Canada and less of the Mississippi and Ohio Valleys in the CONUS. Satellite analysis indicated poor vegetative health across parts of Canada and the U.S., and most of central Mexico to Central America.
- According to media reports (Castanet), Canada’s British Columbia River Forecast Center said that, in early March, the province had its second-lowest snowpack level of all time.
References
- Adler, R., G. Gu, M. Sapiano, J. Wang, G. Huffman 2017. Global Precipitation: Means, Variations and Trends During the Satellite Era (1979-2014). Surveys in Geophysics 38: 679-699, doi:10.1007/s10712-017-9416-4
- Adler, R., M. Sapiano, G. Huffman, J. Wang, G. Gu, D. Bolvin, L. Chiu, U. Schneider, A. Becker, E. Nelkin, P. Xie, R. Ferraro, D. Shin, 2018. The Global Precipitation Climatology Project (GPCP) Monthly Analysis (New Version 2.3) and a Review of 2017 Global Precipitation. Atmosphere. 9(4), 138; doi:10.3390/atmos9040138
- Gu, G., and R. Adler, 2022. Observed Variability and Trends in Global Precipitation During 1979-2020. Climate Dynamics, doi:10.1007/s00382-022-06567-9
- Huang, B., Peter W. Thorne, et. al, 2017: Extended Reconstructed Sea Surface Temperature version 5 (ERSSTv5), Upgrades, validations, and intercomparisons. J. Climate, doi: 10.1175/JCLI-D-16-0836.1
- Huang, B., V.F. Banzon, E. Freeman, J. Lawrimore, W. Liu, T.C. Peterson, T.M. Smith, P.W. Thorne, S.D. Woodruff, and H-M. Zhang, 2016: Extended Reconstructed Sea Surface Temperature Version 4 (ERSST.v4). Part I: Upgrades and Intercomparisons. J. Climate, 28, 911-930, doi:10.1175/JCLI-D-14-00006.1.
- Menne, M. J., C. N. Williams, B.E. Gleason, J. J Rennie, and J. H. Lawrimore, 2018: The Global Historical Climatology Network Monthly Temperature Dataset, Version 4. J. Climate, in press. https://doi.org/10.1175/JCLI-D-18-0094.1.
- Peterson, T.C. and R.S. Vose, 1997: An Overview of the Global Historical Climatology Network Database. Bull. Amer. Meteorol. Soc., 78, 2837-2849.
- Vose, R., B. Huang, X. Yin, D. Arndt, D. R. Easterling, J. H. Lawrimore, M. J. Menne, A. Sanchez-Lugo, and H. M. Zhang, 2021. Implementing Full Spatial Coverage in NOAA's Global Temperature Analysis. Geophysical Research Letters 48(10), e2020GL090873; doi:10.1029/2020gl090873.