NH Snow Cover Extent
| January 2019 | Snow Cover Extent | Anomaly 1991-2020 | Trend per decade | Rank (53 years) | Record | ||||||
|---|---|---|---|---|---|---|---|---|---|---|---|
| million km² | million mi² | million km² | million mi² | million km² | million mi² | Year(s) | million km² | million mi² | |||
| Northern Hemisphere | 47.24 | 18.24 | 0.00 | 0.00 | +0.17 | +0.07 | Largest | 26th | 2008 | 50.28 | 19.41 |
| Smallest | 28th | 1981 | 41.89 | 16.17 | |||||||
| North America | 17.66 | 6.82 | +0.07 | +0.03 | +0.01 | +0.00 | Largest | 24th | 1985 | 18.82 | 7.27 |
| Smallest | 30th | 1981 | 16.07 | 6.20 | |||||||
| Ties: 1977 | |||||||||||
| Eurasia | 29.58 | 11.42 | -0.07 | -0.03 | +0.16 | +0.06 | Largest | 25th | 2008 | 32.27 | 12.46 |
| Smallest | 29th | 1981 | 25.82 | 9.97 | |||||||
Data Source: Global Snow Laboratory, Rutgers University. Period of record: 1967–2019 (53 years)

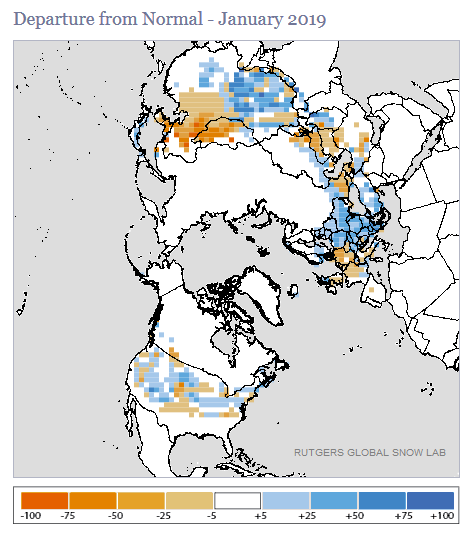
The Northern Hemisphere snow cover extent (SCE) for January 2019 was 47.24 million square km (18.24 million square miles), which is 370,000 square km (140,000 square miles) above the 1981–2010 average. This ranked near the median value in the 53-year period of record for the Northern Hemisphere. The North American and Eurasian SCE were both near average during January.

During January, the North American SCE was slightly larger than average and ranked near the median value in the 53-year period of record. The monthly SCE was 17.66 million square km (6.82 million square miles), 120,000 square km (50,000 square miles) above average. Above-average snow cover was observed across parts of the western, north-central, and northeastern contiguous U.S. Below-average snow cover was mainly observed across parts of central contiguous U.S.. In Canada, above-average snow cover was observed in the Rockies and Maritime Provinces with below-average in parts of the southern prairies. The contiguous U.S. and Canadian SCE were near average for the month. The Alaska SCE was also near average.

The Eurasian January SCE was 29.58 million square km (11.42 million square miles), 260,000 square km (100,000 square miles) above average and ranked near the median value. Above-average snow cover was observed in Japan, western China and across much of central and southeastern Europe. Below-average snow cover was observed across most of eastern China, the Korean Peninsula, Mongolia, and parts of northern Europe and southwestern Asia.
Sea Ice Extent
| January 2019 | Sea Ice Extent | Anomaly 1991-2020 | Trend per decade | Rank (41 years) | Record | ||||
|---|---|---|---|---|---|---|---|---|---|
| million km² | million mi² | Year(s) | million km² | million mi² | |||||
| Northern Hemisphere | 13.57 | 5.24 | -2.93% | -3.22% | Largest | 35th | 1979 | 15.41 | 5.95 |
| Smallest | 6th | 2018 | 13.08 | 5.05 | |||||
| Southern Hemisphere | 3.87 | 1.49 | -23.21% | +0.99% | Largest | 39th | 2015 | 6.85 | 2.64 |
| Smallest | 2nd | 2017 | 3.78 | 1.46 | |||||
| Globe | 17.44 | 6.73 | -8.31% | -2.16% | Largest | 38th | 1979 | 20.81 | 8.03 |
| Smallest | 3rd | 2017 | 16.97 | 6.55 | |||||
Data Source: National Snow and Ice Data Center (NSIDC). Period of record: 1979–2019 (41 years)

According to the National Snow and Ice Data Center (NSIDC), the Northern Hemisphere (Arctic) sea ice extent—which is measured from passive microwave instruments onboard NOAA satellites—averaged for January 2019 was 13.56 million square km (5.24 million square miles), 860,000 square km (332,000 square miles), or 6.0 percent, below the 1981–2010 average. This was the sixth smallest January sea ice extent on record for the Arctic. Sea ice coverage was below average in Baffin Bay, as well as the Barents, Okhotsk, and Bering Seas.

The January Southern Hemisphere sea ice extent was 3.83 million square km (1.48 million square miles), which was 1.17 million square km (450,000 square miles), or 23.4 percent, below the 1981–2010 average. This was the second smallest January Antarctic sea ice extent on record. Only the January Antarctic sea ice extent in 2017 was smaller.
For further information on the Northern and Southern Hemisphere snow and ice conditions, please visit the NSIDC News page.