Issued: 18 January 2018
NH Snow Cover Extent
The Northern Hemisphere snow cover extent (SCE) during winter (December 2016-February 2017) was 1.47 million square km (568,000 square miles) above the 1981-2010 average — the 10th largest winter SCE for the Northern Hemisphere since records began in 1968 and largest since 2012-13. The North American winter SCE was 330,000 square km above average and the 18th largest on record. The Eurasian winter SCE was 1.14 million square km above average and the ninth largest on record. Northern Hemisphere winter SCE has changed only slightly in the 51-year record, with a seasonal increase of about 0.4 percent per decade. For the spring season (March-May), the three-month average SCE for the Northern Hemisphere was 870,000 square km (336,000 square miles) above average and the 17th largest spring SCE for the Northern Hemisphere. This was the largest spring SCE since 2002 and the first time since 2013 that the seasonal SCE was above average. The North American spring SCE was the 19th largest on record while the Eurasian spring SCE was the 16th largest and largest since 2003. The Northern Hemisphere spring SCE has decreased at an average rate of 2.3 percent per decade.

Across North America during the 2016-17 winter, the SCE was 330,000 square km (127,000 square miles) above the 1981-2010 average, the 18th largest on record. This was the largest winter SCE for North America since 2013-14. For December and January, the North American SCE ranked as the 11th and 13th largest on record, respectively. Record warmth across the eastern half of the continent in February shrank the SCE and the February SCE ranked as the 15th smallest on record. The North American SCE for winter is increasing at an average rate of 0.5 percent per decade. For the spring season, the North American SCE was 290,000 square km (112,000 square miles) above average and the 19th largest on record and largest since 2013. The North American SCE was slightly below average in March, but ranked above average in April and May. The spring SCE for North America is decreasing at an average rate of 1.3 percent per decade. For more information on the snow season across the U.S., please read the U.S. annual snow report.
In Eurasia, the winter SCE for 2016-17 was 1.14 million square km (440,000 square miles) above average and the ninth largest winter SCE for the continent and largest since 2013. The Eurasian SCE was above average for all three months of the winter season and was the seventh largest for January. For the entire season, SCE for Eurasia is increasing at an average rate of 0.4 percent per decade. For the spring season, the Eurasian SCE was 580,000 square km (224,000 square miles) above average and the 16th largest on record. This was also the largest since 2003 and the first time since 2006 that the seasonally-averaged SCE was above average. Each spring month had an above-average SCE. The spring SCE for Eurasia is decreasing at an average rate of 3.1 percent per decade.
Sea Ice Extent
Arctic sea ice, which is measured from passive microwave instruments onboard NOAA satellites, usually expands during the cold season to a March maximum, and then contracts during the warm season to a September minimum. According data analyzed by the National Snow and Ice Data Center (NSIDC), during each month of 2017, the Arctic sea ice extent was much below average with record-low sea ice levels early in the year. When averaging monthly data from the National Snow and Ice Data Center, the average annual sea ice extent in the Arctic was approximately 10.39 million square km (4.01 million square miles). This was the second smallest annual average in the 1979-2017 record, about 233,000 square km (90,000 square miles) larger than the record small extent that was set in 2016.

On March 7th, the Arctic sea ice extent reached its maximum extent for the year at 14.42 million square km (5.57 million square miles). This was the smallest annual maximum extent on record at 1.22 million square km (471,000 square miles) below average and 97,000 square km (37,000 square miles) smaller than the previous record that occurred in 2015. After the initial melting after the maximum occurred there was some additional freeze-up of the sea ice, but the daily sea ice extent never exceeded the daily maximum set on the 7th. Below-average sea ice was observed in the Barents Sea and Sea of Okhotsk with slightly above-average ice extent in parts of the Bering Sea.
On September 13th, Artic sea ice reached its annual minimum extent, two days earlier than average. The 2017 minimum was 4.64 million square km (1.79 million square miles), 1.22 million square km (471,000 square miles) below the 1981-2010 average, the eighth smallest minimum Arctic sea ice extent since satellite records began in 1979. The 2017 minimum sea ice extent was 1.25 million square km (480,000 square miles) larger than the record smallest annual minimum extent that occurred in 2012. Large areas of open ocean that are typically ice covered in mid-September were observed on the 13th, including large areas of the Beaufort and Chukchi Seas on the Pacific side of the Arctic with the location of the ice edge further north than at any time on record for the region. The Northern Sea Route was mostly ice free, while parts of the Northwest Passage continued to have high ice concentration. Ships were able to traverse the southern route of the Northwest Passage with the assistance of ice breakers, but the northern route remained blocked by thick ice.
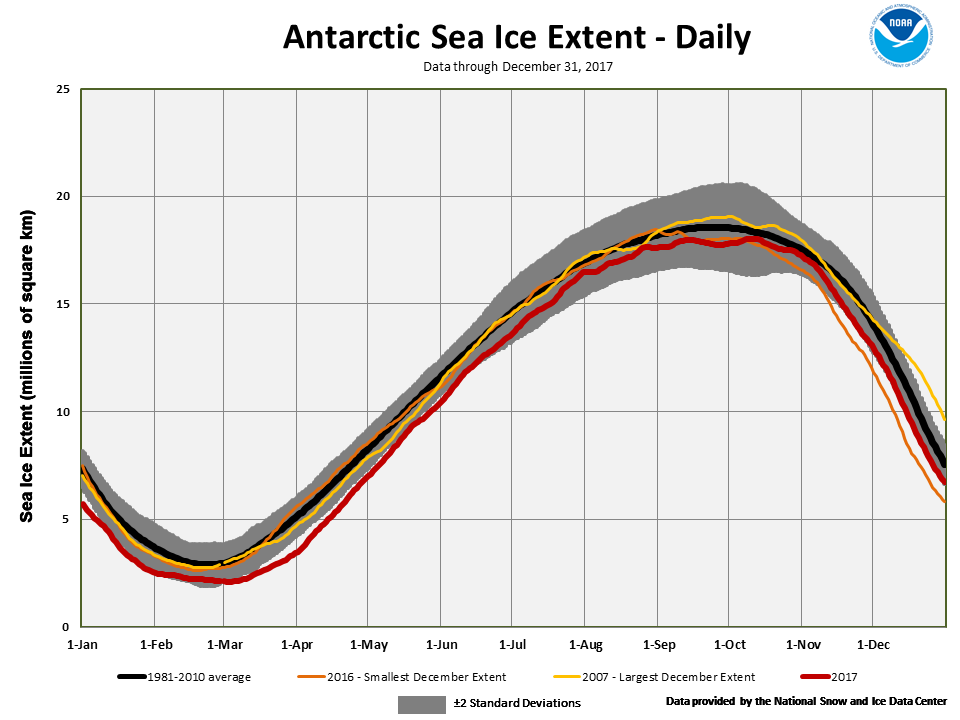
Average for the entire year, the Antarctic sea ice extent was record small at 10.65 million square km (4.11 million square miles), 950,000 square km (367,000 square miles) below the 1981-2010 average. The previous smallest annual Antarctic sea ice extent was 11.04 million square km (4.26 million square miles) in 1986.
The Antarctic sea ice extent was record low for five months of the year and reached its smallest minimum extent on record on March 3rd at 2.11 million square km (815,000 square miles). The Antarctic minimum extent was 740,000 square kilometers (286,000 square miles) below the 1981 to 2010 average minimum of 2.85 million square kilometers (1.10 million square miles) and 184,000 square kilometers (71,000 square miles) below the previous lowest minimum that occurred on February 27, 1997. The Antarctic system has been highly variable over the past decade with record large daily Antarctic sea ice extents occurring as recently as 2015. On October 11 and 12, 2017, the Antarctic sea ice extent reached its annual maximum extent at 17.98 million square km (6.96 million square miles). This was the second smallest Antarctic sea ice extent maximum on record — only slightly larger than the maximum extent in 1986. The date tied with 2002 as the latest date of occurrence of the annual maximum.
For further information on the Northern and Southern Hemisphere snow and ice conditions, please visit the NSIDC News page.