NH Snow Cover Extent
| December 2017 | Snow Cover Extent | Anomaly 1991-2020 | Trend per decade | Rank (52 years) | Record | ||||||
|---|---|---|---|---|---|---|---|---|---|---|---|
| million km² | million mi² | million km² | million mi² | million km² | million mi² | Year(s) | million km² | million mi² | |||
| Northern Hemisphere | 43.57 | 16.82 | -0.70 | -0.27 | +0.37 | +0.14 | Largest | 33rd | 2012 | 46.85 | 18.09 |
| Smallest | 20th | 1980 | 37.44 | 14.46 | |||||||
| North America | 16.71 | 6.45 | -0.19 | -0.07 | +0.12 | +0.05 | Largest | 25th | 2009 | 18.27 | 7.05 |
| Smallest | 29th | 1980 | 14.56 | 5.62 | |||||||
| Ties: 1996 | |||||||||||
| Eurasia | 26.86 | 10.37 | -0.50 | -0.19 | +0.26 | +0.10 | Largest | 31st | 2002 | 29.70 | 11.47 |
| Smallest | 22nd | 1980 | 22.88 | 8.83 | |||||||
Data Source: Global Snow Laboratory, Rutgers University. Period of record: 1966–2017 (52 years)

The Northern Hemisphere snow cover extent (SCE) for December 2017 was 43.57 million square km (16.82 million square miles), which is 410,000 square km (160,000 square miles), or 0.9 percent, smaller than the 1981-2010 average. This was 20th smallest December SCE in the 52-year period of record for the Northern Hemisphere. The North American and Eurasian SCE were both below average during December.

During December, the North American SCE was slightly smaller than average and ranked near the median value in the 52-year period of record. The monthly SCE was 16.71 million square km (6.45 million square miles), 140,000 square km (50,000 square miles) below average. In the U.S. above-average snow cover was observed in the Northeast, Midwest and Northern Rockies while in Canada above-average snow cover was observed in the Rockies and Great Lakes region. Below-average snow cover was observed across much of the western and south-central U.S. and stretching from the U.S. Northern Plains to southern Canadian Prairies. The contiguous U.S. SCE was slightly below average, while the Canadian SCE ranked as the 15th highest for the month. The Alaska SCE was the third highest on record.

The Eurasian December SCE was 26.86 million square km (10.37 million square miles), 270,000 square km (100,000 square miles) below average and ranked near the median value. Above-average snow cover was observed across parts of northern and Western Europe, Kazakhstan, Uzbekistan, the Korean peninsula and Japan. Below-average snow cover was observed across much of China, Mongolia, Iran, Turkey and Eastern Europe.
Sea Ice Extent
| December 2017 | Sea Ice Extent | Anomaly 1991-2020 | Trend per decade | Rank (39 years) | Record | ||||
|---|---|---|---|---|---|---|---|---|---|
| million km² | million mi² | Year(s) | million km² | million mi² | |||||
| Northern Hemisphere | 11.74 | 4.53 | -5.32% | -3.71% | Largest | 37th | 1982 | 13.64 | 5.27 |
| Smallest | 2nd | 2016 | 11.46 | 4.42 | |||||
| Southern Hemisphere | 9.48 | 3.66 | -8.85% | +1.54% | Largest | 35th | 2007 | 11.98 | 4.63 |
| Smallest | 4th | 2016 | 8.28 | 3.20 | |||||
| Globe | 21.22 | 8.19 | -6.97% | -1.36% | Largest | 37th | 1988 | 24.69 | 9.53 |
| Smallest | 2nd | 2016 | 19.74 | 7.62 | |||||
Data Source: National Snow and Ice Data Center (NSIDC). Period of record: 1979–2017 (39 years)

According to the National Snow and Ice Data Center (NSIDC), the Northern Hemisphere (Arctic) sea ice extent — which is measured from passive microwave instruments onboard NOAA satellites — averaged for December 2017 was 11.75 million square km (4.54 million square miles), 1.09 million square km (421,000 square miles), or 8.5 percent, below the 1981-2010 average. This was the second smallest December sea ice extent on record for the Arctic – only the December extent in 2016 was smaller at 11.47 million square km (4.43 million square miles). At the end of December, below-average sea ice was observed in the Barents, Bering and Chukchi Seas with near-average ice along the east coast of Greenland and in the Sea of Okhotsk. Throughout December, ice expanded at a slightly slower than average rate with rapid ice expansion in the Chukchi and Kara seas. December Arctic ice extent is decreasing at an average rate of 3.7 percent per decade.

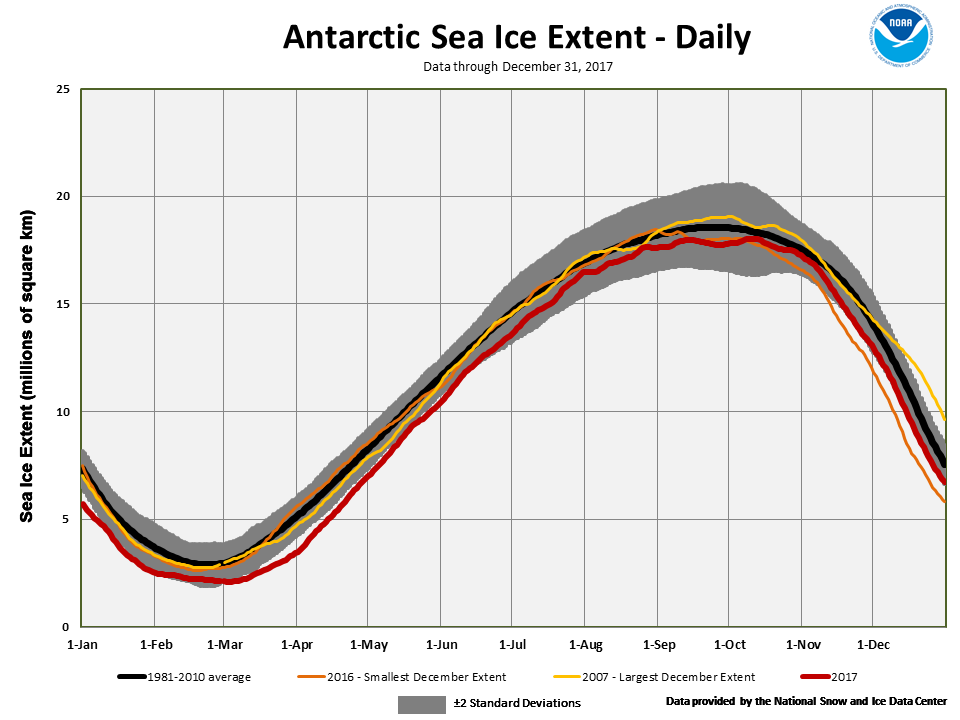
The December Southern Hemisphere sea ice extent was 9.34 million square km (3.61 million square miles), which was 1.07 million square km (410,000 square miles), or 10.3 percent, below the 1981-2010 average. Much-below-average sea ice was observed in the eastern Weddell Sea with above-average conditions in parts of the northwestern Weddell Sea. This was the fourth smallest December Antarctic sea ice extent on record. Southern Hemisphere sea ice extent is increasing at an average rate of 1.4 percent per decade.
For further information on the Northern and Southern Hemisphere snow and ice conditions, please visit the NSIDC News page.