NH Snow Cover Extent
| November 2017 | Snow Cover Extent | Anomaly 1991-2020 | Trend per decade | Rank (52 years) | Record | ||||||
|---|---|---|---|---|---|---|---|---|---|---|---|
| million km² | million mi² | million km² | million mi² | million km² | million mi² | Year(s) | million km² | million mi² | |||
| Northern Hemisphere | 35.97 | 13.89 | +0.92 | +0.36 | +0.38 | +0.15 | Largest | 9th | 1993 | 38.60 | 14.90 |
| Smallest | 44th | 1979 | 28.28 | 10.92 | |||||||
| North America | 14.68 | 5.67 | +0.81 | +0.31 | +0.14 | +0.05 | Largest | 7th | 2014 | 15.39 | 5.94 |
| Smallest | 46th | 1979 | 11.48 | 4.43 | |||||||
| Eurasia | 21.29 | 8.22 | +0.11 | +0.04 | +0.24 | +0.09 | Largest | 17th | 1993 | 24.13 | 9.32 |
| Smallest | 36th | 1979 | 16.80 | 6.49 | |||||||
Data Source: Global Snow Laboratory, Rutgers University. Period of record: 1966–2017 (52 years)
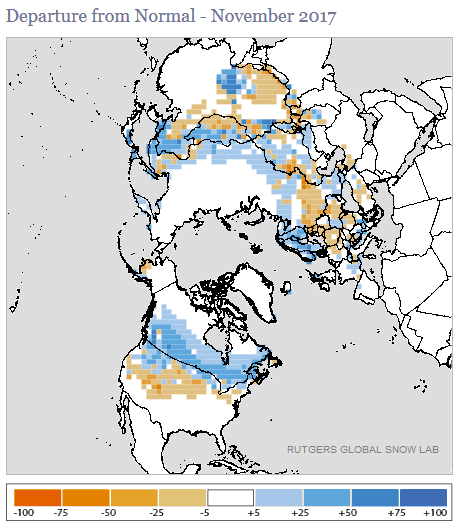
The Northern Hemisphere snow cover extent (SCE) for November 2017 was 35.97 million square km (13.89 million square miles), which was 2.01 million square km (780,000 square miles), or 5.93 percent, larger than the 1981-2010 average. This was the ninth largest November SCE in the 52-year period of record for the Northern Hemisphere and the ninth consecutive November with above-average SCE. Despite the above-average monthly SCE, this was the smallest November value since 2013. November's long term trend (since 1966) is increasing at an average linear rate of 1.2 percent per decade.
The November North American SCE was 14.68 million square km (5.67 million square miles), 1.20 million square km (460,000 square miles) above average and the seventh largest on record. This was the largest November North American SCE since 2014. Snow cover was above average for much of Canada and the northern Rockies, Great Lakes, and Northeast in the United States. Below-average SCE was observed in western Alaska, the central and southern Rockies, and Great Plains in the United States. The contiguous U.S. SCE was the 22nd largest on record, the Canadian SCE was record large, while the Alaskan SCE was also the 22nd largest.
The Eurasian SCE during November was 21.29 million square km (8.22 million square miles), which is 820,000 square km (320,000 square miles) above average. This was the 17th largest November SCE on record for Eurasia, but the smallest since 2014. Above-average SCE was observed across far eastern Asia, central China, northern Mongolia, south-central Russia, and Scandinavia. Below-average SCE was observed in central Europe, western Russia, southern Mongolia, and across the Tibetan Plateau.
Sea Ice Extent
| November 2017 | Sea Ice Extent | Anomaly 1991-2020 | Trend per decade | Rank (39 years) | Record | ||||
|---|---|---|---|---|---|---|---|---|---|
| million km² | million mi² | Year(s) | million km² | million mi² | |||||
| Northern Hemisphere | 9.49 | 3.66 | -6.41% | -5.23% | Largest | 37th | 1982 | 11.63 | 4.49 |
| Smallest | 3rd | 2016 | 8.66 | 3.34 | |||||
| Southern Hemisphere | 15.11 | 5.83 | -4.79% | +0.25% | Largest | 37th | 2013 | 16.87 | 6.51 |
| Smallest | 3rd | 2016 | 14.22 | 5.49 | |||||
| Globe | 24.60 | 9.50 | -5.42% | -1.88% | Largest | 38th | 1980 | 27.51 | 10.62 |
| Smallest | 2nd | 2016 | 22.88 | 8.83 | |||||
Data Source: National Snow and Ice Data Center (NSIDC). Period of record: 1979–2017 (39 years)
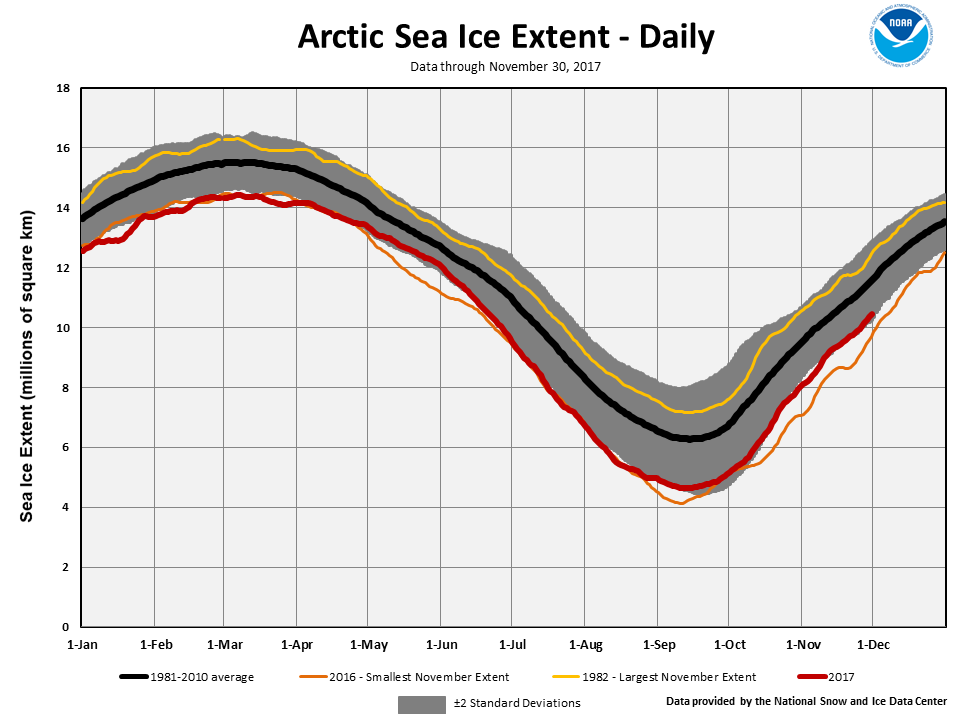
According to the National Snow and Ice Data Center (NSIDC), the Northern Hemisphere (Arctic) sea ice extent — which is measured from passive microwave instruments onboard NOAA satellites — averaged for November 2017 was 9.46 million square km (3.65 million square miles), 1.24 million square km (479,000 square miles), or 11.59 percent, below the 1981-2010 average. This was the third smallest November Arctic sea ice extent on record and 830,000 square kilometers (321,000 square miles) above the record low November extent set in 2016. The overall expansion of sea ice was faster than average throughout the month, but sea ice extent continued to be below-average throughout much of the Arctic. Below-average sea ice was observed in the Kara and Barents Sea with record-low sea ice in the Chukchi and Beaufort Seas. Above-average sea ice was observed in parts of Hudson Bay. Since 1979, November Arctic sea ice extent is decreasing at an average rate of 5.1 percent per decade.
The November Southern Hemisphere (Antarctic) sea ice extent was 15.00 million square km (5.79 million square miles), which was 900,000 square km (350,000 square miles), or 5.66 percent, below the 1981-2010 average. This was the second smallest November Southern Hemisphere sea ice extent on record, only the November sea ice extent in 2016 was smaller. Sea ice was near average for most of the oceans surrounding Antarctica, except the Weddell Sea, where sea ice was record low. Southern Hemisphere November sea ice extent is increasing at an average rate of 0.2 percent per decade.
For further information on the Northern and Southern Hemisphere snow and ice conditions, please visit the NSIDC News page.