NH Snow Cover Extent
| June 2016 | Snow Cover Extent | Anomaly 1991-2020 | Trend per decade | Rank (49 years) | Record | ||||||
|---|---|---|---|---|---|---|---|---|---|---|---|
| million km² | million mi² | million km² | million mi² | million km² | million mi² | Year(s) | million km² | million mi² | |||
| Northern Hemisphere | 5.58 | 2.15 | -2.55 | -0.98 | -1.29 | -0.50 | Largest | 47th | 1978 | 14.97 | 5.78 |
| Smallest | 3rd | 2012 | 4.92 | 1.90 | |||||||
| North America | 4.31 | 1.66 | -0.97 | -0.37 | -0.44 | -0.17 | Largest | 47th | 1978 | 7.84 | 3.03 |
| Smallest | 3rd | 2012 | 3.85 | 1.49 | |||||||
| Eurasia | 1.27 | 0.49 | -1.58 | -0.61 | -0.85 | -0.33 | Largest | 48th | 1978 | 7.13 | 2.75 |
| Smallest | 2nd | 2012 | 1.07 | 0.41 | |||||||
Data Source: Global Snow Laboratory, Rutgers University. Period of record: 1967–2016 (49 years)
The 2015-16 Northern Hemisphere snow season ended on June 30th with the 2016-17 snow season beginning on July 1st. Northern Hemisphere snow cover extent typically reaches an annual minimum during late summer. August has the lowest average monthly snow cover extent at about 1.1 million square miles, or about twice the size of Alaska, with most of the snow cover observed across the high latitudes of the Arctic and in the highest elevations further to the south. Snow cover extent typically reaches its largest extent in mid-winter, with the January average snow cover extent about 18.1 million square miles, covering roughly 9 percent of the earth's entire surface and 31 percent of the earth's land surface.
The table below provides a monthly recap of the 2015-16 snow season across the Northern Hemisphere. This past season was fairly representative of longer-term trends that have been observed in snow cover extent, with below-average snow cover during the spring and summer seasons and near- to above-average snow cover during the autumn and winter seasons.
| Month | Snow Cover Extent (million sq. miles) | Anomaly (million sq. miles) | Rank out of 50 years | Trend per decade |
|---|---|---|---|---|
| Jul 2015 | 0.97 | -0.45 | 5th smallest | -21.3% |
| Aug 2015 | 0.99 | -0.9 | 14th smallest | -11.4% |
| Sep 2015 | 2.27 | +0.25 | 14th largest | +0.8% |
| Oct 2015 | 8.26 | +1.49 | 7th largest | +1.3% |
| Nov 2015 | 13.99 | +0.88 | 7th largest | +0.9% |
| Dec 2015 | 16.79 | -0.50 | 19th smallest | +0.9% |
| Jan 2016 | 18.84 | +1.93 | 9th largest | +0.3% |
| Feb 2016 | 16.80 | -0.80 | 3rd smallest | -0.2% |
| Mar 2016 | 14.35 | -1.14 | 2nd smallest | -1.2% |
| Apr 2016 | 10.78 | -0.89 | 1st smallest | -1.7% |
| May 2016 | 6.31 | -1.03 | 4th smallest | -4.6% |
| Jun 2016 | 2.15 | -1.48 | 3rd smallest | -13.4% |
Sea Ice Extent
| June 2016 | Sea Ice Extent | Anomaly 1991-2020 | Trend per decade | Rank (38 years) | Record | ||||
|---|---|---|---|---|---|---|---|---|---|
| million km² | million mi² | Year(s) | million km² | million mi² | |||||
| Northern Hemisphere | 10.41 | 4.02 | -7.88% | -4.16% | Largest | 38th | 1979 | 12.53 | 4.84 |
| Smallest | 1st | 2016 | 10.41 | 4.02 | |||||
| Southern Hemisphere | 13.24 | 5.11 | -1.63% | +1.86% | Largest | 25th | 2014 | 14.69 | 5.67 |
| Smallest | 14th | 2002 | 12.38 | 4.78 | |||||
| Globe | 23.65 | 9.13 | -4.48% | -0.85% | Largest | 38th | 1979 | 26.72 | 10.32 |
| Smallest | 1st | 2016 | 23.65 | 9.13 | |||||
Data Source: National Snow and Ice Data Center (NSIDC). Period of record: 1979–2016 (38 years)
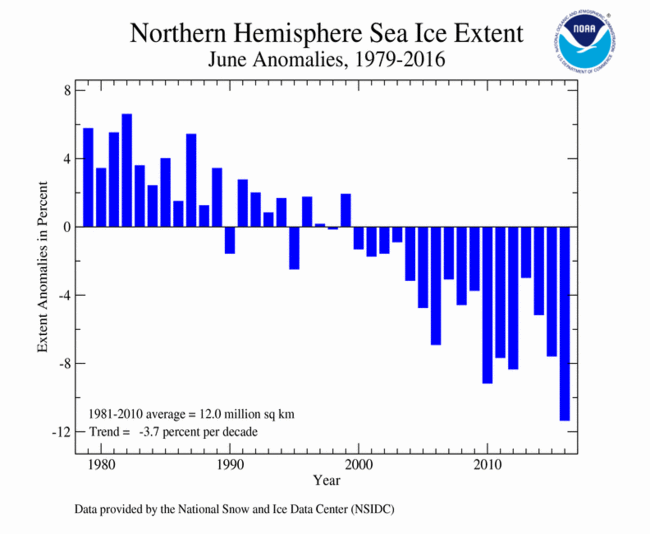
According to the National Snow and Ice Data Center (NSIDC), the Northern Hemisphere (Arctic) sea ice extent — which is measured from passive microwave instruments onboard NOAA satellites — averaged for June 2016 was 10.60 million square km (4.09 million square miles), 1.36 million square km (530,000 square miles), or 11.37 percent, below the 1981-2010 average. This was the smallest June Arctic sea ice extent on record, dipping below the previous record of 10.86 million square km (4.19 million square miles) in 2010. Five of the first six months of 2016, excluding March, have set new low monthly Arctic sea ice extent records. For the entire month, the rate of sea ice loss was 56,900 square km (22,000 square miles) per day, which was near-average. Slower than average ice loss was observed during the first half of the month, with above-average ice loss during the second half of the month. At the end of June, below-average sea ice was observed in the Kara, Barents, and Beaufort seas. June Arctic sea ice extent is decreasing at an average rate of 3.6 percent per decade.

The June Southern Hemisphere (Antarctic) sea ice extent was 13.85 million square km (5.35 million square miles), which was 110,000 square km (40,000 square miles), or 0.79 percent, below the 1981-2010 average. This was the 13th smallest June Southern Hemisphere sea ice extent on record and the smallest since 2011. The June 2016 Antarctic sea ice extent was in contrast to the sea ice during the previous two Junes, when record and near-record large extents were observed. Sea ice across the Antarctic expanded at a rate faster than average during the first third of the month with near-average ice expansion during the rest of June. Southern Hemisphere June sea ice extent is increasing at an average rate of 1.7 percent per decade, with substantial inter-annual variability.
For further information on the Northern and Southern Hemisphere snow and ice conditions, please visit the NSIDC News page.