NH Snow Cover Extent
| November 2015 | Snow Cover Extent | Anomaly 1991-2020 | Trend per decade | Rank (50 years) | Record | ||||||
|---|---|---|---|---|---|---|---|---|---|---|---|
| million km² | million mi² | million km² | million mi² | million km² | million mi² | Year(s) | million km² | million mi² | |||
| Northern Hemisphere | 36.25 | 14.00 | +1.20 | +0.46 | +0.31 | +0.12 | Largest | 7th | 1993 | 38.60 | 14.90 |
| Smallest | 44th | 1979 | 28.28 | 10.92 | |||||||
| North America | 13.70 | 5.29 | -0.17 | -0.07 | +0.14 | +0.05 | Largest | 19th | 2014 | 15.39 | 5.94 |
| Smallest | 32nd | 1979 | 11.48 | 4.43 | |||||||
| Eurasia | 22.55 | 8.71 | +1.37 | +0.53 | +0.17 | +0.07 | Largest | 7th | 1993 | 24.13 | 9.32 |
| Smallest | 44th | 1979 | 16.80 | 6.49 | |||||||
Data Source: Global Snow Laboratory, Rutgers University. Period of record: 1966–2015 (50 years)

During November 2015, the Northern Hemisphere snow cover extent (SCE) was 36.25 million square km (13.99 million square miles), 2.29 million square km (0.88 million square miles) above the 1981-2010 average. This was the seventh largest November SCE in the 50-year period of record for the Northern Hemisphere. Both North America and Eurasia had above average SCE.

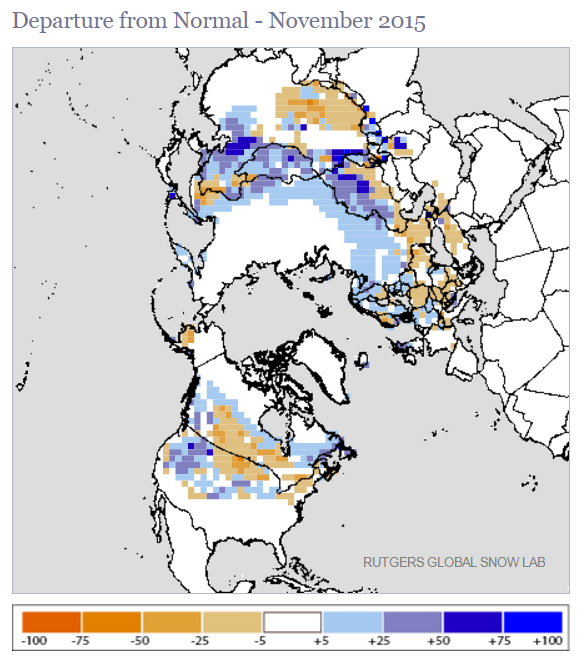
The November North American SCE was 13.70 million square km (5.29 million square miles), 220,000 square km (80,000 square miles) above average and the 19th largest on record. For November, the contiguous U.S. SCE was the 19th largest on record, while Alaskan SCE was the 22nd smallest and the Canadian SCE was 21st largest. Above-average snow cover was observed across the U.S. and Canadian Rockies, the Central Plains of the U.S. and parts of eastern Canada. Below-average snow cover was observed across the Northern Plains of the U.S. and the southern Canadian Prairies, the northeastern U.S., and parts of western Alaska.

The Eurasian SCE during November was 22.55 million square km (8.71 million square miles), 2.08 million square km (0.80 million square miles) above average. This was the seventh largest November SCE on record for Eurasia. Below-average snow cover was observed across central and eastern Europe and the Tibetan Plateau. Above-average snow cover was observed over northern Europe, western Russia, much of Kazakhstan, and northeastern China.
Sea Ice Extent
| November 2015 | Sea Ice Extent | Anomaly 1991-2020 | Trend per decade | Rank (37 years) | Record | ||||
|---|---|---|---|---|---|---|---|---|---|
| million km² | million mi² | Year(s) | million km² | million mi² | |||||
| Northern Hemisphere | 9.85 | 3.80 | -2.86% | -4.83% | Largest | 31st | 1982 | 11.63 | 4.49 |
| Smallest | 7th | 2012 | 9.39 | 3.63 | |||||
| Southern Hemisphere | 16.18 | 6.25 | +1.95% | +1.01% | Largest | 8th | 2013 | 16.87 | 6.51 |
| Smallest | 30th | 1986 | 15.01 | 5.80 | |||||
| Globe | 26.03 | 10.05 | +0.08% | -1.31% | Largest | 31st | 1980 | 27.51 | 10.62 |
| Smallest | 7th | 2012 | 25.50 | 9.85 | |||||
Data Source: National Snow and Ice Data Center (NSIDC). Period of record: 1979–2015 (37 years)

According to the National Snow and Ice Data Center (NSIDC), the Northern Hemisphere (Arctic) sea ice extent — which is measured from passive microwave instruments onboard NOAA satellites — averaged for November 2015 was 10.06 million square km (3.88 million square miles), 0.91 million square km (360,000 square miles), or 8.30 percent, below the 1981-2010 average. This was the sixth smallest November extent in the 37-year satellite record and the smallest since 2012. The sea ice growth across the Arctic was rapid during the first half of November, but slowed during the middle part of the month, and accelerated again toward the end of November. At the end of November, below-average sea ice was observed in the Barents Sea, the Bering Strait, and western parts of Hudson Bay. Above-average sea ice was observed across eastern parts of Hudson Bay, with near-average sea ice elsewhere across the Arctic Basin. Overall, November Arctic sea ice extent is decreasing at an average rate of 4.56 percent per decade.

The November 2015 Southern Hemisphere (Antarctic) sea ice extent was 16.49 million square km (6.37 million square miles), 190,000 square km (80,000 square miles), or 1.17 percent, above the 1981-2010 average. This was the 14th largest November Antarctic sea ice extent on record, but the smallest since 2011. November Antarctic sea ice extent is increasing at an average rate of 0.86 percent per decade.
When combining the Northern Hemisphere and Southern Hemisphere sea ice extents, the globally-averaged sea ice extent during November was 26.55 million square km (10.25 million square miles), 2.68 percent below the 1981-2010 average and the third smallest November global sea ice extent on record. This was the smallest November global sea ice extent since 2011. November global sea ice extent is decreasing at an average rate of 1.28 percent per decade.
For further information on the Northern and Southern Hemisphere snow and ice conditions, please visit the NSIDC News page.