NH Snow Cover Extent
| May 2015 | Snow Cover Extent | Anomaly 1991-2020 | Trend per decade | Rank (49 years) | Record | ||||||
|---|---|---|---|---|---|---|---|---|---|---|---|
| million km² | million mi² | million km² | million mi² | million km² | million mi² | Year(s) | million km² | million mi² | |||
| Northern Hemisphere | 17.00 | 6.56 | -1.22 | -0.47 | -0.86 | -0.33 | Largest | 44th | 1974 | 23.09 | 8.92 |
| Smallest | 6th | 2010 | 15.38 | 5.94 | |||||||
| North America | 8.07 | 3.12 | -0.97 | -0.37 | -0.24 | -0.09 | Largest | 47th | 1974 | 11.48 | 4.43 |
| Smallest | 3rd | 2010 | 7.80 | 3.01 | |||||||
| Eurasia | 8.93 | 3.45 | -0.25 | -0.10 | -0.62 | -0.24 | Largest | 38th | 1976 | 12.51 | 4.83 |
| Smallest | 12th | 2013 | 7.26 | 2.80 | |||||||
Data Source: Global Snow Laboratory, Rutgers University. Period of record: 1967–2015 (49 years)
During May 2015, the Northern Hemisphere snow cover extent (SCE) was 17.00 million square km (6.56 million square miles), 2.02 million square km (780,000 square miles) below the 1981-2010 average. This was the sixth smallest May SCE in the 49-year satellite record. Eight of the 10 smallest May Northern Hemisphere snow cover extents have occurred since 2005, with the smallest occurring in 2010. Both the Eurasian and North American SCE were below average during May. For the spring season (March-May), the Northern Hemisphere SCE was 1.27 million square km (490,000 square miles) below average and the eighth smallest spring SCE for the Northern Hemisphere.

The May North American SCE was 8.07 million square km (3.12 million square miles), 1.23 million square km (480,000 square miles) below the 1981-2010 average and the third smallest in the 49-year period of record. Only the May SCE of 2010 and 1968 were smaller. The contiguous U.S. had its 18th smallest May SCE, Canada had its fourth smallest, and the Alaska May SCE was record small. On the regional scale, above-average snow cover was observed across parts of eastern Canada and the north-central United States. Below-average snow cover was observed across the western United States, central and western Canada, and all of Alaska. The spring North American SCE was 740,000 square km (286,000 square miles) below average and the fourth smallest on record and smallest since 2012. Three of the four smallest spring snow cover extents for North America have occurred since 2010.

The Eurasian SCE during May was 8.93 million square km (3.45 million square miles), 790,000 square km (300,000 square miles) below the 1981-2010 average. This was the 12th smallest May SCE for Eurasia, but the largest since 2006. Below-average snow cover was observed across central and western Russia and northern China. Above-average snow cover was observed across parts of Scandinavia, far eastern Russia, and the Tibetan Plateau. For the spring season the Eurasian SCE was 530,000 square km (205,000 square miles) below average and the 14th smallest on record.
Sea Ice Extent
| May 2015 | Sea Ice Extent | Anomaly 1991-2020 | Trend per decade | Rank (37 years) | Record | ||||
|---|---|---|---|---|---|---|---|---|---|
| million km² | million mi² | Year(s) | million km² | million mi² | |||||
| Northern Hemisphere | 12.47 | 4.81 | -3.56% | -2.40% | Largest | 37th | 1985 | 14.07 | 5.43 |
| Smallest | 1st | 2015 | 12.47 | 4.81 | |||||
| Southern Hemisphere | 11.72 | 4.53 | +13.90% | +3.01% | Largest | 1st | 2015 | 11.72 | 4.53 |
| Smallest | 37th | 1980 | 8.86 | 3.42 | |||||
| Globe | 24.19 | 9.34 | +4.18% | 0.00% | Largest | 5th | 1982 | 24.73 | 9.55 |
| Smallest | 33rd | 2006 | 21.98 | 8.49 | |||||
Data Source: National Snow and Ice Data Center (NSIDC). Period of record: 1979–2015 (37 years)
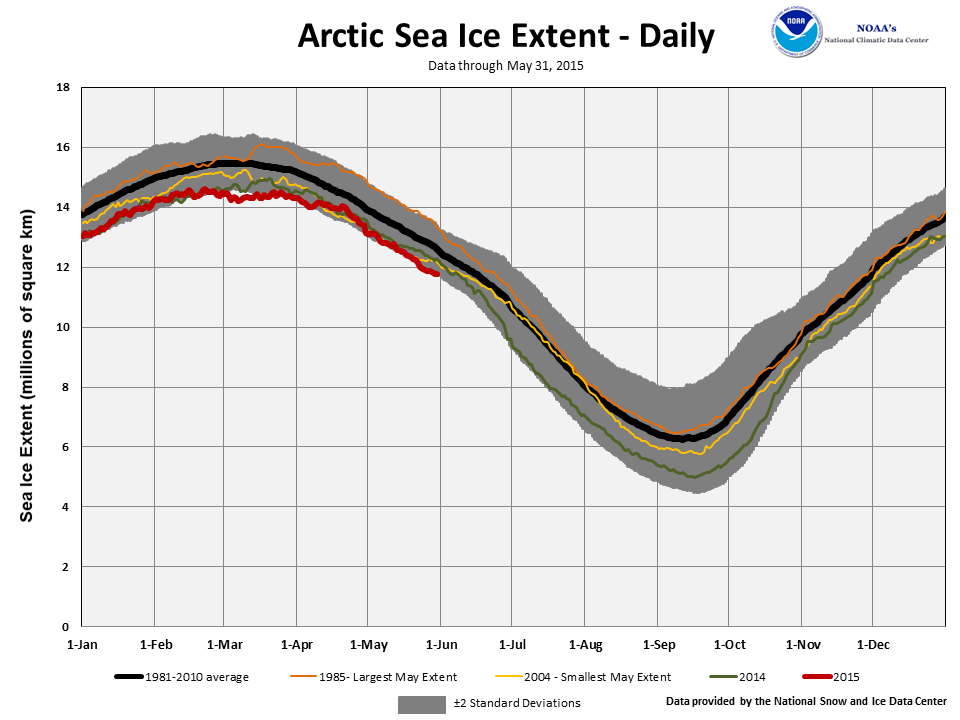
According to the National Snow and Ice Data Center (NSIDC), the Northern Hemisphere sea ice extent — which is measured from passive microwave instruments onboard NOAA satellites — averaged for May 2015 was 12.65 million square km (4.88 million square miles), 730,000 square km (290,000 square miles), or 5.46 percent, below the 1981-2010 average. This was the third smallest May Arctic sea ice extent on record, slightly larger than the May sea ice extents of 2005 and 2006. Sea ice rapidly declined during May as part of the annual melt season. The rate of ice loss was slightly faster than the 1981-2010 average, with the daily sea ice extent reaching record low levels several times over the course of the month. Regionally, sea ice declined rapidly in the Bering Sea, with the sea being ice free by the end of the month. Below-average sea ice was also observed in the Barents Sea, with most other areas having near-average ice coverage. By the end of May, several openings appeared in the ice pack in the southern Barents Sea, off the coast of northern Alaska, and in the Kara Sea. For the month of May, the Arctic sea ice extent is decreasing at an average rate of 2.3 percent per decade.

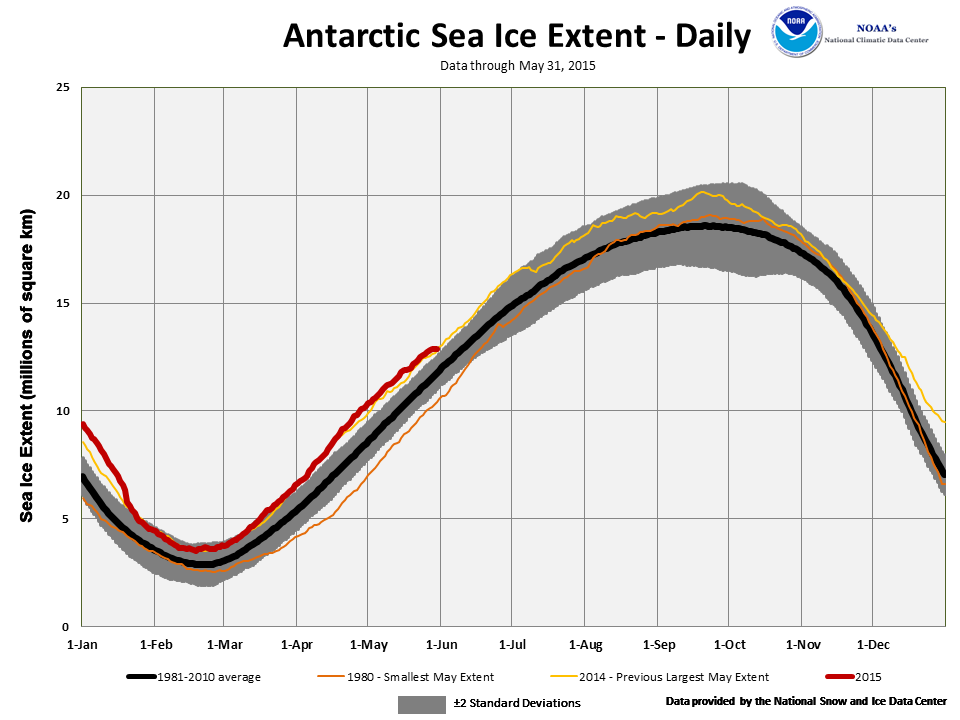
The May 2015 Southern Hemisphere sea ice extent was 12.10 million square km (4.67 million square miles), 1.31 million square km (500,000 square miles), or 12.14 percent, above the 1981-2010 average. This was the largest May Antarctic sea ice extent on record, exceeding the previous record set just last year by 50,000 square km (20,000 square miles). This was the second consecutive month of record large sea ice in the Southern Hemisphere. On the daily scale, the Antarctic sea ice extent was record high each day during May. Above-average sea ice was observed in the eastern Ross Sea, western Amundsen Sea, and in the northern and eastern Weddell Sea. May Antarctic sea ice extent is increasing at an average rate of 2.8 percent per decade.
When combining the Northern Hemisphere and Southern Hemisphere sea ice extents, the globally-averaged sea ice extent during May was 24.75 million square km (9.56 million square miles), 2.40 percent above the 1981-2010 average and the seventh largest May global sea ice extent on record. There is no trend in May globally-averaged sea ice extent.
For further information on the Northern and Southern Hemisphere snow and ice conditions, please visit the NSIDC News page.