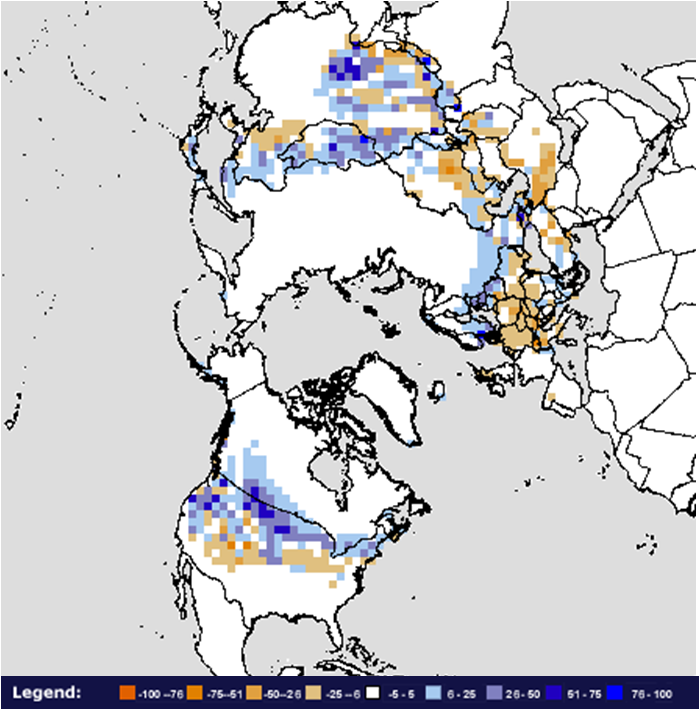
NH Snow Cover Extent
Data were provided by the Global Snow Laboratory, Rutgers University. Period of record is 1967-2011 (45 years).
The Northern Hemisphere snow cover extent during March 2011 was above average, marking the ninth largest (37th smallest) on record for the hemisphere. The March snow cover extent for the Northern Hemisphere was 1.76 million square km (0.68 million square miles) above the long-term average of 40.4 million square km (15.6 million square miles). This marks the largest March snow cover extent for the Northern Hemisphere since 1986, and the sixth consecutive month with above average snow cover. Both the North American and Eurasian land areas had snow cover extents which were above average. According to a satellite analysis by the Rutgers Global Snow Lab, above-average snow cover was observed across the northern and western United States, Scandinavia, western Russia, Mongolia, and central China. Below-average snow cover was observed across the central United States, central Europe, and western Asia.
During March 2011, the North American snow cover extent was above average, ranking as the sixth largest (40th smallest) on record. This is the largest March snow cover extent for North America since 1979. The monthly average snow cover extent was 812,000 square km (313,500 square miles) above the long-term average of 15.7 million square km (6.1 million square miles). According to data from the Rutgers Global Snow Lab, Canada, the contiguous U.S., and Alaska all had above-average snow cover during March. An active storm pattern, bringing snowfall across the western coast of North America and the northern U.S., was associated with the above average snow cover for the continent.
Eurasian snow cover extent during March 2011 was above average, ranking as the 11th largest (35th ) on record. This marks the second consecutive March with above average snow cover. The March Eurasian snow cover extent was 952,000 square km (367,570 square miles) above the long-term average of 24.7 million square km.
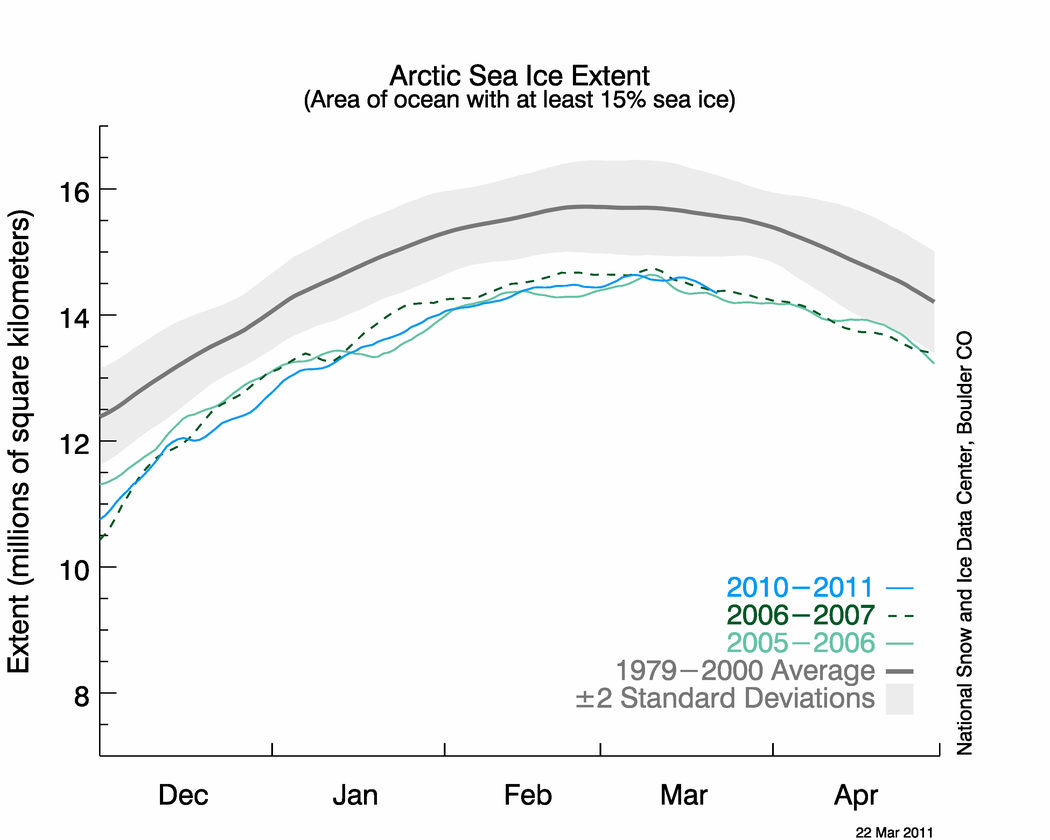
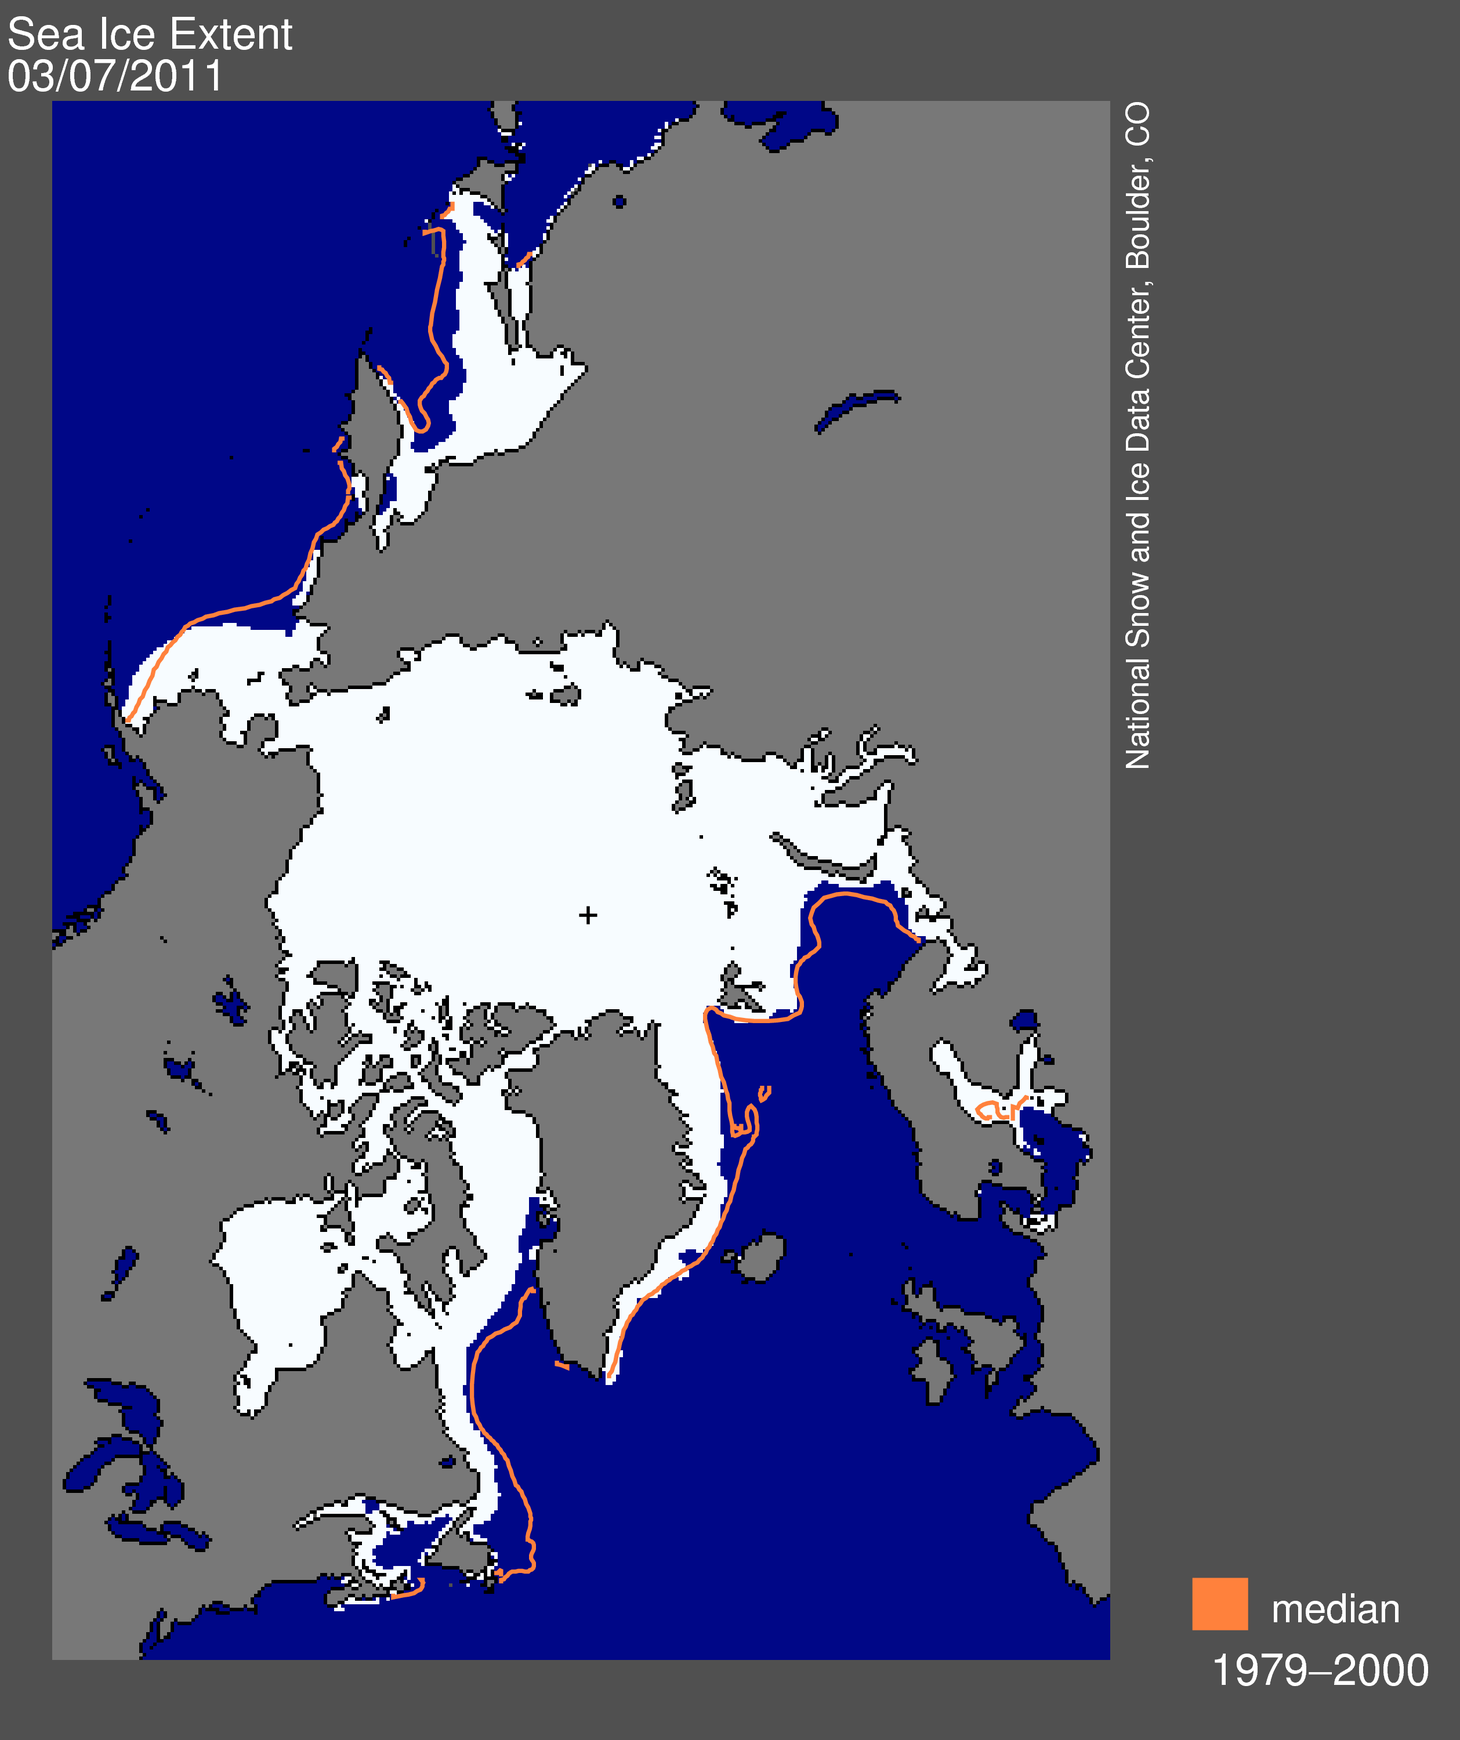
Sea Ice Extent
According to the National Snow and Ice Data Center (NSIDC), the Northern Hemisphere sea ice extent — which is measured from passive microwave instruments onboard NOAA satellites — averaged for March 2011, was 14.56 million square km (5.62 million square miles) — 7.55 percent below the 1979-2000 average. This marks the second smallest March Arctic sea ice extent since records began in 1979. The smallest March Arctic sea ice extent occured in 2006 at 14.43 million square km (5.57 million square miles). March 2011 marks the 18th consecutive March and the 118th consecutive month with below average Arctic sea ice extent. During March, ice extent remained below normal on both the Atlantic and Pacific sides of the Arctic, particularly in the Labrador Sea and the Gulf of St. Lawrence.
Arctic sea ice usually expands during the cold season to a March maximum, then contracts during the warm season to a September minimum. According to the National Snow and Ice Data Center, the annual maximum of the Northern Hemisphere sea ice extent occurred on March 7th, marking the beginning of the melt season. The maximum extent occurred near the median date of the historical maximums, which is March 6th. The earliest date for the maximum extent to occur was on February 18th, and the latest was March 31st. The maximum extent was observed to be 14.64 million square km (5.65 million square miles). The maximum extent tied with 2006 as the smallest on record at 1.2 million square km (471,000 square miles) below average; The departure from normal is roughly equal in size to California, Texas, and New York combined.
The March 2011 Southern Hemisphere sea ice extent was 16.2 percent below the 1979-2000 average. This is the third smallest March Southern Hemisphere sea ice extent on record, behind March 2006 and 1980. March Antarctic sea ice extent has increased at an average rate of 2.7 percent per decade, although there is considerable interannual variability. During March, the Southern Hemisphere sea ice began its annual growth season, after reaching its annual minimum extent at the end of February.
For further information on the Northern and Southern Hemisphere snow and ice conditions, please visit the NSIDC News page.