El Niño Strengthening
Sea Surface Temperatures (SSTs) and Mixed Layer Conditions:

July saw the continued strengthening of El Niño across the equatorial tropical Pacific Ocean. The sea surface temperature (SST) anomaly for the Niño 3.4 region increased for a sixth consecutive month and, since May, the SST anomalies of all four Niño regions have been above average. The most recent three–month (May – July) average anomaly exceeded the El Niño threshold for the first time since the December 2006 – February 2007 average anomaly. Additionally, July 2009 is the second consecutive month in which SST anomalies surpassing +0.5°C were present in all of the Niño regions.
For the most recent equatorial Pacific Ocean surface temperatures, please visit NOAA's Tropical Atmosphere Ocean (TAO) project and for weekly or monthly Niño region average SST and anomaly values, visit the Climate Prediction Center's Atmospheric and SST Index values page.

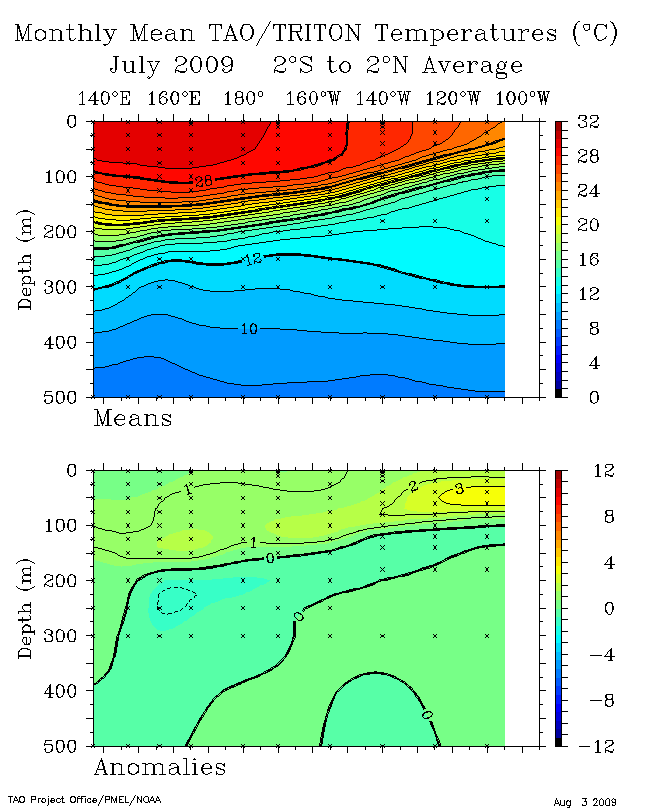
Sub surface oceanic heat content anomalies for the equatorial Pacific Ocean decreased slightly in July, but across the entire region, sub–surface temperatures remained well above average. The majority of cooling of the sub surface layer took place during the latter half of the month in the western equatorial Pacific, while warming occurred in the far east of the basin.


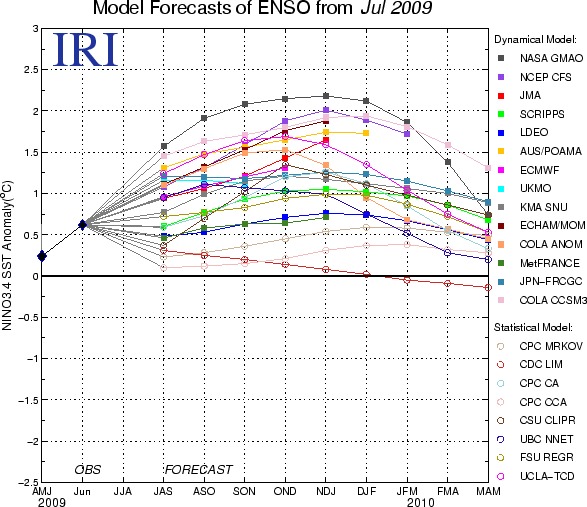
Current observations, recent trends, and the majority of dynamic computer models indicate the likelihood of a continued strengthening of El Niño over the next several months, and the persistence of El Niño through the end of 2009. Historically, impacts over the United States from El Niño tend to be weak during the summer and strengthen toward the winter months. Fall Atlantic hurricane activity may be suppressed during an El Niño due to increased vertical wind shear above the tropical Atlantic. For a comprehensive list of El Niño impacts on the United States, other countries, and globally, please visit NOAA's Pacific Marine Environmental Laboratory El Niño Impacts page.

Equatorial Zonal Winds (U–Component Winds) and Sea–Level Topography:

Trade winds across the equatorial Pacific Ocean continued to be weaker than average during July. The trades weakened appreciably over the area east of the Date Line, but strengthened to above average speed in the far west of the basin. The continued weakening of the basin–wide average is, however, consistent with the development of an El Niño event.


Pacific sea levels measured by the NASA/JPL Jason satellite also continued to reflect El Niño across the tropical Pacific Ocean in July. Below–average sea level existed across the western Pacific to about 180°W, while an area of above–average sea level anomalies was present in the eastern tropical Pacific in the Niño 3 region. The largest sea level anomalies, both positive and negative, were present during the first half of the month, before decreasing in magnitude in the second half of July. The pattern of above average sea level in the eastern equatorial Pacific and below average sea level in the west is historically consistent with El Niño activity.
Outgoing Longwave Radiation (OLR):

Both cloudiness and rainfall west of the Date Line increased in July, contributing to a continued decrease in outgoing longwave radiation (OLR) in that region. OLR east of the Date Line was near average in July, but for the May – July period was above average. For July, the average standardized OLR anomaly, as measured by satellite over the equator between 160°E and 160°W, was –0.8 W/m–2. This is a decrease from June, when the OLR anomaly was +0.3 W/m–2, and represents the first month since January 2007 that it has been below average.
The map below on the left shows the spatial pattern of global OLR (in W/m–2) measured by satellite during July. The level of OLR is related to the amount of cloudiness, and hence convective activity over the region. A lack of convection along the Equator near the Date Line had persisted since the development of the cold event in late May 2007, but cloudiness and convective activity in this region increased markedly over the past few months, while concurrently, convection has been suppressed over Indonesia and Australia. Combined, these patterns indicate a strengthening El Niño.


Southern Oscillation Index (SOI):

The Southern Oscillation Index (SOI), a standardized measure of the surface pressure difference between Tahiti and Darwin (Australia), was +0.1 for the month of July; an increase from –0.3 in June. Typically, prolonged periods of negative SOI values correspond to warmer–than–normal sea surface temperatures and El Niño episodes, while positive SOI values occur in conjunction with ENSO cold phases. However, slightly positive SOI values have occasionally occurred during ENSO warm phase events.
Additional Links
- ENSO Monitoring
- NOAA El Niño / La Niña Index Definition
- NOAA's Pacific Marine Environmental Laboratory (PMEL):
- NOAA's Climate Prediction Center (CPC):
- NOAA's Physical Science Laboratory
- NASA/JPL Ocean Surface Topography from Space
- Australian Bureau of Meteorology (BoM) Climate Driver Update
- IRI - International Research Institute