Weak Cool SST Anomalies Persist, but with Slight Warming
Sea Surface Temperatures (SSTs) and Mixed Layer Conditions:

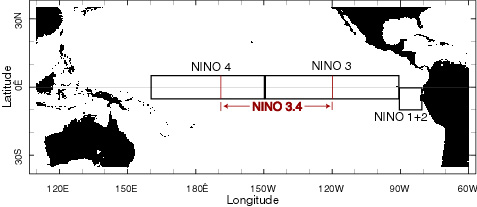
Below-average sea surface temperatures (SST) across the equatorial Pacific Ocean continued during February, but it appears that the peak cooling has passed. All four Niño regions had negative anomalies for the fifth consecutive month. However, the SST anomalies in all four regions experienced warming. The Niño 3.4 region negative SST anomalies weakened in February with a value of -0.69°C (-1.24°F)—an increase of 0.28°C (0.50°F) as compared to January. The SST anomalies in the Niño 4 region (western equatorial Pacific) warmed by 0.08°C (0.14°F). The SST anomalies in the Niño 3 and Niño 1+2 regions warmed only slightly—each by 0.03°C (0.05°F).
For the most recent equatorial Pacific Ocean surface temperatures, please visit NOAA's Tropical Atmosphere Ocean (TAO) project and for weekly or monthly Niño region average SST and anomaly values, visit CPC's Atmospheric and SST Index values page.

Negative subsurface oceanic heat content anomalies persisted in the eastern to central equatorial Pacific, but weakened slightly. Meanwhile, positive subsurface temperature anomalies have persisted in the western equatorial Pacific since late December.
Even though the Niño 3.4 region SST anomalies experienced warming in February, the latest three-month (December-January-February) SST anomaly running mean was -0.8°C (-1.4°F)—a stronger negative value than the previous three-month running mean. This value is below the Oceanic Niño Index (ONI) La Niña conditions threshold of -0.5°C (-0.9°F) for the second consecutive month (NOTE: For NOAA's official ENSO classification scheme, please see NOAA's El Niño/La Niña Index Definition). Five consecutive values at or below this threshold constitutes a La Niña episode.


The majority of dynamic computer models predict warming of Pacific Ocean surface temperatures in the coming months, but the amount of warming varies widely. Based on current observations, recent trends, and model forecasts, the most likely outcome is for sea surface temperatures to warm but remain in the neutral range during the boreal spring (austral fall).
Equatorial Zonal Winds (U-Component Winds) and Sea-Level Topography:

Near-normal trade winds persisted in the central and eastern equatorial Pacific in February while easterlies west of the Date Line, though variable in strength, showed some strengthening overall for the month. Generally, strong low-level easterlies over the equatorial Pacific suggest the possibility of anomalous cooling of the SSTs.


Pacific sea levels measured by the NASA/JPL Jason satellite reflected ENSO-neutral conditions across the tropical Pacific Ocean in February. Much of the central equatorial Pacific was near normal during the month, but with cooler anomalies were evident. An area of negative sea level anomalies persisted into February north and south of the Equator in the central Pacific, and substantial positive anomalies were present in the far western Pacific region again this month.
Outgoing Longwave Radiation (OLR):
Outgoing Longwave Radiation (OLR) values decreased only slightly from +1.8 Wm-2 in January to +1.7 Wm-2 in February. The map below on the left shows the spatial pattern of global OLR (in Wm-2) measured by satellite during February. The lack of convection along the Equator near the Date Line has persisted since the development of the cold event in late May 2007.


The monthly OLR anomaly for February marked the 25th consecutive month that the OLR index had a positive monthly value. Persistently high positive OLR indices are typical of the mature phase of a La Niña episode, while negative values indicate the presence of increased convection and warm phase conditions.
Convection remained enhanced over the western equatorial Pacific and suppressed near the International Date Line. However, in recent months intraseasonal variability has contributed to episodic strengthening and weakening of convection over the western equatorial Pacific.
High frequency variability in OLR is typically associated with the Madden-Julian Oscillation (MJO), which is convective activity that propagates west to east in the near-equatorial region from the Indian Ocean into the Pacific Ocean approximately every 30-60 days. The latest MJO activity can be seen in CPC's graphs of Daily MJO Indices.
Southern Oscillation Index (SOI):

The Southern Oscillation Index (SOI) was once again positive in February for the 9th consecutive month. The standardized monthly averaged value increased from +1.2 in January to +1.8 in February. Consistently positive values of the SOI are typical of La Niña conditions.
Additional Links
- ENSO Monitoring
- NOAA El Niño / La Niña Index Definition
- NOAA's Pacific Marine Environmental Laboratory (PMEL):
- NOAA's Climate Prediction Center (CPC):
- NOAA's Physical Science Laboratory
- NASA/JPL Ocean Surface Topography from Space
- Australian Bureau of Meteorology (BoM) Climate Driver Update
- IRI - International Research Institute