|
Sea-Surface Temperatures (SSTs)
and
Mixed-Layer Conditions: Below normal SST anomalies
developed across the eastern equatorial Pacific and along the South
American coast in
April, which enhanced the equatorial cold-tongue in this
region. In the central and western equatorial Pacific, above
average SST anomalies increased during the month, which were
reflected by increases in the monthly averaged Niño 3.4 and
Niño 4 indices (map of
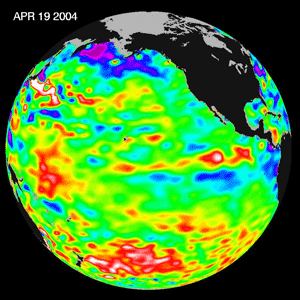
Niño regions). For the most recent oceanic temperature
conditions, please see the loop of satellite-derived
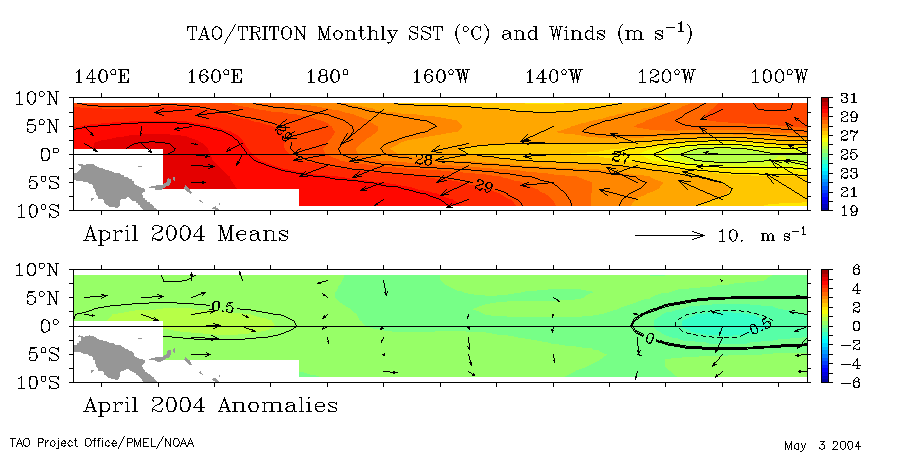
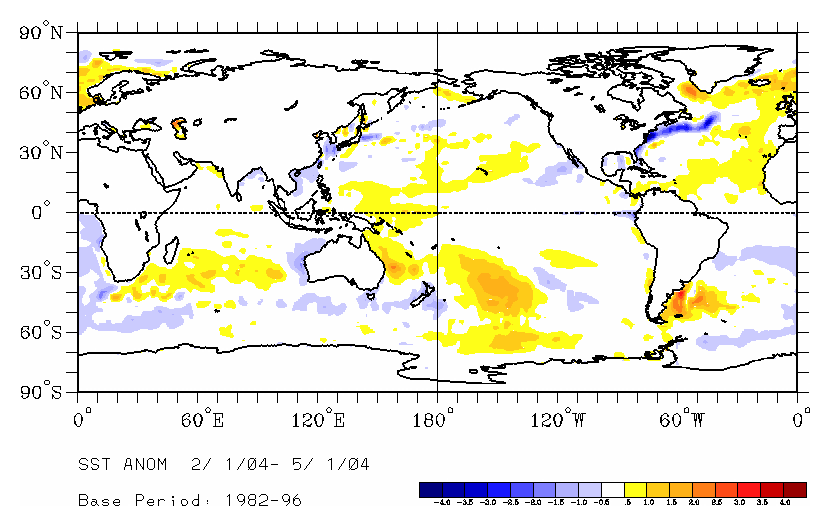
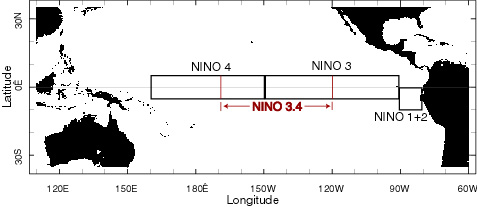
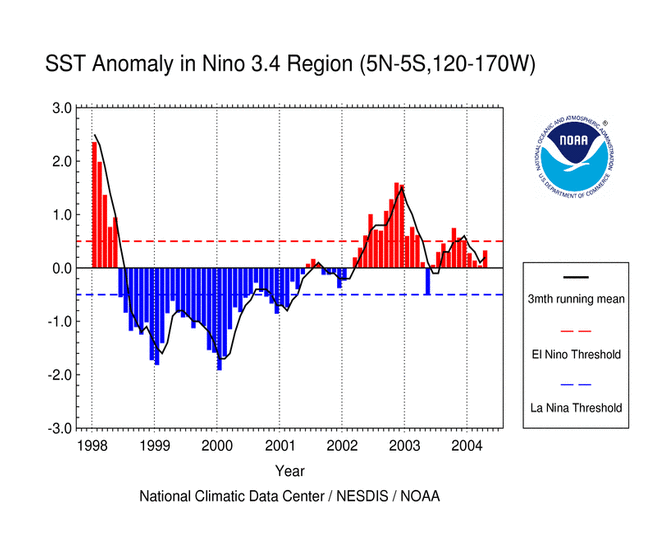
April weekly SST anomalies. The increase in positive SST anomalies in the Niño 3.4 and Niño 4 regions (map of Niño regions) were evident in the data from NCDC's Extended Reconstructed Sea Surface Temperature dataset (ERSST v. 2 - note that this is the first month where version 2 of the ERSST dataset has been used). In April, the Niño 3.4 anomaly warmed to +0.32°C (+0.576°F) above normal, and the 3-month running mean warmed as well, which continued the trend of above average equatorial SST conditions that began in June 2003. A running 3-month mean SST anomaly above +0.5°C in the Niño 3.4 region is one indicator that an El Niño warm event is occurring. (For the official NOAA classification scheme, please see NOAA's El Niño/La Niña Index Definition and see the CPC ENSO Diagnostic Discussion for their latest official assessment of ENSO conditions). Sub-surface temperatures in the mixed-layer remained below normal across the eastern equatorial Pacific region in April. These below normal temperature anomalies were observed between the South American coast and 140°W during April. Warmer water from the western Pacific propagated eastward during the month, and this eastward movement was evident in the loop of April sub-surface ocean temperatures. The cooler surface and sub-surface conditions in the eastern Pacific during April were reflected in a decrease of the monthly average depth of the 20°C isotherm, which is an approximate depth of the center of the oceanic thermocline (the oceanic thermocline in the eastern Pacific is anomalously deeper during El Niño episodes, and shallower during La Niña episodes). |
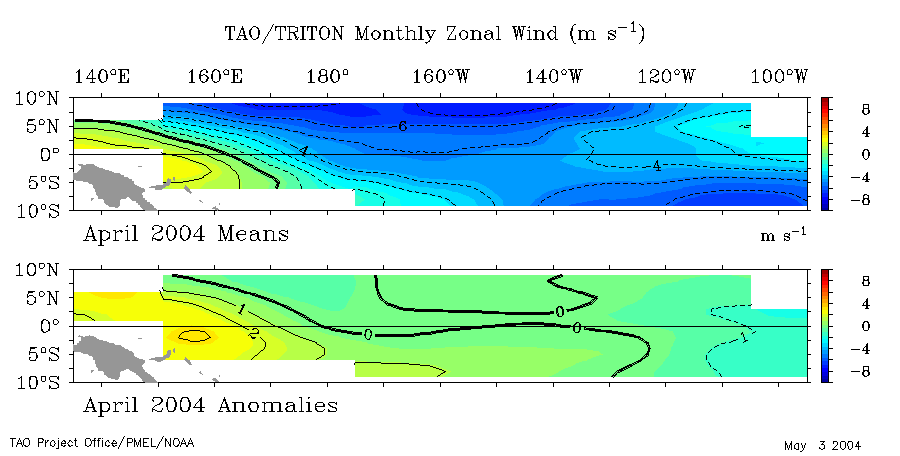  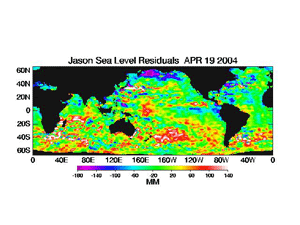 |
Equatorial Zonal
Winds (U-Component Winds) and Sea-Level Topography: Zonal
wind anomalies were negative across the eastern equatorial Pacific
Ocean, and were the result of stronger than average easterly trade
wind flow in April. The trade winds were particularly strong during
the latter half of the month. The observed increase in the trade
winds, which is clearly shown in the loop of April
5-day averaged zonal winds, helped to enhance equatorial
upwelling and the development of the cold-tongue in the eastern
equatorial Pacific. The
April mean clearly illustrates that stronger than average
easterly anomalies were present in the eastern Pacific from South
America to 130°W, as well as a narrow band of negative zonal
wind anomalies immediately along the equator extending westward
from 130°W to the dateline. Satellite altimetry of ocean surface topography from the NASA/JPL Jason-1 satellite over the Pacific basin and global oceans are shown to the left. In the eastern equatorial Pacific, the observed decrease in sea-level and the negative sea-level anomalies began in March and continued into April 2004, which clearly reflects the enhanced trade wind flow in the near-equatorial region that was observed by the TAO buoy array during this time-period. |

|
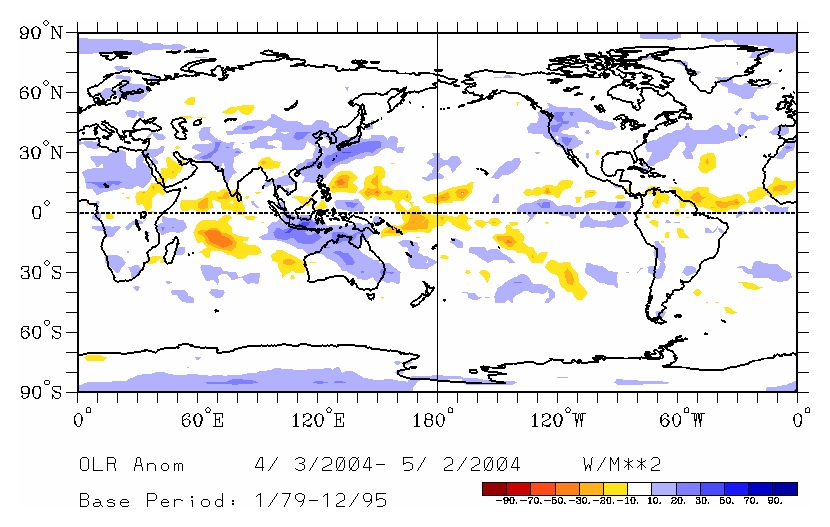
Outgoing
Longwave Radiation (OLR): The average OLR index value for April was negative across the region centered over the western Pacific between 160°E and 160°W. The April index was the second consecutive negative monthly value, which was preceded by a series of abrupt shifts that began in January 2004 when the index switched from a nine-month period of positive values. The map to the left shows the spatial pattern of OLR anomalies in April. These OLR anomalies reflected areas of enhanced convection north of Indonesia in the northwestern tropical Pacific, while convection was suppressed over the equatorial eastern Pacific region. High frequency variability in OLR is typically associated with the Madden-Julian Oscillation (MJO) (MJO related convective activity propagates west to east in the near-equatorial region from the Indian Ocean into the Pacific Ocean approximately every 30-60 days). Enhanced convection related to MJO activity propagated eastward across the equatorial Pacific in late March, and another, albeit weaker, MJO event moved across the Pacific basin in April. Despite the influence of MJO activity, deep tropical convection remained over the far western part of the Pacific Basin, and no significant tropical convection had developed east of the dateline. The latest MJO activity can be seen in CPC's graphs of Daily MJO Indices. |
 |
Southern Oscillation Index (SOI): The standardized SOI was negative for the second consecutive month, with an averaged index value of -1.3 for April. Since November 2003, the SOI has switched signs several times, reflecting the lack of any consistent mean-sea-level pressure pattern across the tropical Pacific associated with ENSO. The observed oceanic and atmospheric indices in April suggest that near-neutral ENSO conditions have remained across the equatorial Pacific basin. Although cooler SSTs in the eastern Pacific may appear to indicate a shift toward an ENSO cold event (i.e. La Niña), it is interesting to note that similar conditions developed in May 2003, but were abruptly changed due to MJO activity that generated an oceanic Kelvin wave in May-June 2003. Atmospheric forcing (i.e. westerly wind bursts) associated with past El Niños and La Niñas has developed quickly, and therefore conditions will be monitored closely over the critical May-June period for potential changes in the state of ENSO. |
Additional Links
- ENSO Monitoring
- NOAA El Niño / La Niña Index Definition
- NOAA's Pacific Marine Environmental Laboratory (PMEL):
- NOAA's Climate Prediction Center (CPC):
- NOAA's Physical Science Laboratory
- NASA/JPL Ocean Surface Topography from Space
- Australian Bureau of Meteorology (BoM) Climate Driver Update
- IRI - International Research Institute