|
Sea-Surface Temperatures (SSTs)
and
Mixed-Layer Conditions: Slightly above average
sea-surface temperatures (SST) remained across the western and
central equatorial Pacific in
February, but SST anomalies decreased during the past two
months, and were cooler than normal across the eastern Pacific in
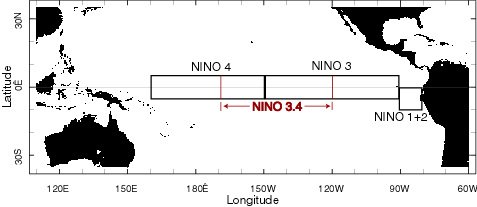
the Niño 1+2 region (map of
Niño regions). For the lastest oceanic temperature
conditions, please see the loop of satellite images of February
weekly SST anomalies. Sub-surface temperatures were cooler than normal in the eastern Pacific in February. Previously, the +2°C mixed-layer anomalies present back in December near 110°W were absent from the January average. However, positive sub-surface temperature anomalies in the central Pacific mixed-layer intensified in January, and propagated eastward during February, and were centered at approximately at 120°W for the month. This movement was evident in a loop of February sub-surface ocean temperatures, and was associated with an eastward propagating oceanic Kelvin Wave. This Kelvin Wave was inititated by a weakening of the equatorial easterlies and enhanced MJO activity in late December. At current rates of propagation (about 8-10 degrees of longitude per week) it is expected to reach the South American coast by mid-March. The cooler surface and sub-surface conditions in the eastern Pacific were reflected in a small reduction of the monthly average depth of the 20°C isotherm, which is used as an approximate depth of the oceanic thermocline (the oceanic thermocline in the eastern Pacific is anomalously deeper during El Niño episodes, and shallower during La Niña episodes). SSTs in the Niño 3.4 region (map of Niño regions) were again warmer than normal, based on data from NCDC's Extended Reconstructed Sea Surface Temperature dataset (ERSST). February was the eighth consecutive month where the observed SST anomaly was above average for the central Pacific. Although warmer than average, the February anomaly in the Niño 3.4 region decreased in February, and was only +0.15°C (+0.27°F), while the 3-month running mean cooled as well, remaining below +0.5°C. A running 3-month mean SST anomaly above +0.5°C in the Niño 3.4 region is one indicator that an El Niño warm event is occurring. (For the official NOAA classification scheme, please see NOAA's El Niño/La Niña Index Definition and see the CPC ENSO Diagnostic Discussion for their latest official assessment of ENSO conditions.) |
|
Equatorial Zonal Winds (U-Component Wind): Equatorial zonal wind anomalies were negative in February, reflecting stronger than average easterly trade wind flow across the Pacific basin. This observed increase in the near-equatorial trade winds is clearly shown in the February 5-day averaged zonal winds. The 5-day averages illustrate high-frequency fluctuations in the strength of the Trade winds, but overall the February monthly mean showed that the stronger than average easterlies propagated across equatorial Pacific to the dateline. |
|
Outgoing
Longwave Radiation (OLR): Although week-to-week variability in OLR anomalies continued in February, the average OLR index value for the month was positive across the region centered between 160°E and 160°W. The positive February anomaly was an abrupt shift from January's negative value, which had been the first month since March 2003 with a negative monthly anomaly. However, the map to the left for the period February 9 through March 9 clearly shows a widespread area of negative anomalies in the western Pacific, which is indicative of enhanced convection. In general, areas of enhanced convection were present across Indonesia and other areas in the western Pacific, while areas of suppressed convection were present over the central Pacific. Therefore, the February OLR signal indicated near-neutral conditions, and was not indicative of an El Niño warm event. The week-to-week variability in OLR was associated with the Madden-Julian Oscillation (MJO). MJO related convective activity propagates west to east in the near-equatorial region from the Indian Ocean into the Pacific Ocean approximately every 30-60 days. MJO activity in January propagated eastward in early-February, and another, albeit weaker, MJO event moved into the basin in mid-February. Despite the influence of the MJO, deep tropical convection remained over the far west of the Pacific Basin, and no significant anomalies had developed east of the dateline. The latest MJO activity can be seen in CPC's graphs of Daily MJO Indices. |
|
Southern Oscillation Index (SOI): The standardized SOI abruptly shifted again from negative to positive in February. Since November, the SOI has switched signs each month, reflecting the lack of any sustained and persistent trend in the mean-sea-level pressure pattern across the Pacific basin. Previously, the SOI had been negative for most of the past 24 months. Strongly negative values of the SOI are often indicative of El Niño conditions, with strongly positive values indicative of La Niña conditions. Careful monitoring of the SOI and other atmospheric and oceanic indices will be critical over the next three months, since ENSO warm and cold events are typically initiated during latter half of the Northern Hemisphere spring (April-June). Overall, the current set of indicators suggest near-neutral conditions and no clear movement toward a cold or warm event. However, factors influencing past events have developed quickly, and therefore conditions must be monitored closely over the critical April-June period . |
Additional Links
- ENSO Monitoring
- NOAA El Niño / La Niña Index Definition
- NOAA's Pacific Marine Environmental Laboratory (PMEL):
- NOAA's Climate Prediction Center (CPC):
- NOAA's Physical Science Laboratory
- NASA/JPL Ocean Surface Topography from Space
- Australian Bureau of Meteorology (BoM) Climate Driver Update
- IRI - International Research Institute