ENSO WARM EVENT CONTINUES IN CENTRAL
PACIFIC:
SST anomaly exceeds 0.5 °C for 5th consecutive month in
Niño 3.4 region
|
Sea-Surface
Temperatures (SSTs) and
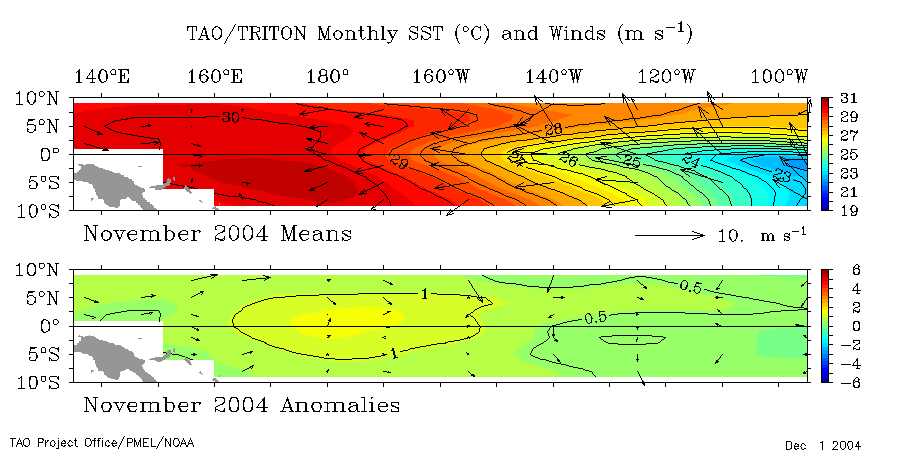
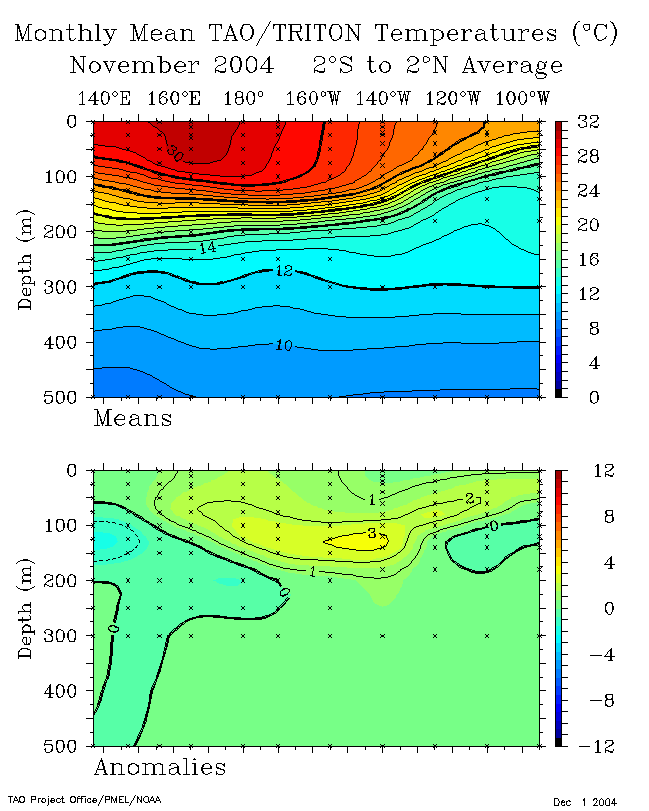
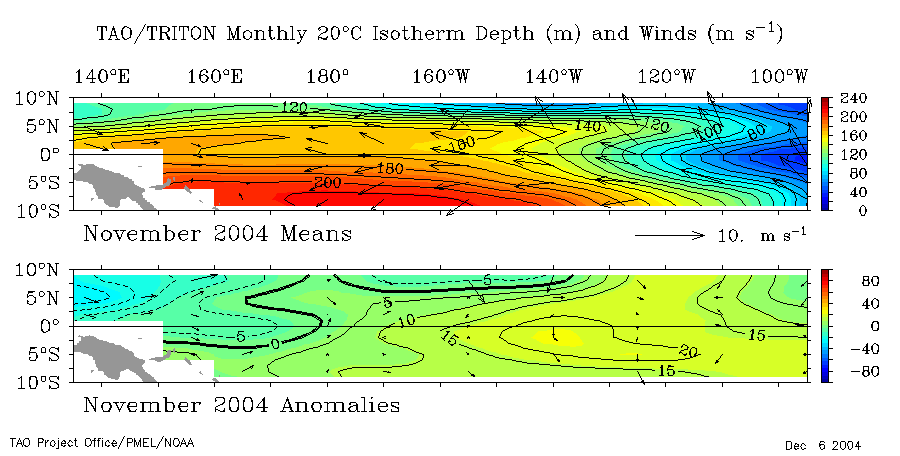
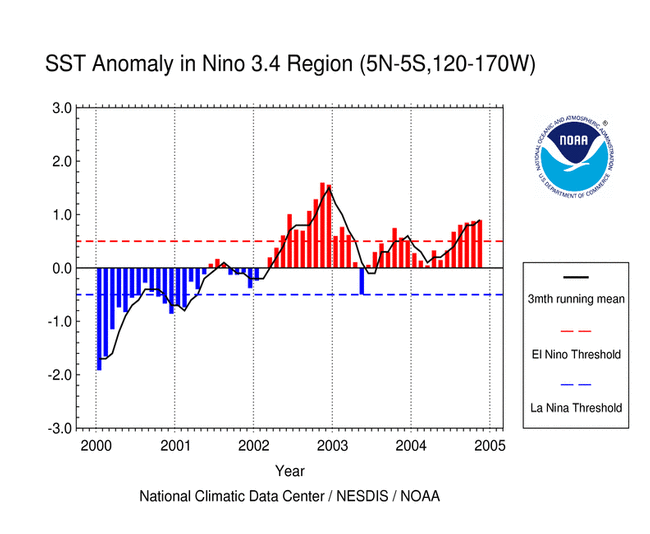
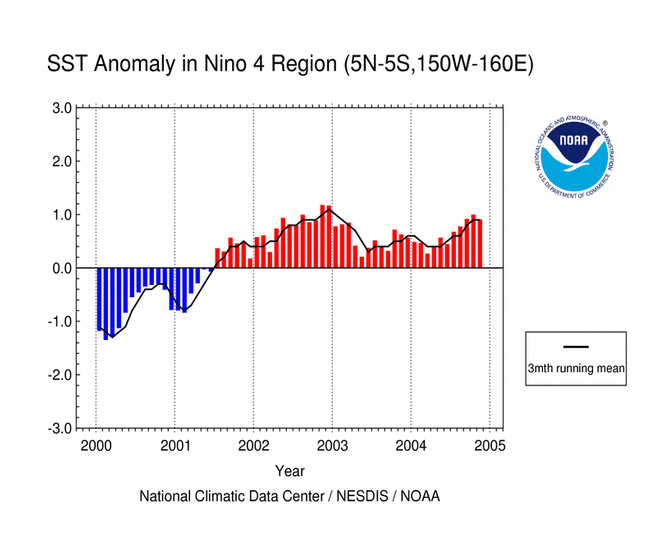
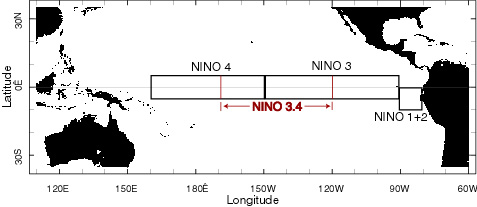
Mixed-Layer Conditions: SST anomalies remained above normal in November across the central equatorial Pacific, which led to a slight increase in the monthly averaged Niño 3.4 index. Above average ocean temperatures were also observed in the mixed-layer, with the largest temperature anomalies reaching 3°C at approximately 100 m depth between 160°W and 140°W. In addition, the depth of the 20°C isotherm increased in November. In the central equatorial Pacific, above normal SST anomalies also increased during November, which were reflected in the monthly averaged SST anomalies in the Niño 3.4 index. The western Pacific SST anomaly cooled slightly in November, as reflected in the Niño 4 index (map of Niño regions). For the most recent ocean surface temperature conditions, please see the loop of satellite-derived weekly SST anomalies for November. The SSTs across the equatorial Pacific have increased over the past several months, and this can be seen in the data from NCDC's Extended Reconstructed Sea Surface Temperature dataset (ERSST version 2). For November, the Niño 3.4 index increased slightly to +0.89°C (+1.6°F) above normal, and the 3-month running mean of the Niño 3.4 index was well above +0.5°C. (NOTE: A running 3-month mean SST anomaly above +0.5°C in the Niño 3.4 region is one indicator that an El Niño is occurring. For the official NOAA classification scheme, please see NOAA's El Niño/La Niña Index Definition and see the CPC ENSO Diagnostic Discussion for their latest official assessment of ENSO conditions.) |
 |
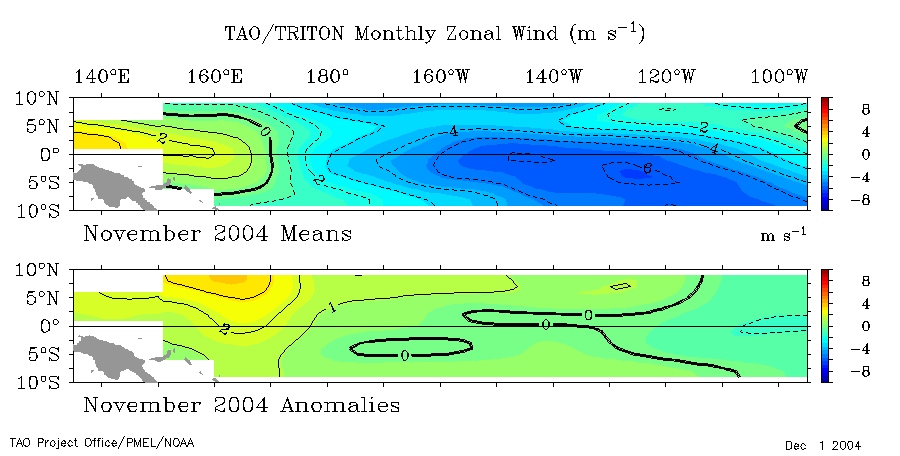
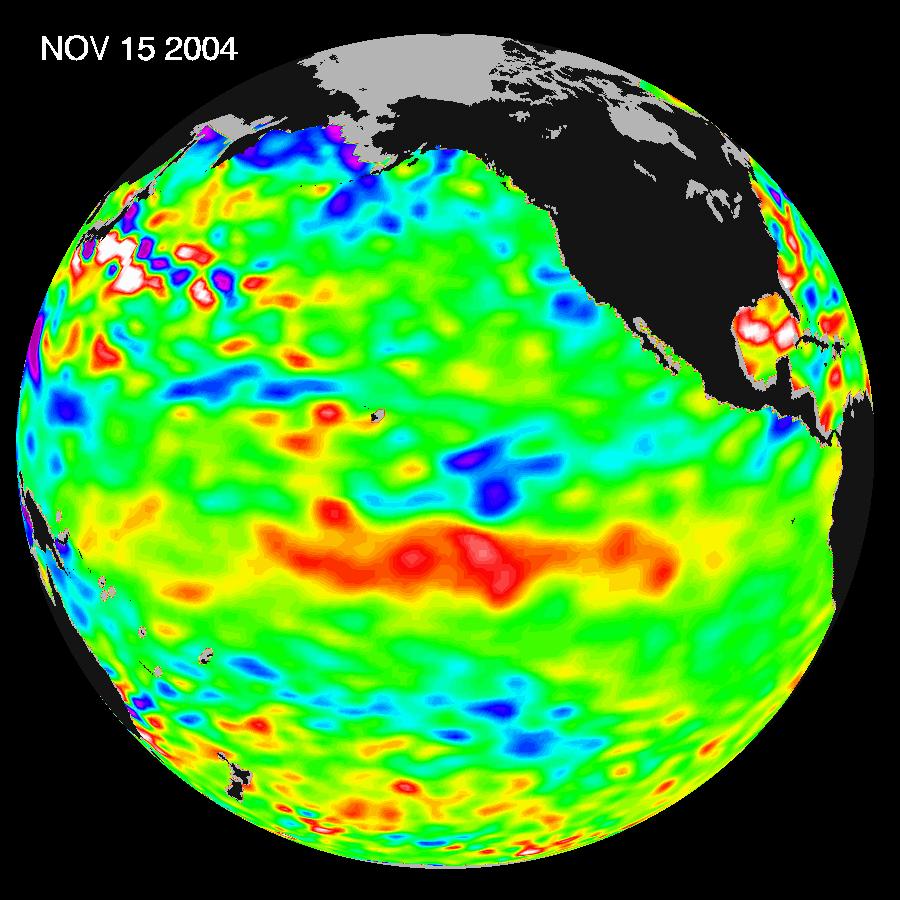
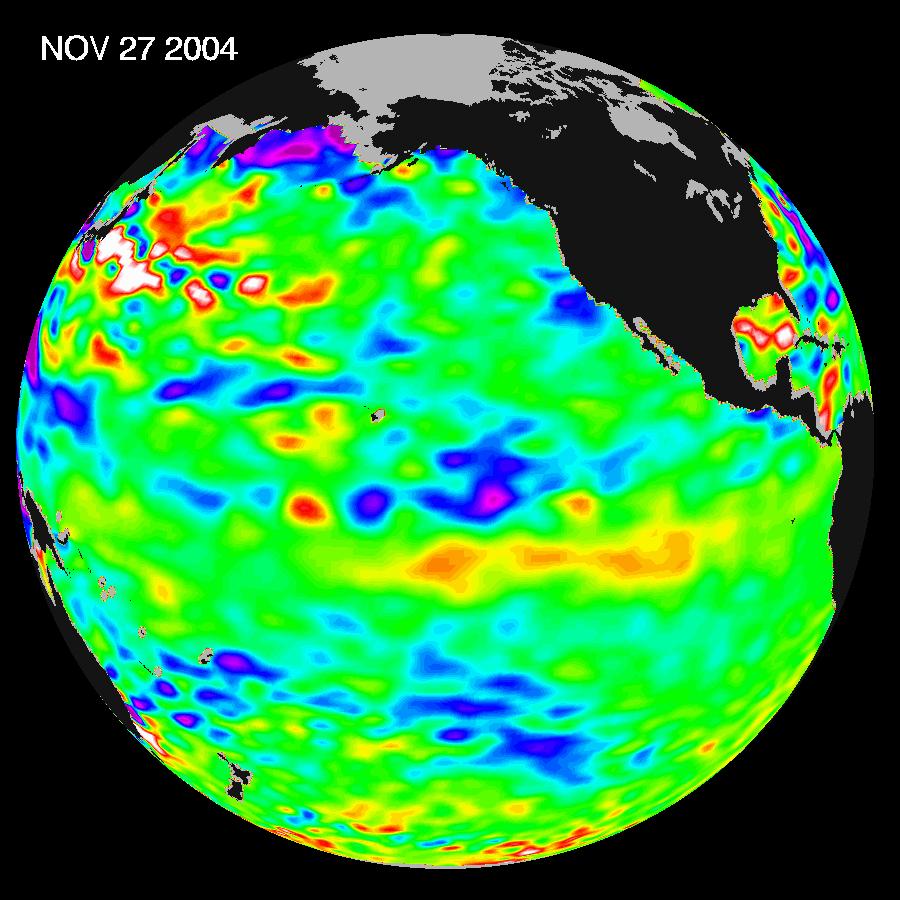
Equatorial Zonal
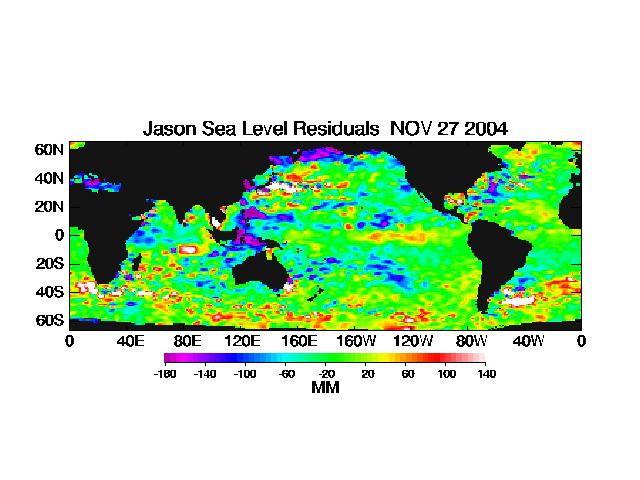
Winds (U-Component Winds) and Sea-Level Topography: The easterly trade winds were below normal across much of the western equatorial Pacific basin during November. The below normal easterly flow during the month weakened equatorial upwelling, which led to a slight increase in the monthly averaged SST anomaly across the central equatorial Pacific region. Despite the below average zonal wind field from Indonesia eastward past the dateline, moderate trade wind flow and above average easterly zonal wind anomalies were present from the central Pacific to the South American coast. Satellite altimetry of ocean surface topography from the NASA/JPL Jason-1 satellite over the Pacific basin and global oceans is shown to the left. Increases in sea-level, shown on these images as positive sea-level anomalies, developed in the western equatorial Pacific in October and were associated with an oceanic Kelvin wave, which subsequently propagated eastward during November. However, the most recent overpass shows that the sea level rise associated with this Kelvin wave has decreased, which suggests that it began to dissipate as it moved into the eastern equatorial Pacific and toward the South American coast (see both the 15 November 2004 and 27 November 2004 overpasses). |
|
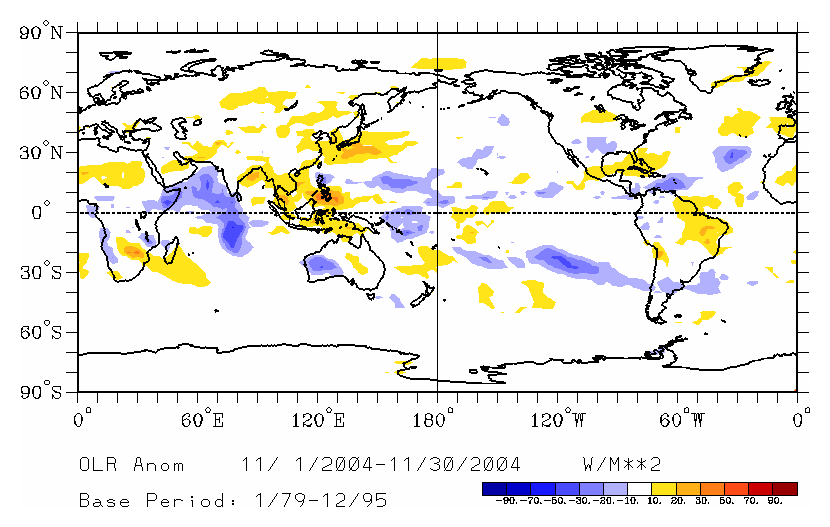
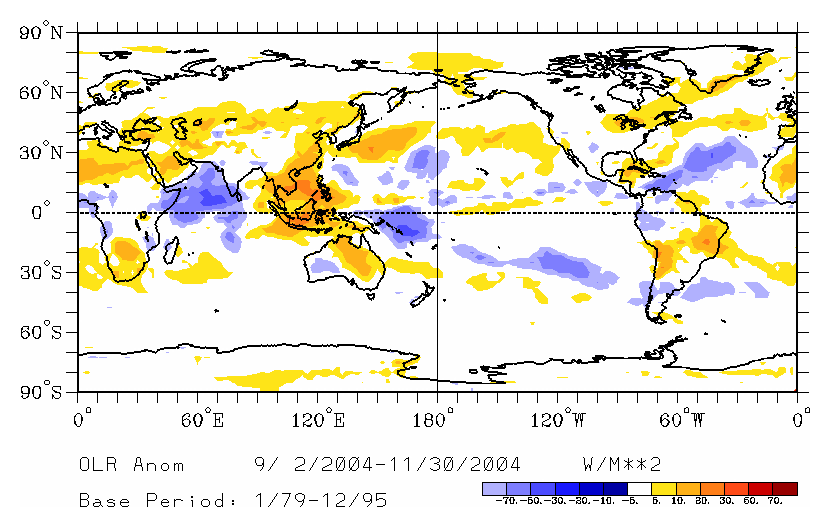
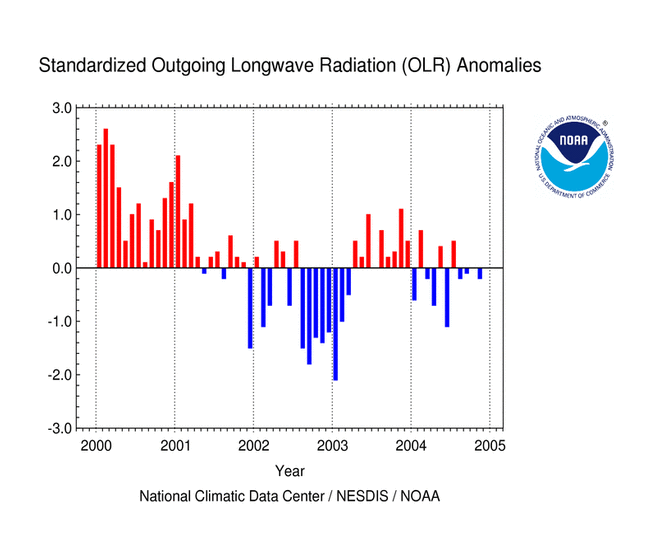
Outgoing Longwave Radiation (OLR): The map to the left shows the spatial pattern of global OLR (in W m-2) observed by satellite in November. The above average OLR anomalies in the western Pacific west of the dateline reflected areas of enhanced tropical convection, while areas east of the dateline along the equator were near-normal. In general, the majority of the equatorial Pacific region had near-normal OLR and small departures from normal during November. The only exception was an area of negative OLR anomalies in the northwest Pacific associated with tropical cyclone activity. The 3-month averaged OLR anomalies were also near-normal along the equator from the dateline to the South American coast. The monthly averaged OLR Index value for November was -0.2 across the region centered over the dateline in the western Pacific between 160°E and 160°W. Therefore, the convective response of the atmosphere to the warm SST anomalies in the western and central equatorial Pacific has been limited, since the OLR Index remains near-neutral (although slightly negative). In fact, there has been no persistent trend in the OLR Index, which has shifted signs several times in 2004. High frequency variability in OLR is typically associated with the Madden-Julian Oscillation (MJO) (MJO related convective activity propagates west to east in the near-equatorial region from the Indian Ocean into the Pacific Ocean approximately every 30-60 days). The latest MJO activity can be seen in CPC's graphs of Daily MJO Indices. |
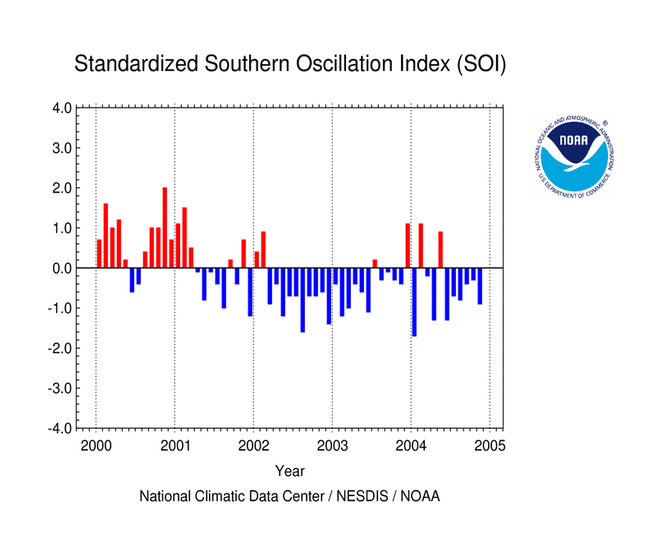 |
Southern Oscillation Index (SOI): The standardized SOI remained negative for the sixth consecutive month in November, with an average index value of -0.9 for the month. Negative SOI values are consistent with ENSO warm event (i.e. El Niño) conditions. The trend in SOI during the past six months has fluctuated several times between a near-neutral value and a more negative index associated with warm event conditions, which suggests that the atmosphere has lagged behind the ocean in response to the above average SSTs during the past few months. Therefore, El Niño conditions in the equatorial Pacific remained weak to moderate at the end of November. |
Additional Links
- ENSO Monitoring
- NOAA El Niño / La Niña Index Definition
- NOAA's Pacific Marine Environmental Laboratory (PMEL):
- NOAA's Climate Prediction Center (CPC):
- NOAA's Physical Science Laboratory
- NASA/JPL Ocean Surface Topography from Space
- Australian Bureau of Meteorology (BoM) Climate Driver Update
- IRI - International Research Institute