

|
Sea-Surface Temperatures (SSTs)
and
Mixed-Layer Conditions: Warmer than average sea-surface
temperatures (SST) remained across much of the equatorial Pacific
in
January, but temperatures
were cooler than the October - early December 2003 peak values
in all four Nino regions. For the latest oceanic temperature
conditions, please see the loop of satellite images of January
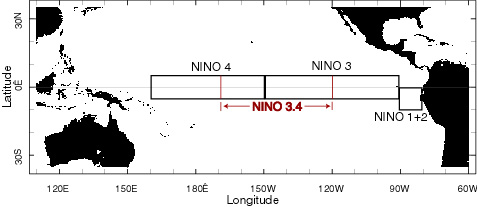
weekly SST anomalies. In the oceanic mixed-layer, temperatures were cooler in the eastern Pacific as the +2°C anomalies present in December near 110°W were absent from the January average. However the positive sub-surface temperature anomaly in the central Pacific mixed-layer intensified and moved further east. This movement is evident in a (loop of January sub-surface ocean temperatures) and is associated with an eastward propagating Kelvin Wave. This Kelvin Wave was inititated by a weakening of the equatorial easterlies and enhanced MJO activity in late December and is expected to reach the South American coast by the end of February, according to NOAA's Climate Prediction Center (CPC) . The cooler surface and sub-surface conditions in the eastern Pacific were reflected in a small reduction of the monthly average depth of the 20°C isotherm, which is used as an approximate depth of the thermocline. (The oceanic thermocline in the eastern Pacific is deeper during El Niño episodes.) The depth was less than 50 meters by late January in the equatorial region east of 100°West. SSTs in the Niño 3.4 and Niño 4 regions were again warmer than normal based on data from NCDC's Extended Reconstructed Sea Surface Temperature dataset (ERSST) (map of Niño regions). This is the seventh and eighth consecutive months, respectively, where the observed SST anomalies were above average for the central and western Pacific Niño regions. Although warmer than average, the January anomaly in the Niño 3.4 region was less than +0.5°C (+.90°F) for the first time since September 2003 and the 3-month running mean was +0.49°C. A running 3-month mean SST anomaly above +0.5°C in the Niño 3.4 region is one indicator that a warm event is occurring. (For the official NOAA classification scheme, please see NOAA's El Niño/La Niña Index Definition and see the CPC ENSO Diagnostic Discussion for the latest official assessment of ENSO conditions.) |

|
Equatorial Zonal Winds (U-Component Wind): As in recent months, there continued to be considerable variability in equatorial winds from week to week during January. The westerly component present in the western and central Pacific in late December propagated eastward during January as shown in this animation of 5-day averaged zonal winds, but the equatorial easterlies became stronger during the latter half of the month throughout the equatorial Pacific. For January, the averaged zonal (U-component) wind-field reflected the weaker than average easterlies in the central Pacific during the first half of the month. These equatorial wind fields are measured by NOAA's Tropical Atmosphere-Ocean (TAO) Array buoy network. |

|
Outgoing
Longwave Radiation (OLR): Although week-to-week variability in anomalies of Outgoing Longwave Radiation also continued in January, the average OLR for the month was negative in the region centered between 160°E and 160°W. This was the first occurrence of negative OLR anomalies since March 2003. However, the map to the left for the period January 13 through February 11 shows widespread areas of positive anomalies in the central Pacific, which is indicative of suppressed convection. Areas of enhanced convection were present in Indonesia, northern Australia and other areas in the western Pacific. The week-to-week variability in OLR is associated with the Madden-Julian Oscillation (MJO). MJO related convective activity propagates west to east in the near-equatorial region from the Indian Ocean into the Pacific Ocean approximately every 30-60 days. Indications of the convectively active phase of the MJO over the Indian Ocean in late January suggests that enhanced convection may shift into the western and central Pacific in February. The latest MJO event can be seen in CPC's graphs of Daily MJO Indices. |

|
Southern Oscillation Index (SOI): Although the standardized SOI abruptly shifted from negative to positive in December, it returned to its negative phase in January. The SOI has been negative for most of the past 24 months. Strongly negative values of the SOI are often indicative of El Niño conditions. Continued monitoring of these and other conditions in the equatorial Pacific in coming months will help determine the evolution of ENSO. |
Additional Links
- ENSO Monitoring
- NOAA El Niño / La Niña Index Definition
- NOAA's Pacific Marine Environmental Laboratory (PMEL):
- NOAA's Climate Prediction Center (CPC):
- NOAA's Physical Science Laboratory
- NASA/JPL Ocean Surface Topography from Space
- Australian Bureau of Meteorology (BoM) Climate Driver Update
- IRI - International Research Institute