Issued 13 January 2022
Please note that the values presented in this report are based on preliminary data. They will change when the final data are processed, but will not be replaced on these pages.


National Drought Overview


(Very warm and very wet are defined as temperatures or precipitation in the upper tenth percentile of the historical record. Very cold and very dry are defined as temperatures or precipitation in the lowest tenth percentile of the historical record.)
Overall, when integrated across the nation and across the entire year, 2021 was a warm year with precipitation averaging near the middle of the historical distribution. The annual nationwide ranks were fourth warmest and 57th wettest (71st driest), based on data for 1895-2021. But this was a year of extremes as considerable variation occurred throughout the year and across the country. The year was unusually wet from the Gulf of Mexico coast to the eastern Great Lakes and southern portions of New England, where Massachusetts had the ninth wettest year on record and three other states ranked in the top twenty wettest category. The year ended up unusually dry across parts of the West (especially the Pacific Northwest), northern Plains to western Great Lakes, southern Florida, the Mid-Atlantic states, and northern portions of New England, with Montana having the ninth driest year on record. Unusually warm temperatures characterized much of the year across the West and northern Plains to Northeast, with 35 states ranking in the top ten warmest category.
Weather conditions varied across the country from month to month during 2021, with short-term very dry conditions and unusual anomalous warmth frequently occurring. Some areas were excessively dry during one part of the year and excessively wet during another part:
- About five percent or more of the contiguous U.S. (CONUS) was very dry during every month except January, August, and October, with ten percent or more very dry in March (14.8%), April (18.7%), May (15.7%), June (18.6%), November (35.3%), and December (11.1%). Nationwide, November was driest with more than a third of the CONUS very dry. Expansive very wet conditions balanced the large dry areas (on a national basis) during March, June, and December. Five percent or more of the CONUS was very wet during every month except January, April, and November, with ten percent or more very wet during March (10.5%), June (10.5%), July (18.5%), August (14.9%), October (26.2%), and December (12.2%). During February to June, more of the country was very dry than very wet, but in July, August, and October more of the country was very wet than very dry.
- Unusually warm temperatures dominated much of the country during most months, especially beginning in June. At least ten percent of the CONUS was very warm in every month but February, April, and May. About a third (33%) or more was very warm in March (32.4%), June (58.3%), July (37.2%), August (30.8%), September (45.8%), October (37.9%), November (47.4%), and December (62.7%). Above-normal temperatures enhance evapotranspiration which worsens drought conditions. This was especially a problem during June-December for the West, Plains, Great Lakes, Mid-Atlantic states, and southern Florida. Only one month had more than one percent of the CONUS very cold — February (26.9%).
-
Several areas that were very dry during one part of the year and very wet during another part include:
- the Southwest (dry during the first half of the year, wet during the summer and December)
- California-Nevada (dry February-September and November, wet October and December)
- the northern Plains (dry spring and summer, wet October and December)
- the southern Plains (wet May-August, dry September and November-December)
The Palmer Z Index incorporates moisture supply (precipitation) and moisture demand (evapotranspiration) to depict the total moisture status each month. The Palmer Z Index maps below show the monthly moisture status for each month in 2021:


On a national scale, large areas of drought affected the country throughout 2021. The year began (January 5) with drought and abnormal dryness in most of the West and Plains, and parts of the Midwest, Northeast, Hawaii, and Puerto Rico, covering about 45.8 percent of the CONUS (38.3 percent of the 50 States and Puerto Rico) according to U.S. Drought Monitor (USDM) statistics. The drought area expanded then slightly contracted then expanded again through a few such cycles throughout the year, reaching a minimum area of 43.4 percent of the CONUS (36.3 percent of the 50 States and Puerto Rico) on May 25 and a maximum of 55.5 percent of the CONUS (46.5 percent of the 50 States and Puerto Rico) on December 7. Drought contracted in the southern Plains but expanded in the Great Lakes and Mid-Atlantic by the middle of the year, then contracted in the Great Lakes and Mid-Atlantic and expanded in the southern Plains a few months later, with drought persisting in the West, northern Plains, and northern New England throughout this period. In the waning months of the year, drought returned to the Mid-Atlantic, persisted in the western Great Lakes, and intensified in the southern Plains, while improving but persisting in the West and northern Plains. The year ended (based on the USDM map for January 4, 2022) with a little more than half of the CONUS in drought (54.8 percent of the CONUS and 45.8 percent of the U.S. including Puerto Rico). A USDM record was set for the percent area of the U.S. experiencing the most extreme categories. On August 17, 2021, 26.8 percent of the CONUS was experiencing extreme to exceptional drought. This is the largest extreme to exceptional drought area in the 2000-2021 USDM record and more than the previous peaks of 24.1 percent which occurred on August 7, 2012 and 23.7 percent which occurred on August 20, 2002. (For the 50 states and Puerto Rico, the peak values are 22.4 percent on 8/17/2021, 20.2 percent on 8/7/2012, and 19.8 percent on 8/20/2002.)
The USDM maps for the end of each month in 2021:


Palmer Drought Index* monthly statistics, which go back to the beginning of the 20th century, indicate that 38.2 percent of the CONUS was in moderate to extreme drought at the beginning of 2021 (end of January). Like the USDM statistics, the Palmer percentage experienced ups and downs throughout the year, reaching a peak of 48.5 percent at the end of June and ending the year at 41.2 percent.

| Month | USDM CONUS |
USDM all of US |
Palmer CONUS |
Very Dry |
Very Warm |
|---|---|---|---|---|---|
| Jan | 45.8 | 38.3 | 38.2 | 2.3 | 13.0 |
| Feb | 46.6 | 39.0 | 37.5 | 8.0 | 1.1 |
| Mar | 43.9 | 36.7 | 38.4 | 14.8 | 32.4 |
| Apr | 48.4 | 40.4 | 44.2 | 18.7 | 8.8 |
| May | 43.7 | 36.5 | 41.6 | 15.7 | 7.1 |
| Jun | 47.2 | 39.5 | 48.5 | 18.6 | 58.3 |
| Jul | 46.3 | 40.0 | 43.1 | 8.2 | 37.2 |
| Aug | 46.6 | 39.0 | 42.5 | 1.9 | 30.8 |
| Sep | 47.8 | 40.1 | 44.5 | 7.3 | 45.8 |
| Oct | 47.8 | 40.0 | 35.5 | 0.0 | 37.9 |
| Nov | 53.4 | 44.8 | 41.5 | 35.3 | 47.4 |
| Dec | 54.8 | 45.8 | 41.2 | 11.1 | 62.7 |
*This drought statistic is based on the Palmer Drought Index, a widely used measure of drought. The Palmer Drought Index uses numerical values derived from weather and climate data to classify moisture conditions throughout the contiguous United States and includes drought categories on a scale from mild to moderate, severe and extreme.
Regional Drought Overview
West Overview


The West (Rocky Mountains to Pacific Coast) has been suffering from a multi-year drought characterized by years with low precipitation and persistent unusual warmth. Half or more of the last 20 years have been drier than the long-term average, with 2013 ranking as the second driest year regionwide in the 1895-2021 record, 2020 ranking as fourth driest, 2002 seventh driest, 2007 13th driest, and 2009 18th driest. Summer monsoon rains and Pacific weather systems in October and December improved 2021's rank to 35th driest. The West has experienced a general and persistent increasing trend in temperatures for the last 40 years. Nine of the top ten warmest years have occurred since 2003 and 14 of the warmest 20 years have occurred since 2000. These include 2015 (warmest year in the 127-year record), 2014 (third warmest), 2021 (fourth warmest), and 2020 (fifth warmest). The only year in the top ten category that wasn't from the 21st century was 1934 (second warmest).


Some other 2021 regionwide ranks: The 2021 water year (October 2020-September 2021) ranked as the fourth driest water year on record since it excludes the precipitation that fell in October and December 2021. If the summer monsoon rains are also excluded, the West had the driest July-June 12-month period on record in 2021. The last two years have been especially dry for the West, with July 2019-June 2021 ranking as the driest such 24-month period on record.


The corresponding westwide temperature ranks for the water year (October-September), July-June 12-month period, and July-June 24-month period are fifth warmest, fourth warmest, and fifth warmest, respectively. The excessive heat in the West occurred more during the middle to end of the year. In 2021, June-December, April-September, and June-September each ranked warmest on record for their period.

The West (defined here as the 11 western states) ended 2020 with 78.6 percent of the area covered by moderate to exceptional drought based on the USDM. The most intense areas of extreme to exceptional drought were in the Southwest (Four Corners states) with extreme drought extending across California and Nevada and into the Pacific Northwest and northern Rockies. The drought coverage decreased in early spring 2021, reaching a 2021 minimum of 74.5 percent on March 23. The drought area steadily increased from there to reach a 2021 maximum of 94.6 percent of the West on December 7. The epicenter of drought shifted from the Southwest to California and Nevada, the Pacific Northwest, and the northern Rockies as exceptional heat exacerbated the lack of precipitation in these latter areas during spring and summer, and as the return of summer monsoon rainfall reduced the intensity of drought in the Southwest. October atmospheric river events reduced the intensity of drought in California-Nevada and the Pacific Northwest. This was followed by an unusually warm and dry November. A series of fronts and low pressure systems brought Pacific moisture regionwide in December, further reducing the intensity of drought. By the end of 2021 (January 4, 2022 USDM map), the western drought area had been reduced to 89.3 percent.
The December 7, 2021 maximum of 94.6 percent of the West in moderate to exceptional drought set a record in the 2000-2021 USDM history for the region. On July 20, 2021, 59.5 percent of the West was covered in extreme to exceptional drought, which was also a USDM record.


Based on the Palmer Drought Index, 2021 began with 82.0 percent of the West experiencing moderate to extreme drought. The percentage dropped to 79.0 percent by the end of February, but shot up to 99.0 percent by the end of June 2021. This exceeded the previous record in the 1900-2021 Palmer history of 94.4 percent which occurred in September 1934. The drought area declined to 64.9 percent in response to the October 2021 atmospheric river events, rose to 78.4 percent due to the dryness and heat of November, then fell again with the December rain and snow, ending the year at 59.5 percent which was the minimum for 2021.
Pacific Northwest


Parts of the Pacific Northwest had been in drought throughout 2020. The region began 2021 with about 36.5 percent of the Pacific Northwest in moderate to extreme drought. Near-normal to wet conditions early in the year decreased the drought area, but dry conditions beginning in March combined with record heat in the summer to rapidly expand drought. The Pacific Northwest experienced the hottest June-July and second driest March-July and March-August in the 127-year record. The drought area peaked in August and early September at about 94.2 percent of the region. Wet conditions beginning in September contracted the drought area, with the year ending at about 76.1 percent in moderate to exceptional drought. Coastal areas fared best, with the areas to the lee of the Cascades and eastward experiencing the most severe drought.
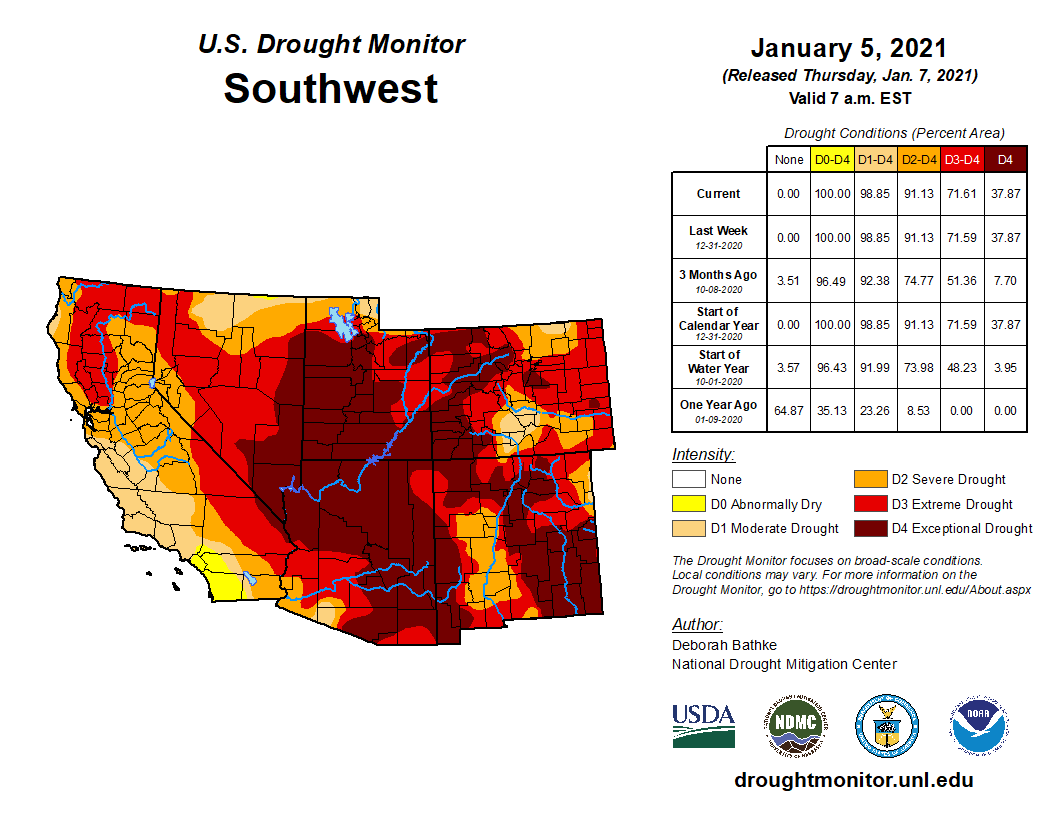
Southwest

The Southwest (USDM drought region here including the Four Corners states plus California and Nevada) has been in drought for much of the last 20 years. Drought in 2021 was a continuation of severe drought which most recently expanded in 2020 resulting from a dry 2019-2020 wet season (October-March) and which continued with a very dry 2020-2021 wet season. The unusually dry conditions were accompanied by excessive heat, both in 2020 and 2021. The heat increased evapotranspiration which intensified drought conditions. As 2021 began, 98.9 percent of the Southwest was in moderate to exceptional drought. The drought area continued above 90 percent through May. The return of summer monsoon rains in June contracted drought or lessened its intensity in the Four Corners states, with the drought area for the Southwest region shrinking to 84.1 percent by September 7. October atmospheric river events reduced the intensity of drought in California-Nevada, but a dry November expanded drought again with a second peak of 95.8 percent occurring on December 21. The year ended with December precipitation reducing the value to 91.5 percent of the Southwest in moderate to exceptional drought.


The Four Corners states (Arizona, Utah, Colorado, New Mexico, referred to as the Southwest climate region) collectively had the 34th driest January-June on record. Individual states were drier. Arizona had the eleventh driest February-June and Utah the fourth driest April-June. The summer monsoon rains, which began in July, and December precipitation improved the January-December ranks to 67th driest for Utah and 78th driest (50th wettest) for Arizona. Colorado ranked 47th driest for the year and New Mexico had an annual rank of 36th driest. The Four Corners states collectively had the fifth warmest April-September, third warmest June-September in 2021 (following the second warmest June-September in 2020), and second warmest November-December, with April-December 2021 ranking warmest on record following the second warmest such period in 2020.


California and Nevada (collectively known as the West Climate Region) had unusually dry and warm weather for much of 2021 which was a continuation of conditions from 2020. Collectively, the California-Nevada West region had the fourth driest April-June in 2021, ninth driest January-August, and second driest water year (October 2020-September 2021). April-November 2021 was the warmest such period for the California-Nevada West region, following the second warmest in 2020. Above-normal precipitation in October and November raised the January-December 2021 precipitation ranks to 42nd driest for California and 51st driest for Nevada.
Great Plains Overview


The USDM divides the Great Plains into two sections — the northern and central Plains (referred to as the "High Plains" region), and the southern Plains which includes the Lower Mississippi Valley (referred to as the "South" region). A "Southern Plains" analysis is also presented. During 2021, parts of the Central Plains started out in drought, but it quickly retreated to return near the end of the year, and mostly in the Plains of Colorado and western Nebraska and Kansas. Intense drought developed in the Northern Plains and western portions of the Southern Plains.
Northern and Central Plains


The year began with 81.1 percent of the Northern and Central Plains in moderate to exceptional drought. The most intense drought areas were in Colorado, Wyoming, and western portions of Nebraska and Kansas. North Dakota was in moderate to severe drought. The drought area contracted to about 47.7 percent by May 25 as precipitation shrank drought in the Central Plains and dry conditions shifted the drought epicenter to the Northern Plains. The drought area increased during the summer to a peak of 62.8 percent by August 24. During the latter months of the year, precipitation in the north contracted drought or reduced its intensity while dry conditions in western portions of the Central Plains expanded drought there, with the drought area reaching 65.2 percent on December 7 and 28. The year ended with 64.8 percent of the Northern and Central Plains in drought.
The spring-summer dryness in the north gave North Dakota the eighth driest March-July on record and South Dakota the eleventh driest June-July. The Plains of Montana were especially hard hit during the summer, with Montana ranking driest on record for June-July. Montana ended the year with the ninth driest January-December. The dryness was accompanied by unusual warmth. Frontal passages throughout the year interrupted the hot months with less hot periods, but the year ended up ranking in the top ten warmest category for all states in the Northern Plains and most in the Central Plains.
Southern Plains


The Southern Plains began 2021 with extreme to exceptional drought in western portions and moderate to exceptional drought covering 53.5 percent of the region. The drought area expanded to 64.3 percent by April 13, with extreme to exceptional drought in western and southern portions covering 31.2 percent of the region on May 4. A wet spring and summer contracted the drought area to 10.2 percent by September 7 and mostly eliminated extreme to exceptional drought from the region. But dry weather starting in September expanded the drought area again, with moderate to extreme drought growing to 81.7 percent of the region by year's end. Record warm temperatures for the last three to six months accompanied the dryness, increasing evapotranspiration and exacerbating the drought. Texas had the warmest and tenth driest December on record.


The dryness near the end of the year extended to the Lower Mississippi Valley. Louisiana had the seventh driest December, third driest November-December, and sixth driest October-December on record, while Mississippi ranked fourth driest for November-December. The Southern Plains and Lower Mississippi Valley (USDM South Region) started the year with a drought area of 31.5 percent. The value reached a minimum of about one percent on July 27, but ended the year at 62.4 percent, which was the peak for the year.
Midwest
In the Midwest, drought developed in parts of the Upper Mississippi Valley and Lower Great Lakes during 2021. Total drought coverage of the Midwest region was low compared to the West and Great Plains. The year began with 11.0 percent of the Midwest in drought, with severe to extreme drought in western Iowa. The drought area reached a minimum of about 7.0 percent on April 13, expanded across Iowa, Minnesota, Wisconsin, and Michigan to a maximum value of 36.4 percent by June 22, then contracted gradually to end the year at 15.3 percent.


The spring and summer months were especially dry for Minnesota. The state had the third driest May-July on record. Northern counties were the epicenter of drought in the state, with northeast Minnesota (climate division 3) experiencing the driest May-August on record. The southern Great Lakes (especially Lower Michigan) were very dry during the first part of the year, notably during the spring.
Northeast
Drought affected parts of the Northeast during parts of the year while wet conditions dominated during other parts of the year. At its greatest extent, drought covered about 21.0 percent of the region on July 6, but most of the time the drought area was 10 percent or less.

Northern New England experienced dry weather during the first part of the year, especially March and May-June, but also later in the year during August and November. Drought spread from northern New York and Vermont at the beginning of the year into Maine by June. Moderate to severe drought lingered in parts of northern Maine through the rest of the year. Northern New England has experienced dry conditions for the last 12 to 24 months.


Southern portions of Northeast were very dry during the last two to three months of the year. Abnormal dryness with some areas of moderate drought had spread into West Virginia, Maryland, Delaware, southern Pennsylvania, and southern New Jersey by December. New Jersey experienced the driest November-December on record, with the second driest November-December occurring in Delaware and Maryland.
Mid-Atlantic


Coastal parts of the Carolinas were dry during spring. North Carolina experienced the third driest April-May and 12th driest March-May, and South Carolina had the 16th driest April-May, in the 1895-2021 record. The Mid-Atlantic started the year with no drought, but moderate to severe drought developed by June, peaking on June 1. Rain during the month ended the drought across most of the area by the end of June. But dry conditions returned in November and December. North Carolina had the fourth driest November-December on record, Virginia the second driest, and South Carolina the 19th driest. Moderate to severe drought returned, reaching a maximum extent of 28.0 percent of the USDM Southeast region on December 28.
Hawaii


The year began with about 21.0 percent of Hawaii in moderate to extreme drought. Wet conditions during January and especially March ended drought in the state by the end of March. Drought returned during the late spring and summer months, reaching a peak of about 59.4 percent by July 20. Record to near-record dryness occurred during this period with the Honolulu Airport having the driest April-November in the 1940-2021 record, Lihue Airport the fifth driest April-November in their 1950-2021 record, and Kahului Airport the sixth driest in a 1905-1924/1954-2021 record. Drought persisted through the summer and fall months, expanding again to reach a second peak of 56.8 percent of the state on November 23. Heavy rains during December, including some from a Kona Low, ended the drought by the end of the year. The largest extent of moderate to extreme drought occurred on July 20, but the largest extent of the worst drought categories (extreme to exceptional drought) occurred on November 23 (10.7 percent on November 23 versus 1.2 percent on July 20).
Puerto Rico and U.S. Virgin Islands


Drought affected some part of Puerto Rico throughout the year. The percent area waxed and waned several times, reaching a minimum value of 1.3 percent of the island in October and a maximum of 29.0 percent on November 30. The severity never exceeded the moderate drought level. The San Juan Airport weather station had the 24th driest year in the 1956-2021 record.
In the U.S. Virgin Islands (USVI), moderate drought developed on the northern islands by January 26 and had spread to St. Croix in the south by February 16. Drought intensified over the following weeks, reaching severe drought intensity on all three islands by April 20. St. Thomas (King Airport) had the sixth driest January-March in the 1953-2021 record and St. Croix (Rohlsen Airport) ranked 12th driest in their 1951-2021 record. Rain ended drought in the northern islands and lessened drought intensity on St. Croix during the summer, but drought continued in the south throughout the year. Dry conditions returned in the fall. By December 7, St. Croix was experiencing extreme drought, St. Thomas severe drought, and St. John moderate drought. Near-record dryness occurred near the end of the year, with St. Croix recording the second driest September-December and St. Thomas the seventh driest. These intensities continued to the end of the year. For January-December, St. Croix ranked fourth driest on record and St. Thomas 16th driest. St. Croix's annual precipitation was the driest since 1965.
U.S.-Affiliated Pacific Islands


In the U.S.-Affiliated Pacific Islands (USAPI), 2021 began with a La Niña. The first three months were dry in the southern Federated States of Micronesia (FSM), where Kapingamarangi had the third driest January-March on record. It was also drier than normal in the Marianas. Wetter-than-normal conditions returned in the spring. Kapingamarangi started the year with exceptional drought and continued in drought during January to early May; drought developed in the northern Marshall Islands (RMI) at the end of January and continued until early June; and drought developed in the Marianas in February and continued through early May. In the Marshalls, the intensity of drought at Wotje maxed out at the extreme level in March.
Drier-than-normal conditions returned to most of Micronesia during the summer. Drought redeveloped in the southern Marshalls in August and stayed through September; drought returned to the southern FSM in September and stayed through the rest of the year. The drought intensity reached extreme level at Kapingamarangi in November. By the end of the year, drought continued at Kapingamarangi, but at a reduced intensity, and had redeveloped in the northern Marshalls.
Record or near-record dryness occurred during several seasons in 2021 (precipitation rank tables for August, September, October, November):
- Ailinglaplap, RMI: driest April-August and May-October
- Jaluit, RMI: second driest July-August and third driest July-September
- Kwajalein, RMI: second driest June-August and third driest June-September
- Lukunor, FSM: driest June-November
- Kapingamarangi, FSM: third driest July-November
The year ended up drier than normal in the southern FSM (Kapingamarangi), northern RMI (Kwajalein), and American Samoa (Pago Pago). Kapingamarangi had the sixth driest January-December out of 19 years of data, Wotje ranked seventh driest out of 36 years, Jaluit eleventh driest out of 37 years, Pago Pago 13th driest out of 55 years, and Kwajalein 15th driest out of 69 years.