Issued 12 August 2021


Please note that the values presented in this report are based on preliminary data. They will change when the final data are processed, but will not be replaced on these pages.
National Drought Highlights
- Based on the Palmer Drought Index, severe to extreme drought affected about 37% of the contiguous United States as of the end of July 2021, about the same as last month. About 9% of the contiguous U.S. fell in the severely to extremely wet categories.
- About 44% of the contiguous U.S. fell in the moderate to extreme drought categories (based on the Palmer Drought Index) at the end of July.
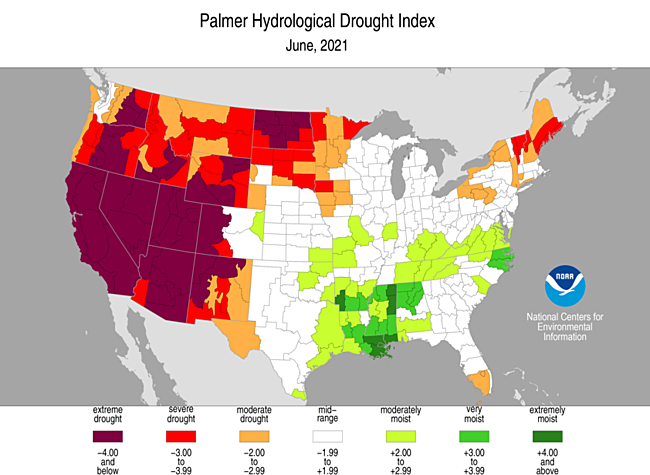
- On a broad scale, the 1980s and 1990s were characterized by unusual wetness with short periods of extensive droughts, the 1930s and 1950s were characterized by prolonged periods of extensive droughts with little wetness, and the first two decades of the 2000s saw extensive drought and extensive wetness (moderate to extreme drought graphic, severe to extreme drought graphic).
- A file containing the national monthly percent area severely dry and wet from 1900 to present is available for the severe to extreme and moderate to extreme categories.
- Historical temperature, precipitation, and Palmer drought data from 1895 to present for climate divisions, states, and regions in the contiguous U.S. are available at the Climate Division: Temperature-Precipitation-Drought Data page. These filenames begin with "climdiv".
- According to the weekly U.S. Drought Monitor (USDM), as of August 3, 2021, 46.31% of the contiguous U.S. (CONUS) (39.99% of the U.S. including Alaska, Hawaii, and Puerto Rico) was classified as experiencing moderate to exceptional (D1-D4) drought.
Detailed Drought Overview

Shortwave troughs and ridges migrated through the upper-level circulation over the CONUS during July 2021. Longwave ridges and troughs were evident on longer time scales, with ridging tending to dominate in the western to central CONUS and troughing frequently dropping south along the Mississippi River valley to eastern seaboard. When averaged across the month, a strong ridge was anchored across the West with a trough along the East Coast. The upper-level ridge deflected Pacific storm systems to the north away from the West, while the shortwave troughs dragged surface lows and Canadian cool fronts across the Plains to the Gulf of Mexico and Atlantic coasts. When summed over the month, the fronts and surface lows brought above-normal precipitation to parts of the southern Plains to Southeast, parts of the Ohio Valley and Great Lakes, and much of the Northeast, with Hurricane Elsa adding to the rain in the Southeast and Northeast. The fronts and upper-level troughs also contributed to cooler-than-normal monthly temperatures across most of these regions. The summer monsoon began in earnest around the middle of the month and dropped above-normal precipitation across much of the Southwest. Meanwhile, the western ridge kept most of the West Coast, Pacific Northwest, northern Rockies, and northern to central Plains drier than normal. It also gave most of the West and northern Plains a warmer-than-normal month.
The below-normal precipitation and high temperatures during July and for the last several months have resulted in low to record-low streamflow, low groundwater (USGS and GRACE satellite observations) levels, dry soil moisture (SMOS satellite observations; NESDIS satellite observations of moisture stress; SPoRT satellite-based observations for 0-10 cm [0-4 inches] depth, 0-40 cm [0-16 inches] depth, 0-100 cm [0-39 inches] depth, 0-200 cm [0-79 inches] depth; GRACE satellite-based observations for surface and root zone soil moisture; the USDA Crop Condition and Soil Moisture Analytics [CASMA] soil moisture anomaly for topsoil and subsoil, CASMA soil moisture category for topsoil and subsoil, and field observations of topsoil moisture; and CPC, Leaky Bucket, NLDAS, and VIC soil moisture models), stressed vegetation (satellite-based measures of vegetation health [NESDIS stressed vegetation, Vegetation Health Index (VHI)]) and the VegDRI and QuickDRI products), low reservoir levels (California, westwide), low relative humidity, and high evapotranspiration (EDDI maps for last 1, 2, 3, 4 months). These conditions were especially notable across the West, northern to central Plains, Northeast, southern High Plains, Upper Mississippi Valley, and parts of Florida and the central Appalachians. The month began with several large wildfires occurring across the West but mostly concentrated in the Southwest; as the month progressed, they quickly spread to northern areas of the West (wildfire maps for July 1, 10, 13, 18, 21, 26, 29, 31), with total acreage burned for the year to date of about 2.9 million acres, which is twice the year-to-date acreage at the end of June. The total number of fires so far this year is 37,650, which is above the ten-year average, but total acreage burned is below average.
Reports received through the Condition Monitoring Observer Reports (CMOR) system and via the National Drought Mitigation Center included continued drought impacts to farming and ranching operations (especially forage and feed issues, lack of water, reduced yields), fire risk, lack of food and water for wildlife, air quality, dry lawns, and stress to people, mostly in the West and northern Plains. Drought was forcing cattle producers in Minnesota, the northern Plains, and West to sell cattle or purchase hay and many were getting out of the business. Low river levels endangered salmon in California and increasing river water temperatures threatened fish across the West and northern Plains. Grasshoppers were found across 34.8 million acres of land in the West, including large swaths of Montana and Oregon as well as small parts of Nevada, Idaho, Wyoming, Colorado, New Mexico, Kansas and Arizona. Wildfires exploded in the West, especially northern portions, during July. Montana Governor Greg Gianforte declared a wildfire emergency following a drought emergency declaration. Washington Governor Jay Inslee declared a statewide drought emergency due to hot, dry weather. Governor Jared Polis declared a drought emergency for western Colorado. Severe hydrological effects were being felt. Wells were running dry in California, Idaho, Minnesota and Oregon. Drought was lowering runoff in the Missouri River Basin, limiting water releases. In the West, Great Salt Lake and Lake Powell reached record low levels during July, and Lake Mead dropped to 1067.6 feet, the lowest level since it was filled in the 1930s. The falling lake level on Mead will result in reduced hydropower production. If a Lake Mead water shortage declaration is declared by the federal government, it would lead to large cuts in water allocations for Arizona, New Mexico and Mexico. Plummeting reservoir levels at Lake Oroville in northern California forced the lake's Edward Hyatt Powerplant to stop generating hydropower. In early July, California Governor Gavin Newsom requested that people and businesses curb their water use. In late July, the "emergency curtailment" order process was started in California, which will cut off thousands of Sacramento and San Joaquin farmers when it is fully implemented. This was happening against a backdrop of many small towns in northern California facing water shortages, with some reporting that they were in danger of running out or were dealing with extreme shortages. In Hawaii, south and central Maui residents were told to conserve water by the Maui Department of Water Supply, due to extreme drought. The Central Maui System relies mainly on groundwater.
As a result of these conditions, drought or abnormal dryness expanded or intensified in the Far West, Pacific Northwest, northern Rockies, and parts of the northern and central Plains, Upper Mississippi Valley, central Appalachians, Alaska, and Hawaii. Beneficial rains caused drought or abnormal dryness to contract or decrease in intensity in the Southwest, southern High Plains, Great Lakes, Northeast, and Carolinas. Drought contraction slightly exceeded expansion for the CONUS with the USDM-based national moderate-to-exceptional drought footprint falling from 47.2 percent at the end of June to 46.3 percent at the end of July. For the 50 States and Puerto Rico, drought expansion slightly exceeded contraction, with the drought footprint rising from 39.5 percent to 40.0 percent. According to the Palmer Drought Index, which goes back to the beginning of the 20th century, about 43.5 percent of the CONUS was in moderate to extreme drought at the end of July, a decrease compared to the end of June. The percent area of the CONUS in moderate to extreme drought has hovered between 35 and 48 percent for the last eleven months (since September 2020).

Drought conditions at the end of July, as depicted on the August 3, 2021 USDM map, included the following core drought and abnormally dry areas:

- Moderate (D1) to extreme (D3) drought extended from the West Coast to Rocky Mountains and into the adjacent northern Plains, with a large areas of exceptional (D4) drought. The percent area of the West experiencing moderate to exceptional drought, according to USDM statistics, increased from 87.9 percent at the end of June to 90.0 percent at the end of July, peaking at 90.3 percent on July 27. This value exceeded the previous peak in the 21-year USDM record that occurred in August and September of 2003. The end-of-July percent area in extreme to exceptional drought (D3-D4) was 58.2 percent; the extreme to exceptional drought area peaked at 59.5 percent on July 20, which is USDM record. The percent area of the West (from the Rockies to the West Coast) in moderate to extreme drought (based on the Palmer Drought Index) fell to about 91.7 percent by the end of July 2021.
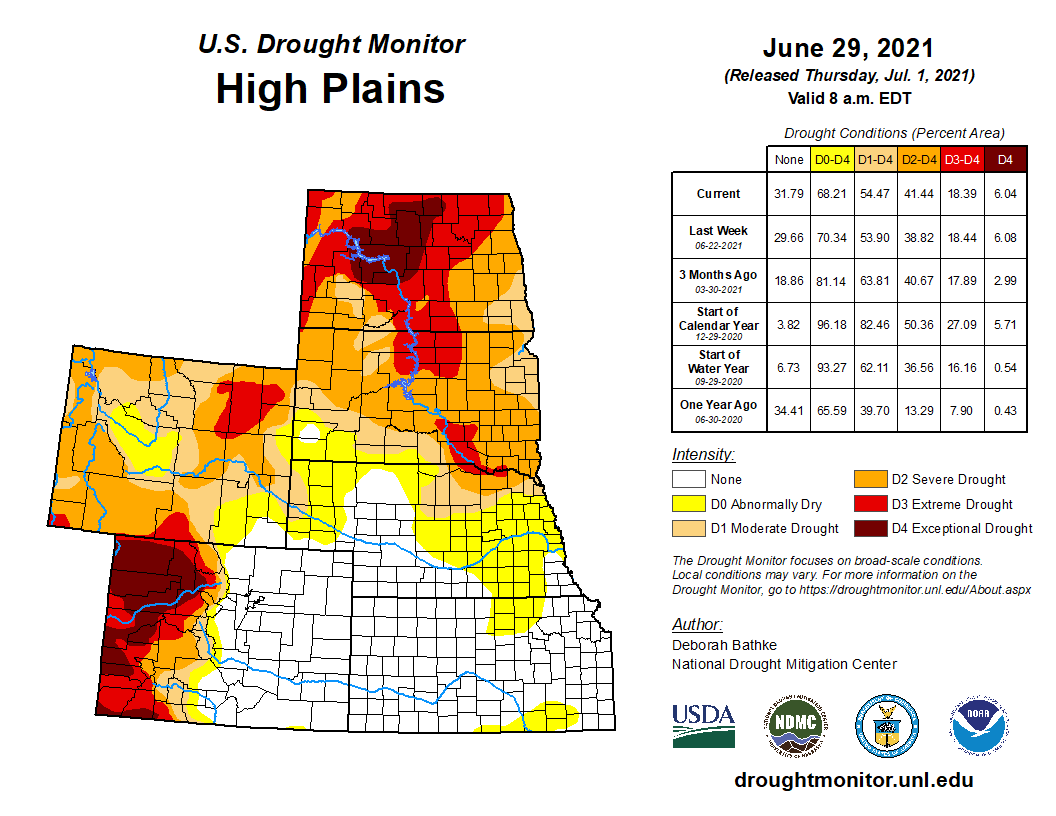
- Moderate to exceptional drought expanded in parts of the central and northern Plains and contracted in the southern Plains. The moderate to exceptional drought area expanded from 54.5 percent of the central and northern Plains at the end of June to 57.7 percent at the end of July, and shrank from 18.8 percent of the southern Plains at the end of June to 11.1 percent at the end of July.
- In the Midwest, the drought area contracted from 30.9 percent at the end of June to 26.3 percent at the end of July. Expansion and intensification occurred in the Upper Mississippi Valley, mainly Minnesota and parts of Iowa, while slightly more contraction occurred in the Great Lakes (Wisconsin and Michigan) and southwest Iowa.
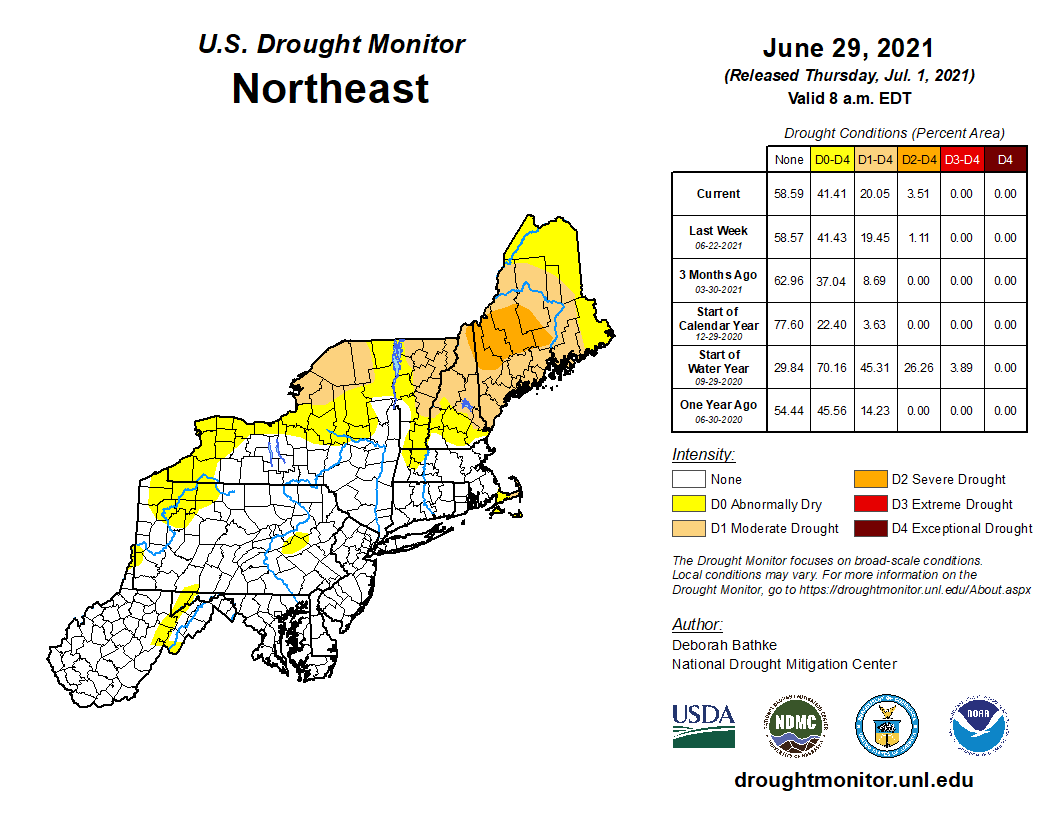
- The moderate to severe drought area was halved in the Northeast, from 20.1 percent at the end of June to 9.6 percent at the end of July. The drought was mainly located in northern portions of New England, while abnormal dryness developed in West Virginia and western Maryland.
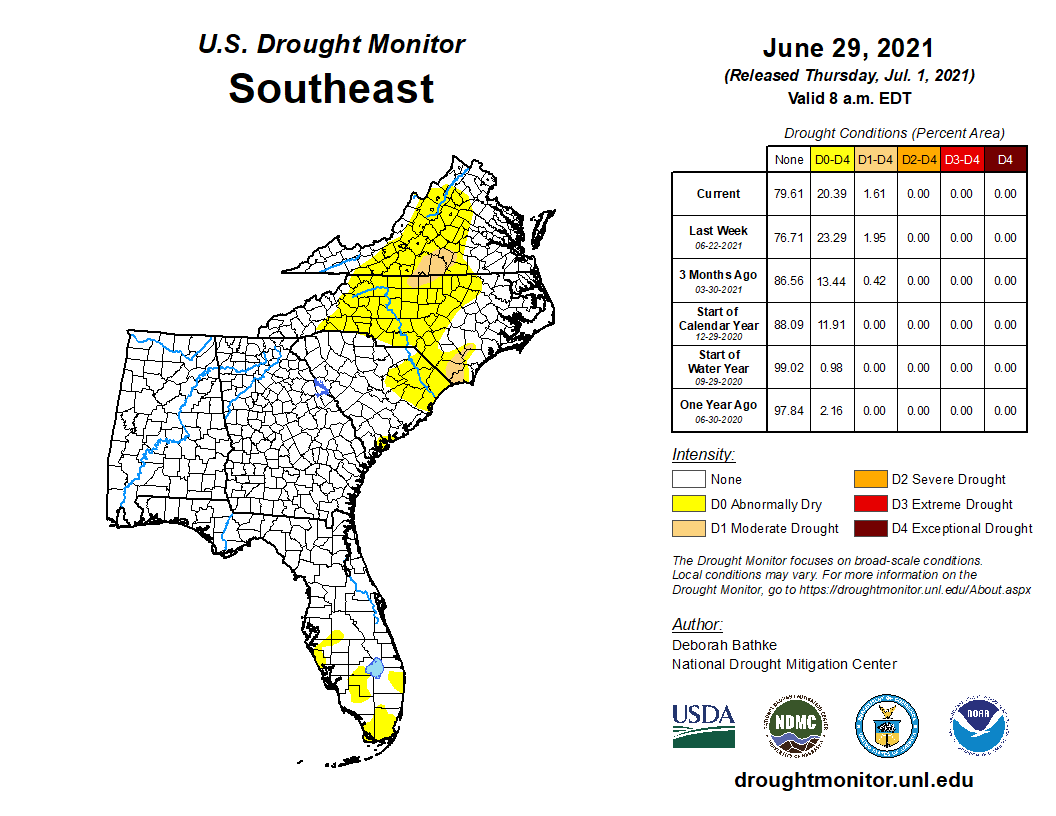
- In the Southeast, moderate drought shrank slightly from 1.6 percent of the region at the end of June to 1.2 percent at the end of July, lingering mainly in Virginia, with abnormal dryness across Virginia and North Carolina.
- Moderate and severe drought continued in Hawaii with a patch of extreme drought developing. But the overall drought footprint shrank from 56.6 percent of the state at the end of June to 44.7 percent at the end of July.
- In the Caribbean, moderate drought continued at about 8.3 percent of Puerto Rico. In the U.S. Virgin Islands (USVI), severe drought continued in the south on St. Croix while, in the north, moderate drought continued on St. John and abnormal dryness continued on St. Thomas.
- In the U.S.-Affiliated Pacific Islands (USAPI), abnormal dryness ended at Wotje but developed at Ailinglaplap and Jaluit in the Marshall Islands, with the rest of the USAPI free of drought or abnormal dryness.
- Abnormal dryness (D0) expanded and moderate drought (D1) developed in Alaska. The D0-D1 footprint expanded to 23.5 percent of the state by the end of July, with drought covering 7.5 percent.
Palmer Drought Index
The Palmer drought indices measure the balance between moisture demand (evapotranspiration driven by temperature) and moisture supply (precipitation). The Palmer Z Index depicts moisture conditions for the current month, while the Palmer Hydrological Drought Index (PHDI) and Palmer Drought Severity Index (PDSI) depict the current month's cumulative moisture conditions integrated over the last several months. While both the PDSI and PHDI indices show long-term moisture conditions, the PDSI depicts meteorological drought while the PHDI depicts hydrological drought. The PDSI map may show less severe and extensive drought (as well as wet spell conditions) in some parts of the country than the PHDI map because the meteorological conditions that produce drought and wet spell conditions are not as long-lasting as the hydrological impacts.

Used together, the Palmer Z Index and PHDI maps show that short-term drought occurred across most of the West (except the Southwest) and northern Plains to Upper Mississippi Valley and parts of the central Plains and central Appalachians, expanding or intensifying long-term drought in the north and west and contracting long-term wet conditions in the Appalachians (PHDI maps for July compared to June). Short-term wet conditions in the Southwest and Northeast contributed to contraction of long-term drought or reduction in its intensity, and from the Gulf Coast states to Great Lakes led to expansion, intensification, or introduction of long-term wet conditions.
Standardized Precipitation Index
The Standardized Precipitation Index (SPI) measures moisture supply. The SPI maps here show the spatial extent of anomalously wet and dry areas at time scales ranging from 1 month to 24 months.


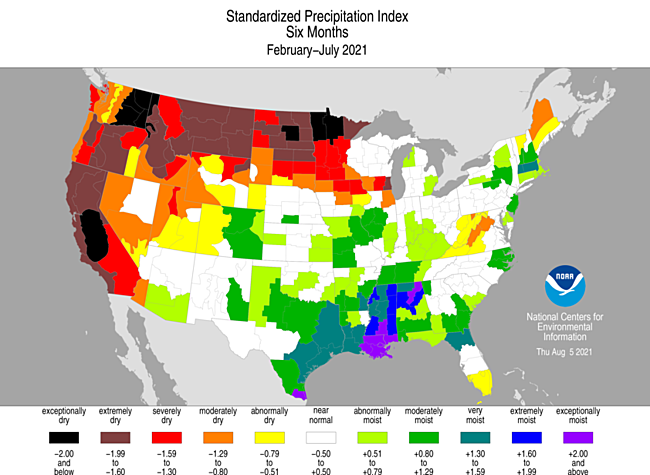
The SPI maps illustrate how moisture conditions have varied considerably through time and space over the last two years. Dry conditions dominate the Pacific Northwest to northern Plains at all time scales, the Upper Mississippi Valley from 1 to 12 months, and the Far West from 3 to 24 months. Dryness spreads into the Great Basin at 3 months and across the Southwest by 12 months, with dryness evident across the West at 12-24 months. Parts of the central Plains are dry at 1-3 months and 12 months and a few areas around the Great Lakes are dry at 1-12 months. Dry conditions are noted in the central Appalachians at 1 to 9 months and in parts of northern New England at 2 to 12 months. The summer monsoon, which began in July, produced so much rain that much of the Southwest has wet SPI values from 1 to 3 months. Wet conditions dominate much of the Gulf of Mexico coast at all time scales, the Ohio Valley at 1-6 months, the Mid-Mississippi Valley at 1-9 months, and parts to much of the Northeast at 1-12 months. An interesting pattern is evident at the 24-month time scale — very dry conditions dominate across the West, while very wet conditions dominate the Great Lakes and from eastern portions of the southern and central Plains to the southern and mid-Atlantic coast.


Standardized Precipitation Evapotranspiration Index
The SPI measures water supply (precipitation), while the SPEI (Standardized Precipitation Evapotranspiration Index) measures the combination of water supply (precipitation) and water demand (evapotranspiration as computed from temperature). Warmer temperatures tend to increase evapotranspiration, which generally makes droughts more intense.


For the Northern Hemisphere, July is in the midst of climatological summer, which is the warmest season of the year (when evapotranspiration reaches its annual maximum). During July 2021, temperatures were well above normal across the West and northern Plains, with record warmth occurring in much of the West. The record warmth extended over the last three months. The increased evapotranspiration resulting from the excessive temperatures (EDDI maps for last 1, 2, 3, 4 months) contributed to more extreme SPEI values (maps for last 1, 2, 3, 4, 5, 6, 9 months) than SPI values (maps for last 1, 2, 3, 4, 5, 6, 9 months), especially over the West and northern Plains.


The SPEI was record dry for several states for several of the time periods over the last one to six months. In most cases, the corresponding SPI was not record dry:
- California (SPEI for last 2, 3, 4, 5, 6 months) (SPI for last 2, 3, 4, 5, 6 months)
- Idaho (SPEI for last 2, 3, 4, 5 months) (SPI for last 2, 3, 4, 5 months)
- Montana (SPEI for last 2 months) (SPI for last 2 months)
- Nevada (SPEI for last 2 and 4 months) (SPI for last 2 and 4 months)
- Oregon (SPEI for last 1, 2, 3, 4, 5 months) (SPI for last 1, 2, 3, 4, 5 months)
- Washington (SPEI for last 4 and 5 months) (SPI for last 4 and 5 months)


Temperatures have been much warmer than normal in the West, and especially the Southwest, for much of the last one to eight years. The excessive evapotranspiration, especially during the warm season, has contributed to more extreme SPEI values than SPI values for much of this period (SPEI maps for the last 12, 24, 36, 48, 60, 72 months) (SPI maps for the last 12, 24, 36, 48, 60, 72 months).


The above-normal monsoon rains of July 2021 have helped make up deficits in the short term, but significant long-term deficits still remain. Many multi-year SPEI values, and some multi-year SPI values, are still record dry for several states:
- Arizona (SPEI for last 12, 24, 48, 72 months) (SPI for last 12, 24, 48, 72 months)
- California (SPEI for last 12 and 24 months) (SPI for last 12 and 24 months)
- Idaho (SPEI for last 12 months) (SPI for last 12 months)
- Nevada (SPEI for last 12 and 24 months) (SPI for last 12 and 24 months)
- Oregon (SPEI for last 12 months) (SPI for last 12 months)
- Utah (SPEI for last 12 and 24 months) (SPI for last 12 and 24 months)
Regional Discussion
Hawaii


July, June-July, May-July, and April-July 2021 were drier than normal across the main Hawaiian Islands, except for some locations on Kauai and the leeward side of the Big Island. But with a wet March, a mixed anomaly pattern was evident at the 6- to 10-month time scales. Drier-than-normal conditions were widespread from Oahu to Maui and northern parts of the Big Island at 12 months. A mixed precipitation anomaly pattern was seen at 24 months, with a trend towards wetter-than-normal dominating at longer time scales (last 1, 2, 3, 4, 6, 7, 9, 10, 12, 24, 36, 48, 60 months) (climate engine model percent of normal precipitation map for the last month). Monthly streamflow was below normal at several gauges across Oahu and a few on Maui. Areas of moderate to severe drought were on the islands from Oahu to the Big Island, with extreme drought developing this month on Maui. But the overall drought footprint shrank from 56.6 percent of the state at the end of June to 44.7 percent on the August 3rd USDM map.
Alaska


July 2021 was drier than normal across the eastern half of Alaska extending down across the panhandle and Aleutian chain. Drier-than-normal conditions persisted from the eastern interior to Bristol Bay areas and across southern parts of the panhandle at the 2- to 4-month time scales, from the eastern interior to Cook Inlet areas at 6 months, and across parts of the North Slope, central to eastern interior, and Cook Inlet regions at the 7- to 12-month time scales. The pattern became mixed in these areas, with eventually wetter-than-normal conditions dominating, at longer time scales (low elevation station precipitation anomaly maps for the last 1, 2, 3, 4, 6, 7, 9, 10, 12, 24, 36, 48, 60 months) (high elevation SNOTEL station precipitation percentile map for the last 1, 4, and 7 months) (high elevation SNOTEL station precipitation anomaly maps for the last 1 and 10 months) (SNOTEL basin precipitation anomaly maps for the last 1, 4, 7, 10, and 12 months) (climate division precipitation rank maps for the last 1, 3, 6, 7, and 12 months) (climate engine model percent of normal precipitation map for the last month) (modeled percent of normal maps from ACCAP for the last month) (Leaky Bucket model precipitation percentile map). July was warmer than normal across eastern Alaska and near to colder than normal across the west. The anomaly pattern transitioned to a pattern of mixed to warmer than normal by the 3-month time scale, then near to colder than normal across most of the state by 6 months, with near to warmer-than-normal conditions along the west coast by the 12-month time scale (low elevation station temperature anomaly maps for the last 1, 2, 3, 4, 7, 10, 12 months) (climate division temperature rank maps for the last 1, 3, 6, 7, 12 months) (Leaky Bucket model temperature percentile map). Modeled soil moisture and experimental satellite-based observations of soil moisture (SMOS; GRACE root zone and surface soil moisture; and SPoRT percentiles for 0-10 cm [0-4 inches] depth, 0-40 cm [0-16 inches] depth, 0-100 cm [0-39 inches] depth, 0-200 cm [0-79 inches] depth) showed drier than normal conditions in parts of the northeast, Bristol Bay, and south coastal areas. Monthly streamflow was mostly near normal with some below-normal streamflows in the south central interior region. Several large wildfires burned mostly in the central to eastern interior regions throughout the month (wildfire maps for July 1, 10, 13, 18, 21, 26, 29, 31). According to the National Interagency Fire Center's (NIFC) National Interagency Coordination Center, as of July 31st, 208,397 acres have been burned in Alaska so far this year, triple the value from a month ago. Abnormal dryness (D0) expanded and moderate drought (D1) developed this month. The D0-D1 footprint expanded to 23.5 percent of the state by the end of July, with drought covering 7.5 percent on the August 3rd USDM map.
Puerto Rico and U.S. Virgin Islands


July 2021 was drier than normal across the U.S. Virgin Islands (USVI) and southern, central, and northwestern portions of Puerto Rico (PR). The southern islands (St. Croix) in the USVI, and southern to some interior portions of PR, were drier than normal at the 2- to 4-month time scales. At longer time scales, drier-than-normal conditions dominated the USVI while a mixed anomaly pattern was seen on PR (radar-based precipitation anomaly estimates for the last 1, 2, 3, 6, 7, 10, 12 months) (low elevation station precipitation maps for the last 1, 2, 3, 4, 6, 7, 9, 10, 12, 24, 36, 48, 60 months) (climate engine model percent of normal precipitation map for the last month: PR and USVI, Caribbean and Gulf of Mexico region).
Temperatures were generally warmer than normal for July but cooler than normal for June-July. Root zone analyses indicated that soil conditions were dry along the southern coast and immediate northwest coast in PR. Monthly streamflow in PR was mostly near normal with some low stream levels in the southeast. Groundwater on the USVI continued to decline on St. Croix and St. John, while up-and-down oscillations were seen in the data for St. Thomas (groundwater level graphs for St. Croix, St. Thomas, and St. John). Moderate drought continued at about 8.3 percent of Puerto Rico. In the USVI, severe drought continued in the south on St. Croix while, in the north, moderate drought continued on St. John and abnormal dryness continued on St. Thomas.
Western U.S.


As discussed earlier, according to USDM statistics, the percent area of the West in moderate to exceptional drought peaked at 90.3 percent on July 27. This value exceeded the previous peak in the 21-year USDM record that occurred in August and September of 2003. The percent area in extreme to exceptional drought (D3-D4) peaked at 59.5 percent on July 20, which is USDM record. This is due to record low precipitation and excessively hot temperatures during the last several years. According to Palmer Drought Index statistics, the percent area of the West (from the Rockies to the West Coast) in moderate to extreme drought at the end of July decreased from the 122-year record that was set at the end of June.


Numerous statewide and regional records have resulted from the persistent anomalous heat and dryness. States having the driest SPI and SPEI over time periods spanning the last month to last six years were listed and discussed in the Standardized Precipitation Evapotranspiration Index section. One month (July 2021) of beneficial monsoon rains did little to counter the precipitation deficits that have built up over the last several months and years. Regionwide, the West had the warmest and fifth driest April-July, second driest and third warmest August-July 12-month period, and driest and fifth warmest August-July 24-month period. The last 40 years have seen an alarming warming trend and increase in the frequency of dry years (August-July 12-month periods) for the West as a whole.
CONUS State Precipitation Ranks


July 2021 was drier than normal across the Far West, Pacific Northwest, northern and central Plains, and central Appalachians, with record dryness occurring locally in parts of the northern Plains. Seven states in these regions had a precipitation rank in the driest third of the 127-year historical record for July, including three in the top ten driest category — Minnesota (second driest), Washington (fourth driest), and North Dakota (ninth driest).


May-July 2021 was drier than normal across most of the West, northern and central Plains, Upper Mississippi Valley, and central Appalachians, and parts of northern New England, with record dryness occurring locally in parts of the Upper Mississippi Valley, Pacific Northwest, and California. Thirteen states in these regions had a precipitation rank in the driest third of the 127-year historical record for May-July, including seven in the top ten driest category — Minnesota (second driest), Idaho (fifth driest), Montana (sixth driest), Washington and Oregon (both seventh driest), South Dakota (ninth driest), and California (tenth driest).


Like the last three months, the last six months (February-July 2021) was drier than normal across most of the West, northern and central Plains, Upper Mississippi Valley, and central Appalachians, and parts of northern New England, with record dryness occurring locally in parts of the Upper Mississippi Valley, Pacific Northwest, and California. Fourteen states in these regions had a precipitation rank in the driest third of the historical record for February-July, including eight in the top ten driest category — California, Montana, and North Dakota (each third driest); Idaho and Oregon (both fourth driest); Minnesota and Washington (both fifth driest); and South Dakota (tenth driest).


The year to date had a similar pattern. January-July 2021 was drier than normal across most of the West, northern and central Plains, Upper Mississippi Valley, northern New England, and central Appalachians, and parts of the Great Lakes and southern Florida, with record dryness occurring locally in parts of the Upper Mississippi Valley and Pacific Northwest. Fifteen states in these regions had a precipitation rank in the driest third of the historical record for January-July, including five in the top ten driest category — Minnesota and North Dakota (both third driest), Montana (fourth driest), Idaho (sixth driest), and South Dakota (ninth driest).


The last 12 months (August 2020-July 2021) were drier than normal across the West, northern and central Plains, Upper Mississippi Valley, and parts of the Great Lakes and Northeast, with record dryness occurring locally in parts of the West and northern Plains to Upper Mississippi Valley. Eighteen states in these regions had a precipitation rank in the driest third of the historical record for August-July, including ten in the top ten driest category — California and Utah (both driest on record); Montana (second driest); Idaho, Nevada, North Dakota, and Wyoming (each third driest); Minnesota (fourth driest); South Dakota (seventh driest); and Arizona (ninth driest).
Agricultural Belts


During July 2021, the Primary Corn and Soybean agricultural belt generally had near-average temperatures and was drier than average in the north and near to wetter than average in the south. The month ranked as the 34th wettest and 58th coolest July, regionwide, in the 1895-2021 record.
March marks the beginning of the growing season for the Primary Corn and Soybean agricultural belt. March-July 2021 was warmer than normal in the north and near to cooler than normal in the south with precipitation drier than normal in the north and near to wetter than normal in the south. The period ranked as the 46th wettest and 15th warmest March-July, regionwide, on record.


During July 2021, the Spring Wheat agricultural belt was warmer and mostly drier than normal. The month ranked as the 17th driest and second warmest July, regionwide, in the 1895-2021 record.
March marks the beginning of the growing season for the Spring Wheat agricultural belt. March-July 2021 was warmer and drier than normal. The period ranked as the second driest and fifth warmest March-July, regionwide, on record.
As of August 3, drought affected approximately 99 percent of spring wheat production, 87 percent of barley production, 53 percent of the sheep inventory, 47 percent of the milk cow inventory, 37 percent of corn production, 36 percent of hay acreage, 32 percent of winter wheat production, 32 percent of the cattle inventory, 31 percent of soybean production, 20 percent of rice production, 6 percent of sorghum production, and 4 percent of cotton production.
August 1 USDA reports indicated that topsoil moisture was short or very short (dry or very dry) across 48 percent of the CONUS and subsoil moisture was short or very short across 47 percent of the CONUS. Forty-two percent of the pasture and rangeland was in poor to very poor condition, nationwide, and 11 percent of the corn crop, 12 percent of soybeans, and 64 percent of spring wheat were in poor to very poor condition. Those states having 30 percent or more of the topsoil or subsoil moisture short or very short, or 30 percent or more of the pasture and rangeland in poor to very poor condition, at the end of July 2021 are listed in the table below.

U.S.-Affiliated Pacific Islands
The NOAA National Weather Service (NWS) offices, the Pacific ENSO Applications Climate Center (PEAC), and partners provided reports on conditions across the Pacific Islands.
In the U.S. Affiliated Pacific Islands (USAPI) (maps — Federated States of Micronesia [FSM], Northern Mariana Islands, Marshall Islands [RMI], Republic of Palau, American Samoa, basinwide), July 2021 was drier-than-normal in Palau, American Samoa, Guam, and much of the RMI and FSM. It was near to wetter than normal in parts of the Marianas and eastern FSM.
Monthly precipitation amounts were below the monthly minimum needed to meet most water needs (4 inches in the Marianas and Pago Pago, and 8 inches elsewhere) at Lukunor (in the FSM) and Ailinglaplap, Jaluit, and Wotje (in the RMI). July precipitation was above the monthly minimums in the Marianas, Palau, American Samoa, and the rest of the USAPI stations in the FSM and RMI. The 4- and 8-inch thresholds are important because, if monthly precipitation falls below the threshold, then water shortages or drought become a concern.
The tropical Pacific climatology can experience extremes in precipitation, from very low precipitation during the dry season to very high precipitation during the wet season. This can result in monthly normal precipitation values that are different from the monthly minimum needed to meet most water needs, and this can lead to percent of normal values that seem odd. This was the case during July 2021, which is in the wet season or entering the wet season for most locations in Micronesia. Precipitation was above the monthly minimum but below normal (1981-2010 normal), because the normals are high, at:
- Guam: July 2021 precipitation 8.76 inches, July normal mean 12.14 inches, July normal median 10.14 inches
- Yap: July 2021 precipitation 10.13 inches, July normal mean 15.04 inches, July normal median 15.08 inches
- Kapingamarangi: July 2021 precipitation 14.01 inches, July normal mean 13.16 inches, July normal median 14.15 inches
- Pohnpei: July 2021 precipitation 14.29 inches, July normal mean 16.09 inches, July normal median 15.43 inches
- Kwajalein: July 2021 precipitation 8.05 inches, July normal mean 9.85 inches, July normal median 9.87 inches
- Majuro: July 2021 precipitation 9.28 inches, July normal mean 11.93 inches, July normal median 11.17 inches
- Pago Pago: July 2021 precipitation 4.64 inches, July normal mean 6.47 inches, July normal median 5.55 inches
| Station Name | Aug 2020 | Sep 2020 | Oct 2020 | Nov 2020 | Dec 2020 | Jan 2021 | Feb 2021 | Mar 2021 | Apr 2021 | May 2021 | Jun 2021 | Jul 2021 | Aug- Jul |
|---|---|---|---|---|---|---|---|---|---|---|---|---|---|
| Chuuk | 95% | 167% | 92% | 127% | 182% | 114% | 156% | 223% | 55% | 244% | 60% | 135% | 128% |
| Guam NAS | 86% | 87% | 146% | 140% | 157% | 102% | 33% | 130% | 119% | 210% | 82% | 86% | 91% |
| Kapingamarangi | 36% | 9% | 15% | 31% | 38% | 65% | 63% | 78% | 150% | 129% | 72% | 99% | 63% |
| Koror | 164% | 62% | 170% | 88% | 142% | 102% | 166% | 119% | 287% | 178% | 56% | 73% | 114% |
| Kosrae | 87% | 114% | 149% | 177% | 185% | 188% | 141% | 194% | 106% | 154% | 194% | 166% | 131% |
| Kwajalein | 54% | 144% | 140% | 115% | 60% | 74% | 75% | 264% | 174% | 126% | 67% | 82% | 104% |
| Lukonor | 81% | 134% | 105% | 102% | 219% | 146% | 180% | 84% | 134% | 238% | 105% | 41% | 112% |
| Majuro | 85% | 101% | 176% | 112% | 147% | 150% | 57% | 228% | 135% | 285% | 84% | 84% | 133% |
| Pago Pago | 179% | 228% | 201% | 160% | 113% | 132% | 141% | 91% | 76% | 80% | 212% | 84% | 119% |
| Pohnpei | 98% | 120% | 121% | 169% | 168% | 147% | 65% | 216% | 77% | 152% | 141% | 93% | 128% |
| Saipan | 68% | 74% | 104% | 88% | 193% | 91% | 122% | 46% | 77% | 120% | 158% | 123% | 96% |
| Yap | 72% | 81% | 104% | 196% | 200% | 201% | 139% | 189% | 316% | 109% | 86% | 67% | 120% |
| Station Name | Aug 2020 | Sep 2020 | Oct 2020 | Nov 2020 | Dec 2020 | Jan 2021 | Feb 2021 | Mar 2021 | Apr 2021 | May 2021 | Jun 2021 | Jul 2021 | Aug- Jul |
|---|---|---|---|---|---|---|---|---|---|---|---|---|---|
| Chuuk | 12.20" | 19.61" | 10.57" | 13.45" | 20.47" | 11.56" | 11.29" | 18.55" | 6.86" | 27.53" | 7.00" | 16.13" | 175.22" |
| Guam NAS | 12.68" | 10.96" | 16.75" | 10.33" | 8.02" | 4.11" | 1.01" | 2.70" | 3.02" | 7.14" | 5.08" | 8.76" | 90.56" |
| Kapingamarangi | 2.94" | 0.86" | 1.19" | 2.83" | 3.77" | 5.92" | 5.86" | 8.91" | 20.44" | 15.53" | 9.95" | 14.01" | 92.21" |
| Koror | 22.13" | 7.28" | 20.11" | 9.97" | 15.82" | 10.42" | 14.23" | 8.84" | 21.03" | 21.06" | 9.87" | 13.55" | 174.31" |
| Kosrae | 12.41" | 16.16" | 16.25" | 24.52" | 29.87" | 31.36" | 18.28" | 31.20" | 18.63" | 27.37" | 28.33" | 24.77" | 279.15" |
| Kwajalein | 5.24" | 15.51" | 15.64" | 12.95" | 4.02" | 2.34" | 1.97" | 6.21" | 9.17" | 8.45" | 4.61" | 8.05" | 94.16" |
| Lukonor | 11.35" | 13.63" | 11.83" | 9.23" | 24.71" | 12.29" | 16.11" | 7.81" | 15.21" | 27.86" | 12.26" | 6.61" | 168.9" |
| Majuro | 9.97" | 11.25" | 22.35" | 14.99" | 16.71" | 11.58" | 3.89" | 15.00" | 12.71" | 28.81" | 9.28" | 9.42" | 165.96" |
| Pago Pago | 9.63" | 14.90" | 18.63" | 16.25" | 14.55" | 17.62" | 16.86" | 9.68" | 7.14" | 7.71" | 11.32" | 4.64" | 148.93" |
| Pohnpei | 13.99" | 15.02" | 18.49" | 25.13" | 26.95" | 19.38" | 6.24" | 28.50" | 14.18" | 30.38" | 20.95" | 14.30" | 233.51" |
| Saipan | 8.88" | 7.46" | 11.08" | 4.95" | 7.43" | 2.30" | 3.15" | 0.86" | 2.02" | 2.85" | 5.71" | 10.94" | 67.63" |
| Yap | 10.61" | 10.98" | 12.71" | 17.27" | 16.99" | 12.85" | 7.24" | 8.63" | 17.78" | 8.59" | 10.35" | 10.13" | 144.13" |
| Station Name | Aug 2020 | Sep 2020 | Oct 2020 | Nov 2020 | Dec 2020 | Jan 2021 | Feb 2021 | Mar 2021 | Apr 2021 | May 2021 | Jun 2021 | Jul 2021 | Aug- Jul |
|---|---|---|---|---|---|---|---|---|---|---|---|---|---|
| Chuuk | 12.86" | 11.71" | 11.51" | 10.61" | 11.25" | 10.10" | 7.25" | 8.32" | 12.47" | 11.30" | 11.66" | 11.98" | 136.77" |
| Guam NAS | 14.74" | 12.66" | 11.44" | 7.38" | 5.11" | 4.01" | 3.03" | 2.07" | 2.53" | 3.40" | 6.18" | 10.14" | 99.09" |
| Kapingamarangi | 8.13" | 9.93" | 8.19" | 9.27" | 9.84" | 9.15" | 9.27" | 11.43" | 13.64" | 12.08" | 13.78" | 14.15" | 145.85" |
| Koror | 13.50" | 11.77" | 11.84" | 11.39" | 11.16" | 10.18" | 8.56" | 7.44" | 7.32" | 11.83" | 17.48" | 18.53" | 152.90" |
| Kosrae | 14.22" | 14.22" | 10.94" | 13.83" | 16.11" | 16.67" | 12.93" | 16.06" | 17.51" | 17.75" | 14.64" | 14.91" | 213.87" |
| Kwajalein | 9.74" | 10.74" | 11.18" | 11.28" | 6.66" | 3.16" | 2.64" | 2.35" | 5.26" | 6.72" | 6.93" | 9.87" | 90.41" |
| Lukonor | 14.04" | 10.15" | 11.32" | 9.08" | 11.27" | 8.41" | 8.93" | 9.26" | 11.31" | 11.69" | 11.65" | 15.93" | 151.36" |
| Majuro | 11.69" | 11.17" | 12.73" | 13.44" | 11.39" | 7.74" | 6.88" | 6.58" | 9.42" | 10.11" | 11.01" | 11.17" | 125.25" |
| Pago Pago | 5.38" | 6.53" | 9.26" | 10.14" | 12.84" | 13.34" | 12.00" | 10.68" | 9.39" | 9.66" | 5.33" | 5.55" | 125.57" |
| Pohnpei | 14.26" | 12.55" | 15.27" | 14.83" | 16.08" | 13.18" | 9.55" | 13.17" | 18.41" | 19.96" | 14.81" | 15.43" | 182.36" |
| Saipan | 13.13" | 10.09" | 10.62" | 5.61" | 3.85" | 2.53" | 2.59" | 1.89" | 2.63" | 2.38" | 3.62" | 8.91" | 70.25" |
| Yap | 14.82" | 13.50" | 12.18" | 8.83" | 8.51" | 6.39" | 5.19" | 4.56" | 5.63" | 7.85" | 12.04" | 15.08" | 120.31" |
As measured by percent of normal precipitation, Kapingamarangi and Saipan were near to wetter than normal in the short term (July and the last 3 months [May-July 2021]) but near to drier than normal in the long term (year to date [January-July 2021] and last 12 months [ August 2020-July 2021]). Airai and Yap were drier than normal in the short term but wetter than normal in the long term. Kwajalein was drier than normal in the short term but near normal in the long term. Guam was drier than normal in both the short term and long term. Lukunor, Majuro, Pago Pago, and Pohnpei were drier than normal for July but near to wetter than normal at the other 3 time periods. Chuuk and Kosrae were wetter than normal in both the short term and long term.


Based on percent of normal average (instead of normal median values), in the Marianas Islands, precipitation during July was generally above normal across the islands. Below-normal conditions were evident at most stations at the 2- to 3-month time scales. It was drier than normal at the stations in the central islands while the northern-most and southern-most plotted stations wetter than normal at the 4-month and longer time scales (percent of normal precipitation maps for the last 1, 2, 3, 4, 6, 7, 9, 10, 12, 24, 36, 48, 60 months).


In the Marshall Islands, July was drier than normal across the islands. The last 2 to 4 months were drier than normal on most of the islands and wetter than normal in the southeast. Drier-than-normal conditions continued in the north and southwest at longer time scales (percent of normal precipitation maps for the last 1, 2, 3, 4, 6, 7, 9, 10, 12, 24, 36, 48, 60 months).

![0-10 cm [0-4 inches] depth](/monitoring-content/sotc/drought/2021/07/sport.vsm0-10percent_20210731_00z_conus.gif)
![0-40 cm [0-16 inches] depth](/monitoring-content/sotc/drought/2021/07/sport.vsm0-40percent_20210731_00z_conus.gif)
![0-100 cm [0-39 inches] depth](/monitoring-content/sotc/drought/2021/07/sport.vsm0-100percent_20210731_00z_conus.gif)
![0-200 cm [0-79 inches] depth](/monitoring-content/sotc/drought/2021/07/sport.vsm0-200percent_20210731_00z_conus.gif)
![0-10 cm [0-4 inches] depth](/monitoring-content/sotc/drought/2021/07/sport.vsmperc0-10_20210731_0400akdt_ak.gif)
![0-40 cm [0-16 inches] depth](/monitoring-content/sotc/drought/2021/07/sport.vsmperc0-40_20210731_0400akdt_ak.gif)
![0-100 cm [0-39 inches] depth](/monitoring-content/sotc/drought/2021/07/sport.vsmperc0-100_20210731_0400akdt_ak.gif)
![0-200 cm [0-79 inches] depth](/monitoring-content/sotc/drought/2021/07/sport.vsmperc0-200_20210731_0400akdt_ak.gif)
According to the July 31st USDM produced for the USAPI, there was no drought in the USAPI, only Ailinglaplap and Jaluit in southwest portions of the RMI were abnormally dry. Storage in the Majuro reservoir fluctuated up and down throughout the month, reaching a maximum of 30.7 million gallons on the 10th and a minimum of 25.9 million gallons on the 24th, and ending the month at 27.9 million gallons, which is just below the 28.8 million gallon threshold for concern.
July 2021 precipitation ranks were low at several stations. Wet conditions during previous months moderated ranks for longer time periods at some, while long-term dryness was still evident at others:
- Ailinglaplap: July 2021 was the driest July in the 37-year record, as were June-July and May-July. April-July 2021 was the second driest such 4-month period. But long-term conditions were wet, with September-July and August-July ranking as second wettest.
- Jaluit: July was second driest out of 38 years of data, June-July ranked fourth driest, and August-July seventh driest.
- Lukunor: second driest July and fifth driest June-July out of 37 years of data.
- Kapingamarangi: July 2021 ranked near the middle of the 32-year historical record (18th driest/15th wettest), but longer time scales were dry with August-July ranking second driest and September-July third driest.
The following analysis of historical data for the USAPI stations in the Global Historical Climatology Network-Daily (GHCN-D) dataset, augmented with fill-in data from the 1981-2010 Normals, helps put the current data into historical perspective by computing ranks based on the period of record. The table below lists the precipitation ranks for July 2021, February-July 2021 (last 6 months), and August 2020-July 2021 (the last 12 months). Some stations have a long period of record and their dataset is fairly complete, while other stations have a shorter period of record and the dataset has some missing data.
| Station | July 2021 | Feb-Jul 2021 | Aug 2020-Jul 2021 | Period of Record | |||
|---|---|---|---|---|---|---|---|
| Rank | Years | Rank | Years | Rank | Years | ||
| Ailinglaplap | 1 | 37 | 22 | 37 | 33 | 34 | 1981-2021 |
| Chuuk | 58 | 71 | 62 | 70 | 68 | 70 | 1951-2021 |
| Fananu | -- | 6 | -- | 3 | -- | 3 | 2003-2021 |
| Guam | 20 | 65 | 24 | 64 | 18 | 64 | 1957-2021 |
| Jaluit | 2 | 38 | 10 | 37 | 7 | 35 | 1981-2021 |
| Kapingamarangi | 18 | 32 | 12 | 25 | 2 | 18 | 1962-2021 |
| Koror | 26 | 71 | 64 | 70 | 64 | 69 | 1951-2021 |
| Kosrae | 49 | 53 | 40 | 43 | 32 | 34 | 1954-2021 |
| Kwajalein | 19 | 70 | 30 | 69 | 29 | 69 | 1952-2021 |
| Lukonor | 2 | 37 | 30 | 37 | 20 | 24 | 1981-2021 |
| Majuro | 17 | 68 | 59 | 67 | 62 | 67 | 1954-2021 |
| Mili | 10 | 36 | 35 | 36 | -- | 33 | 1981-2021 |
| Nukuoro | 28 | 38 | 25 | 37 | 23 | 36 | 1981-2021 |
| Pago Pago | 21 | 56 | 18 | 55 | 49 | 55 | 1966-2021 |
| Pingelap | 29 | 37 | 28 | 36 | 27 | 33 | 1981-2021 |
| Pohnpei | 28 | 71 | 59 | 70 | 69 | 70 | 1951-2021 |
| Saipan | 35 | 41 | 30 | 40 | 12 | 32 | 1981-2021 |
| Ulithi | -- | 37 | -- | 36 | -- | 33 | 1981-2021 |
| Utirik | -- | 16 | -- | 8 | -- | 4 | 1985-2020 |
| Woleai | 36 | 40 | 30 | 32 | 23 | 27 | 1968-2021 |
| Wotje | 29 | 37 | 11 | 37 | 27 | 34 | 1981-2021 |
| Yap | 15 | 71 | 53 | 70 | 61 | 70 | 1951-2021 |


SPI values for seven time periods for Pacific Islands, computed by the Honolulu NWS office.

NOAA Regional Climate Centers
More information, provided by the NOAA Regional Climate Centers and others, can be found below.
Southeast
As noted by the Southeast Regional Climate Center, temperatures were near average across much of the Southeast region for the month of July, while precipitation varied across the region for the month, with the driest locations found across much of Virginia, eastern North Carolina, and southern Florida. Monthly precipitation totals ranged from 70 to less than 25 percent of normal across these locations. In contrast, the wettest locations were located across most of Alabama, central South Carolina, and northern Florida.
Drought conditions slightly improved across the Southeast region for July, as adequate rainfall fell in the driest areas. Consequently, abnormally dry conditions (D0) were confined to western North Carolina and the western part of Virginia, with a small pocket of moderate drought (D1) in western Virginia. Abnormally dry conditions (D0) were eliminated from Florida. Drought remained the same across Puerto Rico, with an area of moderate drought (D1) in the southern part of the island ringed by an area of abnormally dry conditions (D0). The citrus growing region in Florida experienced seasonable conditions with normal grove activities. The seasonable weather allowed for vegetable growers to prepare land for fall planting.
South
As explained by the Southern Regional Climate Center, July 2021 was among the top 20 Julys historically for mild temperatures and plentiful rain. All states in the Southern region reported above-median precipitation for July, and every state in the region was cooler than its long-term median, partly because of unusually heavy rainfall.What was left of drought in the region continued to shrink during July. Less than 1% of the region was classified as being in drought according to the July 27 USDM, and less than 4% was instead abnormally dry. This is the smallest amount of drought coverage across the region in over two years. The remaining drought areas were in northwest Oklahoma and the Big Bend region of Texas. Despite the generally favorable drought conditions, dryness emerged in northwestern Oklahoma and northeastern Tennessee during the month, leading mostly to concerns and problems for ranchers. Generally, excess precipitation was a greater concern, particularly among agricultural producers.
Midwest
As described by the Midwest Regional Climate Center, July temperatures averaged close to normal for nearly all of the Midwest while July precipitation varied considerably across the region. Totals ranged from less than 1.00 inches (25 mm) in northwestern Minnesota to areas with more than 6.00 inches (152 mm) in portions of each of the other eight states in the region. The totals ranged from less than 25 percent of normal in northwestern Minnesota to more than 200 percent of normal in southern Illinois and northern Michigan. Regionwide precipitation was 3.75 inches (95 mm) which was 0.34 inches (9 mm) below normal. Statewide totals were below normal in Minnesota (37 percent), Iowa (73 percent), and Wisconsin (79 percent). The other six states were above normal with amounts ranging from 106 percent of normal in Missouri to 120 percent of normal in Ohio.The area of the Midwest affected by drought shrunk slightly in July, from 30.9 to 27.3 percent, however the areas in severe and extreme drought increased during the month. Extreme drought increased from just 0.2 percent to 3.7 percent of the region and severe drought went from 7.0 to 16.7 percent. At the beginning of the month there was extreme drought along the Wisconsin-Illinois border near Lake Michigan. That area eased to severe drought in July, but Minnesota went from mostly moderate drought with a little severe drought to mostly severe drought with some large areas of extreme drought. At the end of the month, 75 percent of the state was in severe drought or worse, including 22 percent of the state in extreme drought.
Smoke from the western wildfires impacted the Midwest. Especially in the western and northern parts of the region, smoke was visible and hazy conditions were common due to the smoke. Sunsets were redder than normal on numerous occasions in the region due to enhanced scattering of the sunlight due to airborne smoke.
Northeast
As explained by the Northeast Regional Climate Center, it was the fifth wettest July since 1895 in the Northeast and the July average temperature of 69.6 degrees F (20.9 degrees C) was 0.6 degrees F (0.3 degrees C) below normal. State precipitation ranged from 63 percent of normal in West Virginia, the state's 11th driest July, to 249 percent of normal in Massachusetts, the state's wettest July on record.The USDM released on July 1 showed 4 percent of the Northeast in severe drought, 17 percent in moderate drought, and 21 percent as abnormally dry, primarily in northern New England and New York. Much of the region saw plentiful precipitation during July, alleviating drought and abnormally dry conditions in several locations such as coastal Maine and southern New Hampshire. However, dryness persisted in areas that missed out such as western Maine, northern Vermont, and Cape Cod, Massachusetts. In addition, abnormal dryness was introduced in portions of West Virginia and western Maryland that also saw below-normal precipitation. The USDM released on July 29 showed 1 percent of the Northeast in severe drought, 7 percent in moderate drought, and 14 percent as abnormally dry. Some locations in northern New England and New York saw daily record or near-record low streamflow during July. Interestingly, daily record low streamflow was measured in drought areas of northern New Hampshire on the same day that daily record high flows were measured in southern New Hampshire, which saw record-setting July rainfall. According to the Maine Drought Task Force, some recreations flows were curtailed on the Androscoggin and Kennebec rivers due to below-normal water levels. Below-normal water levels on Lake Champlain and other waterways in Vermont also affected recreational activities. Some locations in northern New England and New York also saw daily record or near-record low groundwater levels during July. Some wells ran dry or experienced water shortages in Maine and Vermont. As of July 22, 15 dry wells had been reported in Maine. Ninety community water systems in New Hampshire had water restrictions in place as of July 21, with 80 of them having mandatory restrictions. A blueberry farm in Maine did not open for the season because their blueberry bushes did not produce blooms or fruit due to dry conditions. Some New Hampshire farmers went from dealing with drought conditions to overly wet conditions. July rainfall helped revive some crops in Vermont and Maine and reduced the need for irrigation for some New Hampshire and Maine farmers. In early July, one area in Maine had seen as many fires through early July as it typically sees in an entire year; however, rain later in the month eased wildfire danger in much of the state. Dry conditions over the past year in New Hampshire contributed to an abundance of leaf litter and other fuels for wildfires so officials planned to perform controlled burns along the White Mountain National Forest as a preventative measure. Ant colonies thrived in Maine due to the dry conditions.
High Plains
As summarized by the High Plains Regional Climate Center, July was a dry month for much of the High Plains, except for several isolated pockets of above-normal precipitation. Temperatures varied across the region this month, with the dividing line between warmer and cooler areas stretching from south-central Colorado through northeastern Nebraska. Areas to the north and west of this line were above normal, while areas to the south were generally near to below normal.Drought continued to expand and intensify in western and northern parts of the region, with warm and dry conditions leading to numerous impacts. Several crops, along with pastures and rangeland, were faring poorly, especially across North Dakota, South Dakota, and Wyoming. For example, according to the USDA National Agricultural Statistics Service, this year's spring wheat crop has been severely impacted by the drought, coming in as the worst-rated crop since 1988, nationally. In the High Plains, as of July 25th, 69 percent of South Dakota's spring wheat crop was rated poor to very poor, while 61 percent of North Dakota's spring wheat crop was rated poor to very poor. Meanwhile, pasture and range conditions were also in very rough shape, with 85 percent rated in poor to very poor condition in North Dakota and 72 percent rated poor to very poor in South Dakota. Even drought outside of the High Plains region has had impacts here. Large wildfires burning in areas of California, Idaho, Nevada, Oregon, and Washington have brought smoky skies and poor air quality to parts of the region and beyond this month. Many who are sensitive to the impacts of poor air quality were advised to take precautions during this time.
Portions of the Northern Plains continued to be crippled by drought. North Dakota was especially dry with the majority of the state receiving less than 50 percent of normal precipitation. This led to many locations ranking in the top 10 driest Julys on record. For instance, Grand Forks had its driest July with a paltry 0.42 inch (11 mm) of precipitation (period of record 1893-present). This was 3.10 inches (79 mm) below normal. Just to the south, Fargo received only 22 percent of normal precipitation with 0.66 inch (17 mm). It is worth noting that, since January 1st, much of eastern North Dakota has received less than 50 percent of normal precipitation. Elsewhere in the High Plains, several areas received no more than 25 percent of normal precipitation. This included north-central Wyoming, eastern Colorado, and central Kansas. The tri-state area of Colorado, Nebraska, and Kansas was also very dry for the month of July, with no relief likely in the near future.
One area of the region that has had recent improvements in drought is Colorado. But, the longer-term impacts of drought and last year's historic wildfire season are still being realized. Flooding in burn scar areas has become quite an issue this summer, especially with the increase in monsoonal moisture. For instance, according to Colorado Public Radio, I-70 in the Glenwood Canyon area has been closed nearly 10 times due to mudslides this summer. At the end of July, a mudslide closed the interstate yet again, trapping travelers until it was safe to leave. Many even stayed on the interstate overnight. The damage from these mudslides was so extensive that Governor Polis planned to issue a state disaster declaration, in addition to requesting a federal disaster declaration. Parts of the interstate could be closed for weeks or longer.
Generally, streamflows were below normal to much below normal within drought-stricken areas of the region, with record low flows reported in isolated areas of northwestern Colorado, northwestern and south-central Wyoming, western North Dakota, and southwestern Nebraska. In mid-July, the Bureau of Reclamation announced that, for the first time, emergency releases of water from reservoirs in the region will be required to help meet the needs for hydroelectric power at Glen Canyon Dam on Lake Powell in Arizona. These included the Flaming Gorge Reservoir on the Green River in Wyoming and Utah, the Blue Mesa Reservoir on the Gunnison River in Colorado, and Navajo Lake on the San Juan River in New Mexico and Colorado. Other areas of the region had near to above-normal streamflows, with some areas of eastern Kansas, central Nebraska, and central Colorado having much above normal streamflows.
Although there were some minor improvements, overall, drought continued to expand and intensify across the High Plains region this month. According to the USDM, the area experiencing drought (D1-D4) increased slightly from about 55 percent to just over 57 percent. The area experiencing abnormally dry and drought conditions (D0-D4) also increased from approximately 68 percent to 72 percent.
Drought persisted across the Northern Plains this month with many impacts to agriculture and water resources. In North Dakota, despite some improvements in extreme (D3) and exceptional drought (D4), the entire state remained in drought from mid-June through the end of July. Meanwhile, South Dakota had a 5 percent increase in D3 and Wyoming had an expansion of severe drought (D2) along with D3 across southwestern and northern parts of the state. By the end of the month, about 93 percent of Wyoming was experiencing drought conditions, which was a 9 percent increase from the end of June.
Elsewhere, monsoonal rains helped to improve conditions in parts of southwestern Colorado, while recent dry conditions led to the development of drought in northwestern Kansas, as well as southwestern and south-central Nebraska. Throughout the rest of the region, other minor adjustments to drought conditions were made. According to the U.S. Monthly Drought Outlook for August, drought development is likely across much of Nebraska and pockets of South Dakota.
West
As described by the Western Regional Climate Center, in summary, warm and dry conditions were found across the Pacific Northwest, northern Rockies, northern California, and northern Great Basin leading to further drought expansion throughout the month. This pattern also enabled increased wildfire activity and smoke related air quality issues across the region. In contrast, an active monsoon brought a wet pattern to the Four Corners region and parts of the Great Basin helping to improve the short-term drought conditions. This is a welcome change after two years in a row with below-normal monsoon rains for the region.Well above-normal precipitation and record wetness in some cases was the big story in the Southwest. Statewide, Arizona recorded its second wettest July since 1895 based on gridded PRISM data from the WRCC State Climate Tracker. Tucson, Arizona received 8.06 in (204.7 mm; 365% of normal) making it not only the wettest July on record but the wettest month ever recorded since 1946. Phantom Ranch, Arizona, in Grand Canyon National Park, logged 2.54 in (65.5 mm; 276% of normal) of rain for the third wettest July on record. Moist flow and thunderstorms extended into southwest California where Death Valley National Park recorded its wettest July since records began in 1911 with 1.45 in (36.8 mm; 1450% of normal); this is nearly double the second wettest value of 0.75 in (19 mm) set in 2013 and 1954. Above normal precipitation was much more isolated in the northern Great Basin, but some areas did receive beneficial rainfall. Idaho Falls, Idaho recorded 1.38 in (35.1 mm; 300% of normal) for the fifth wettest July on record. Western Oregon, Washington, and northern Idaho were particularly dry with many areas receiving less than 5% of normal precipitation for the month.
Widespread record warmth was observed throughout California, Oregon, Washington, Idaho, Nevada, and Utah. The active monsoon pattern brought increased cloud cover and below normal temperatures to southern Arizona and southern/eastern New Mexico where temperatures were in the range of 1-3 F below normal for the month.
At the end of July, 90% of the West was in drought with 59% in severe or exceptional drought. Combined warm and dry conditions in northern California, the Pacific Northwest, and northern Rockies increased both drought severity and fire danger. Two-category degradations in the USDM were found throughout the month in Oregon, Washington, Idaho, and Montana with exceptional drought (D4) present in all four states. Warm temperatures continued to cure already dry vegetation and enabled fires that did start to spread rapidly and produce extreme fire behavior with massive smoke plumes and poor air quality. At the end of July, a cluster of more than three dozen large wildfires was burning in northeast Oregon, eastern Washington, northern Idaho, and western Montana with many of these requiring Type 1 and Type 2 incident management teams (significant firefighting resources).
In Alaska, precipitation was well above-normal in the west and northwest and well below-normal in the central/eastern Interior, Copper River Basin, and Panhandle. Kotzebue logged its wettest July since 1929 with 5.32 in (135.1 mm; 333% of normal) and Nome recorded its second wettest since 1908 with 6.41 in (162.8 mm; 273% of normal). In the Panhandle, Juneau saw its 11th driest July since 1895 logging 2.35 in (29.7 mm; 38% of normal) and in the Interior, Northway received 0.81 in (20.6 mm; 28% of normal). Combined dryness and above-normal temperatures in the Interior led to introduction of abnormally dry (D0) and moderate drought (D1) in the USDM. Several large fires were burning at the end of July in the drought covered areas.
In Hawaii, below-normal precipitation was found throughout the region except for Kauai. Kahului, Maui tied the third driest July with just a trace of precipitation; the normal for the month is 0.53 in (13.5 mm). Honolulu, Oahu saw its seventh driest July since 1940 with 0.08 in (2 mm; 15% of normal). On the Big Island, Halepohaku (located at 9,260 feet elevation on Manua Kea) received only 0.22 in (5.6 mm; 14% of normal). Small areas of severe drought (D3) were added to Maui due to the continued dryness.
Lake Powell Hits Record Low: On July 24 Lake Powell, the nation's second largest reservoir, dropped below 3,555.1 feet elevation, bringing it to the lowest level since 1969 when it was first filled and to 33% of capacity. Due to the low water level, emergency water releases from several upstream reservoirs in multiple states will take place in the coming months to maintain hydropower production at Glen Canyon Dam. Lake Powell feeds into Lake Mead downstream, the nation's largest reservoir, which is already at a record low water level. The low water levels will for the first time trigger an official federal shortage declaration later this summer impacting primarily Nevada and Arizona.