Issued 12 May 2021
Please note that the values presented in this report are based on preliminary data. They will change when the final data are processed, but will not be replaced on these pages.
National Drought Highlights
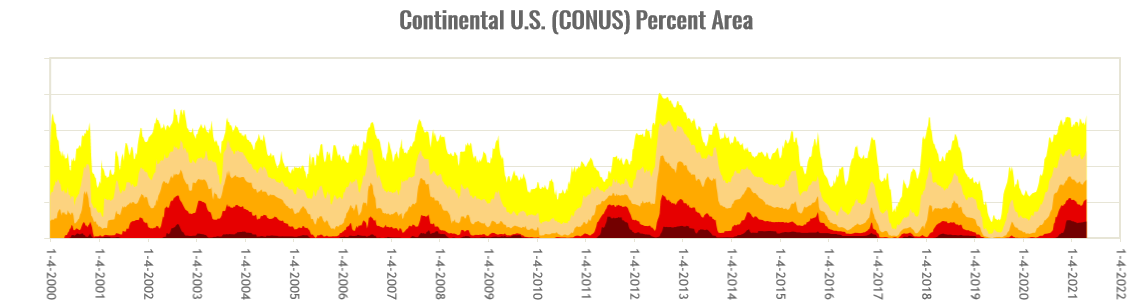
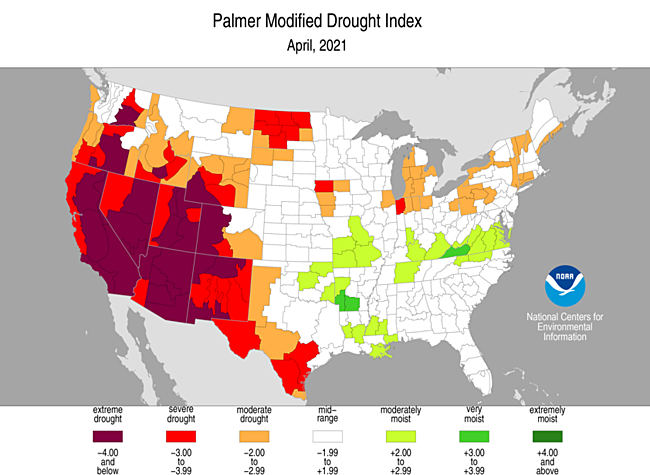
- Based on the Palmer Drought Index, severe to extreme drought affected about 30% of the contiguous United States as of the end of April 2021, an increase of about 3% from last month. About 1% of the contiguous U.S. fell in the severely to extremely wet categories.
- About 45% of the contiguous U.S. fell in the moderate to extreme drought categories (based on the Palmer Drought Index) at the end of April.
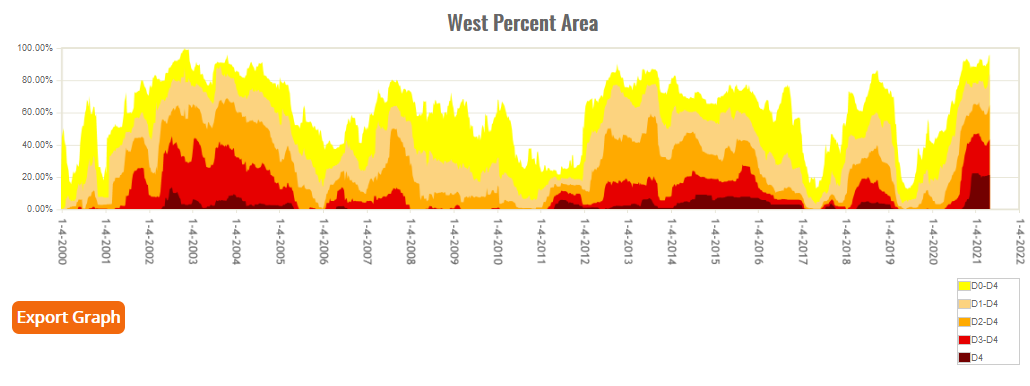
- On a broad scale, the 1980s and 1990s were characterized by unusual wetness with short periods of extensive droughts, the 1930s and 1950s were characterized by prolonged periods of extensive droughts with little wetness, and the first two decades of the 2000s saw extensive drought and extensive wetness (moderate to extreme drought graphic, severe to extreme drought graphic).
- A file containing the national monthly percent area severely dry and wet from 1900 to present is available for the severe to extreme and moderate to extreme categories.
- Historical temperature, precipitation, and Palmer drought data from 1895 to present for climate divisions, states, and regions in the contiguous U.S. are available at the Climate Division: Temperature-Precipitation-Drought Data page. These filenames begin with "climdiv".
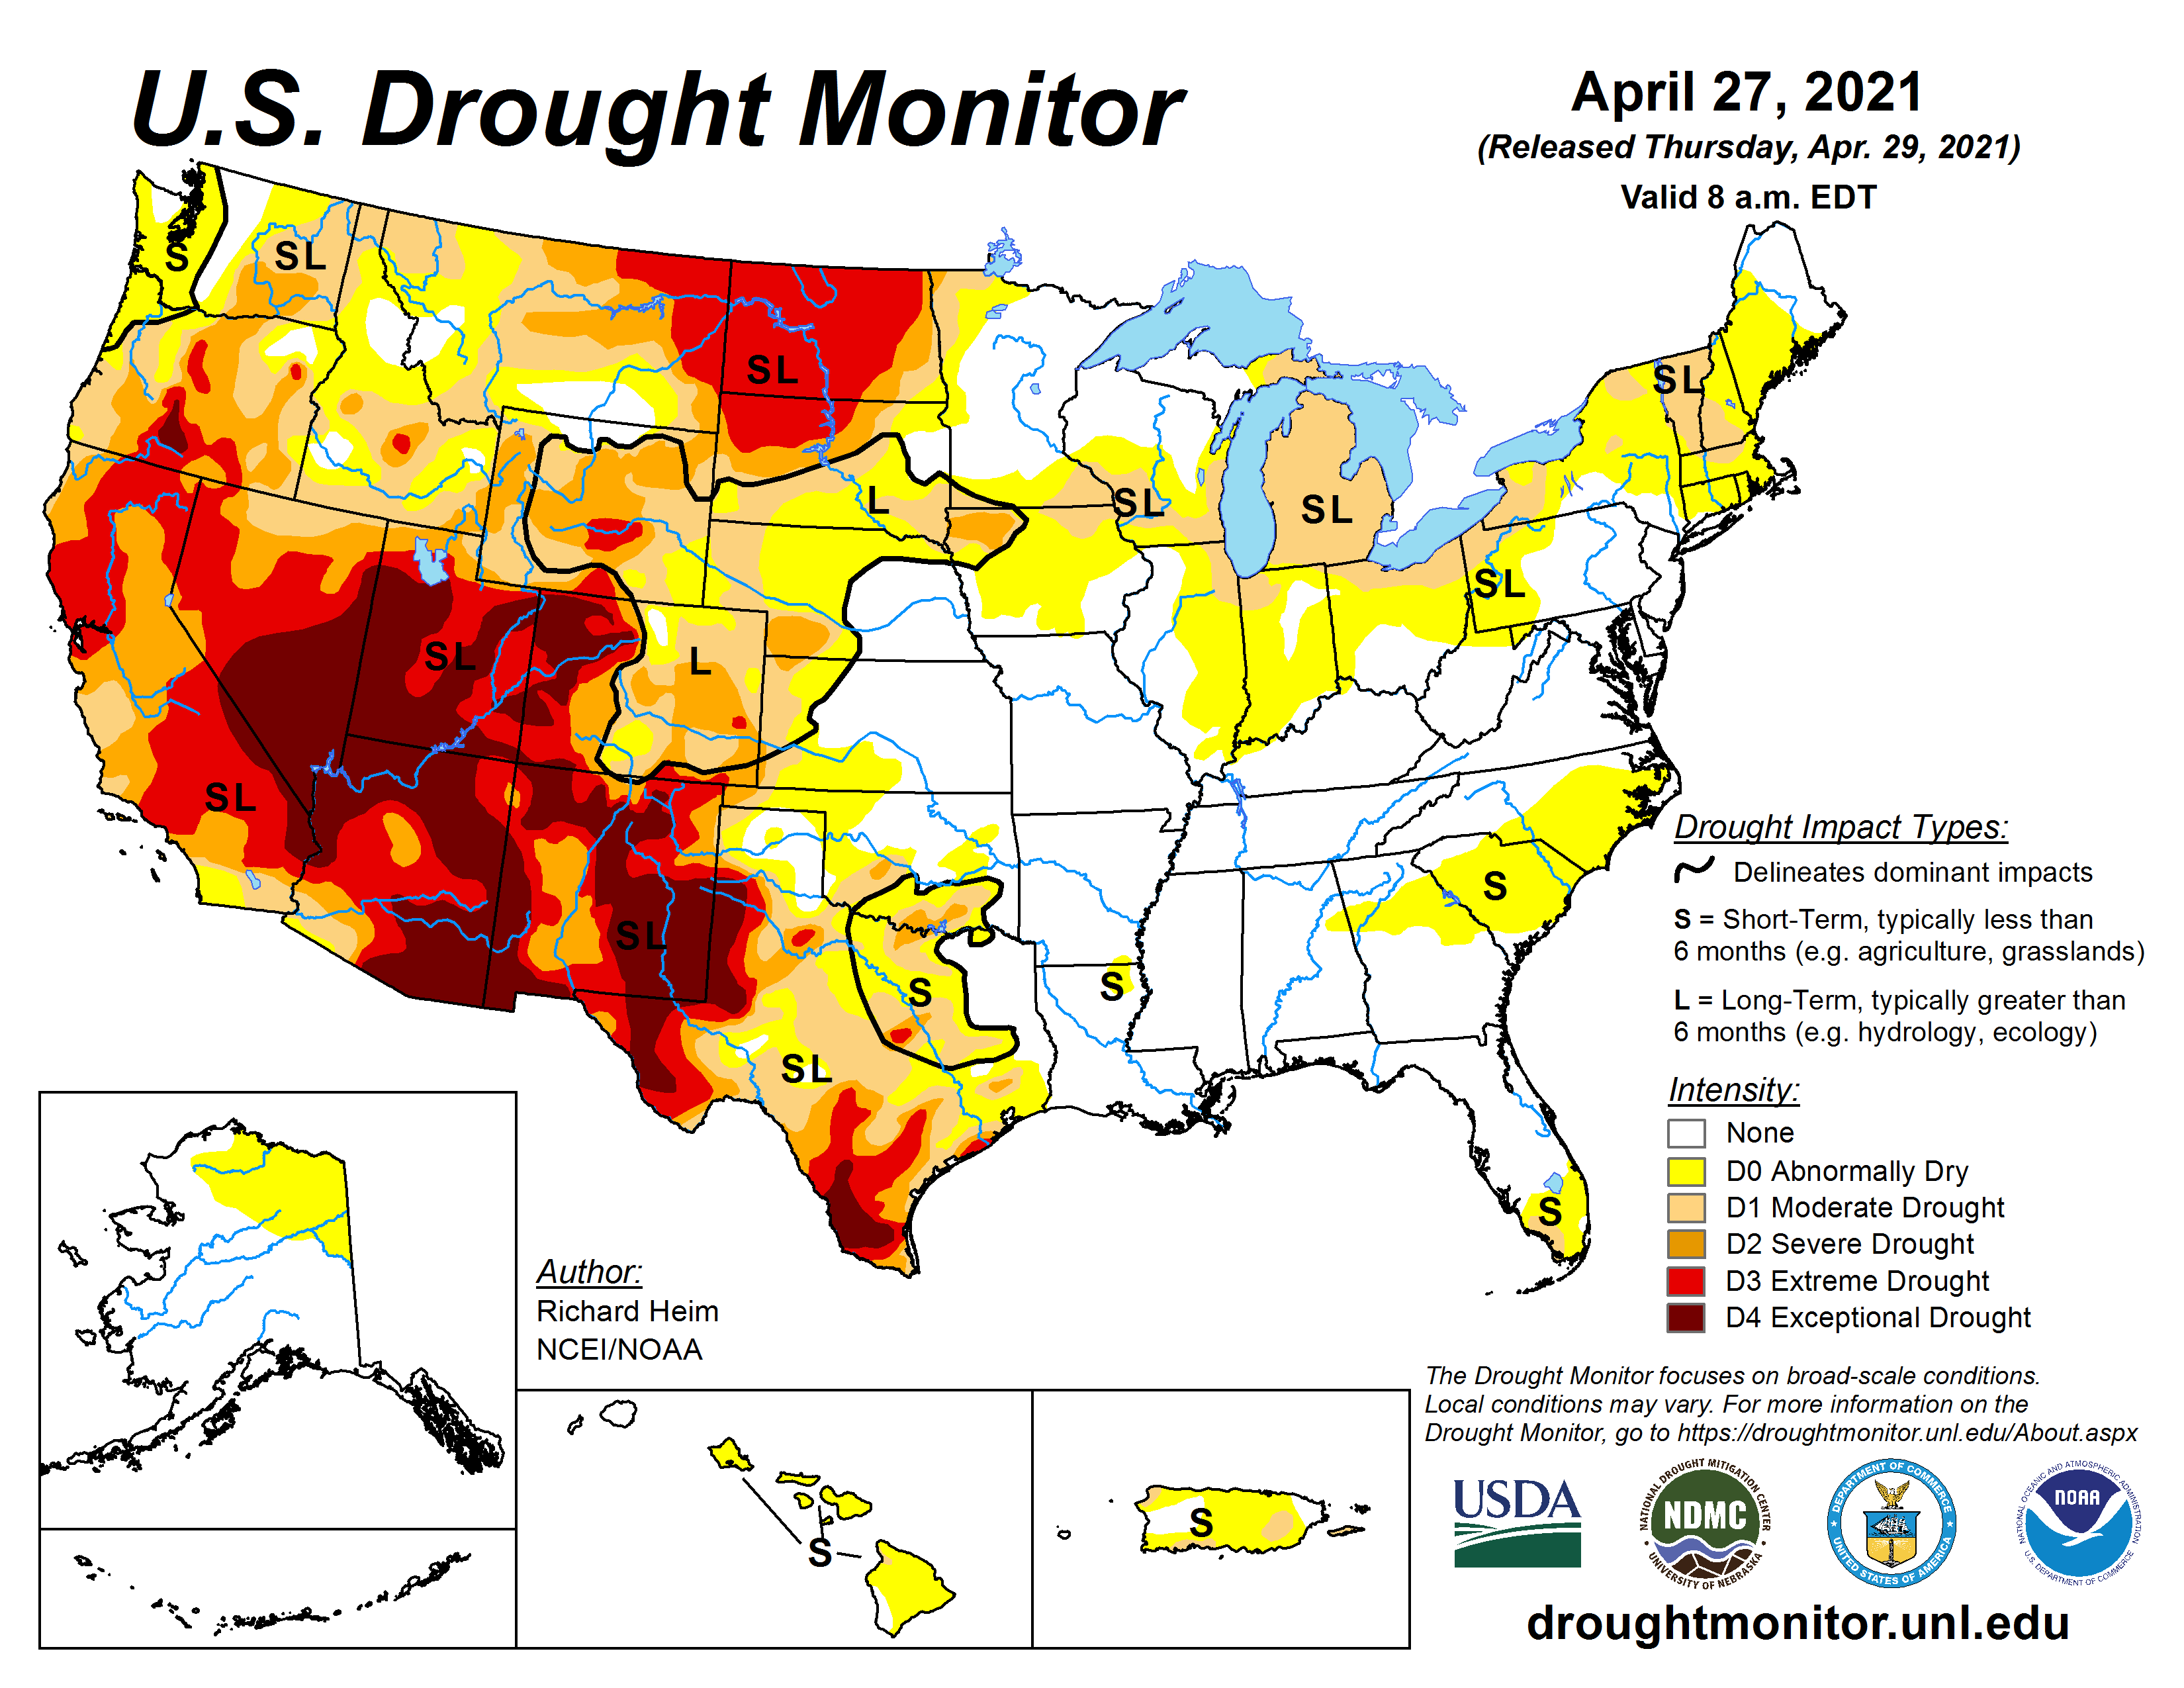
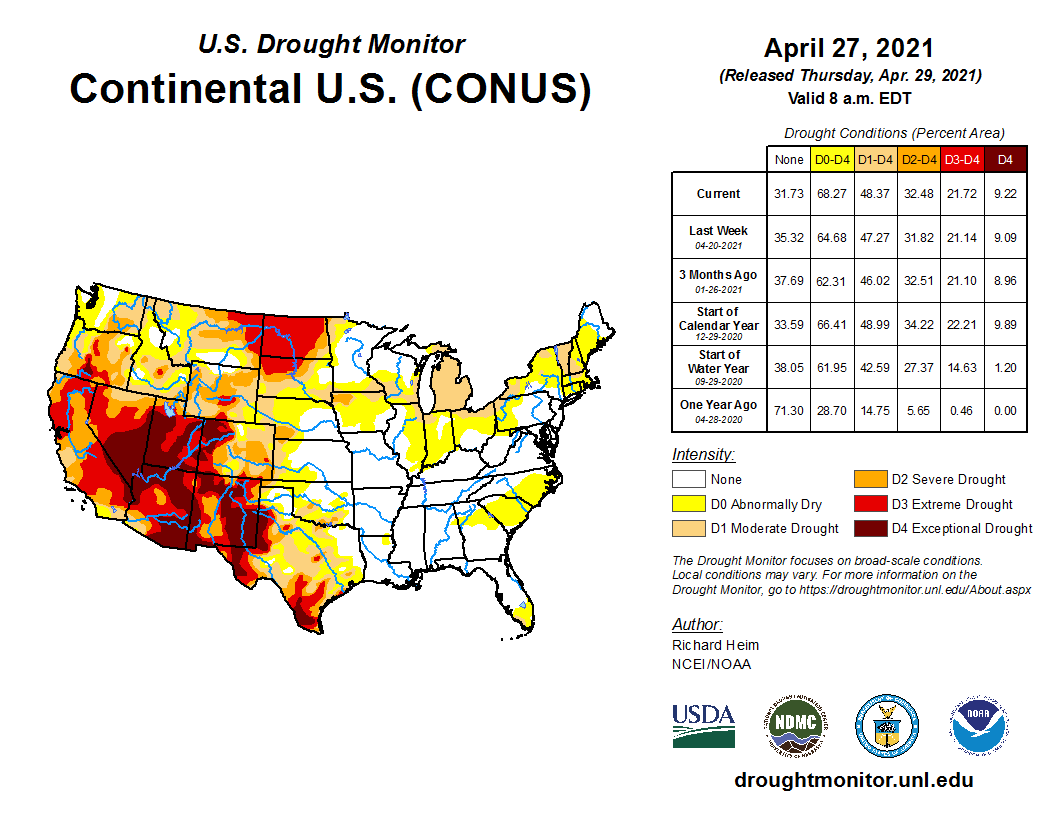
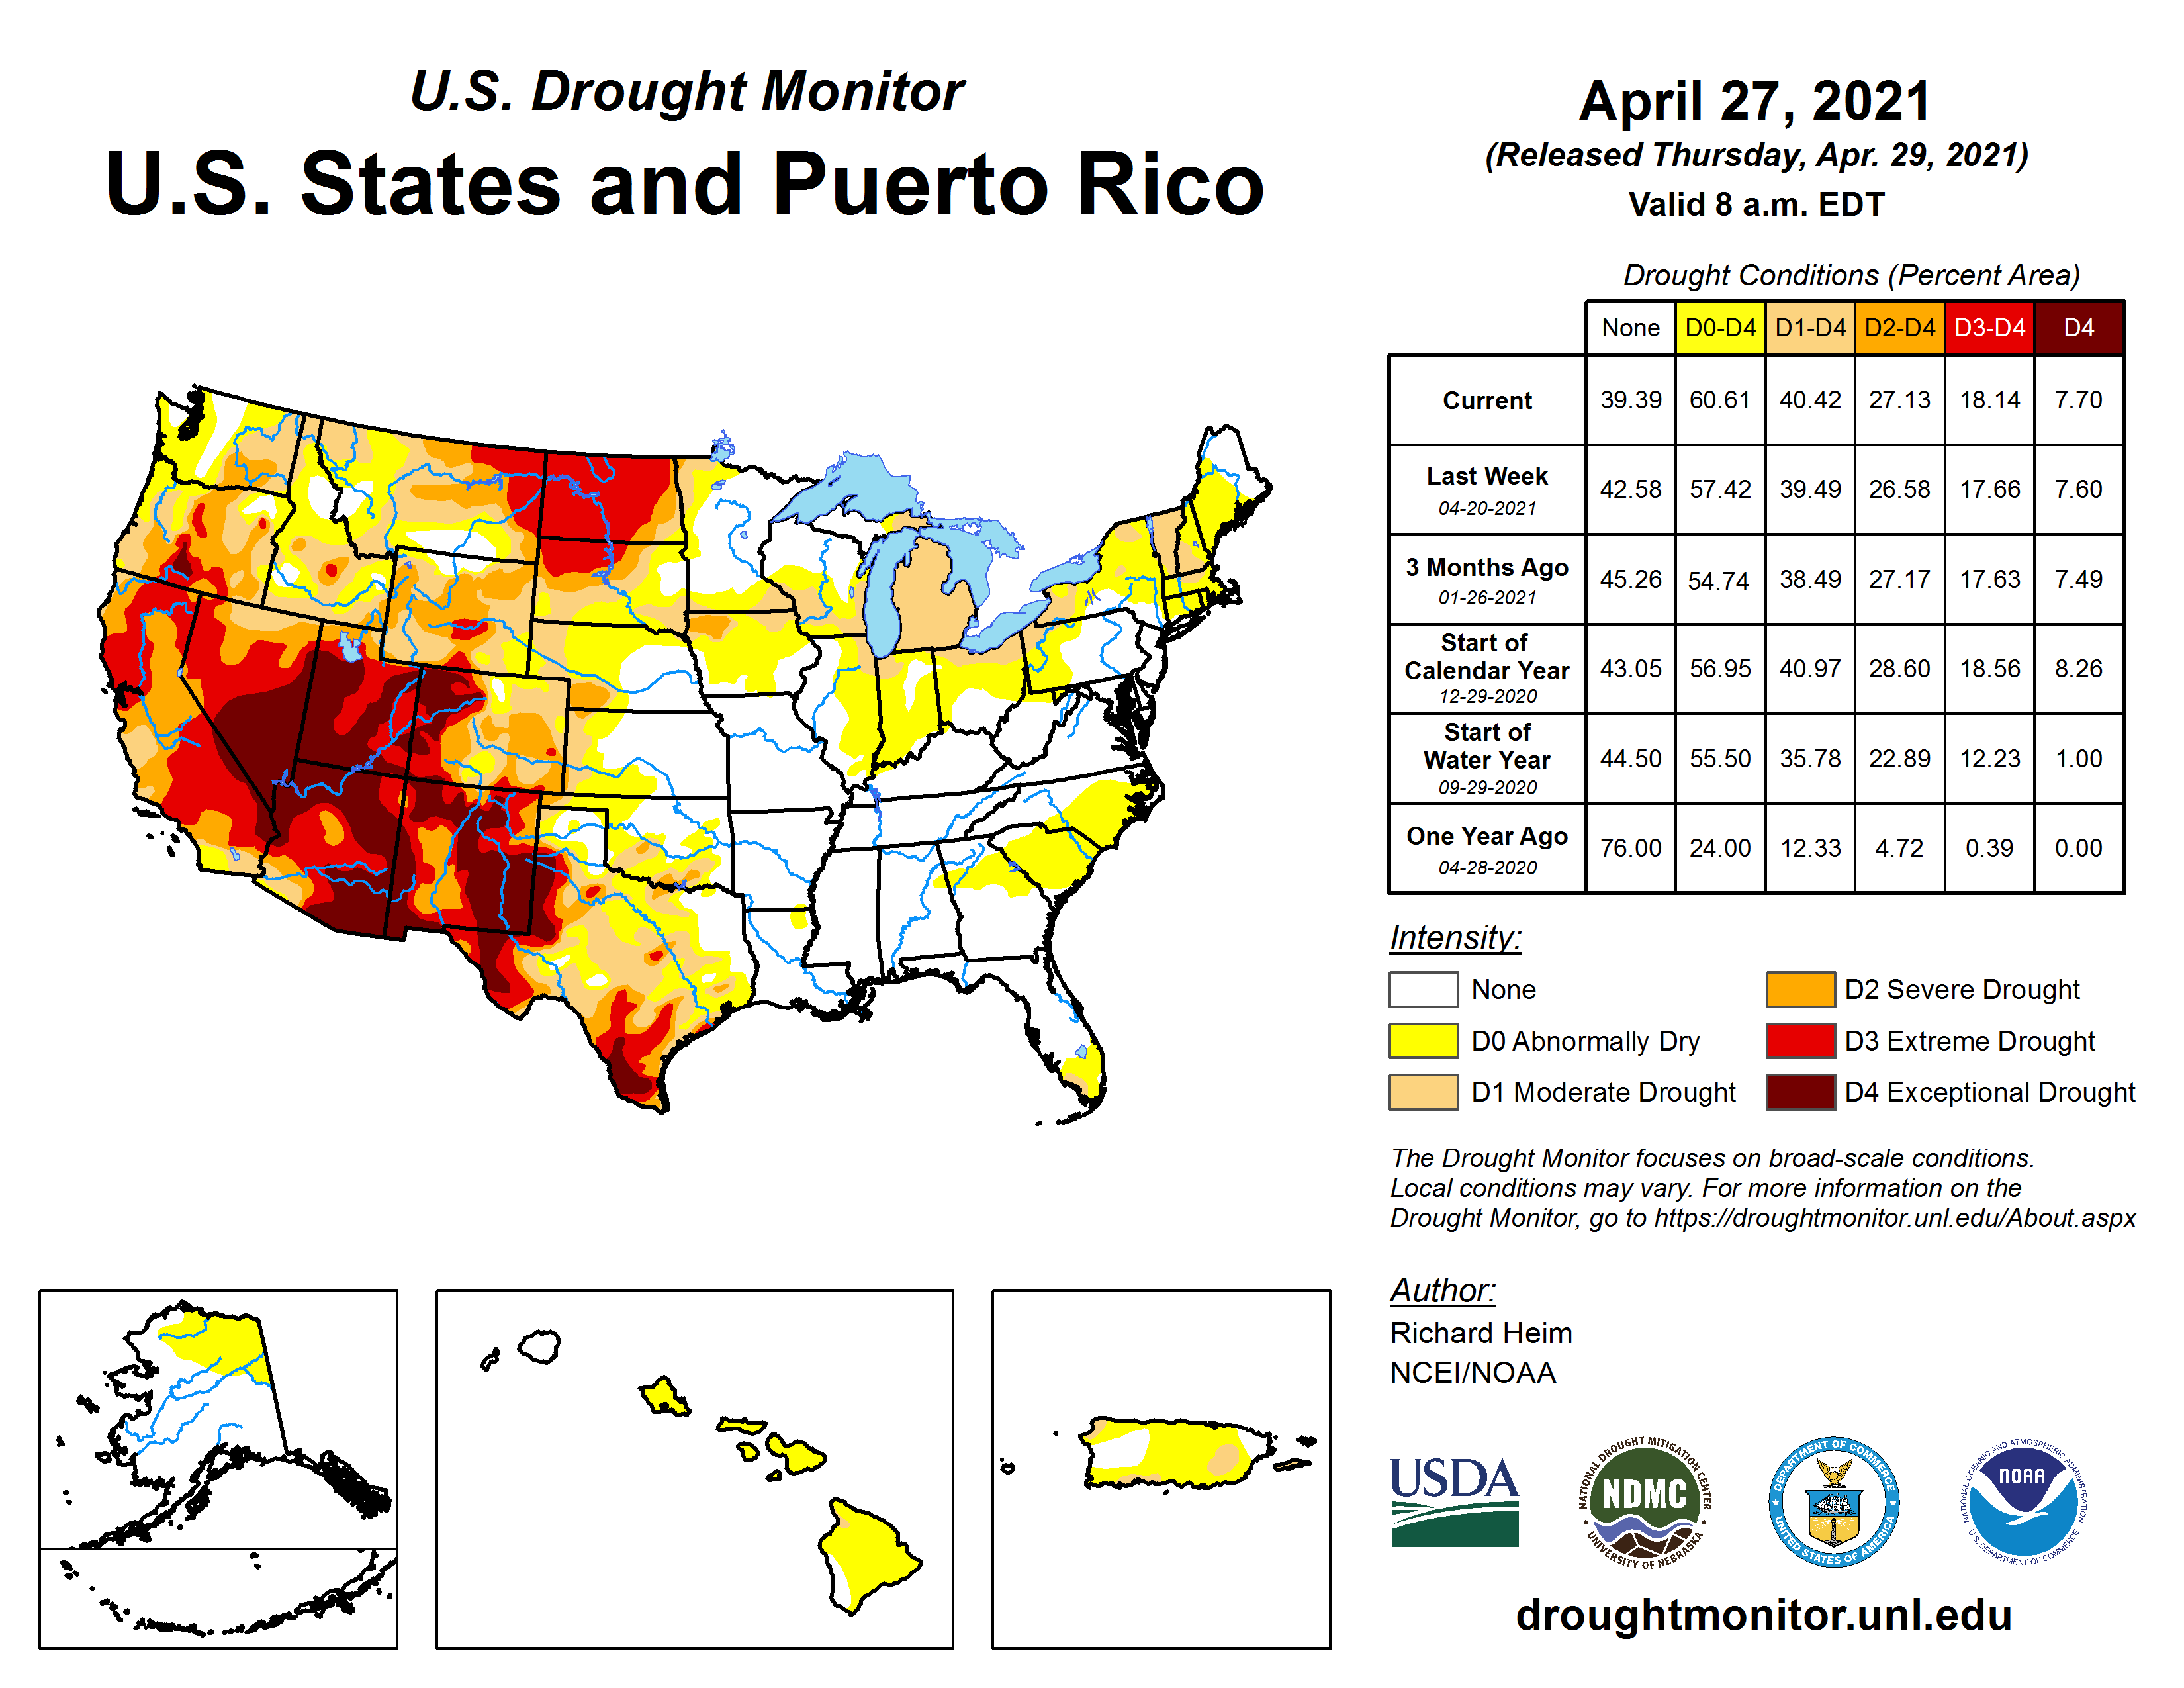
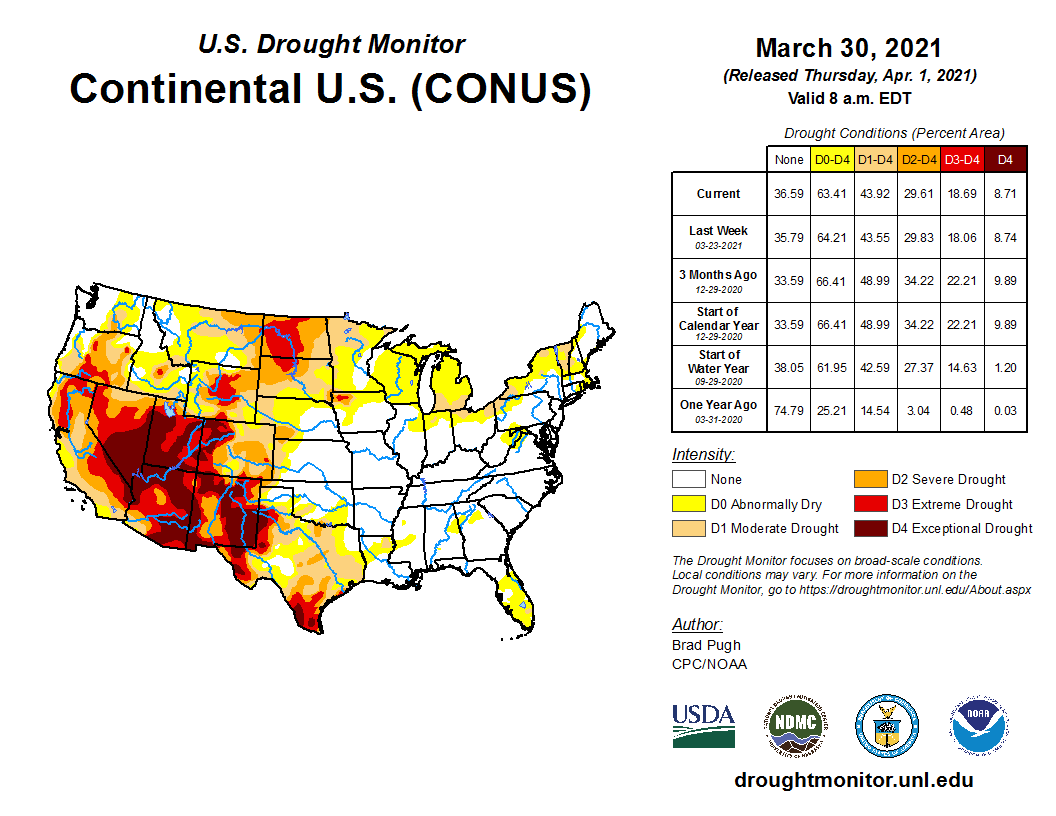
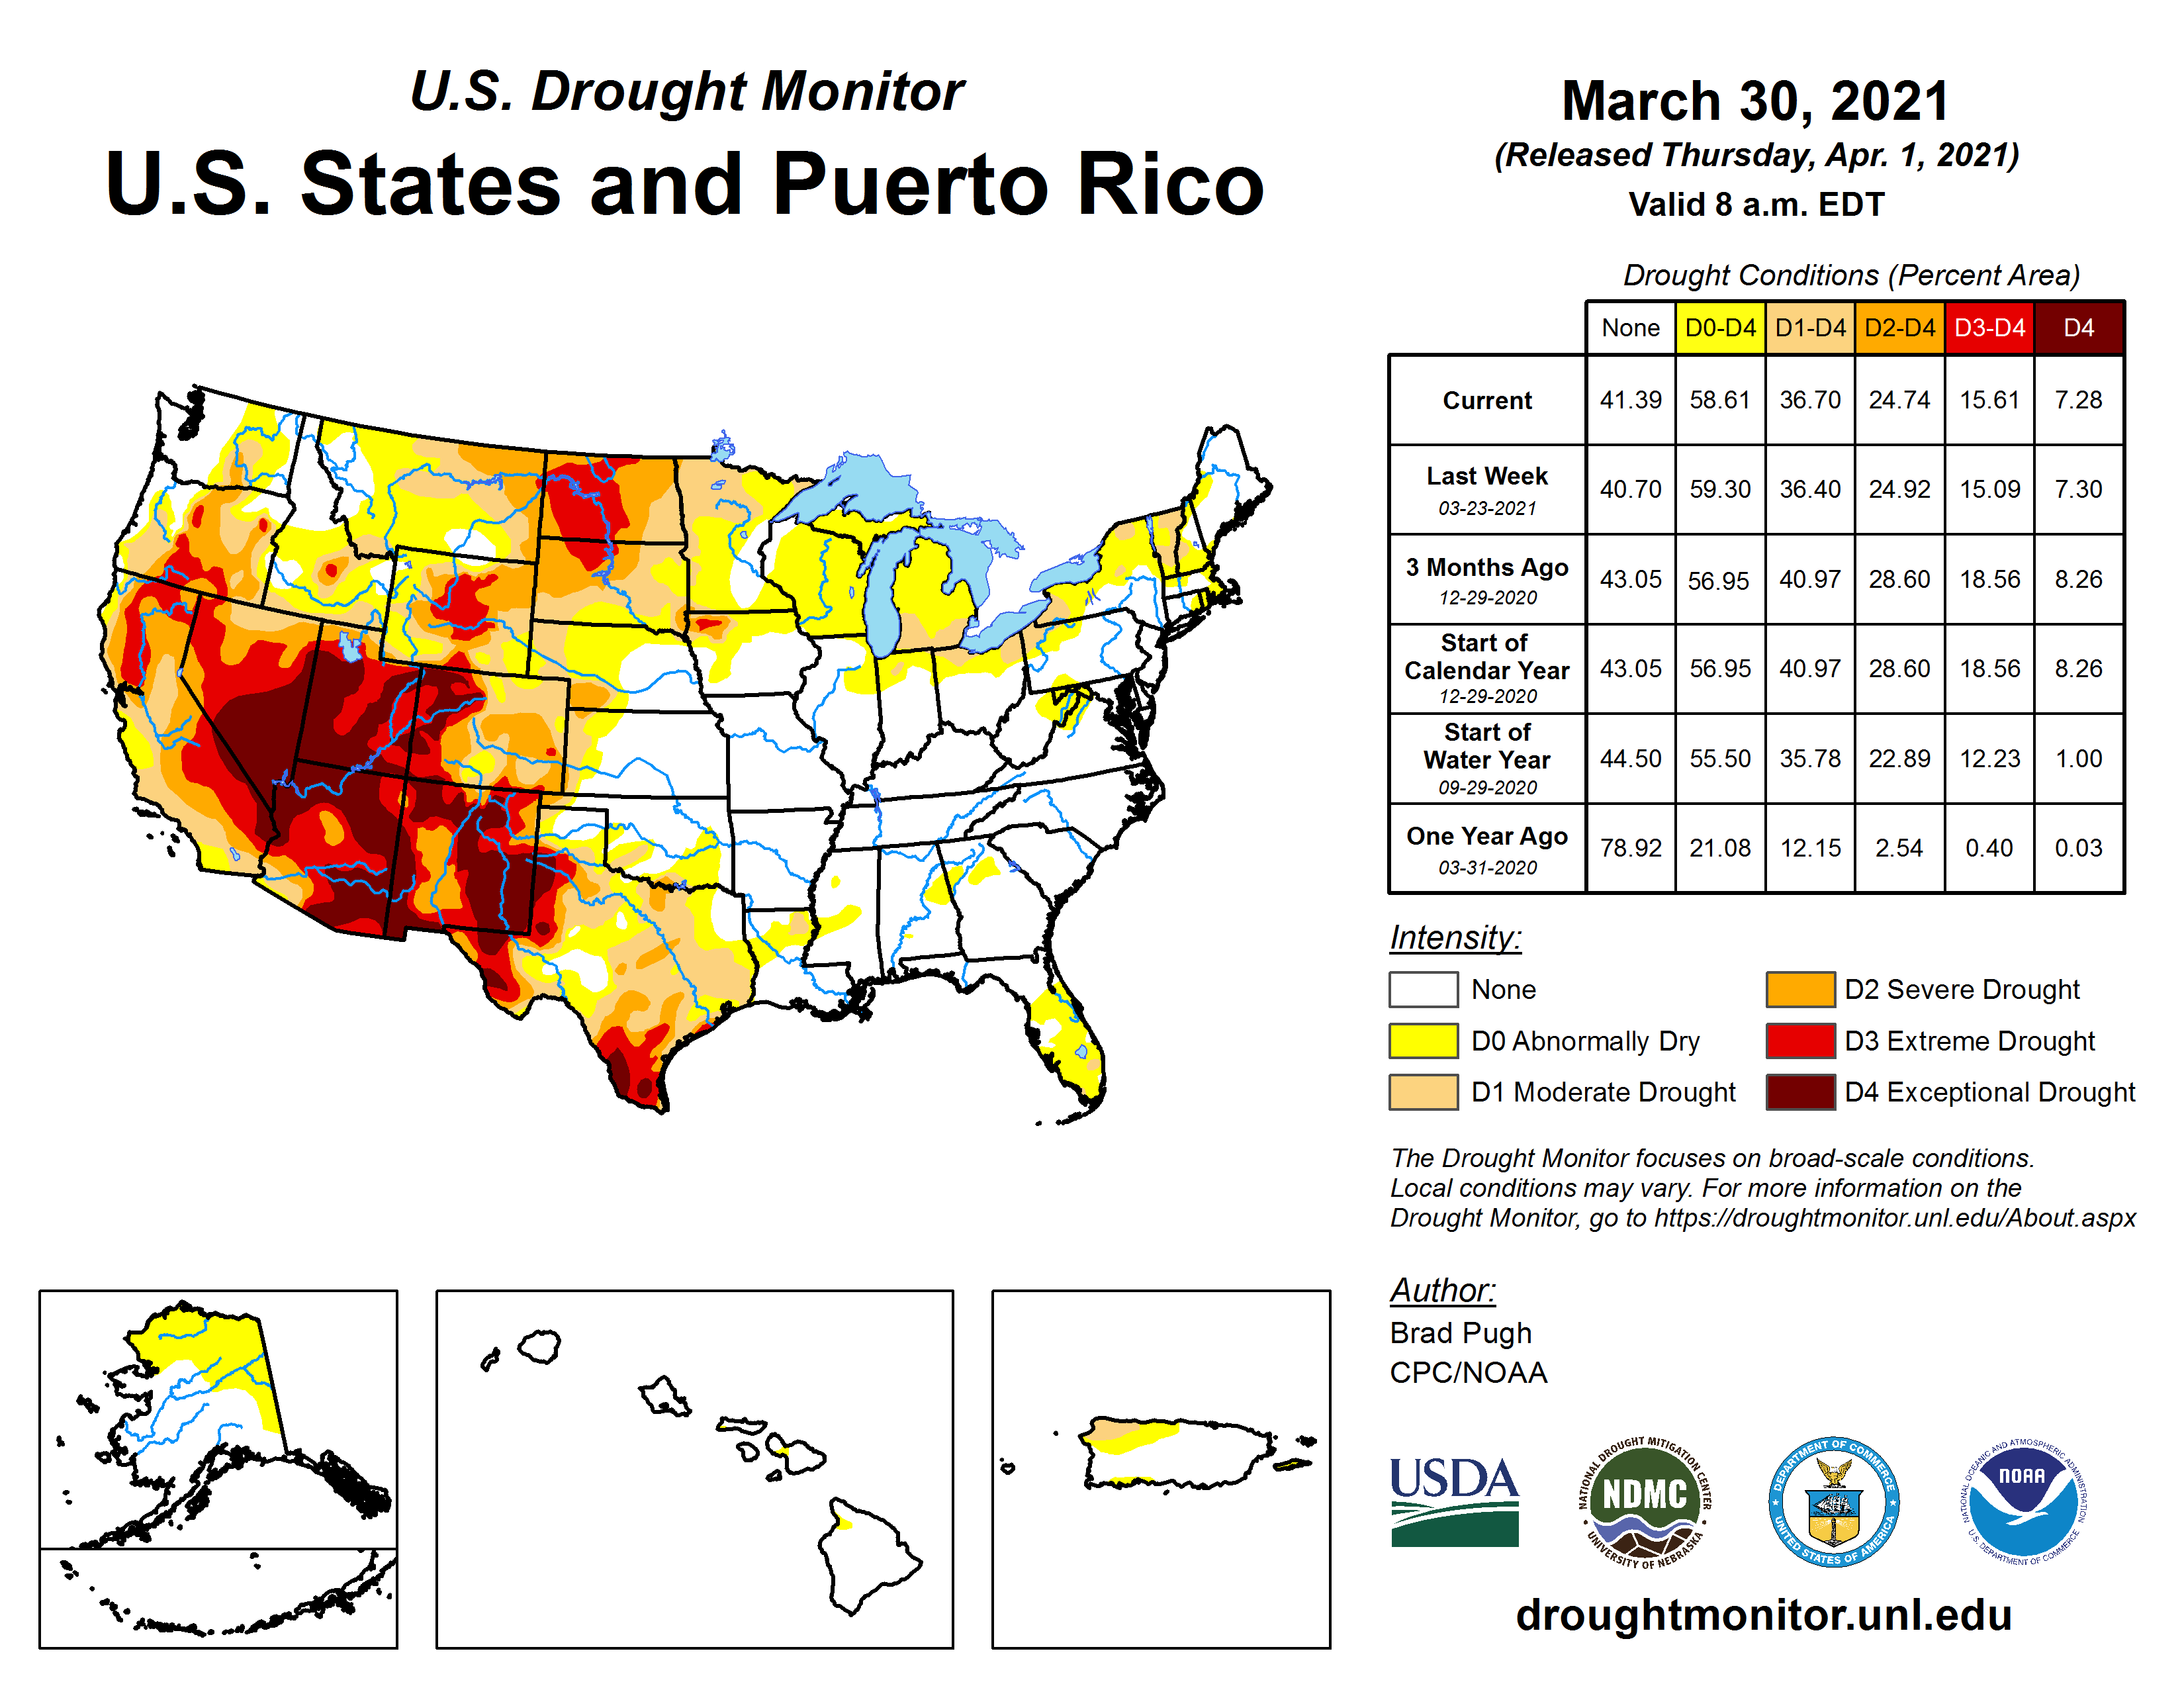
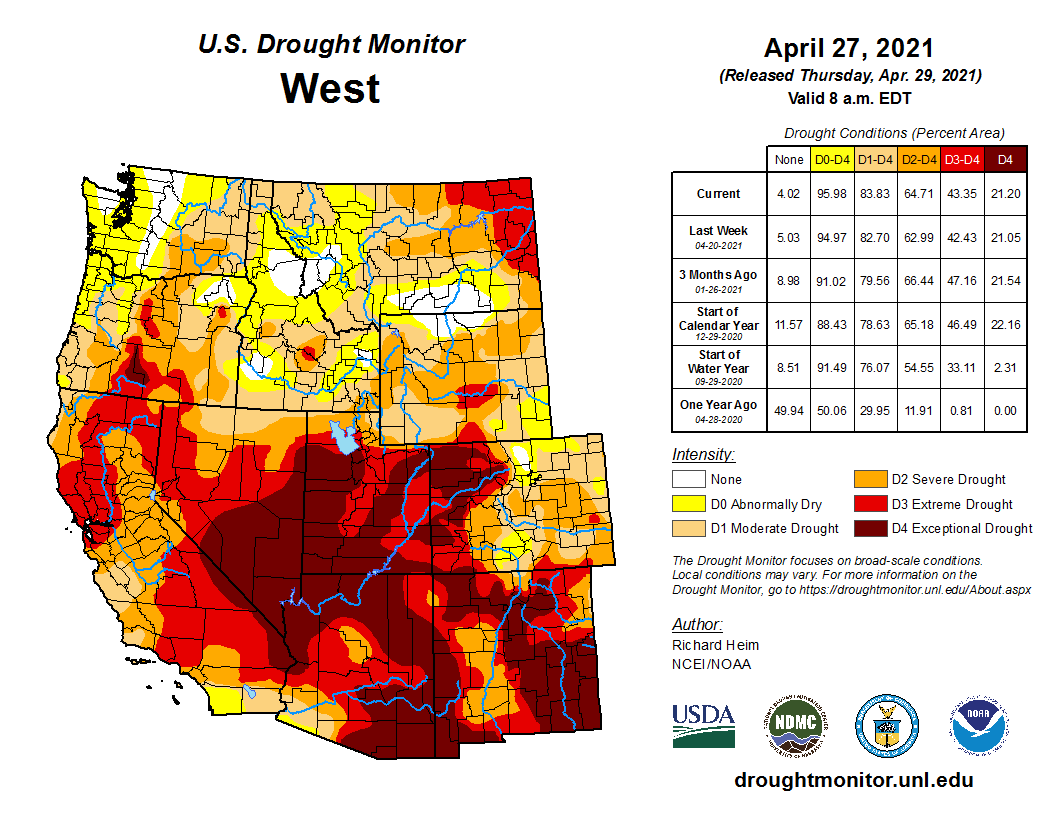
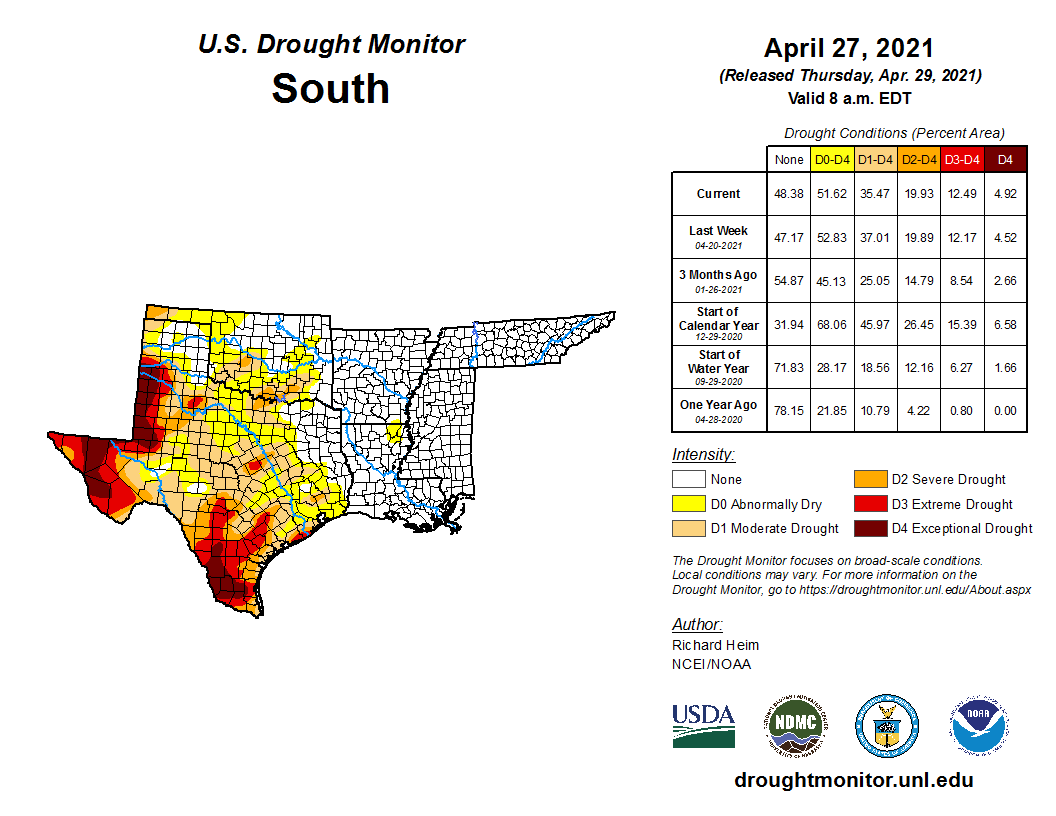
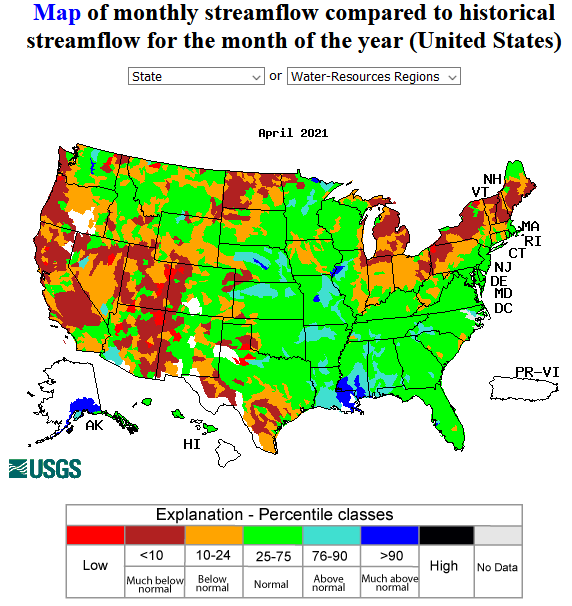
- According to the weekly U.S. Drought Monitor (USDM), as of April 27, 2021, 48.37% of the contiguous U.S. (CONUS) (40.43% of the U.S. including Alaska, Hawaii, and Puerto Rico) was classified as experiencing moderate to exceptional (D1-D4) drought.
Detailed Drought Overview
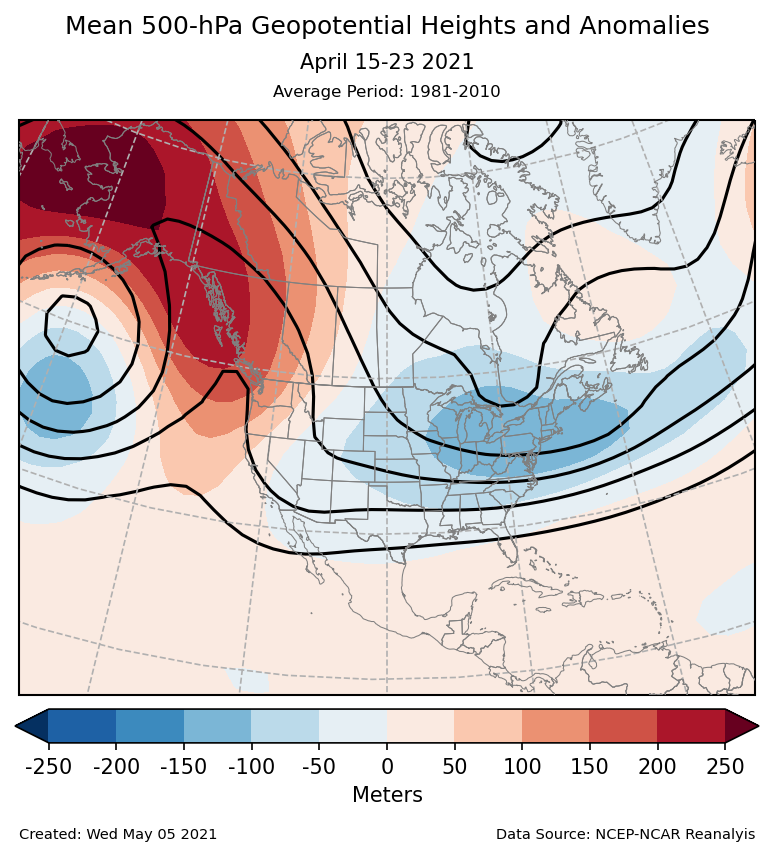
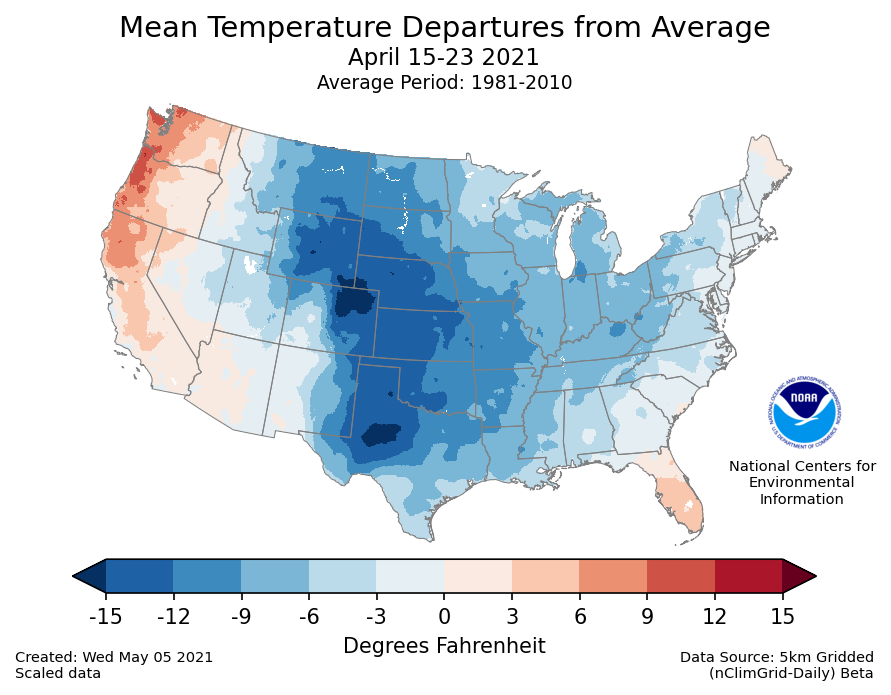
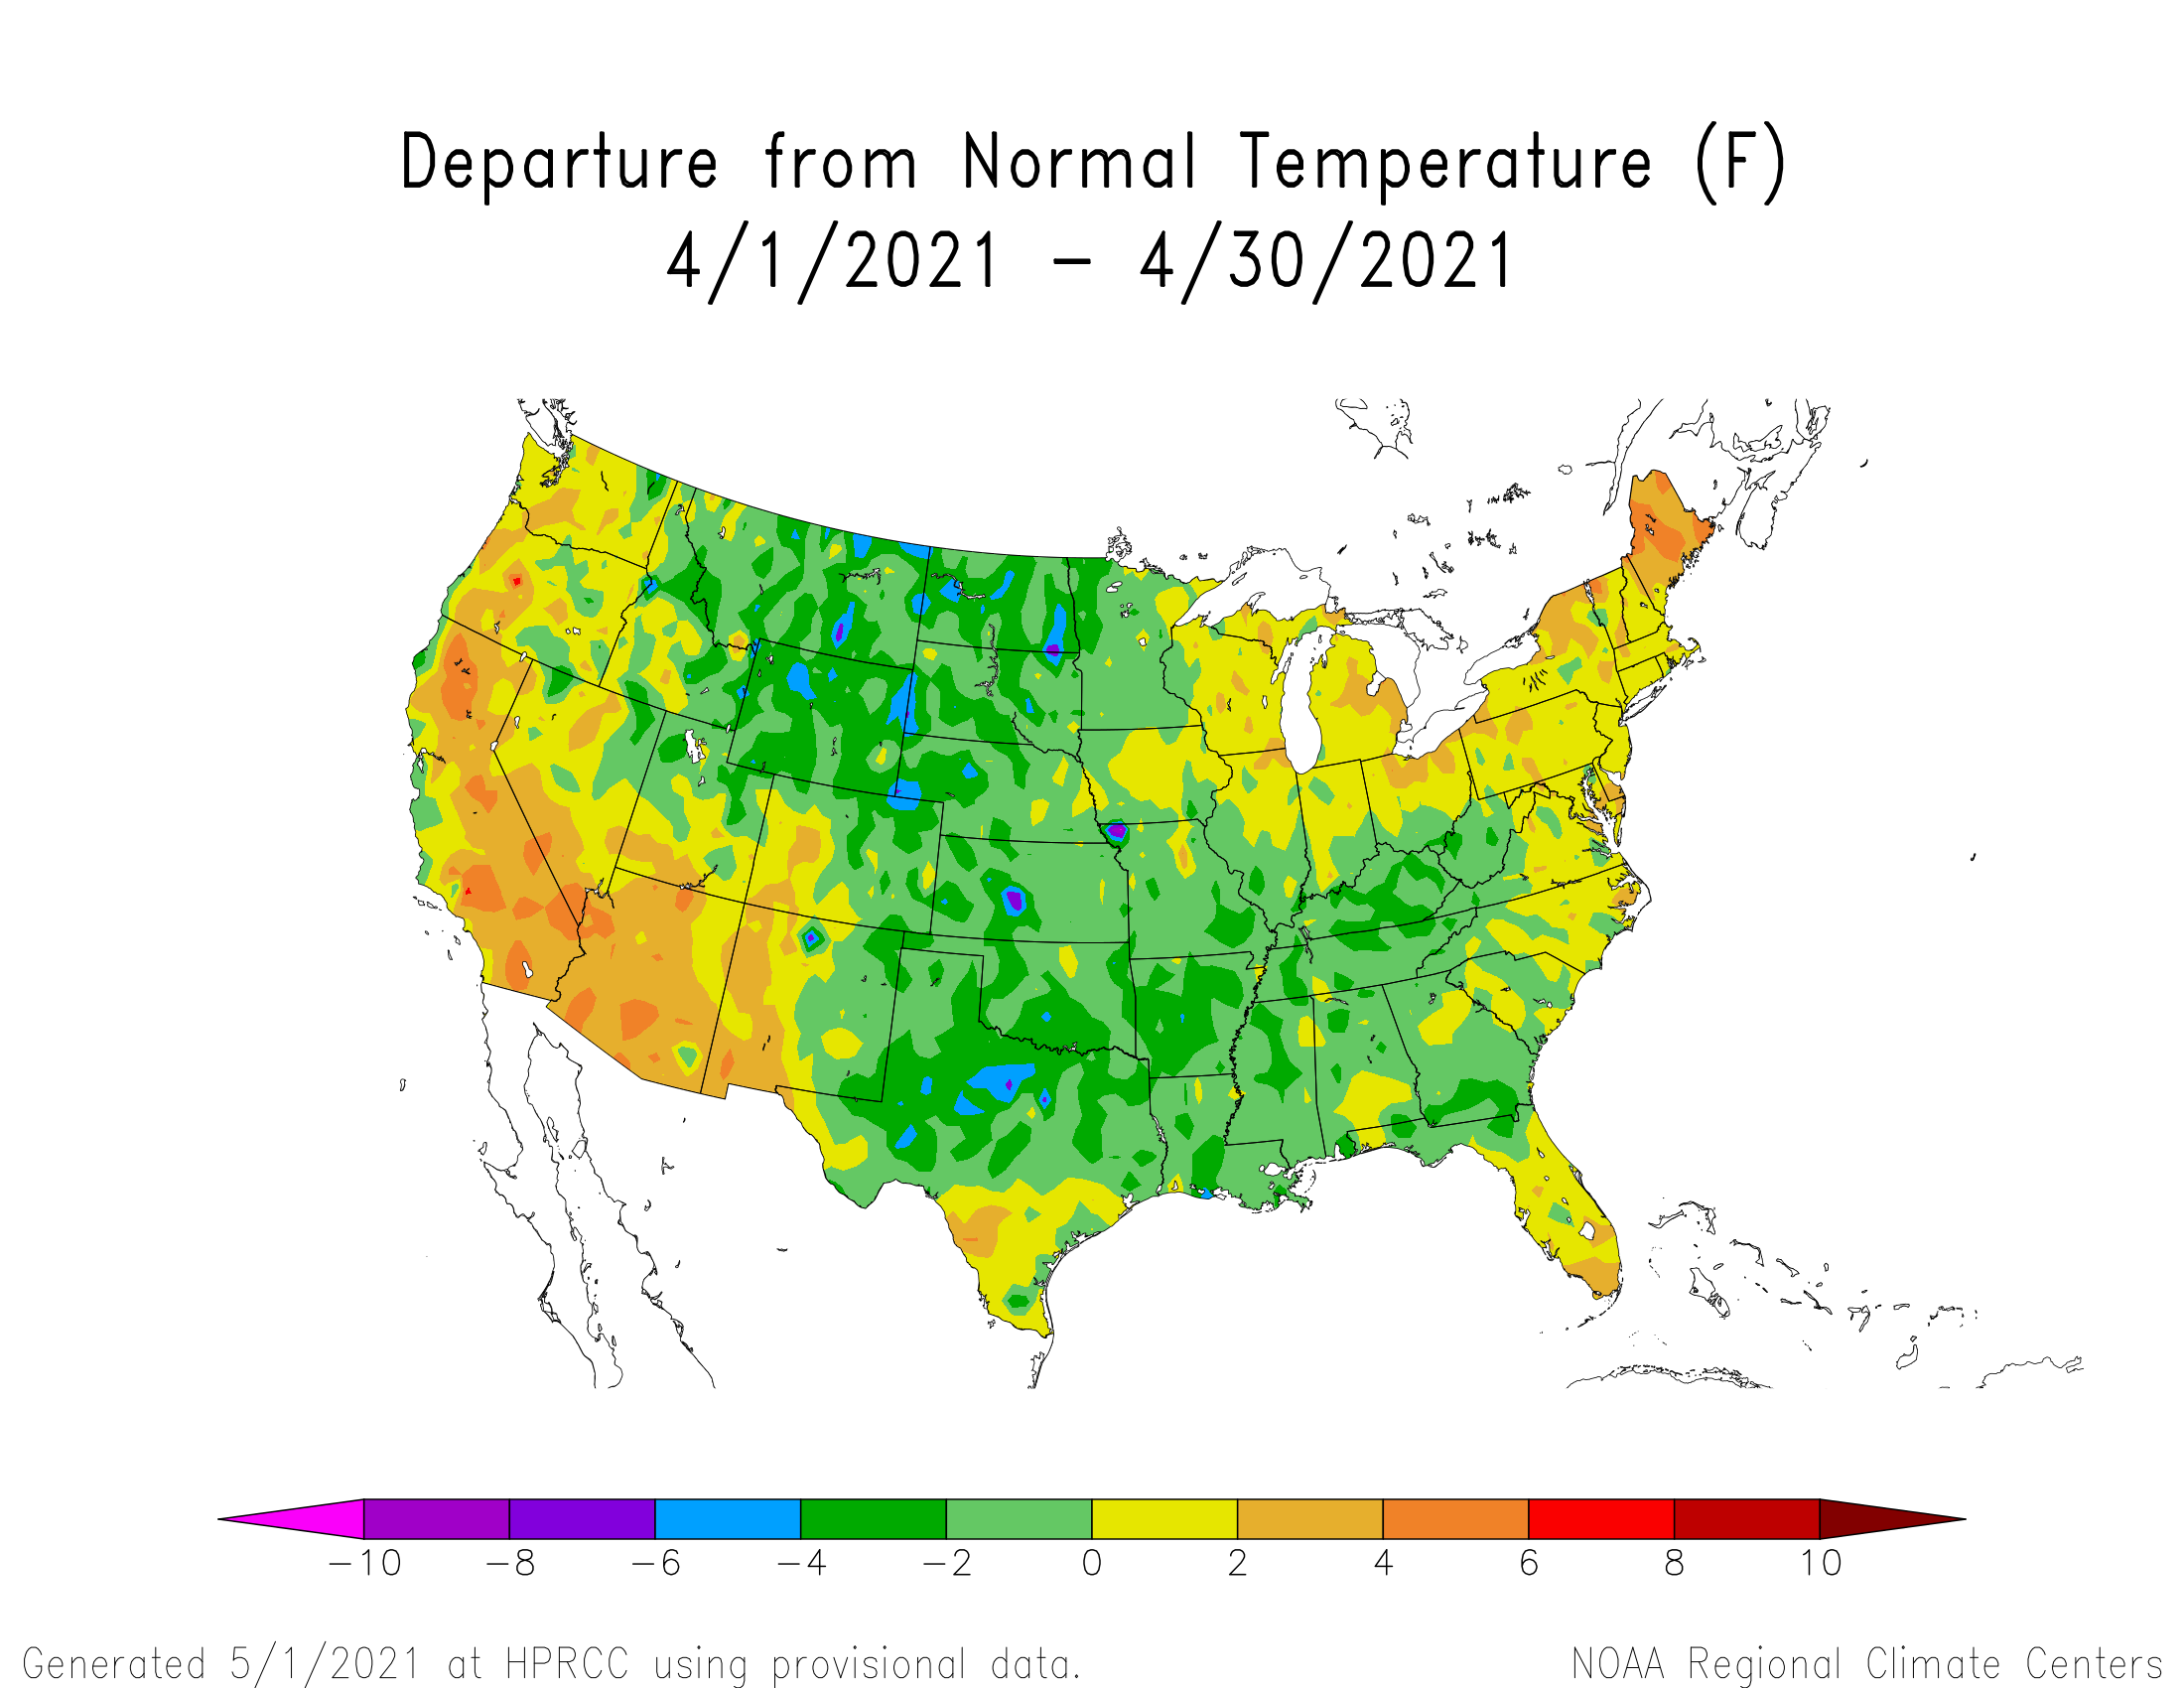
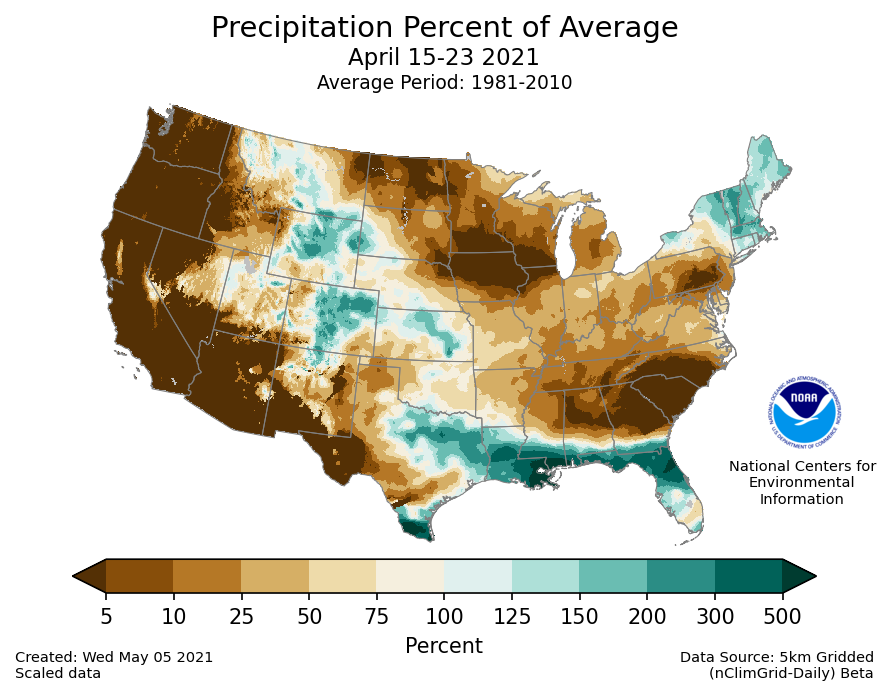
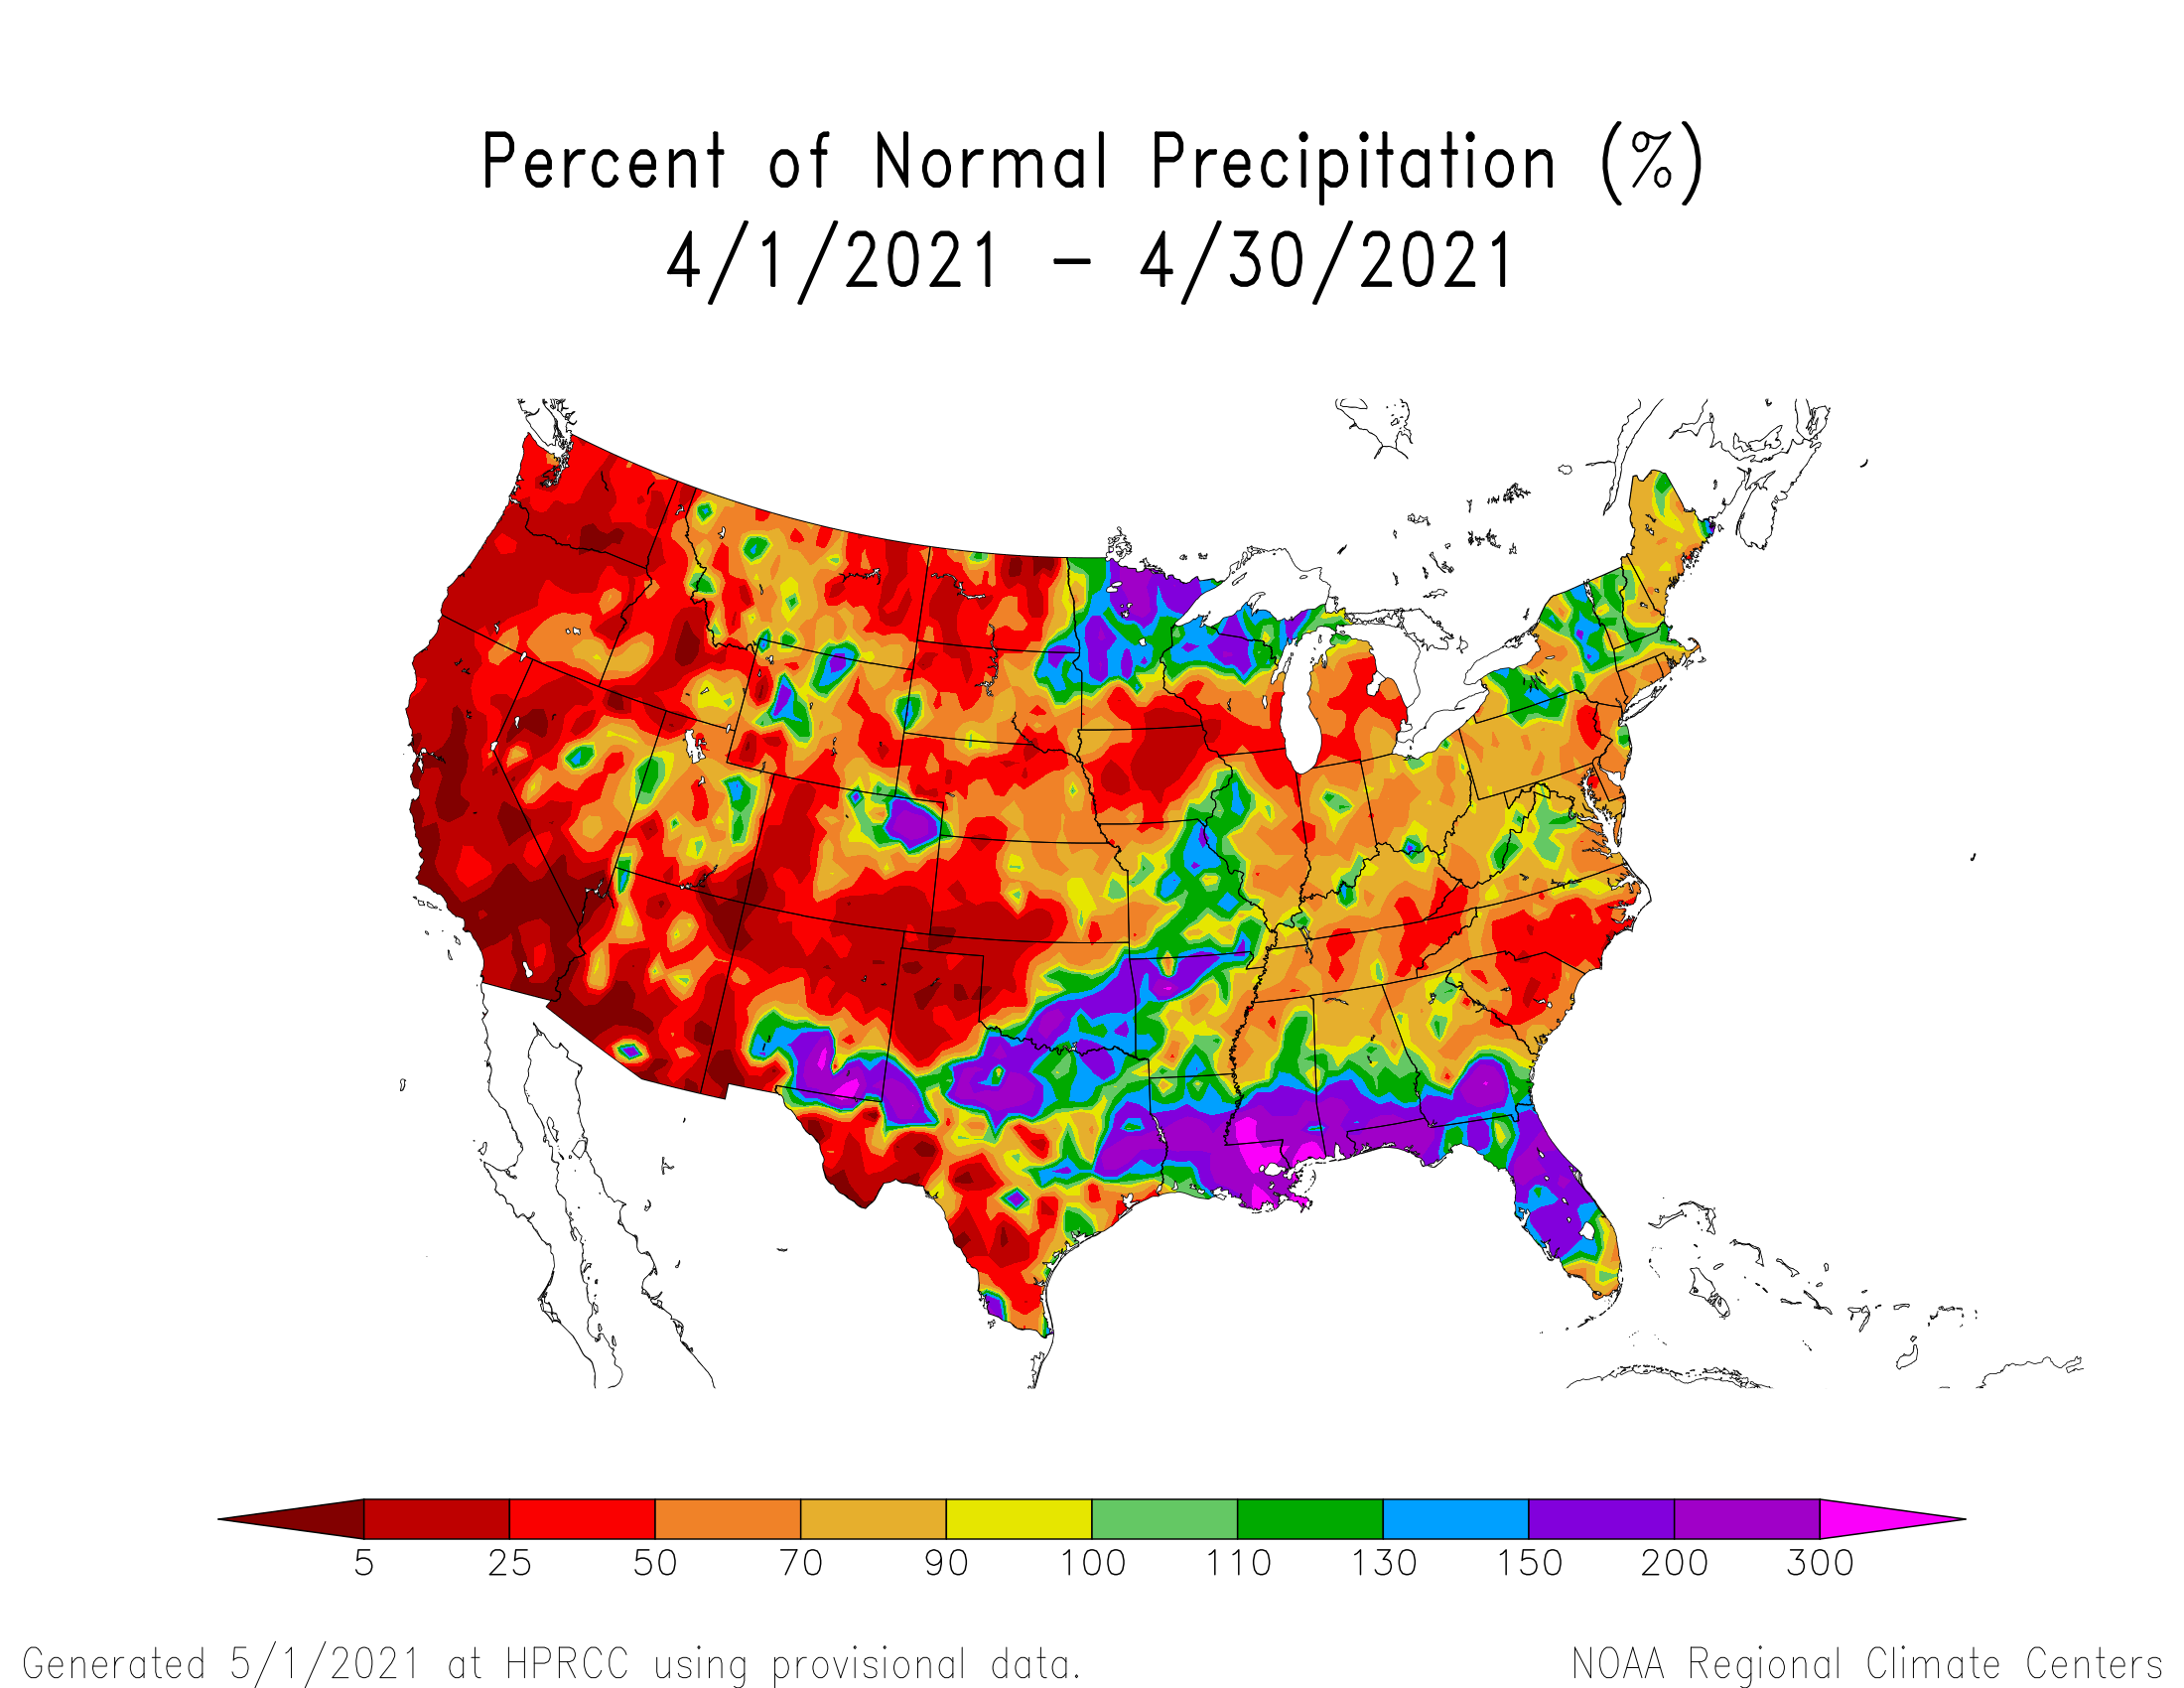
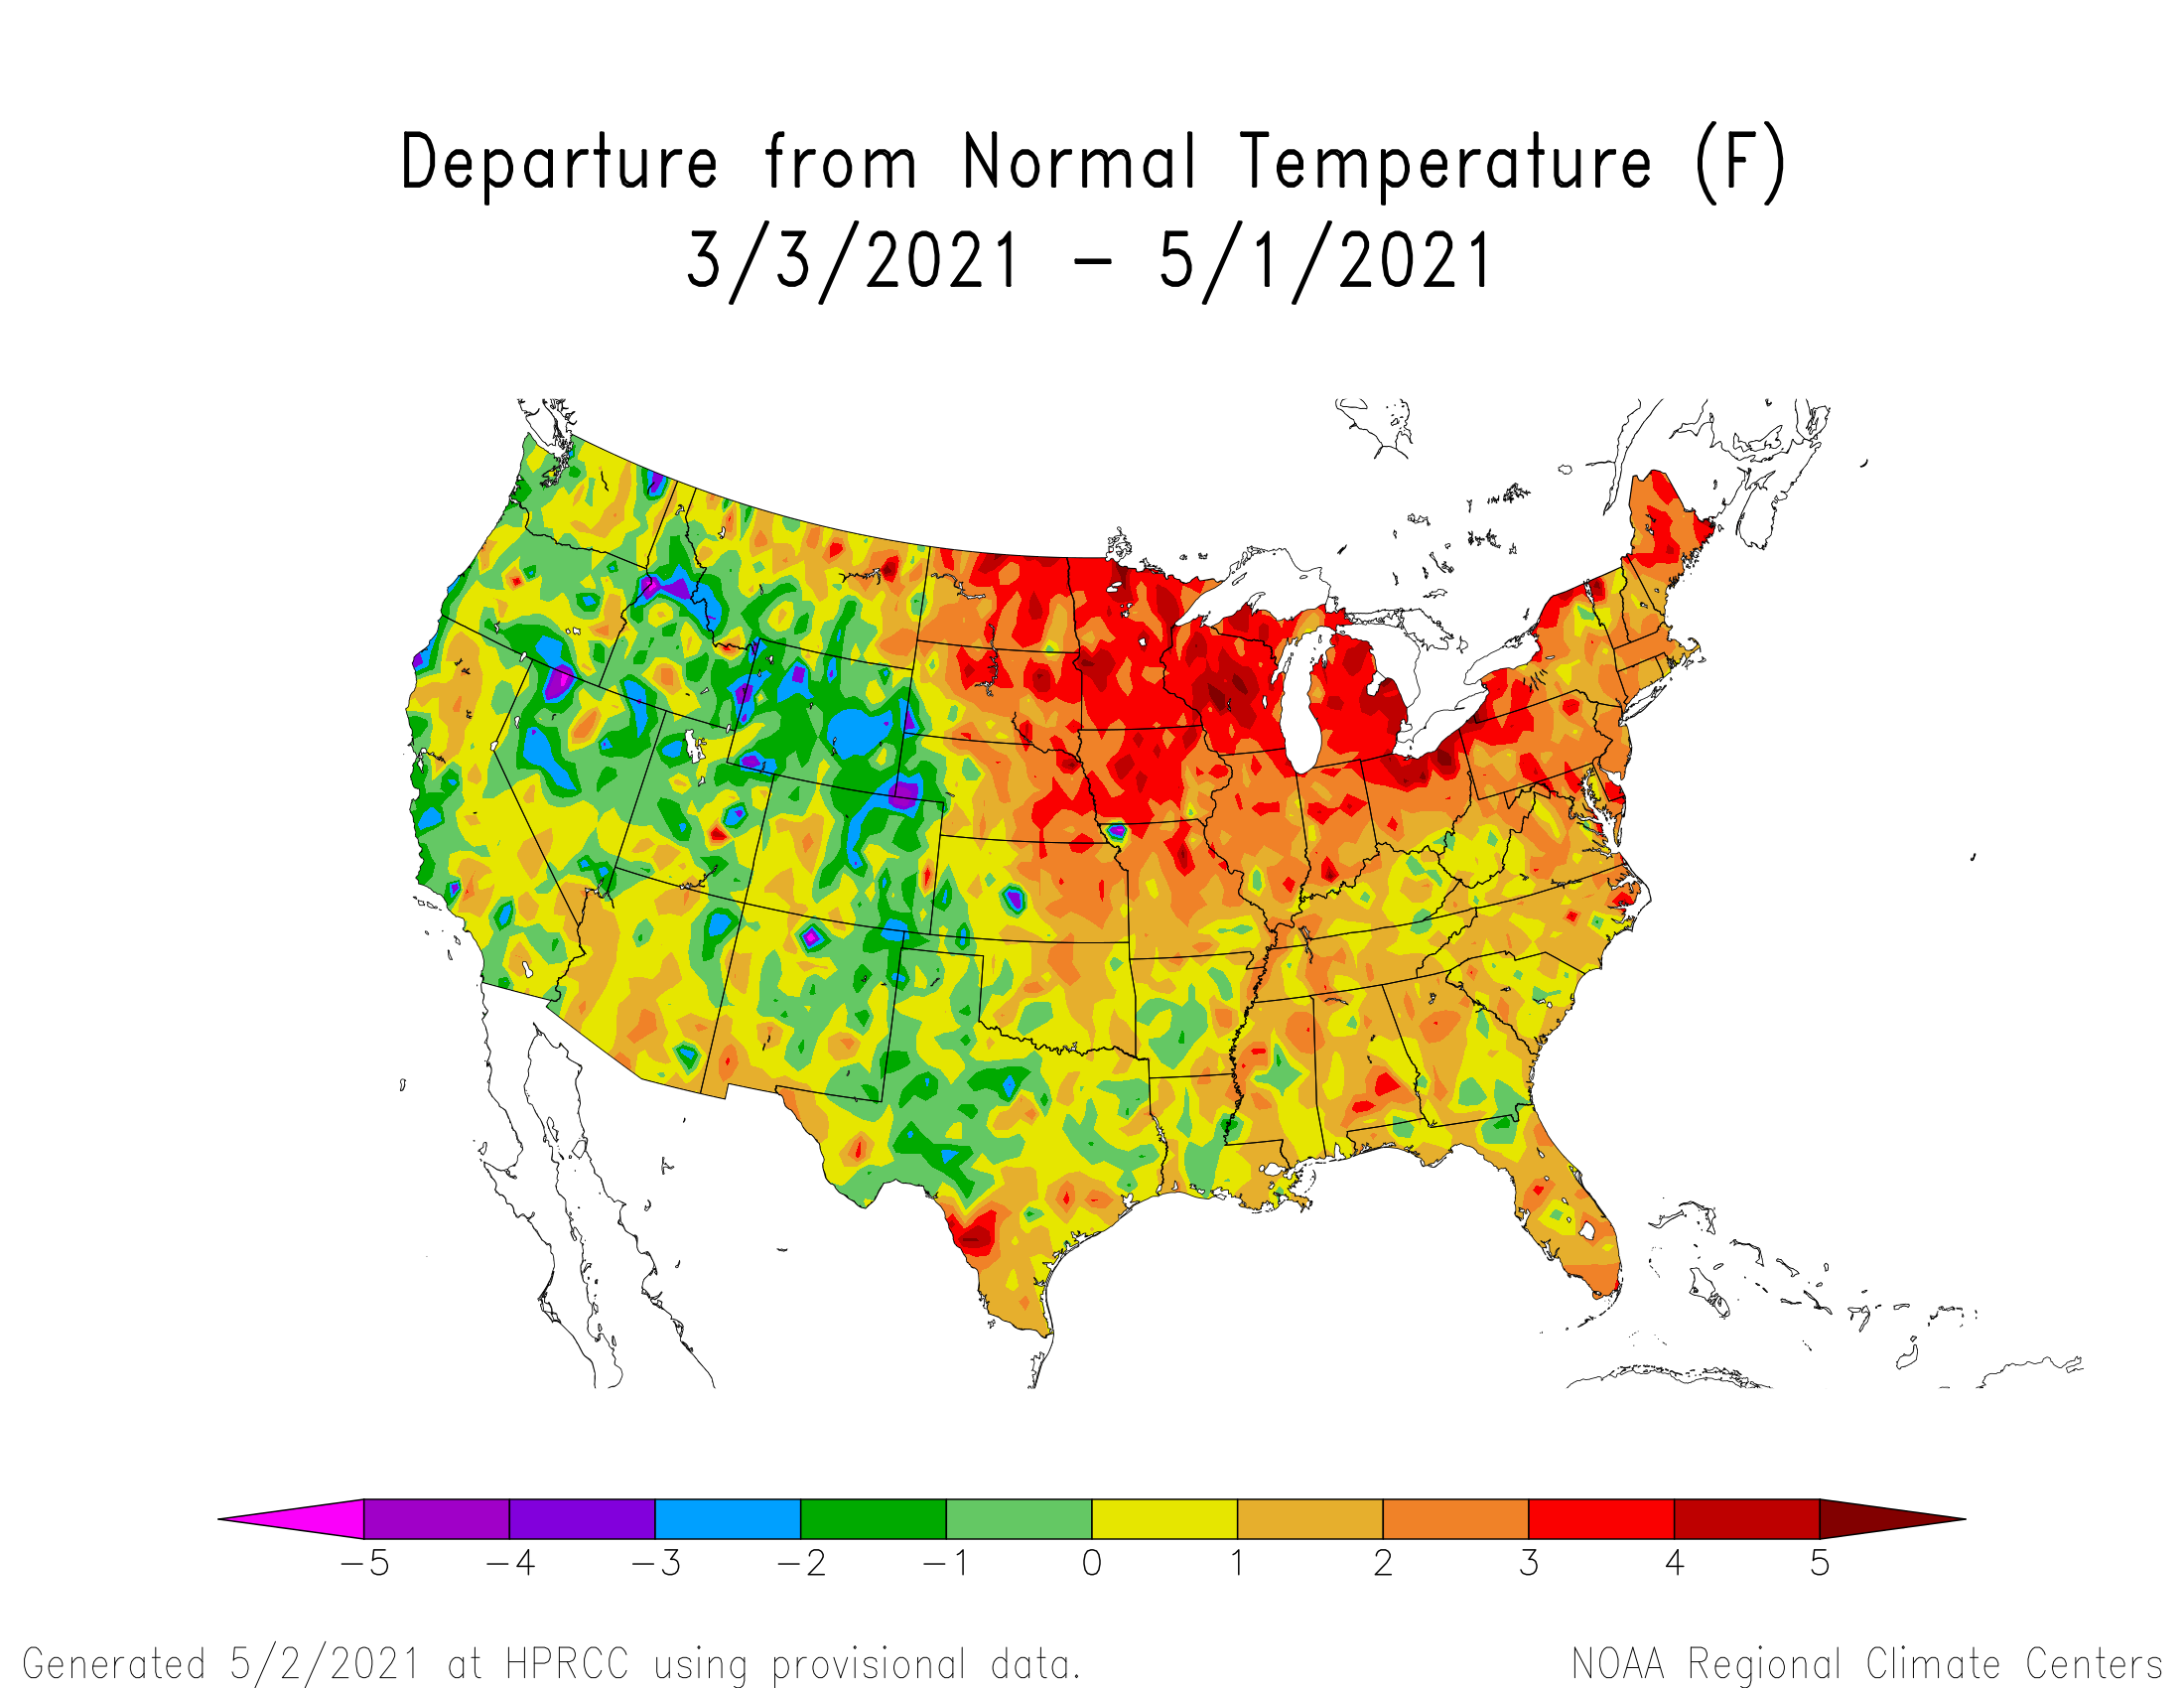
Several shortwave troughs and closed lows moved through the jet stream flow during April 2021, dragging surface lows and fronts with them. The weather systems generally moved in a west to east direction across the CONUS. The longwave pattern oscillated between predominant ridging and troughing throughout the month, with ridges dominating early and late in the month and a large trough holding sway during the middle of the month. The northerly flow spanning the continent, that was associated with the trough, funneled cold and dry Canadian air into the heart of the CONUS, resulting in below-normal temperatures that dominated the monthly mean across the Plains to Southeast, as well as below-normal precipitation for the period. When averaged across the month, the atmospheric circulation consisted of an anomalous ridge along the West Coast and trough just off the Atlantic Coast. The ridge inhibited precipitation over the West, while the northerly flow of dry Canadian air masses blocked Gulf of Mexico moisture from reaching the central to northern Plains and areas further east. At times, some troughs and lows tracked northeast from the central Rockies to Upper Mississippi Valley, and from the southern Plains to Northeast, while others tracked along cold fronts situated near the Gulf of Mexico — these systems brought above-normal precipitation to parts of these regions. But for most of the CONUS, April was drier than normal.
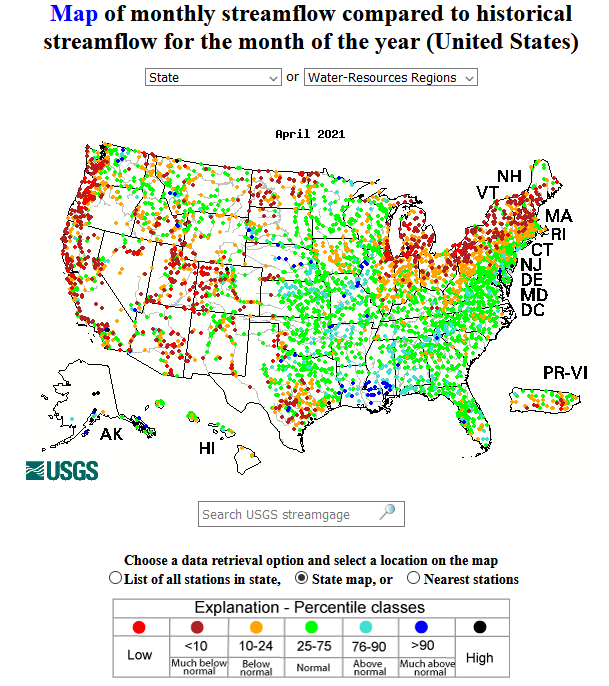
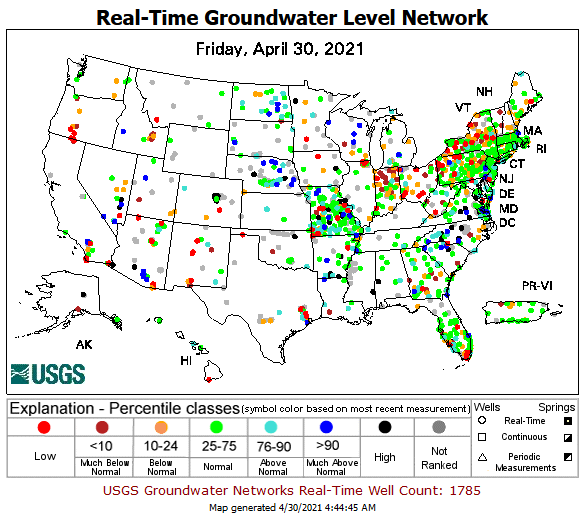
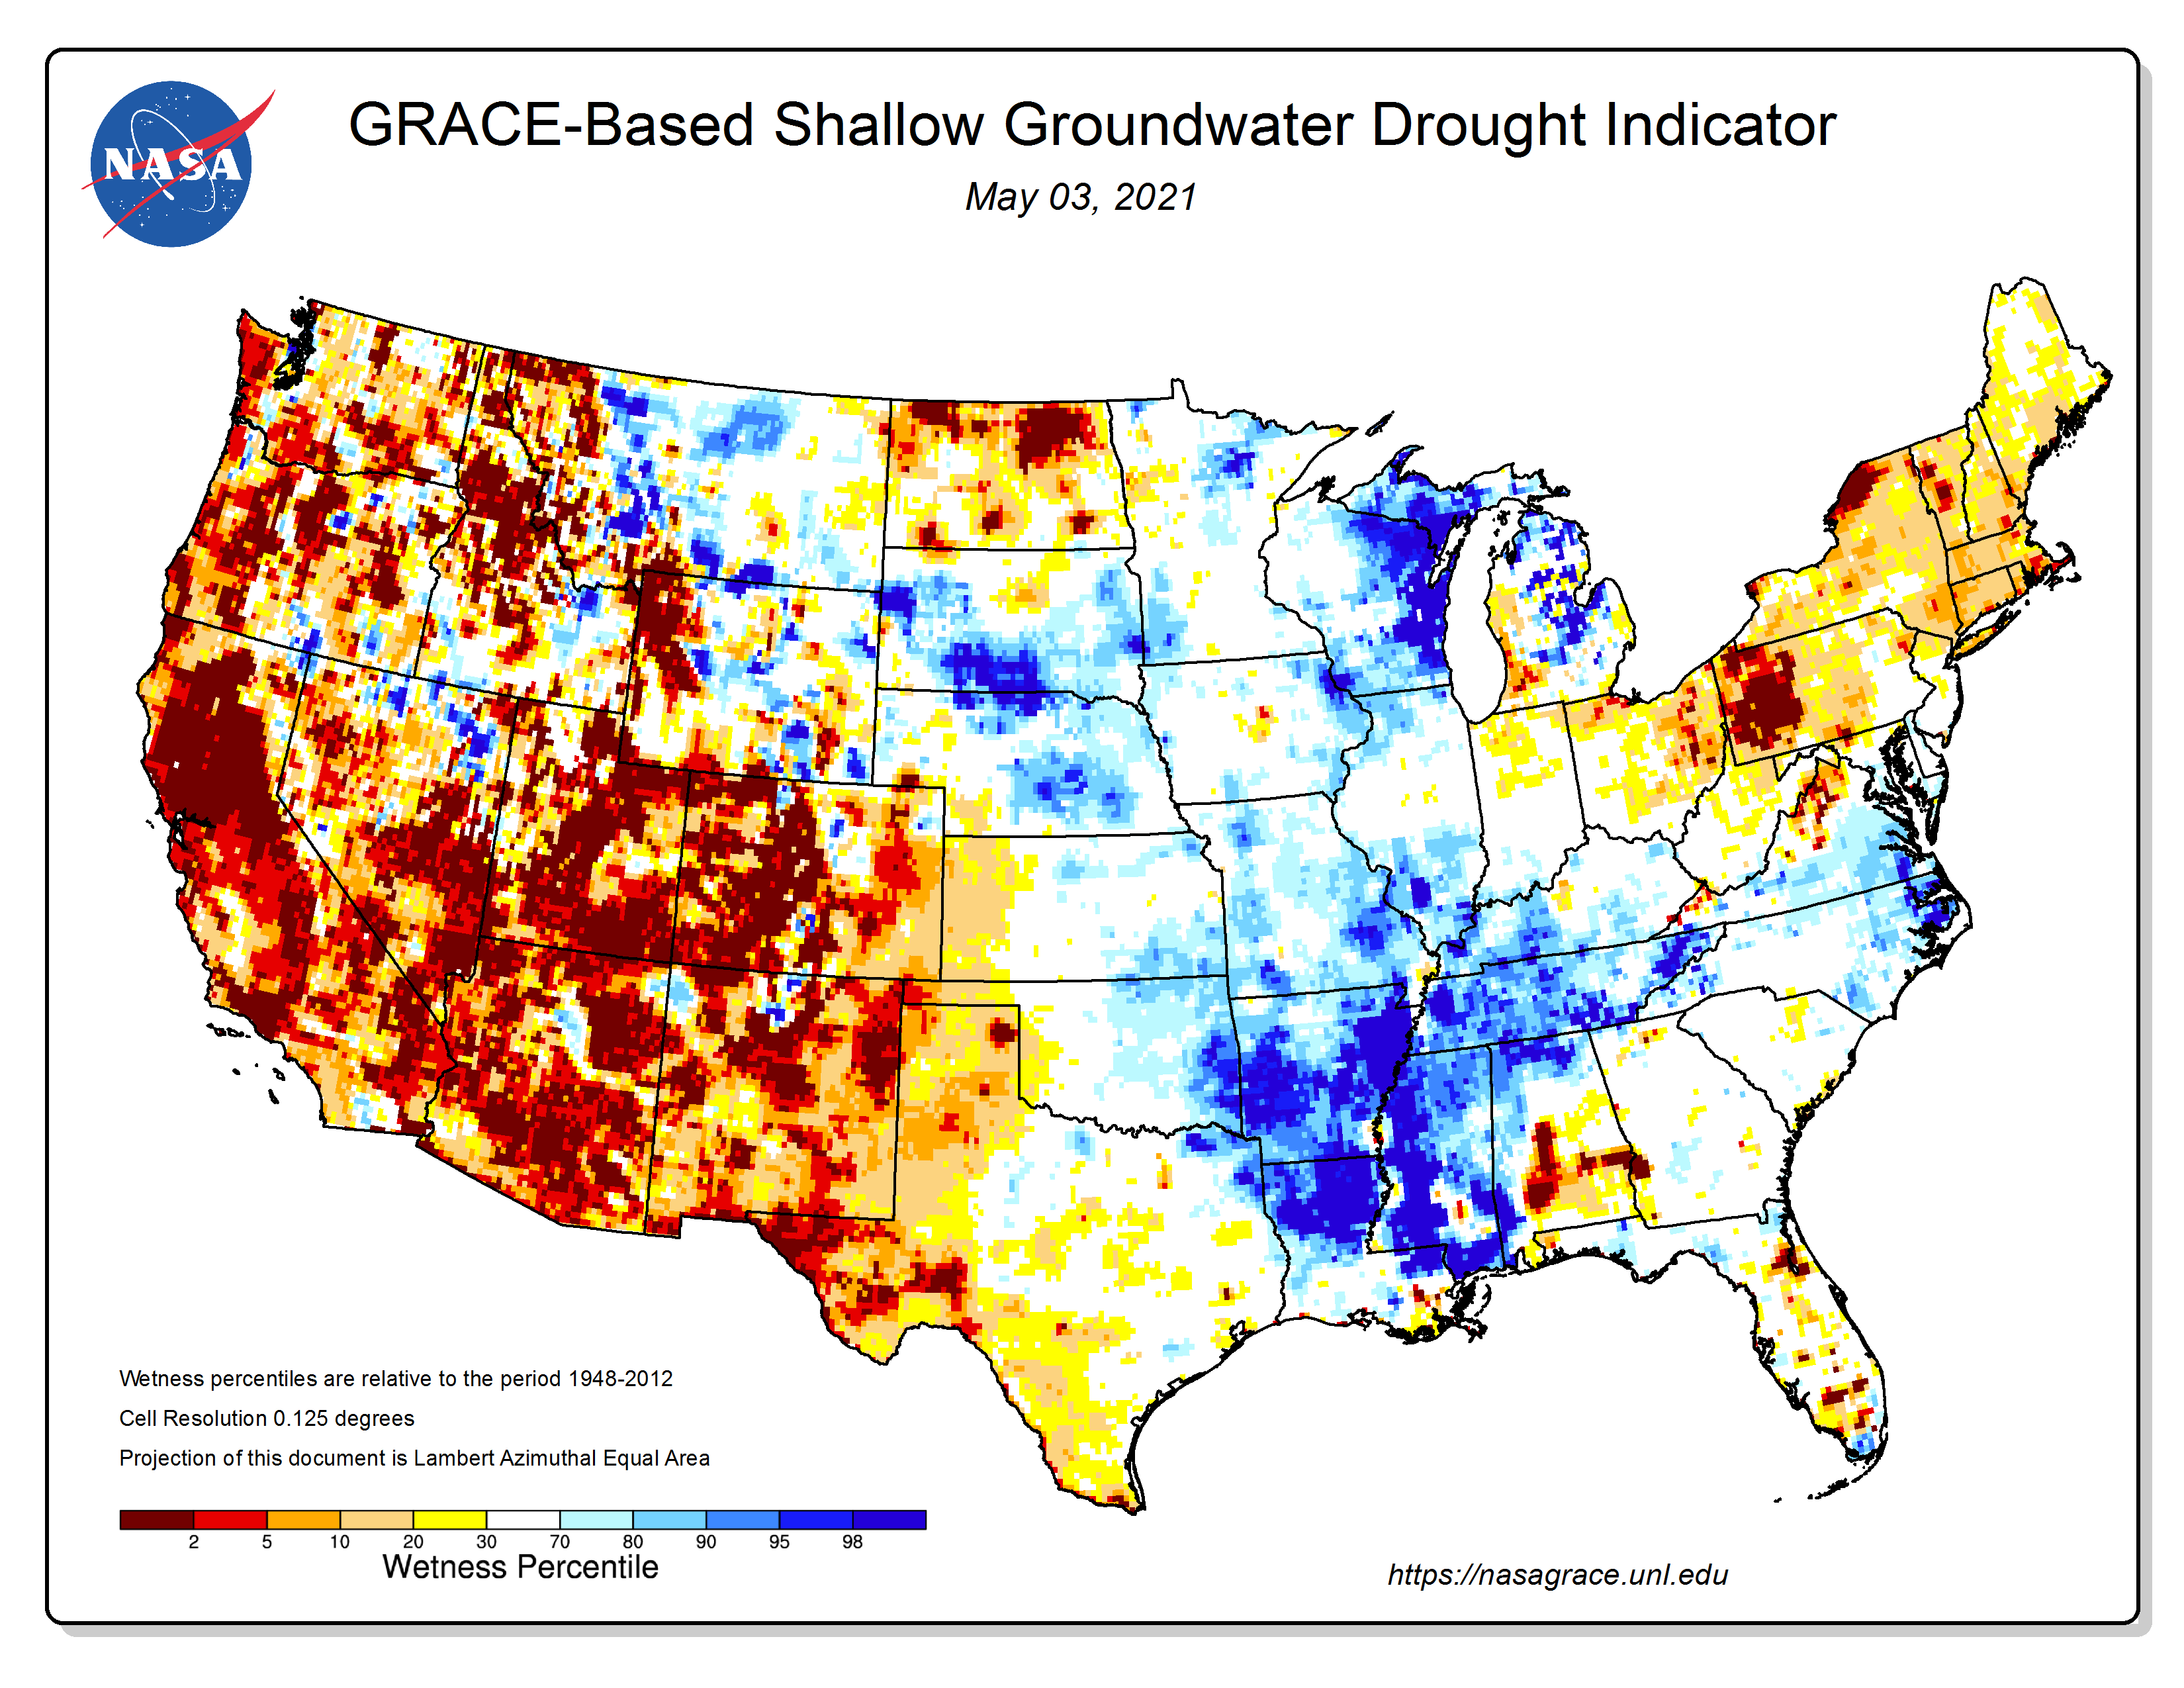
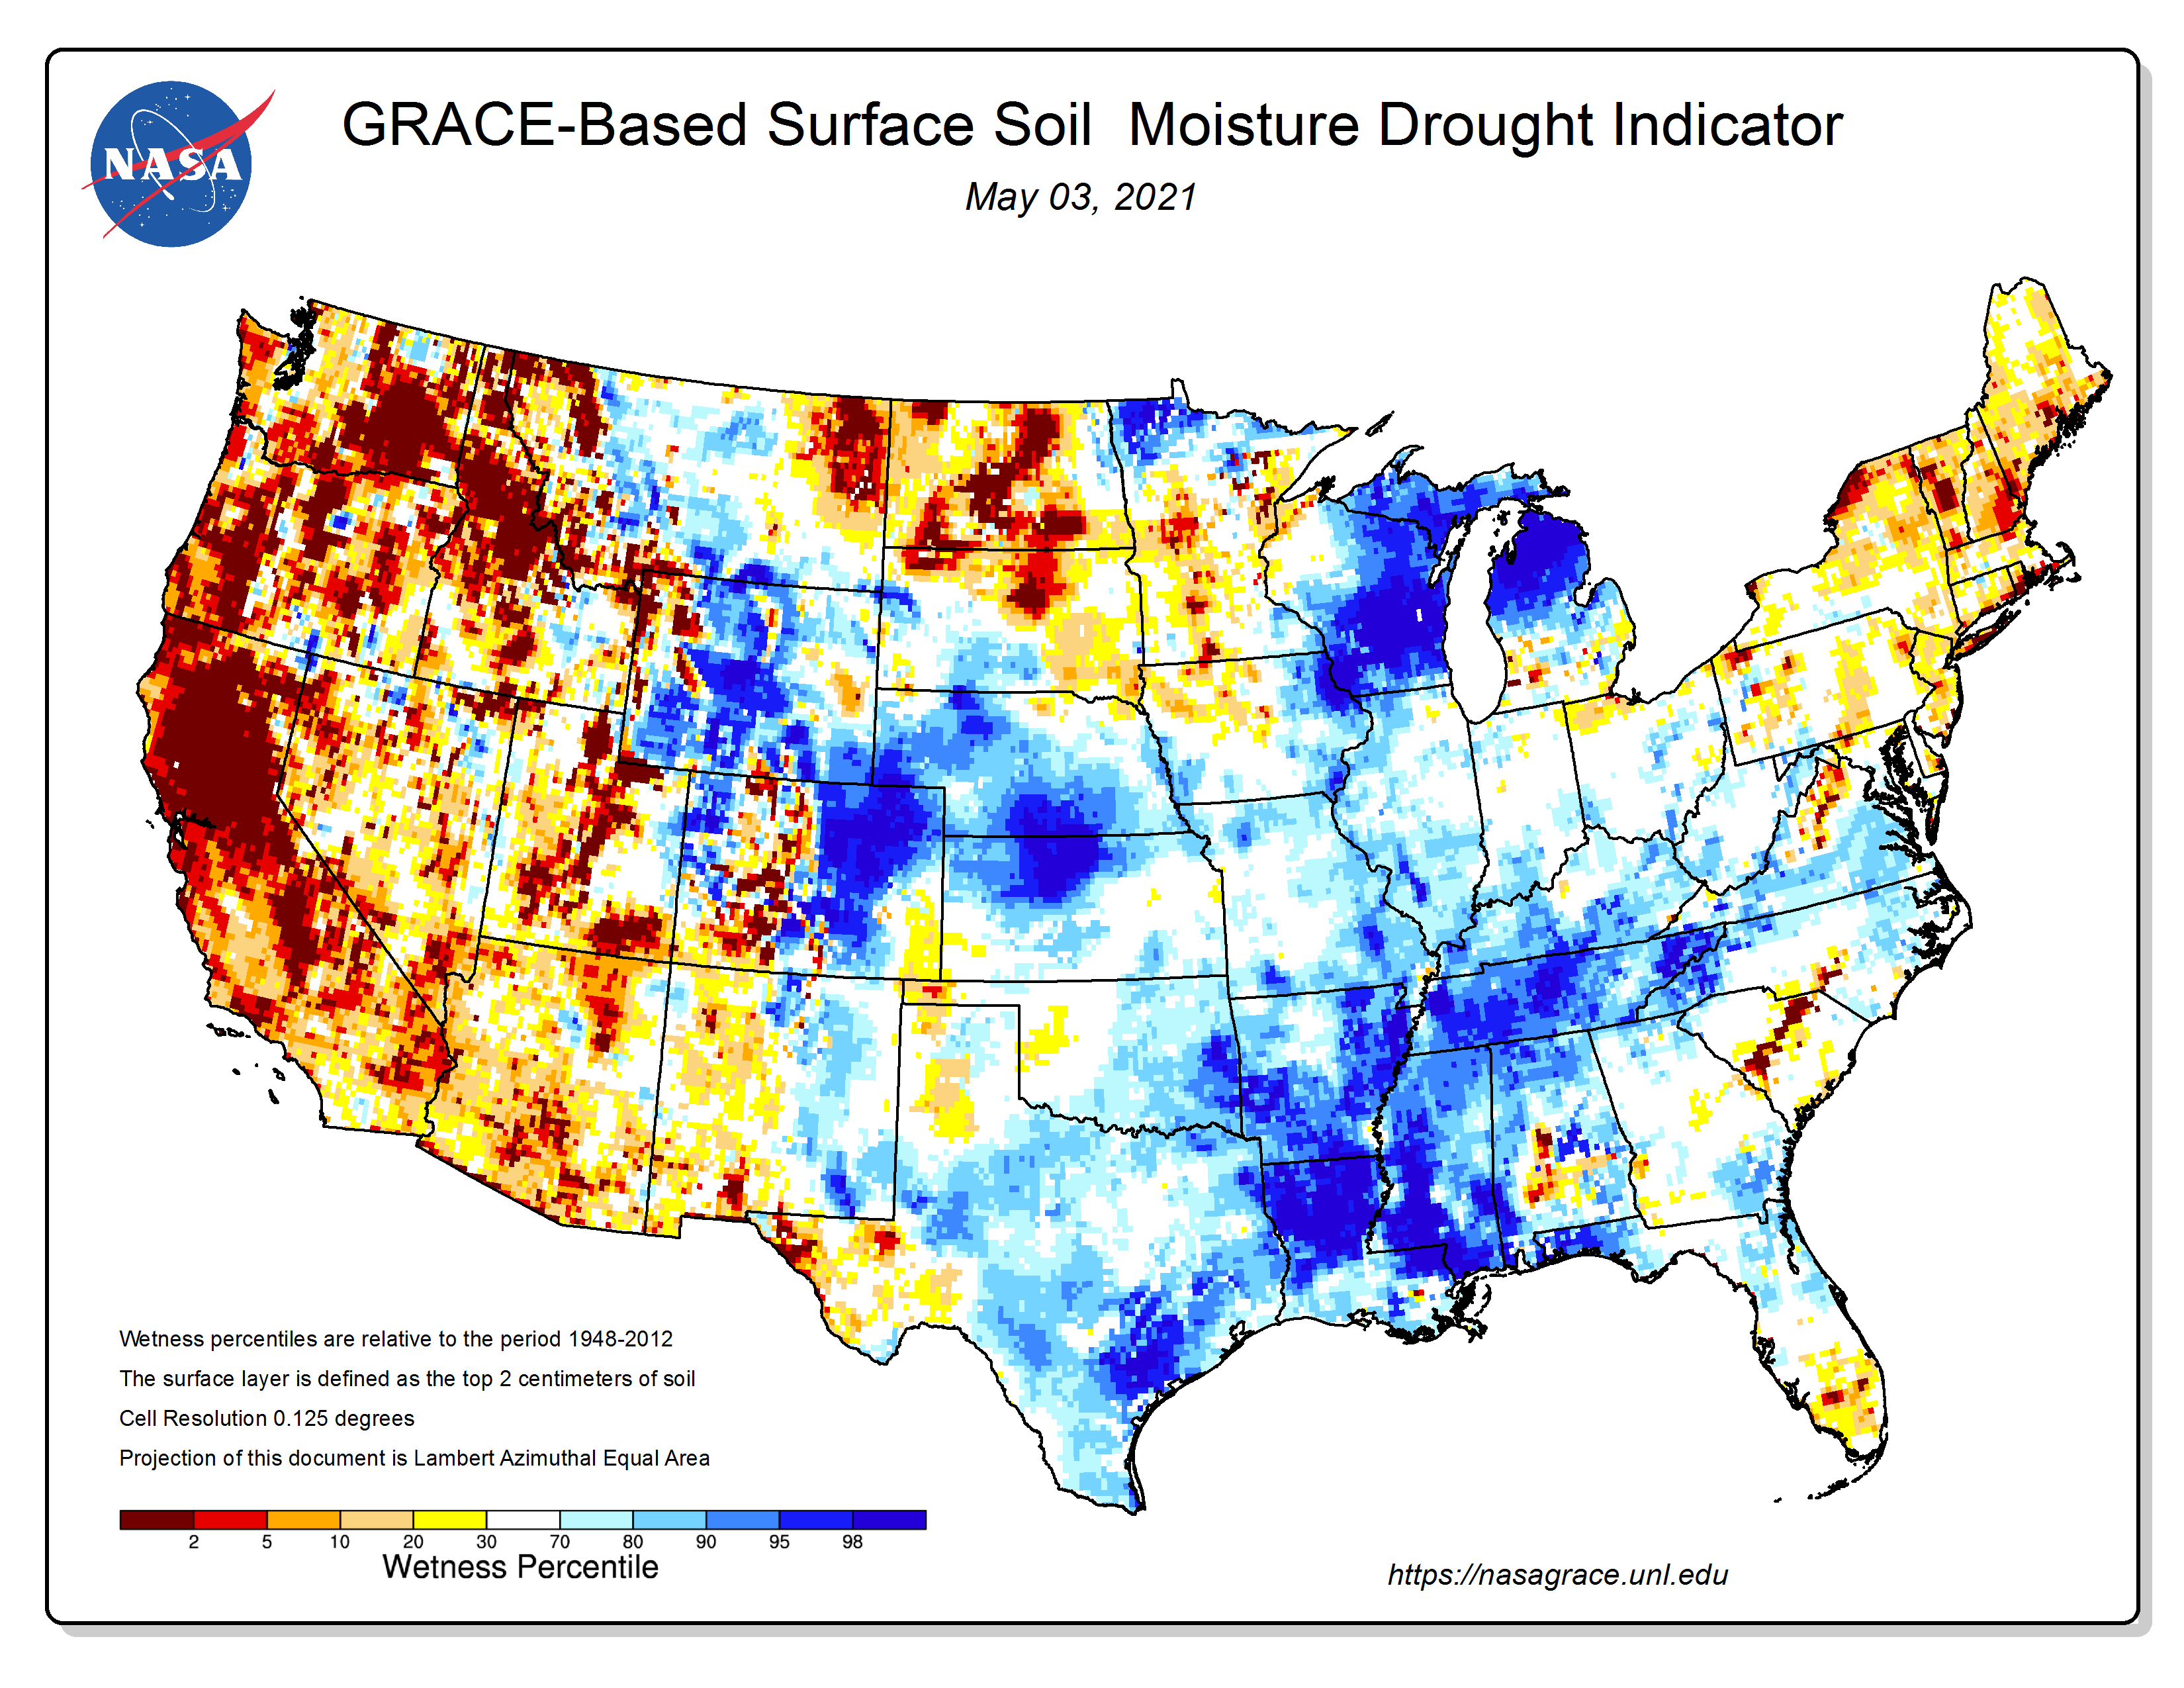
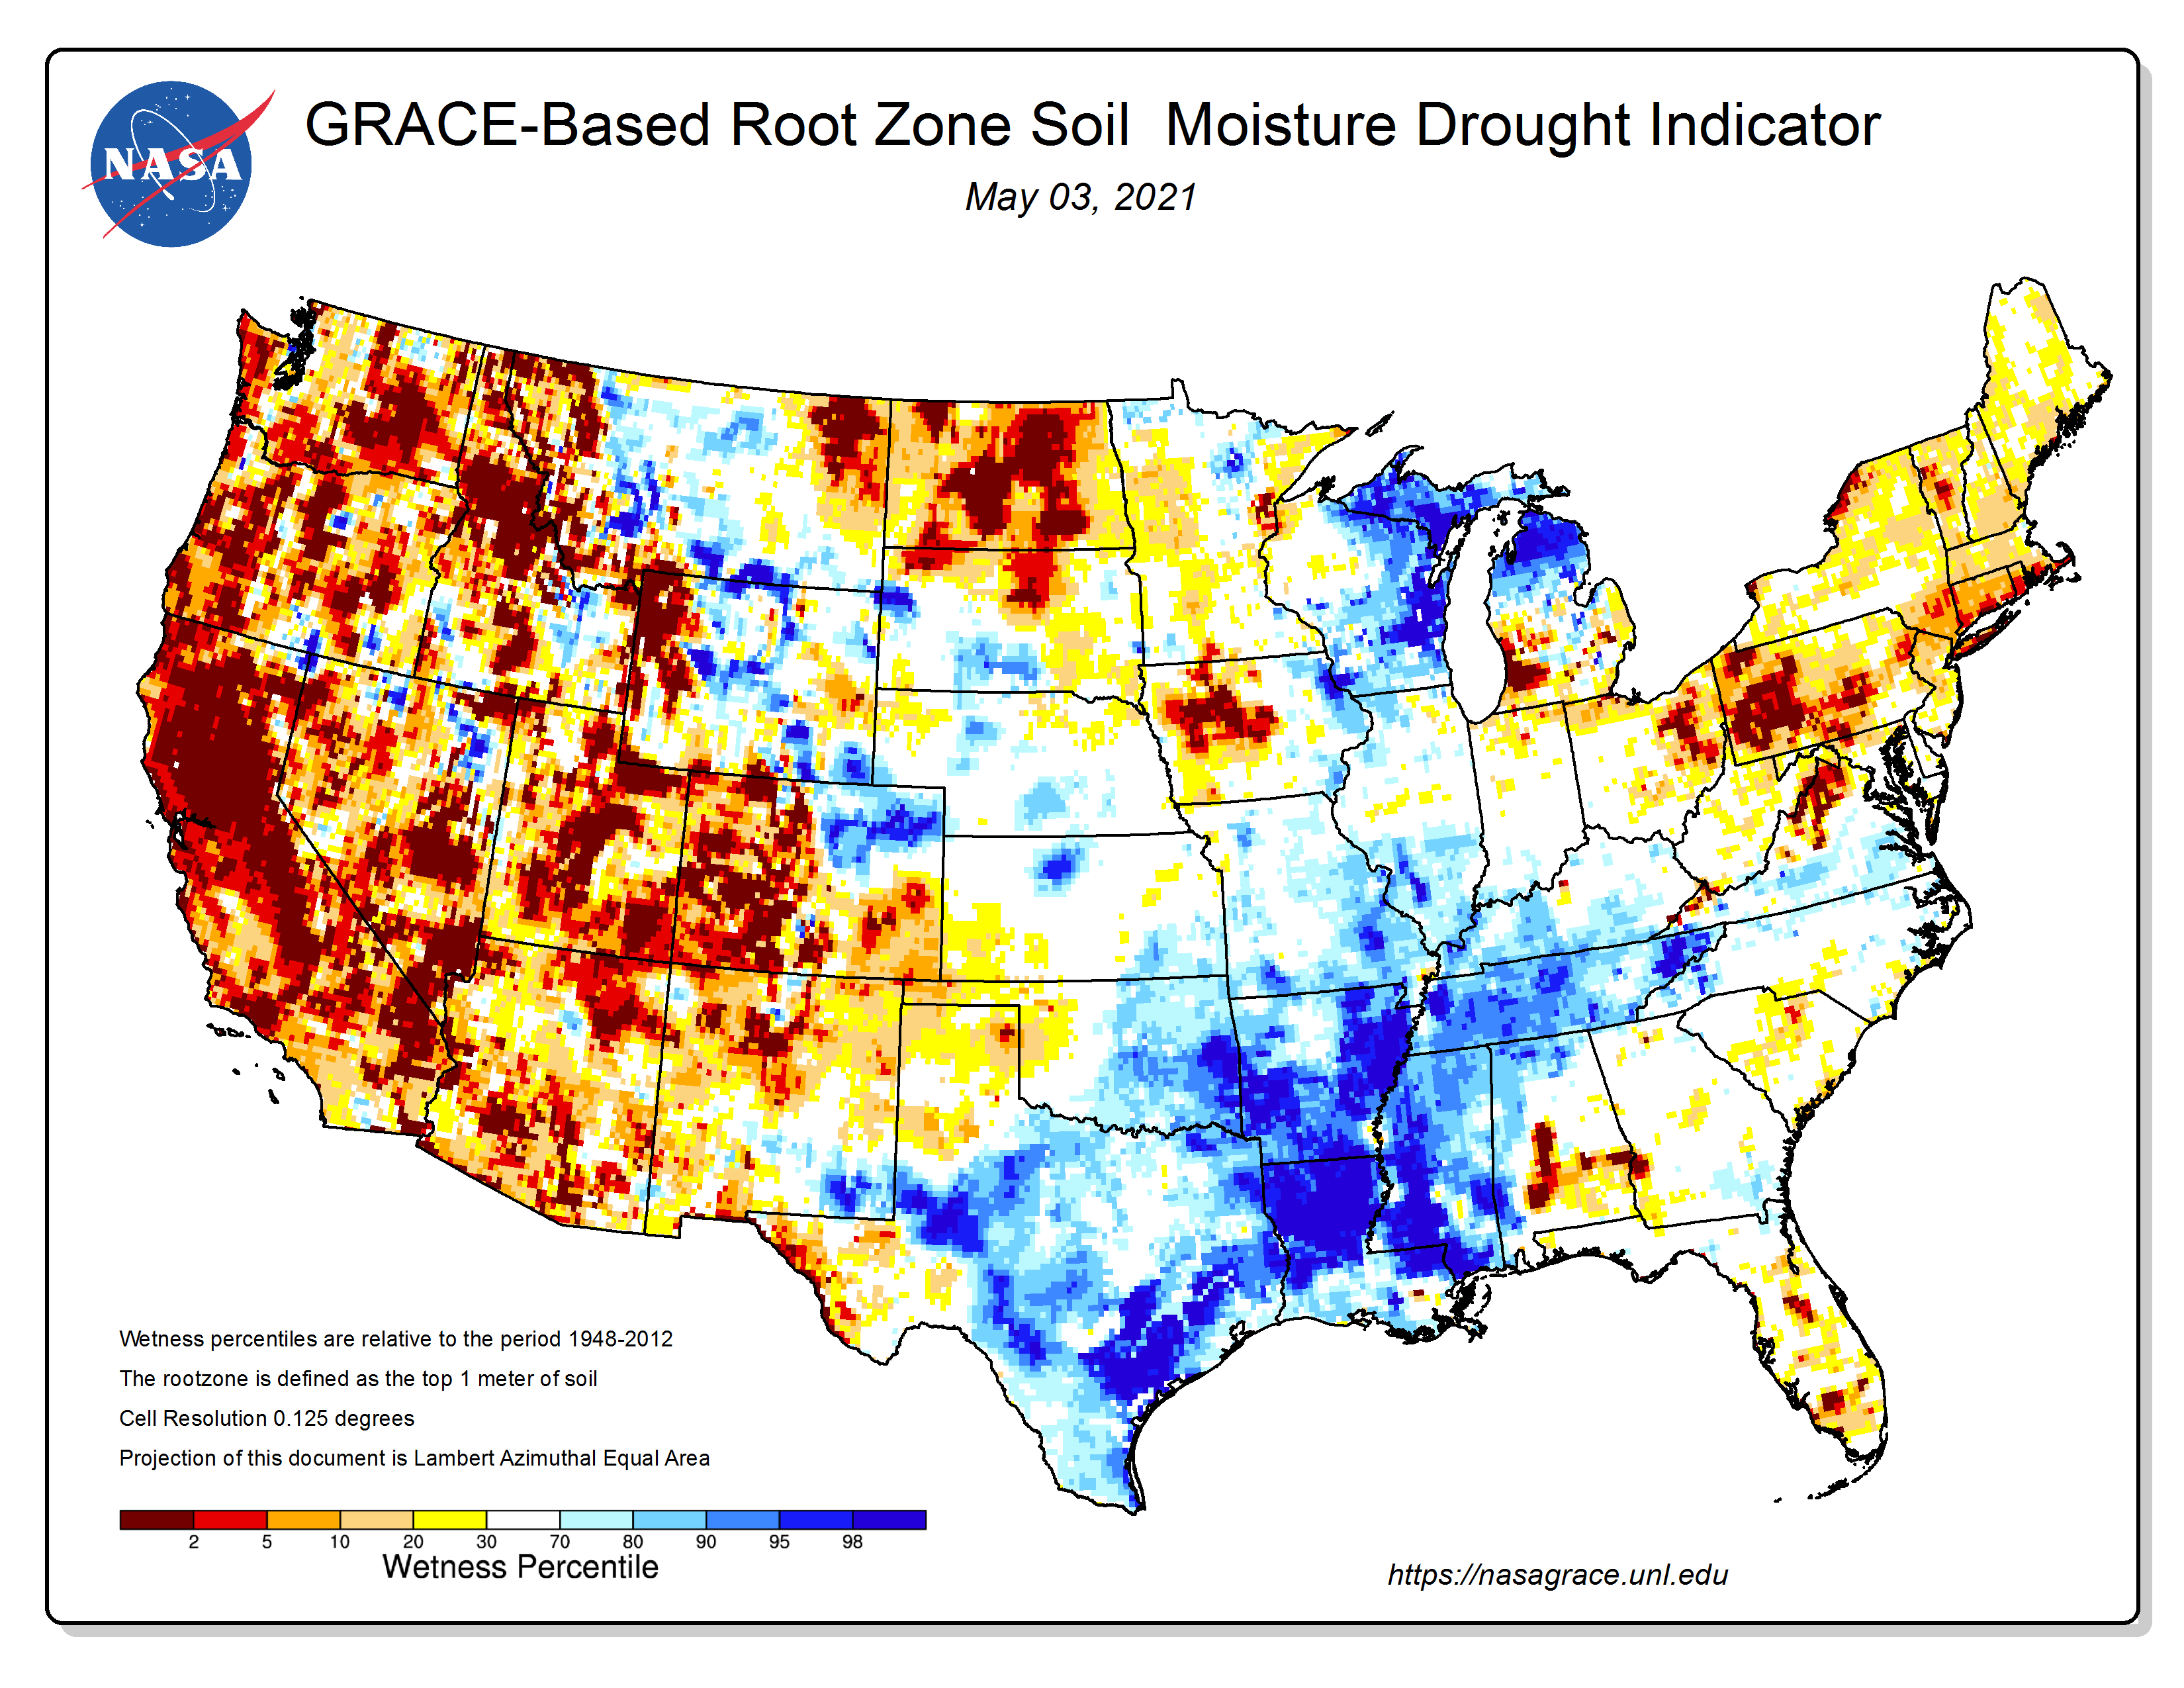
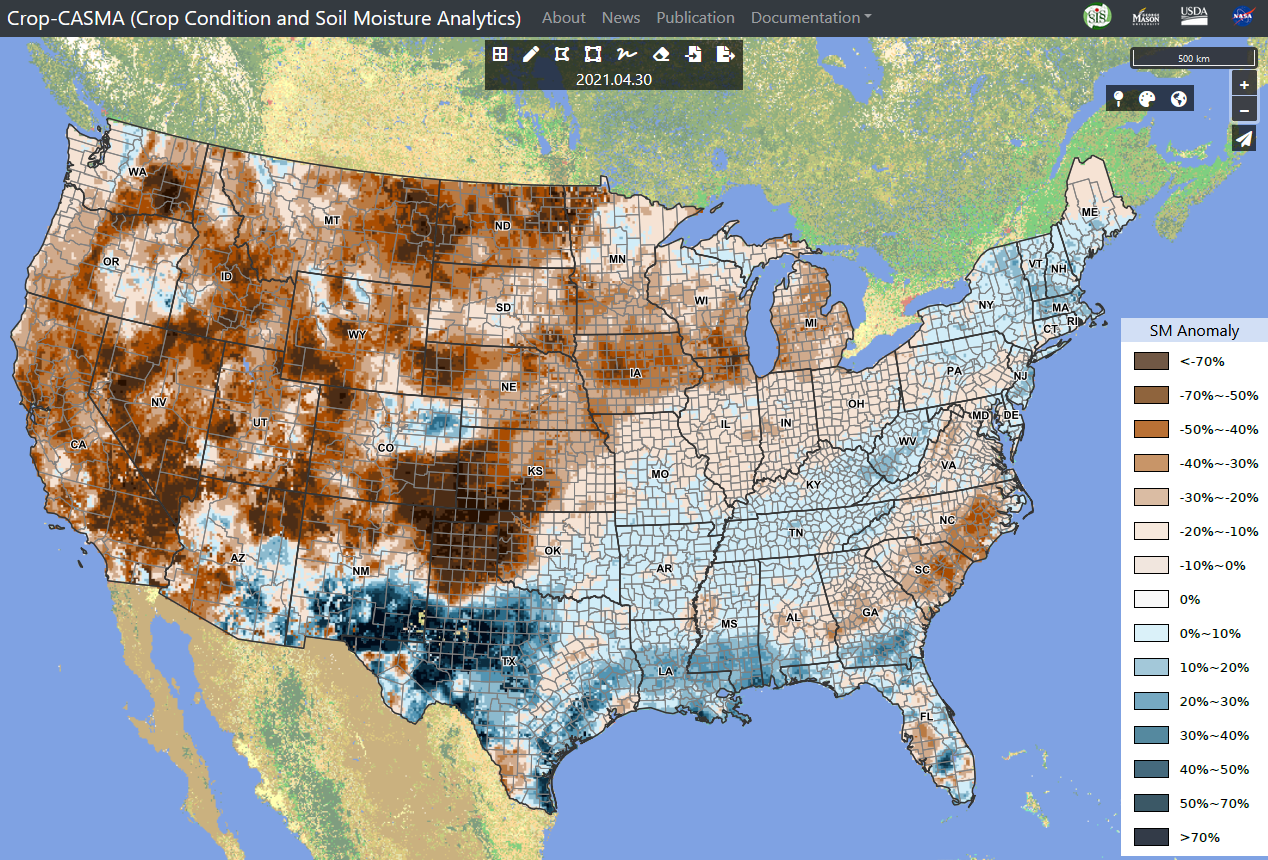
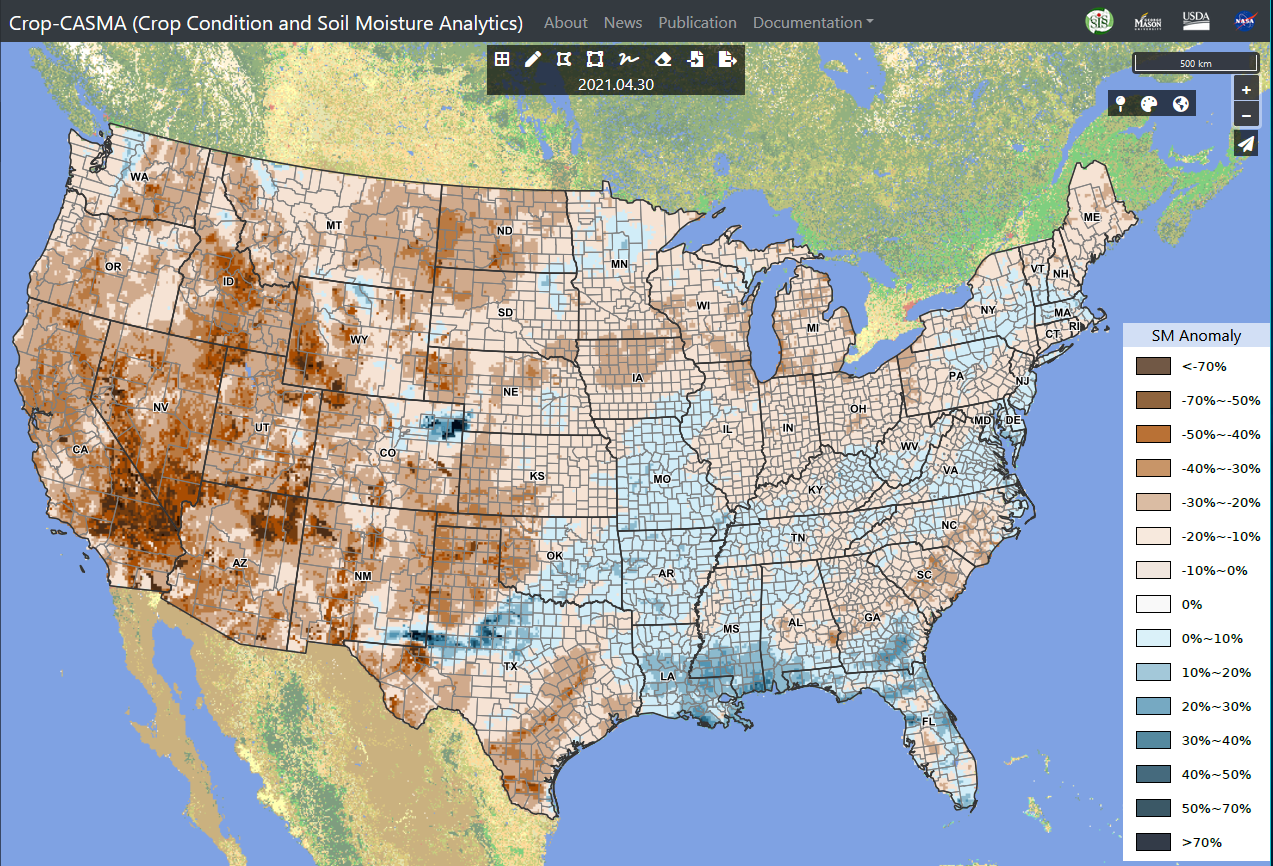
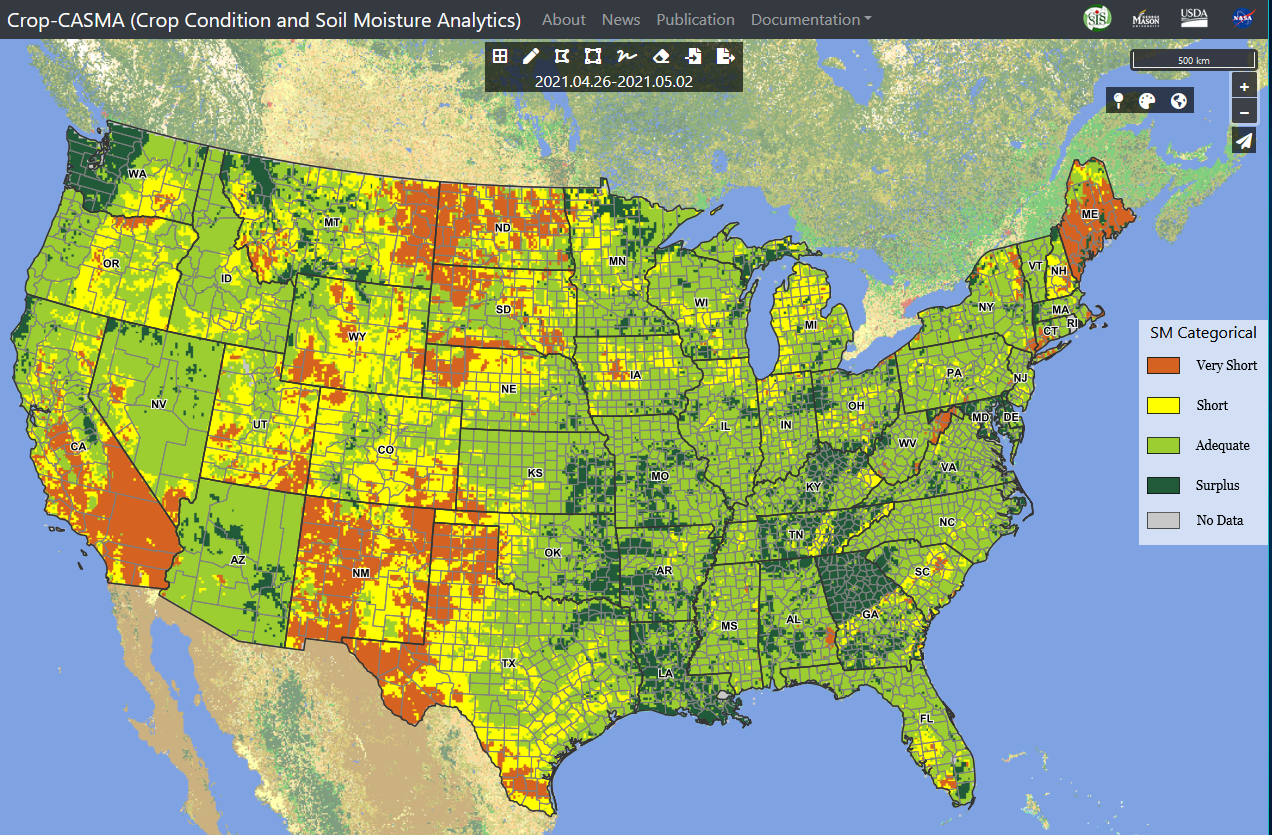
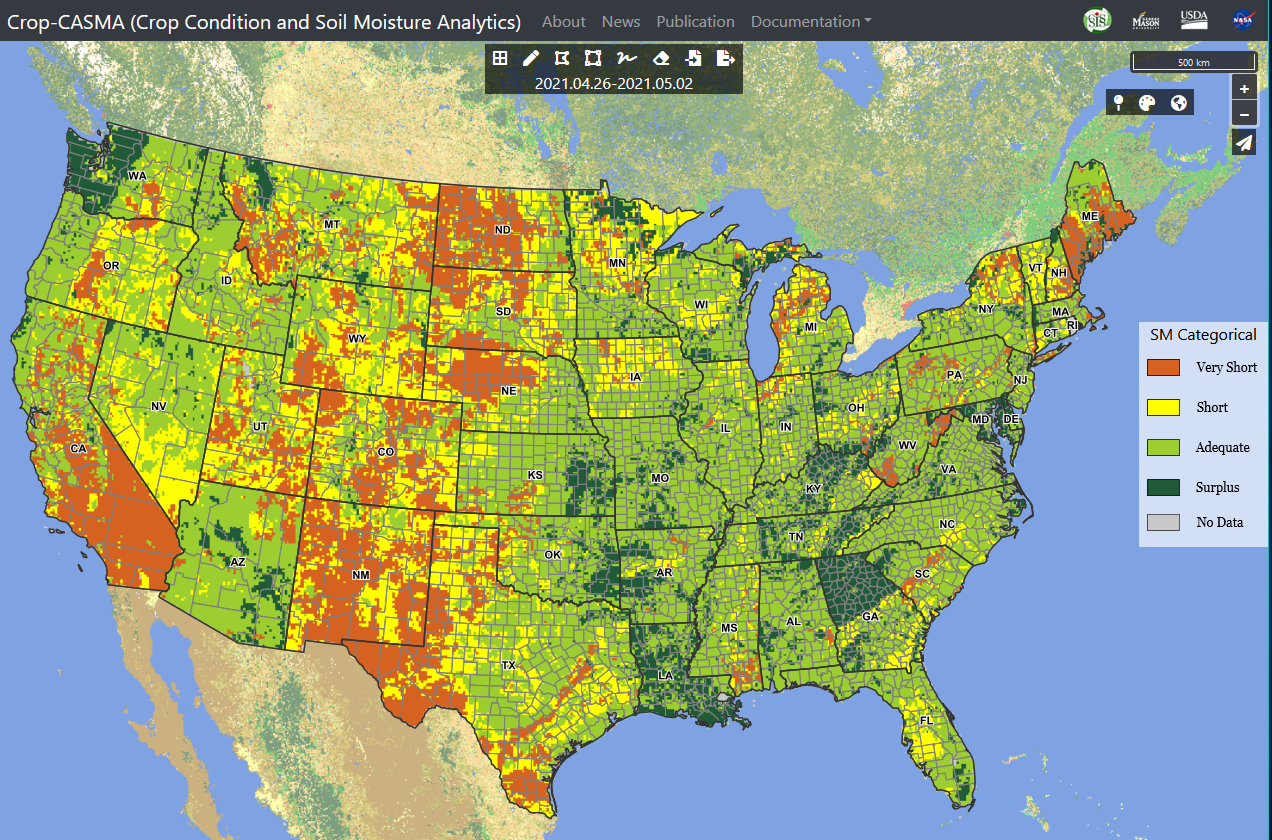
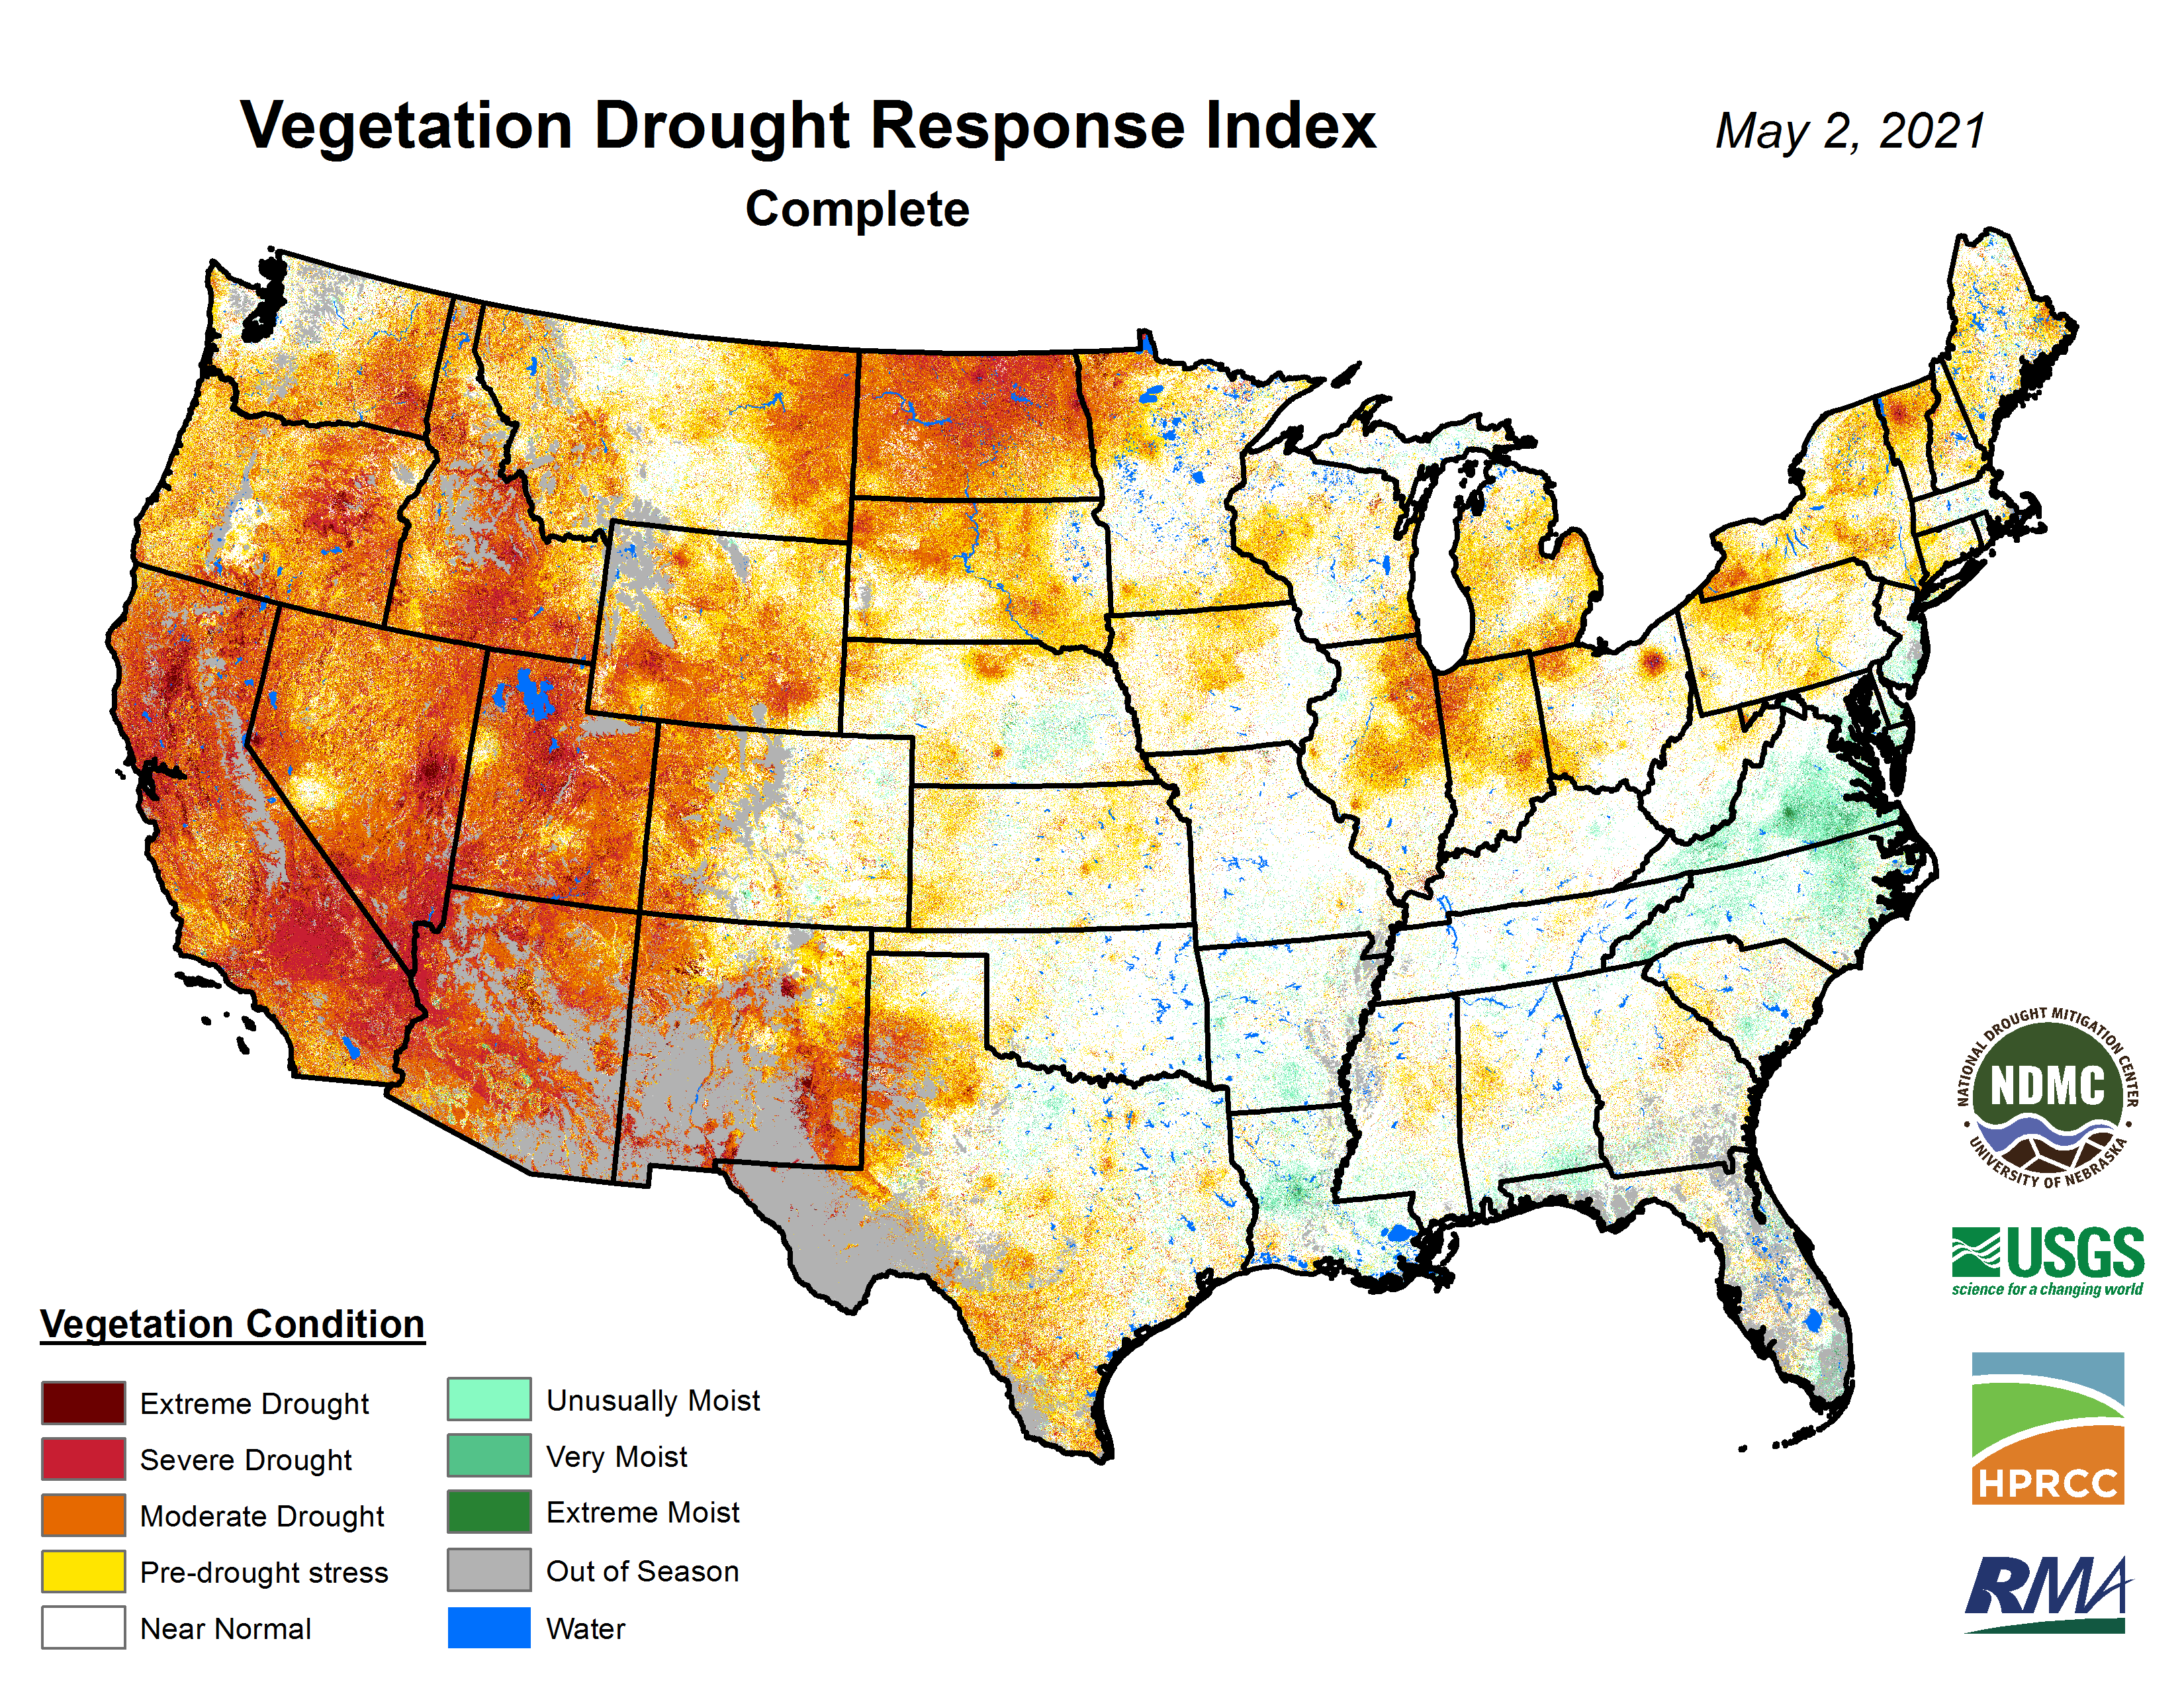
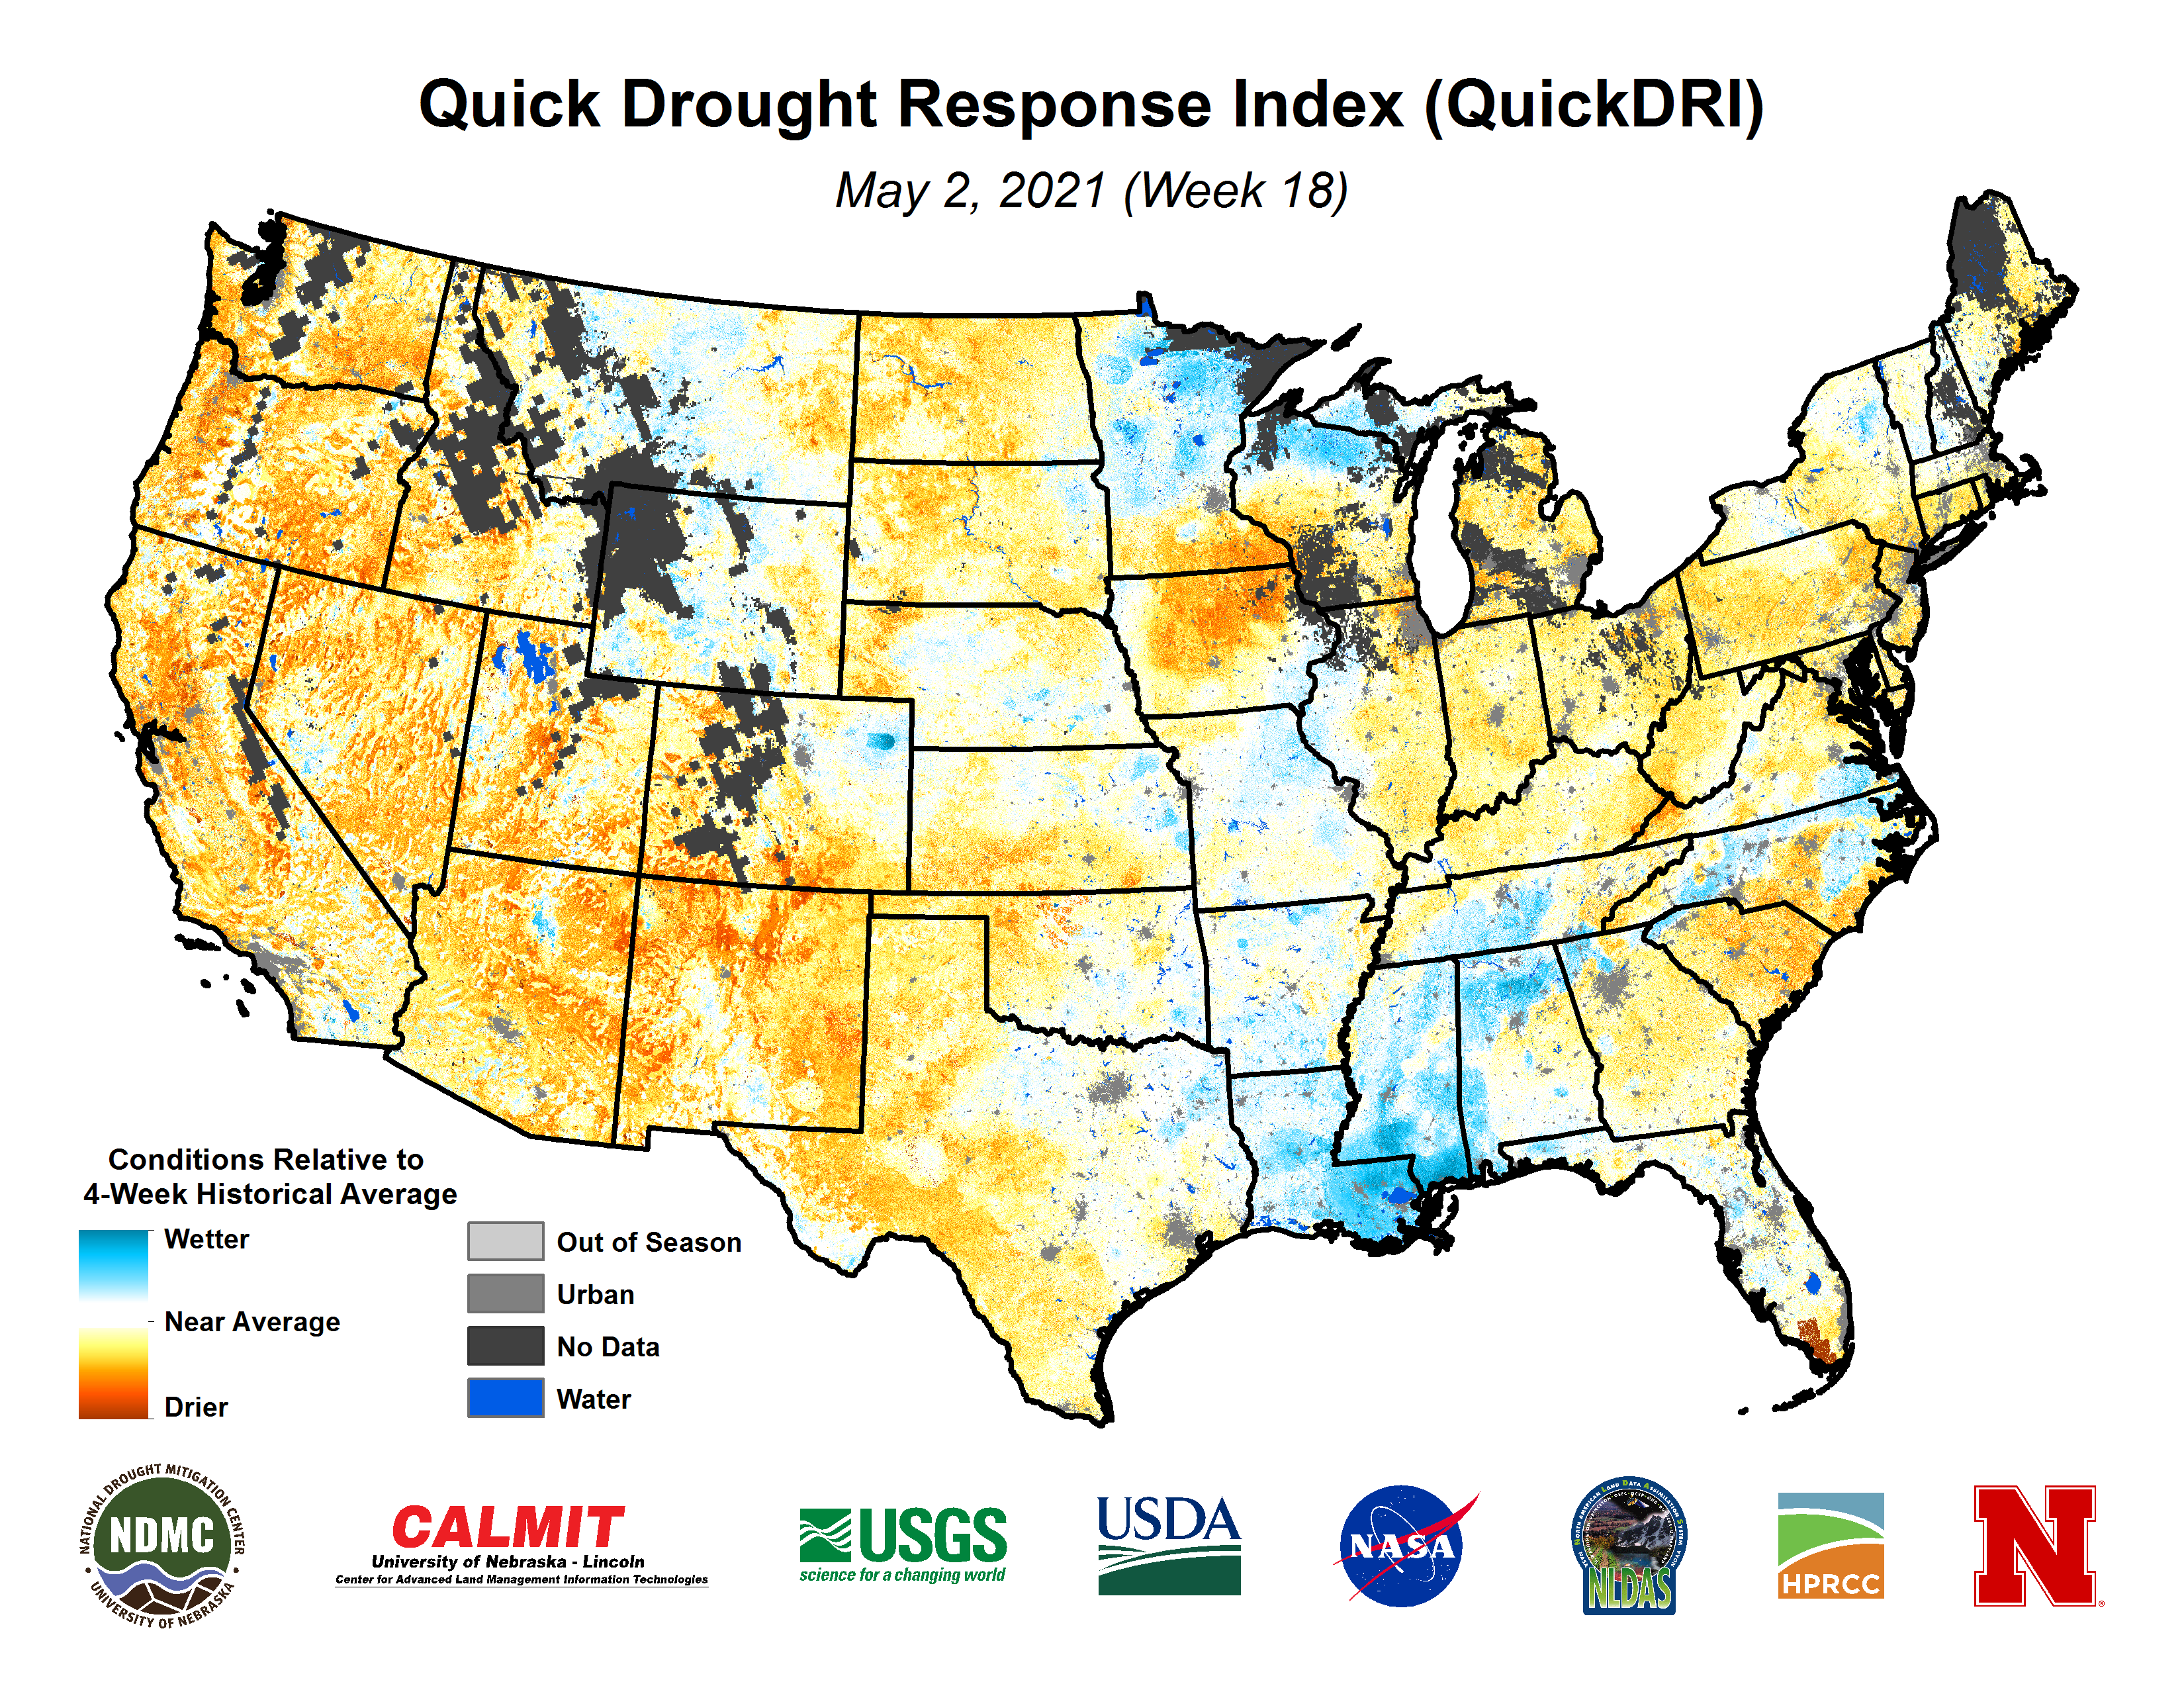
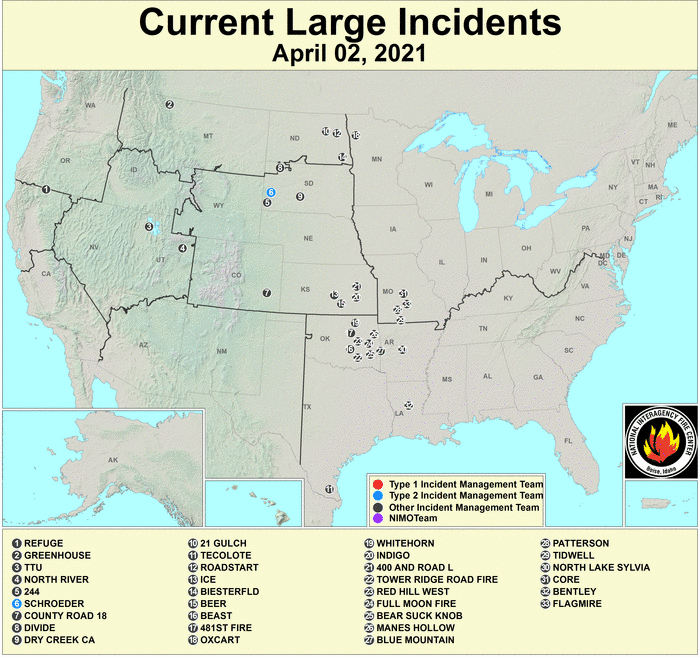
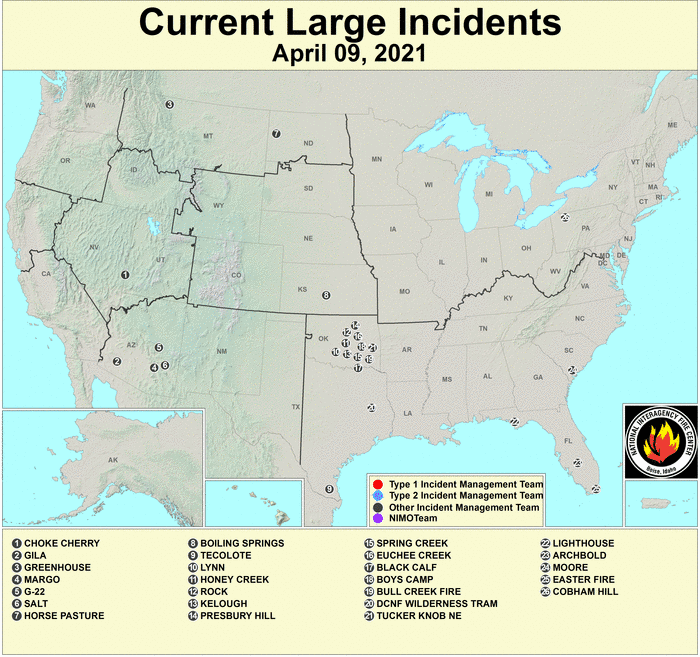
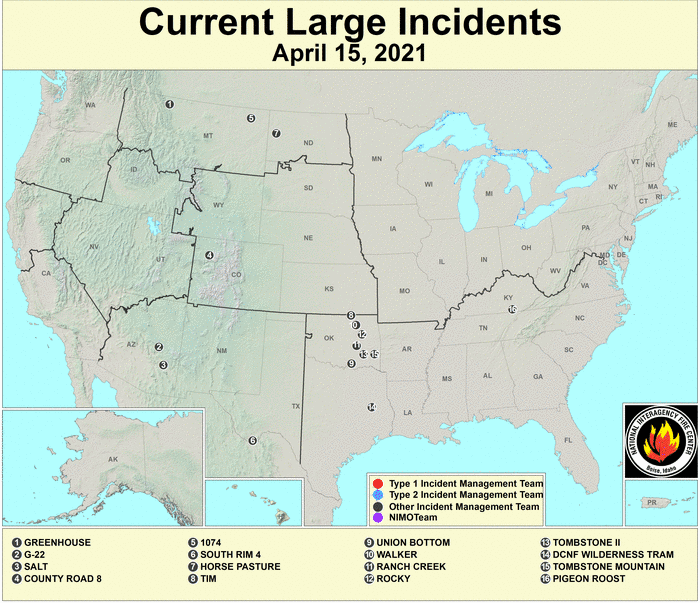
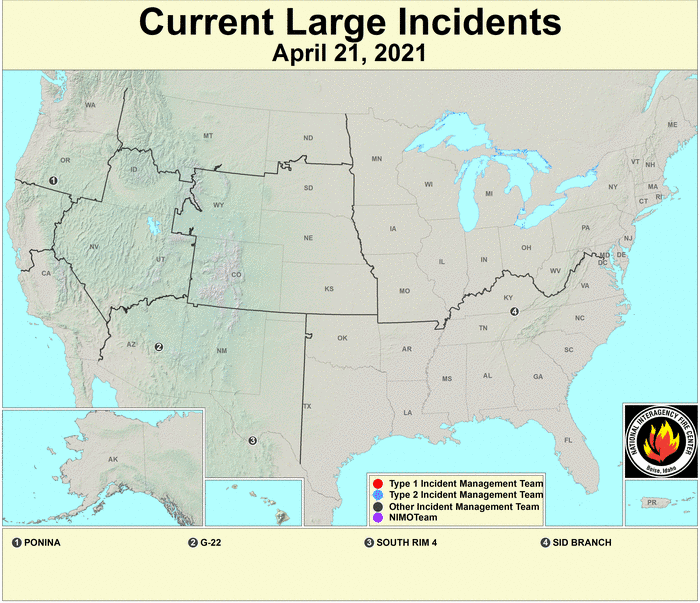
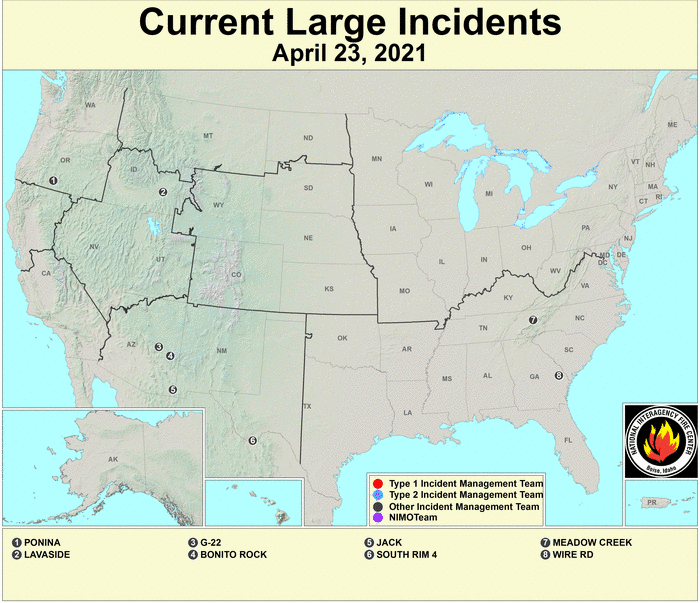
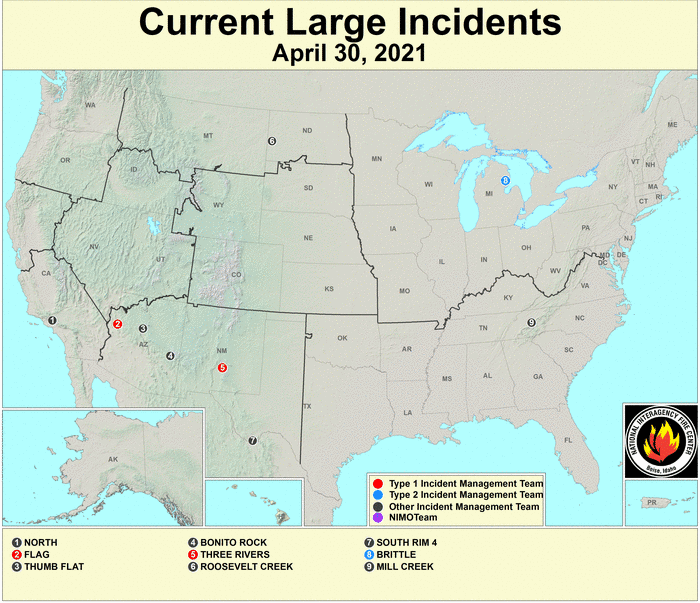
The below-normal precipitation during April and for the last several months, and below-normal mountain snowpack in the West, have resulted in low streamflow and groundwater (USGS and GRACE satellite observations) levels and dry soil moisture (SMOS satellite observations; SPoRT satellite-based observations for 0-10 cm [0-4 inches] depth, 0-40 cm [0-16 inches] depth, 0-100 cm [0-39 inches] depth, 0-200 cm [0-79 inches] depth; GRACE satellite-based observations for surface and root zone soil moisture; the USDA Crop Condition and Soil Moisture Analytics [CASMA] soil moisture anomaly for topsoil and subsoil, CASMA soil moisture category for topsoil and subsoil, and field observations of topsoil moisture; the VegDRI and QuickDRI products; and CPC, Leaky Bucket, and NLDAS models). These conditions were especially notable across the West, Great Lakes and Ohio Valley states to Northeast, Texas, and parts of the northern Plains and Iowa, but also somewhat evident in the coastal Southeast. The month began with several large wildfires occurring in the Dakotas and central to southern Plains (Kansas, Oklahoma, Missouri, and Arkansas region), but those were mostly put out while others developed in the Southwest (wildfire maps for April 2, 9, 15, 21, 23, 30), with total acreage burned for the year to date of about 457 thousand acres, which is below average.
Reports received through the Condition Monitoring Observer Reports (CMOR) system included drought impacts to ranching operations in the West and farming and ranching operations, as well as fire concerns, in the northern Plains. Low stock pond water or dry ponds and dugouts, poor quality water, and hay shortages are concerns for cattle producers. Little to no soil moisture worries farmers and ranchers in North Dakota. Blowing dust is covering roads and fields in North Dakota, and severely dry conditions and dust storms were reported in Montana and Oregon. In Yolo County, California, most farmers and ranchers say this is the worst drought they have seen, even worse than 1977. Rangeland forage production is 25 to 35% of normal, dryland hay yields are 30% of normal, many small grain crops are being cut for hay instead of harvested for grain, and some rangelands are ungrazed due to no livestock drinking water. Other reports relayed from the National Drought Mitigation Center included: authorities in New Hampshire and Massachusetts were encouraging water conservation due to drought. North Dakota Gov. Doug Burgum on April 8 declared a statewide drought disaster. Dry pastures in eastern Montana have livestock producers on the cusp of making tough decisions about culling cattle. On April 15, Texas Governor Greg Abbott issued a disaster declaration due to drought affecting 73 counties. The Edwards Aquifer is dropping and triggering water restrictions in San Antonio, New Braunfels, San Marcos, Texas. In the Klamath Project in southern Oregon/northern California, low stream levels are threatening endangered fish species critical to local tribes, but farmers in the area need irrigation water for their crops, with the Klamath Water Users Association sending letters to members warning that there would be "little to no water for irrigation for Upper Klamath Lake this year." Water restrictions were being implemented in several communities in California. Record low reservoir levels contributed to California Governor Gavin Newsom proclaiming a regional drought emergency for the Russian River watershed in Sonoma and Mendocino counties. Shallow wells were going dry in the San Joaquin Valley, while Tulare County ranchers were culling cattle for sale months earlier than usual and were considering idling row crops to leave water for higher-value permanent crops like nut trees. The amount of forage on rangelands is low, with producers in Ventura County already shipping whole herds of cattle out of county because there is almost no forage. Lakes Powell and Mead are forecast to drop to historic lows this summer, triggering the first water shortage declaration for the Colorado River Basin, limiting water supplies for Arizona and Nevada. Trees stressed by drought are dying in Arizona and New Mexico. The Biden-Harris administration announced the formation of an Interagency Working Group to address worsening drought conditions in the West and support farmers, Tribes, and communities impacted by ongoing water shortages. The Working Group will be co-chaired by the Departments of the Interior and Agriculture to build upon existing resources to help coordinate across the federal government, working in partnership with state, local, and Tribal governments to address the needs of communities suffering from drought-related impacts. The Working Group will work to identify immediate financial and technical assistance for impacted irrigators and Tribes.
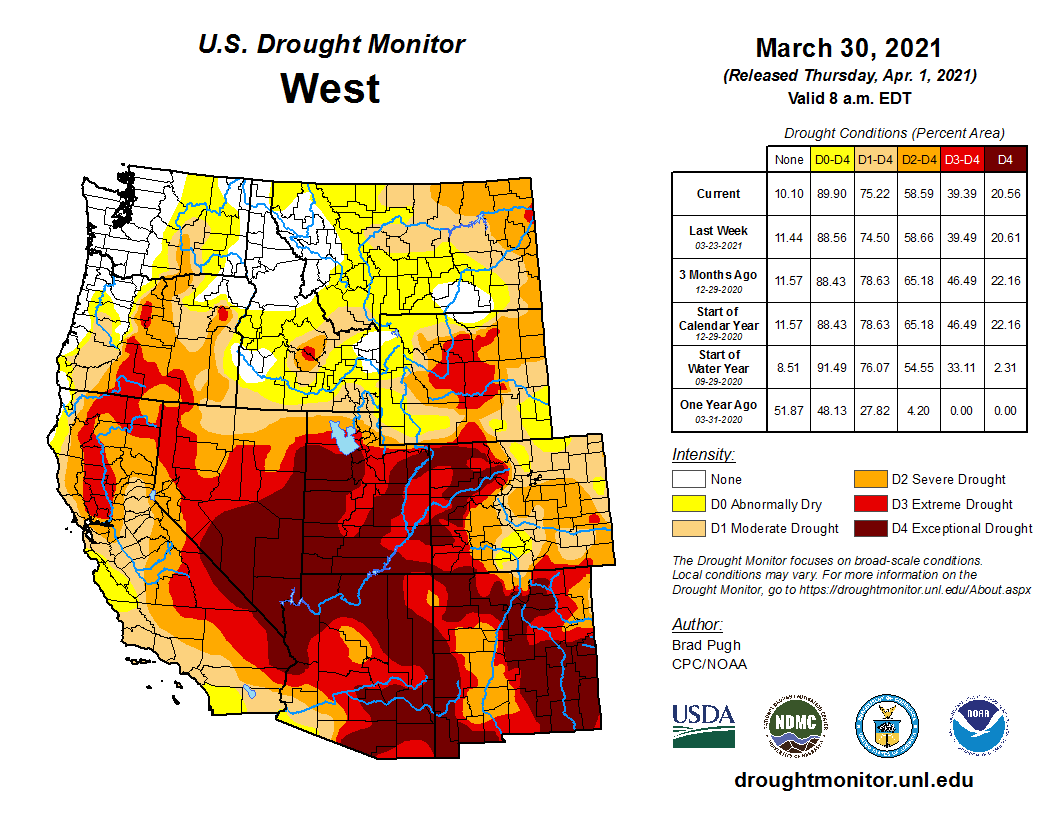
As a result of these conditions, drought or abnormal dryness expanded or intensified in the Far West, Pacific Northwest to northern Plains, southern Great Lakes to Northeast, and parts of the southern Plains and coastal Southeast, as well as Hawaii and Puerto Rico. Drought or abnormal dryness contracted or decreased in intensity in other parts of the southern Plains; parts of the Upper Mississippi Valley to western Great Lakes; and parts of Wyoming and Florida. Drought expansion exceeded contraction with the USDM-based national moderate-to-exceptional drought footprint across the CONUS rising from 43.9 percent at the end of March to 48.4 percent at the end of April (from 36.7 percent to 40.4 percent for the 50 States and Puerto Rico). According to the Palmer Drought Index, which goes back to the beginning of the 20th century, about 45.4 percent of the CONUS was in moderate to extreme drought at the end of April, an increase compared to the end of March. The percent area of the CONUS in moderate to extreme drought has hovered between 35 and 45 percent for the last eight months (since September 2020).
Drought conditions at the end of April, as depicted on the April 27, 2021 USDM map, included the following core drought and abnormally dry areas:
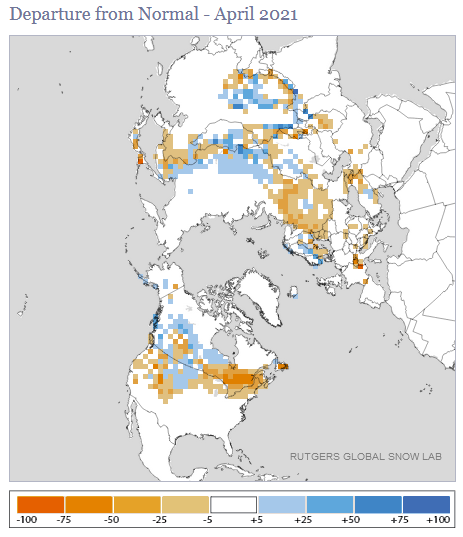
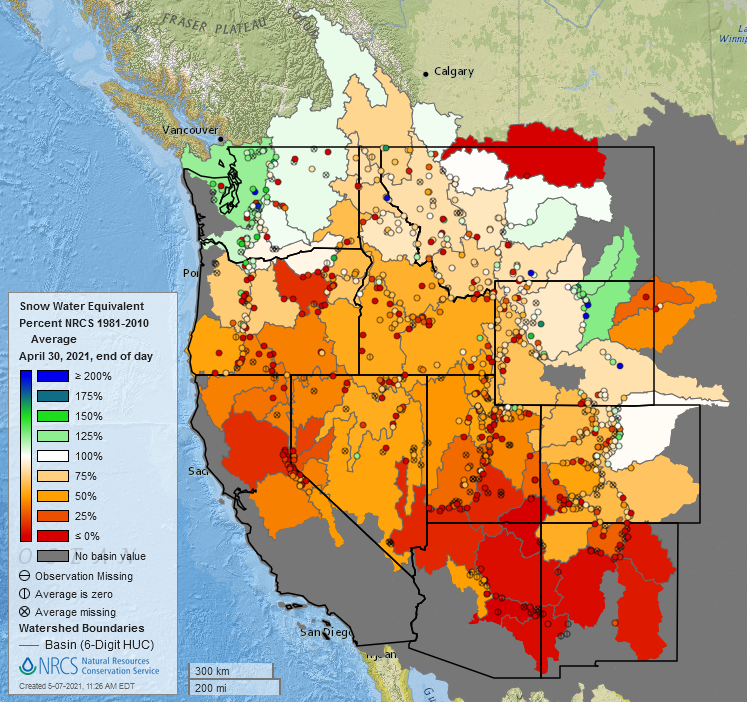
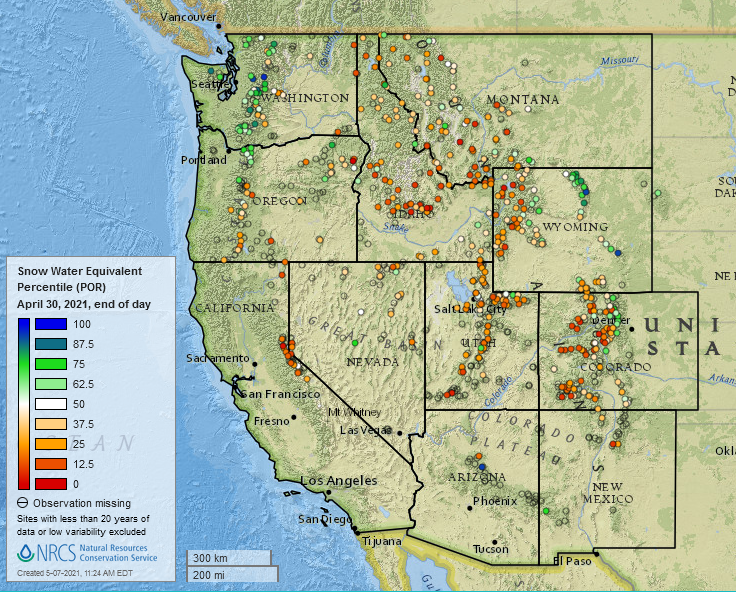
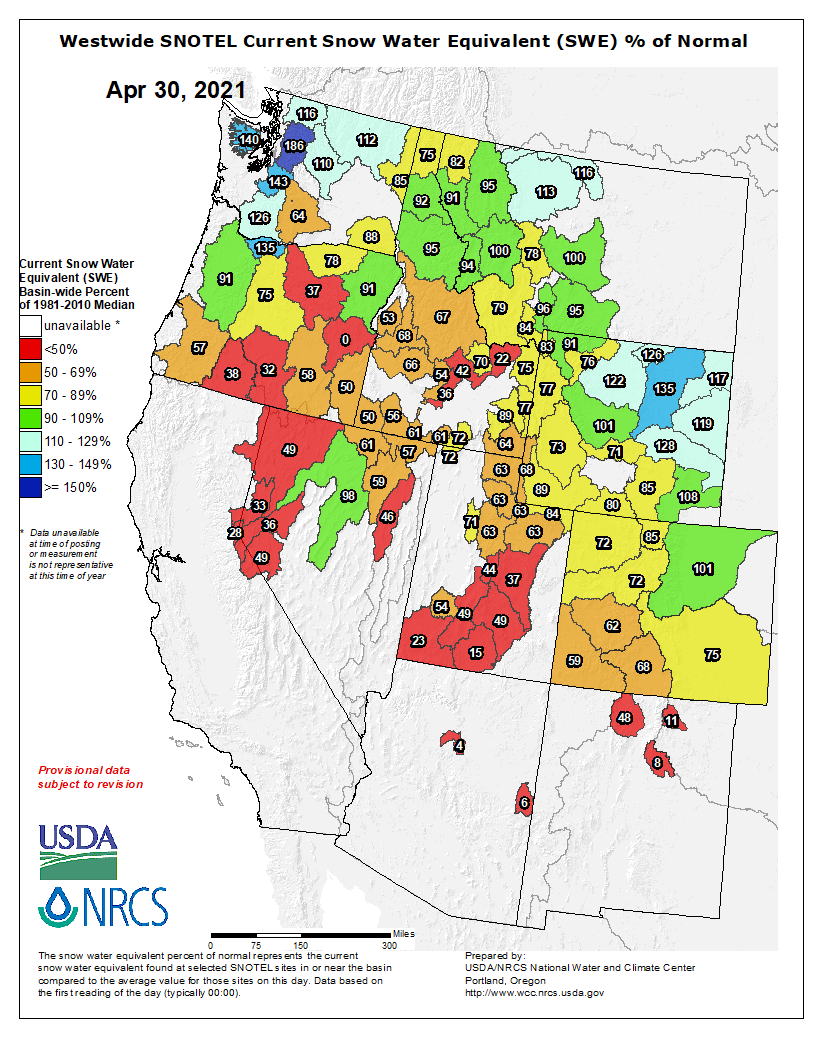
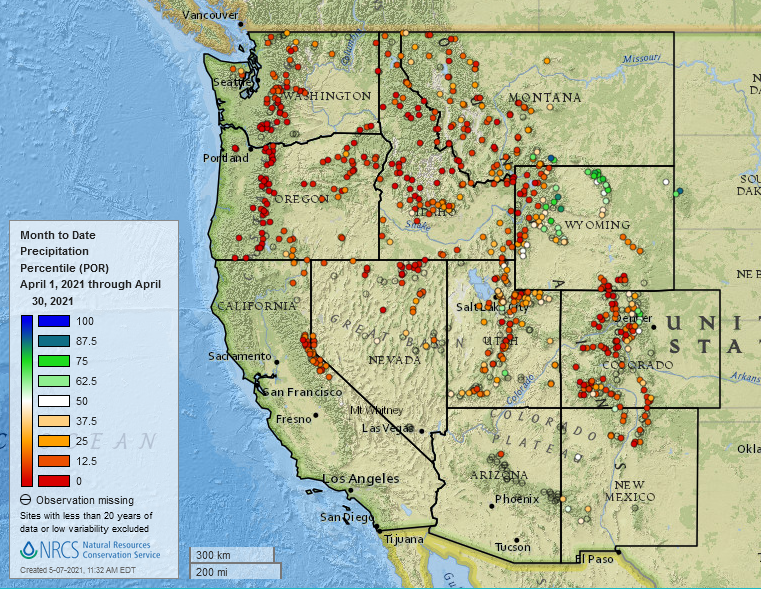
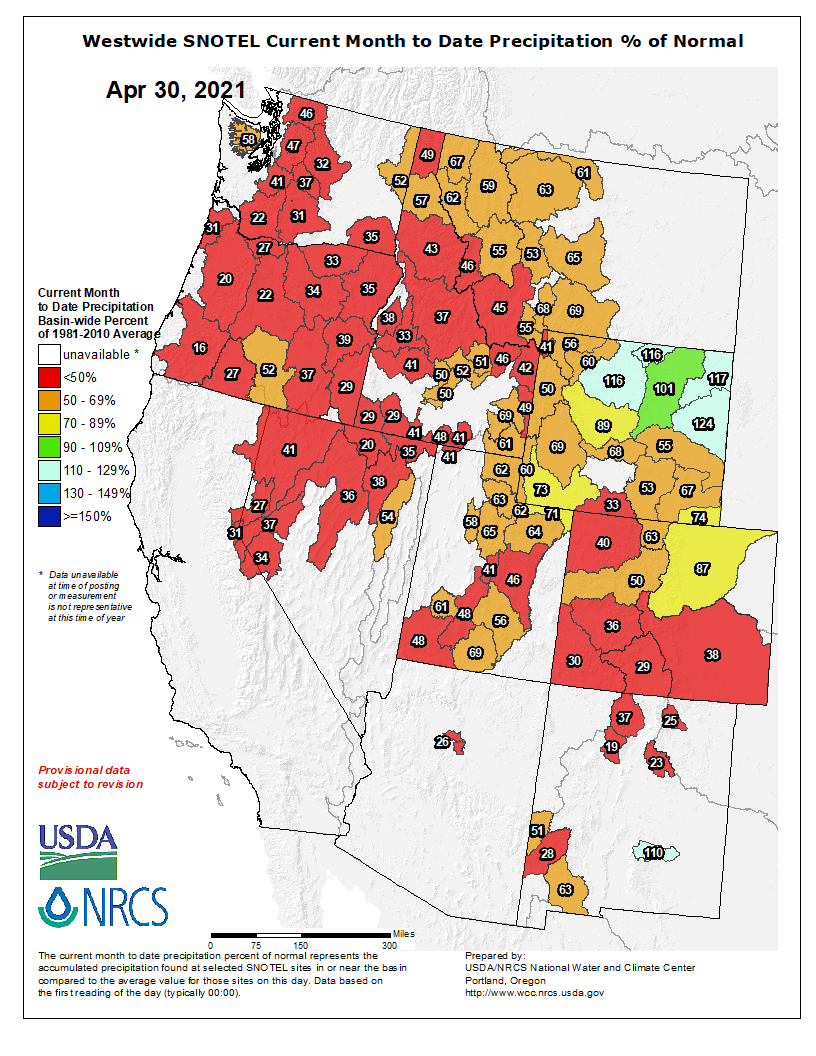
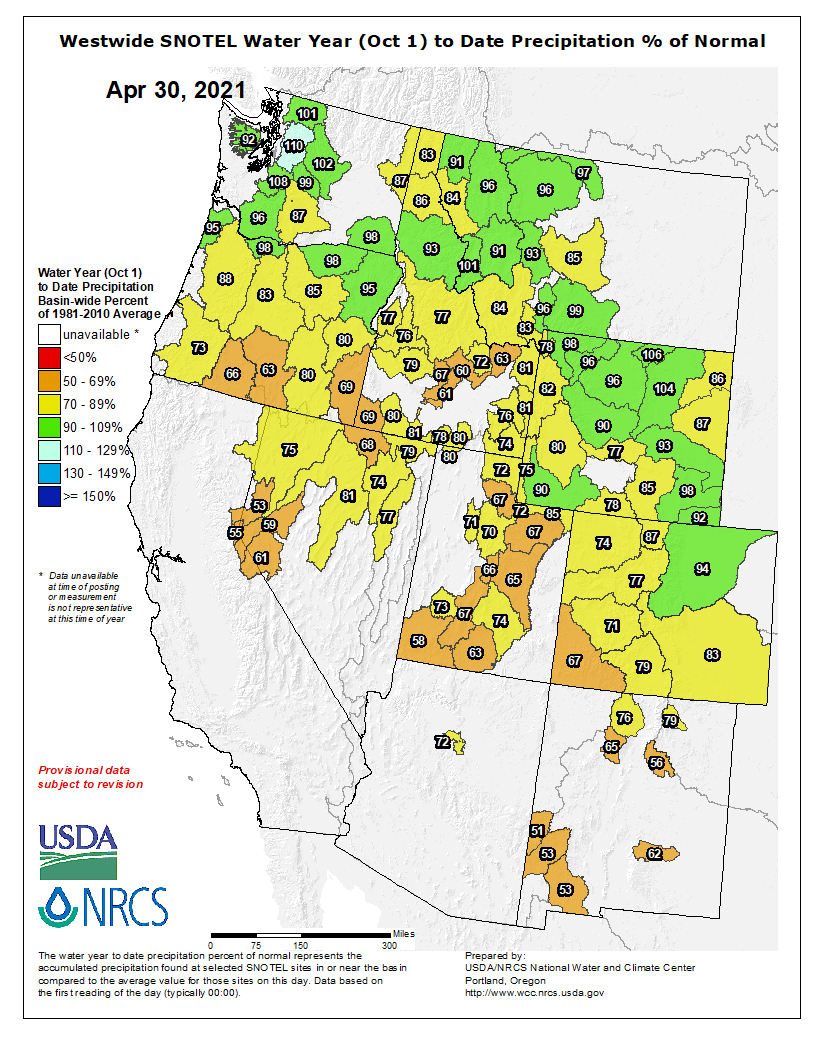
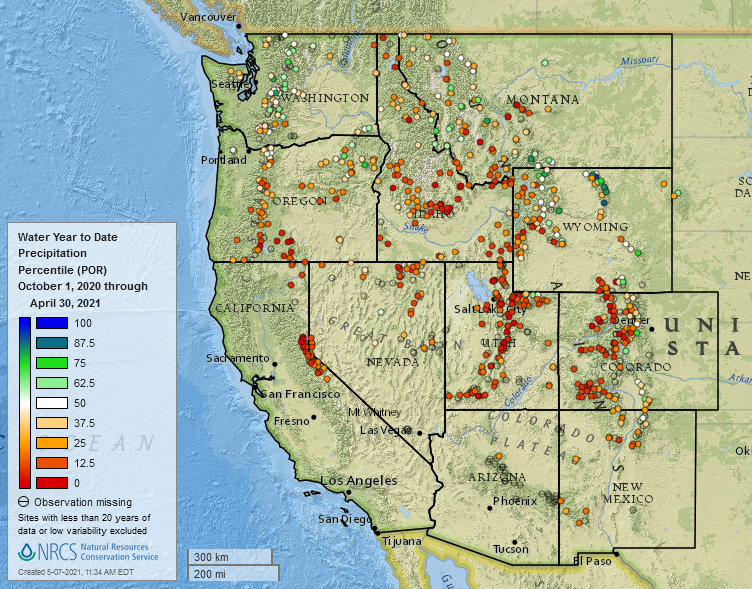
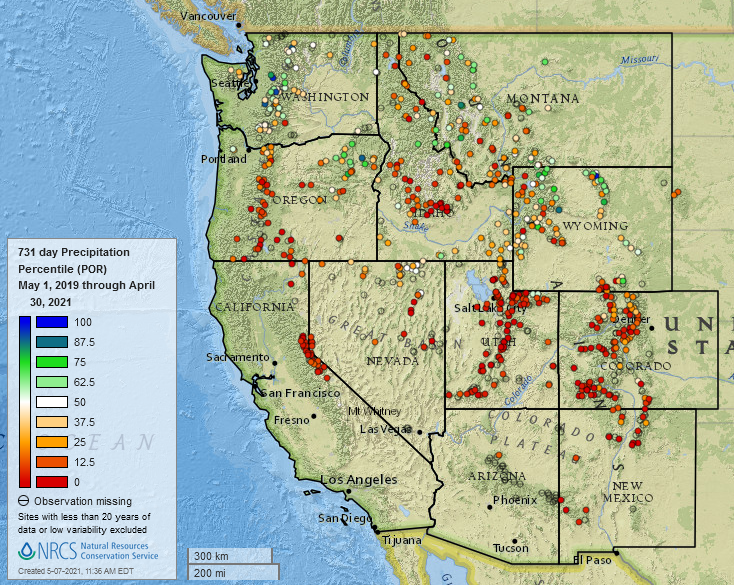
- Moderate (D1) to extreme (D3) drought extended from the West Coast to Rocky Mountains and into the adjacent High Plains, with a large area of exceptional (D4) drought across the Southwest to southern High Plains. The percent area of the West experiencing moderate to exceptional drought, according to USDM statistics, increased from 75.2 percent at the end of March to 83.8 percent at the end of April. The percent area of the West (from the Rockies to the West Coast) in moderate to extreme drought (based on the Palmer Drought Index) jumped to about 91.1 percent by the end of April 2021. This is the largest percent area since the current drought episode in the West began in the late 1990s. It exceeded the maximum extent of 84.8 percent in October 2003 and 87.3 percent in April 1977 during the 1976-77 drought episode, and is second only to the 1930s peak of 94.4 percent that occurred in September 1934. April 2021 was near to wetter than normal in only a few mountainous spots along the Rockies and in the interior, and drier than normal almost everywhere else in the West. This is evident in low elevation station precipitation data as well as high elevation (SNOTEL) precipitation data. Western snow cover was below average for the month, but mountain snow water equivalent (SWE) was still above normal in the Pacific Northwest and some Rocky Mountain locations, and below normal in most other western areas. For the water year-to-date (October 1, 2020-April 30, 2021), most areas were drier than normal with some wetter-than-normal areas in the north. The West has had significantly below-normal precipitation for the last 12 to 24 months and beyond. Arizona, Nevada, and New Mexico have had the driest May-April 12-month period in the 1895-2021 record.
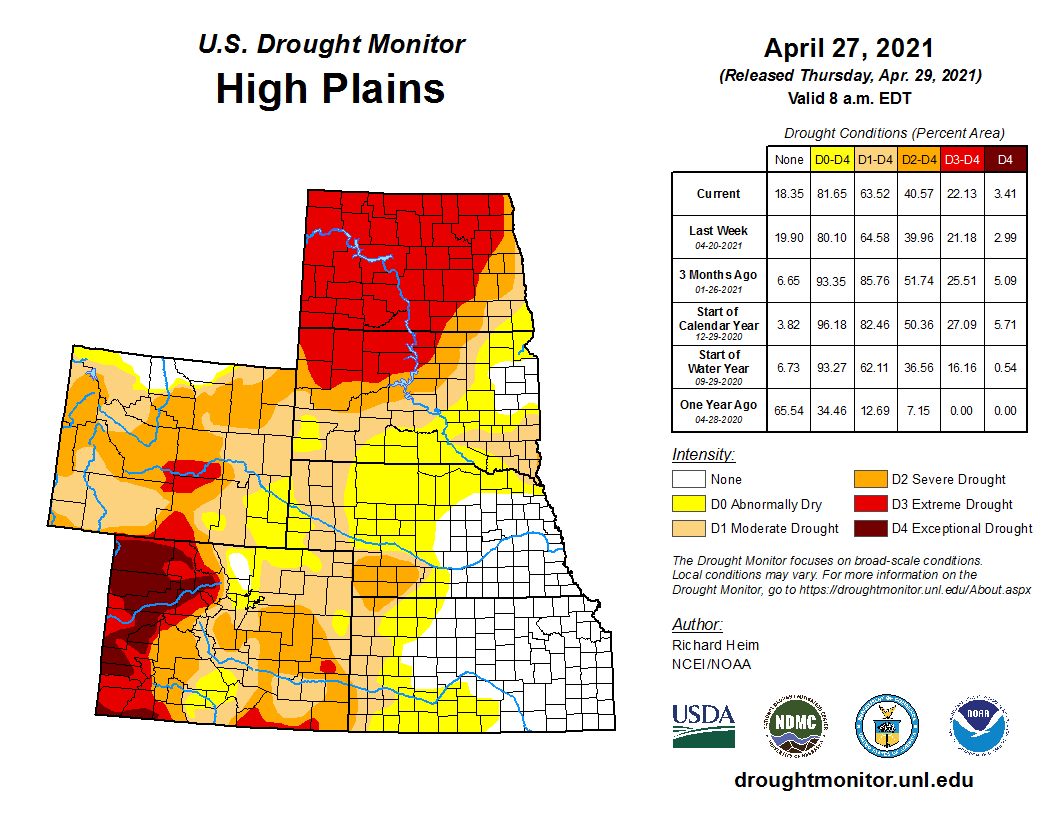
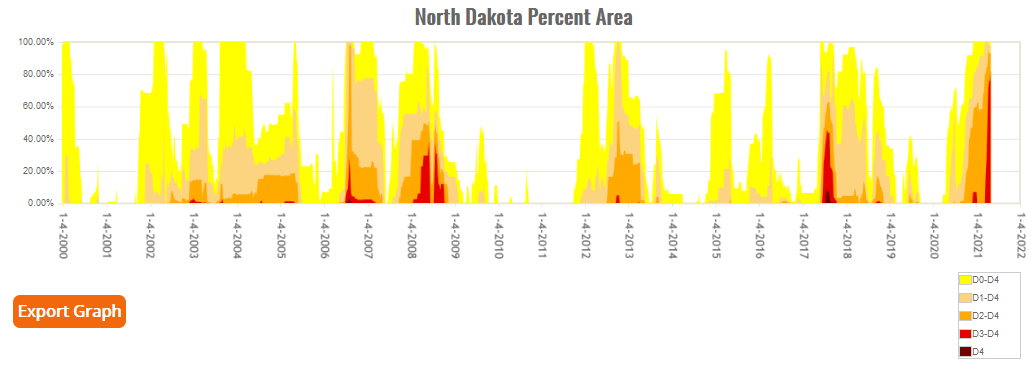
- Moderate to extreme drought expanded in the northern Plains, moderate to severe drought with spots of extreme drought continued in the central Plains, and moderate to extreme drought covered much of the southern Plains, with the hardest-hit area in western and southern Texas. The total moderate to exceptional drought area held steady in the central to northern Plains, covering about two-thirds (63.5 percent) of the region at the end of April, while moderate to exceptional drought shrank slightly overall in the southern Plains to Lower Mississippi Valley to about 35.5 percent of the region. North Dakota had the driest February-April, January-April, and November-April on record. This contributed to rapid expansion of extreme drought, which covered 82.7 percent of the state by the end of April — the largest statewide extent in the USDM record.
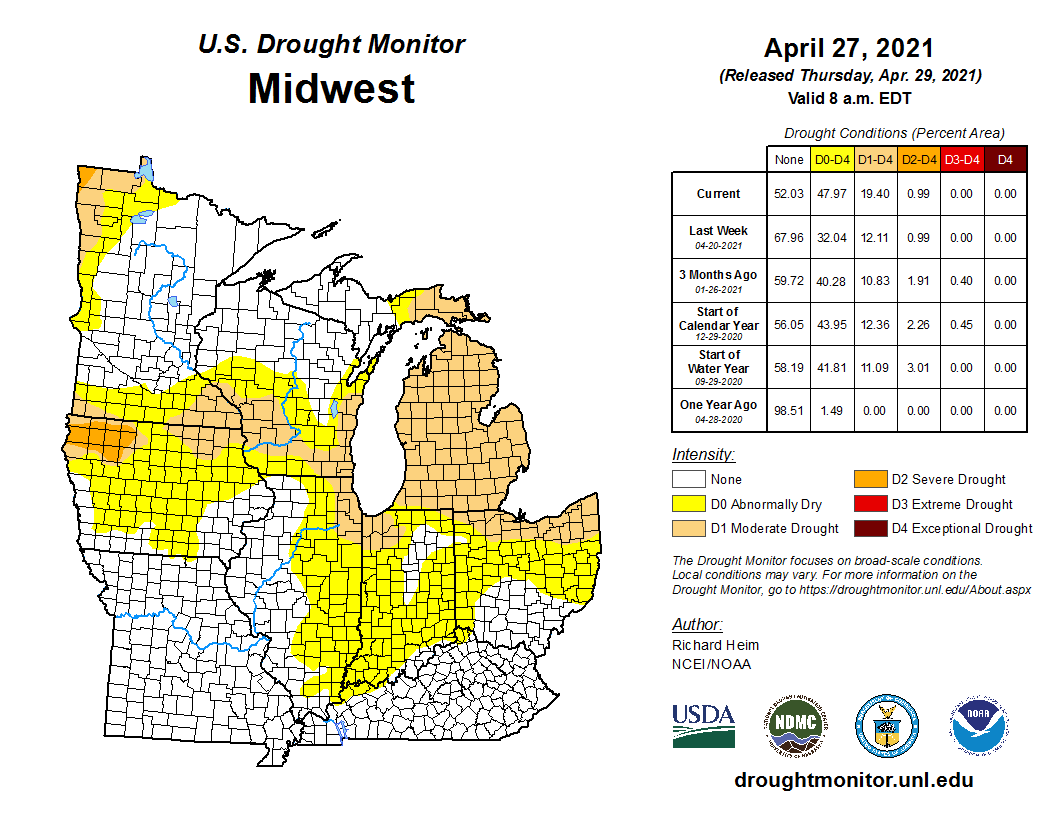
- In the Midwest, drought expanded to 19.4 percent of the region, with moderate drought and abnormal dryness growing in the Great Lakes while moderate to extreme drought continued in northwestern Iowa and northwestern Minnesota.
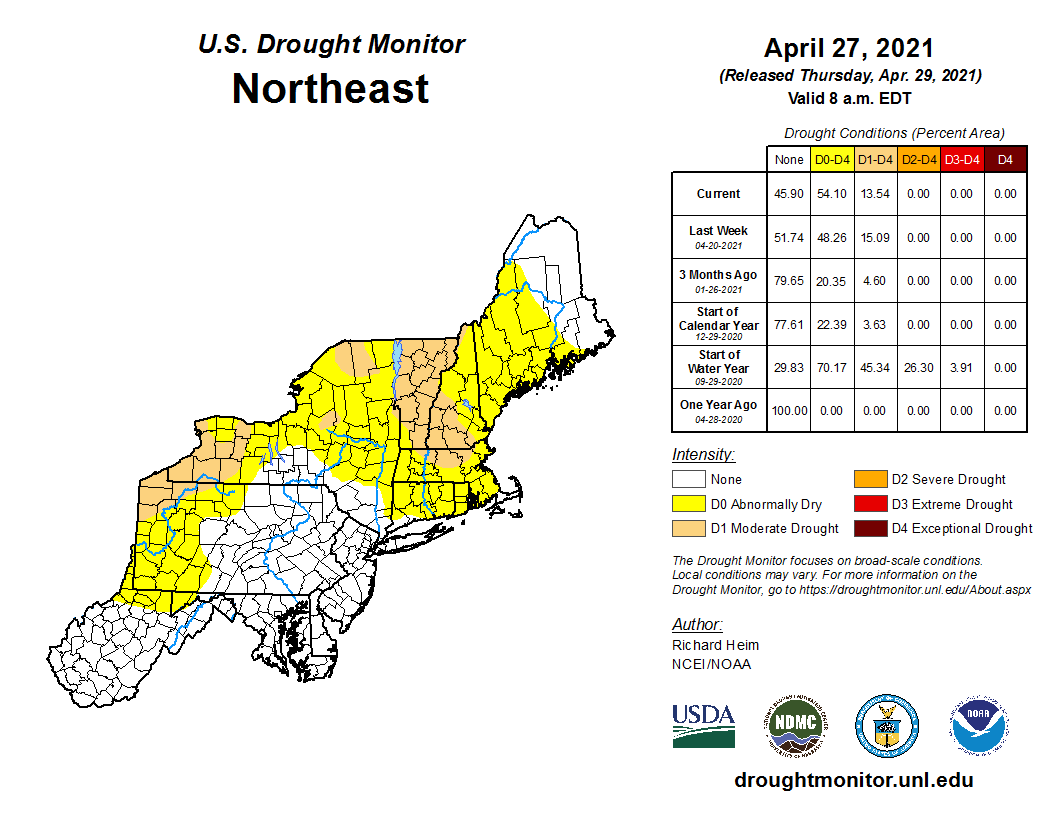
- Abnormal dryness and moderate drought expanded in the Northeast.
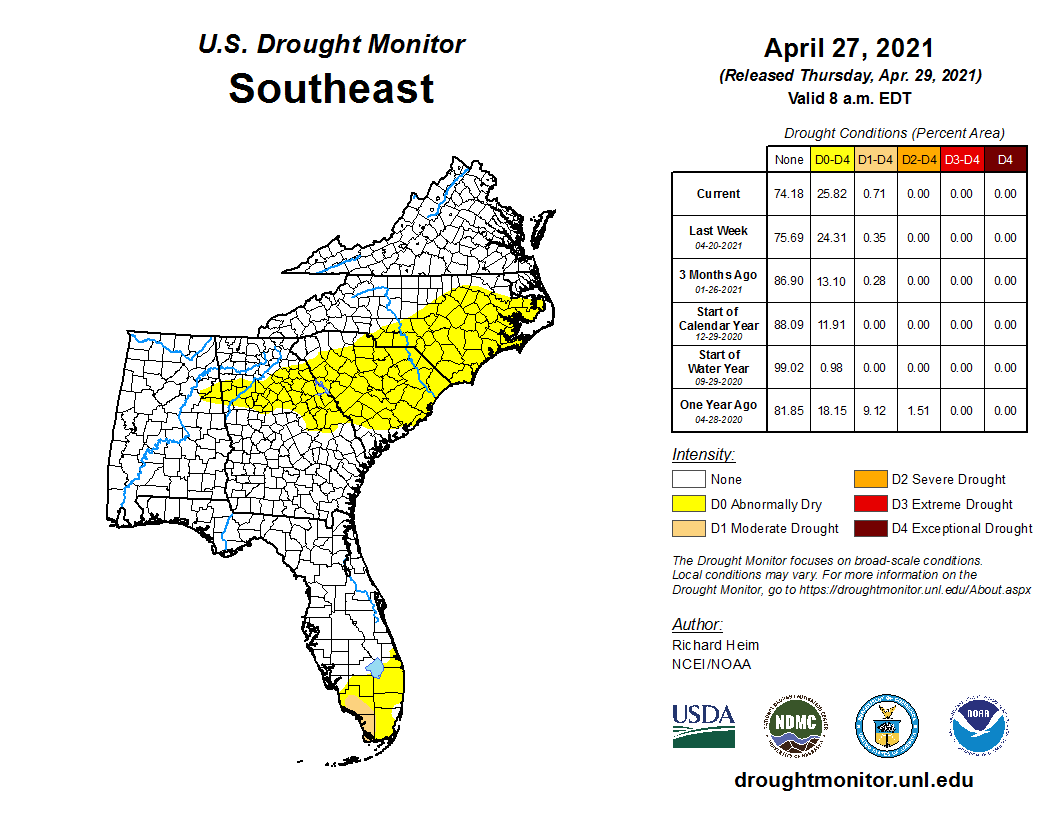
- In the Southeast, abnormal dryness shrank but moderate drought expanded in Florida, and abnormal dryness spread into the Carolinas.
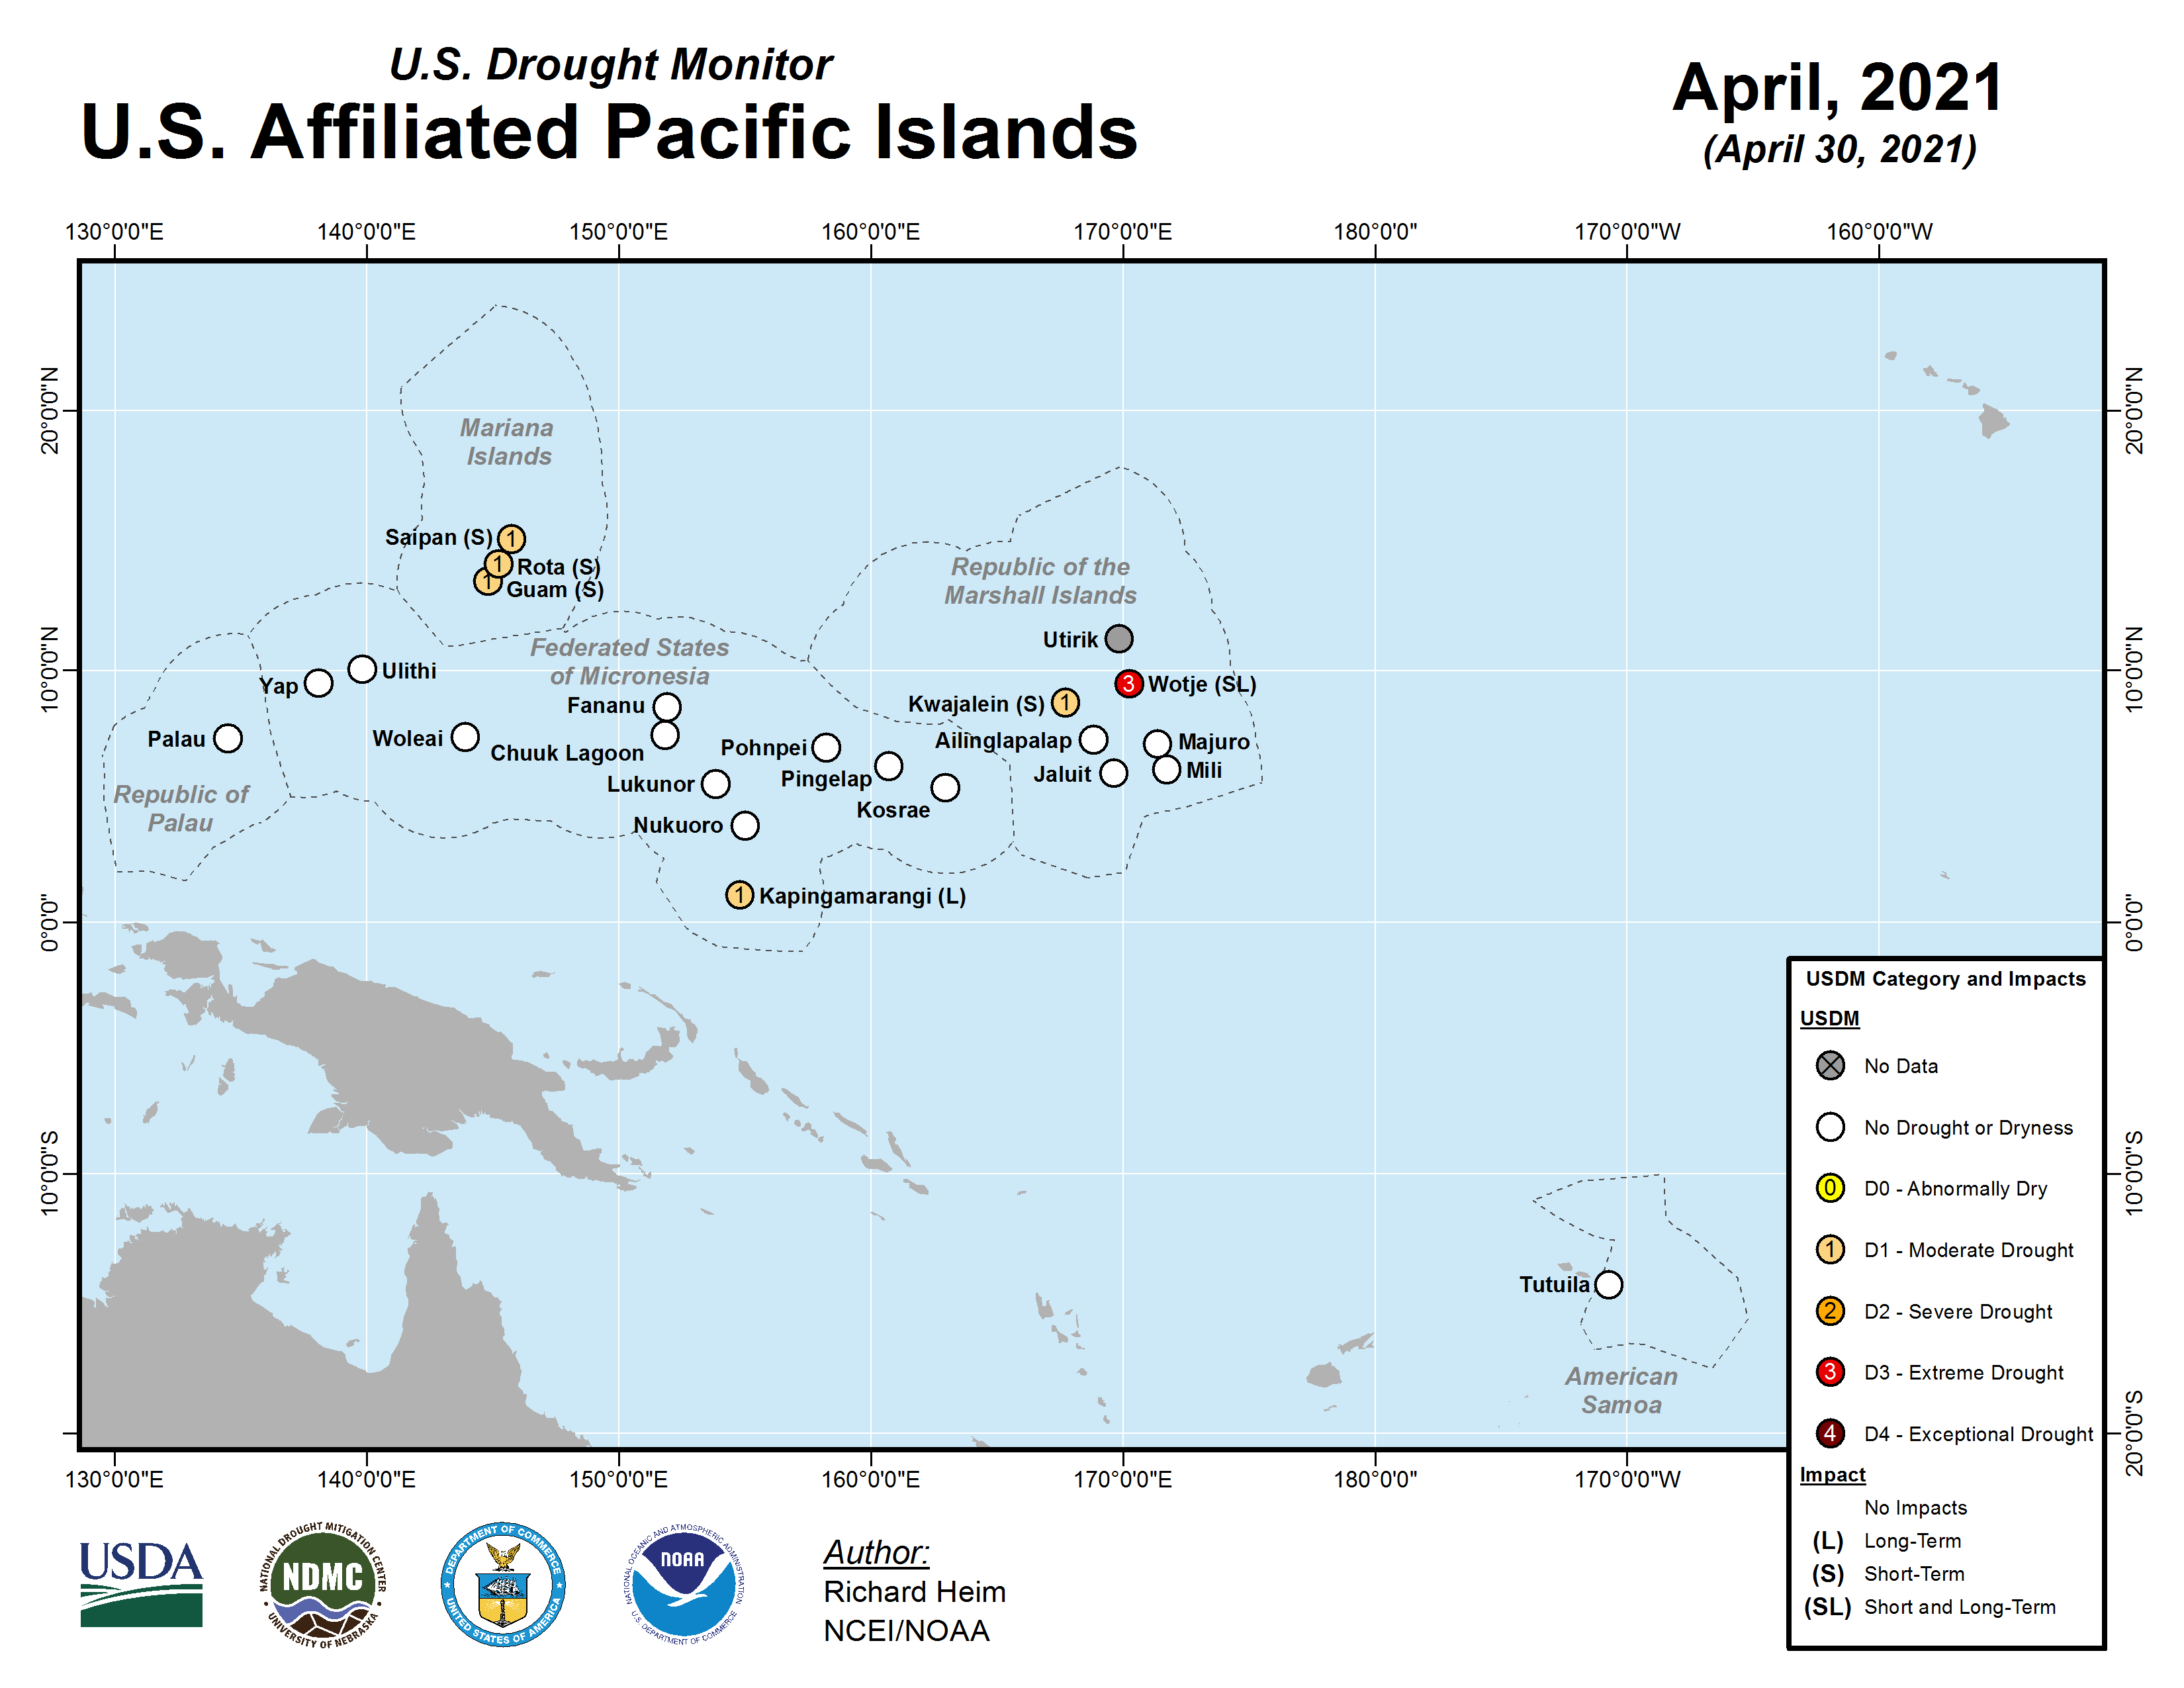
- In the U.S.-Affiliated Pacific Islands (USAPI), drier-than-normal weather during April resulted in moderate drought expanding in the Marianas (Guam, Rota, and Saipan). Moderate drought continued on Kapingamarangi to reflect lingering agricultural impacts. A wet month improved conditions on Kwajalein to moderate drought, but continued dry weather in the northern Marshalls kept extreme drought at Wotje.
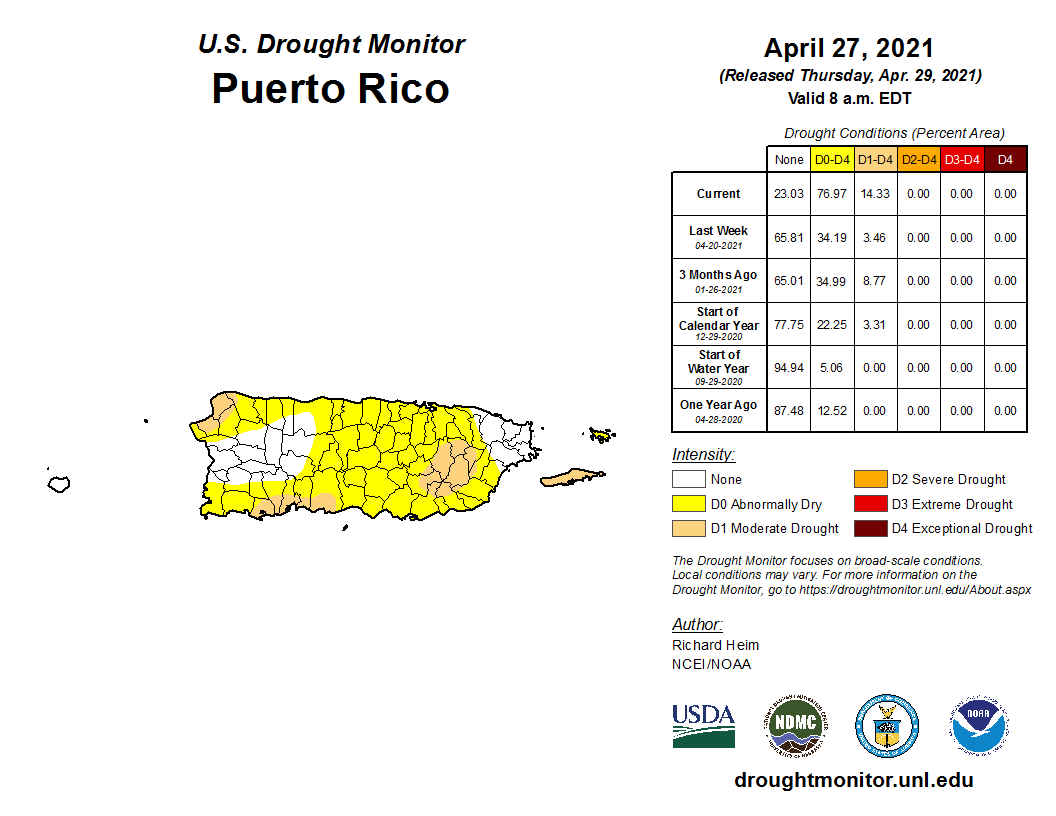
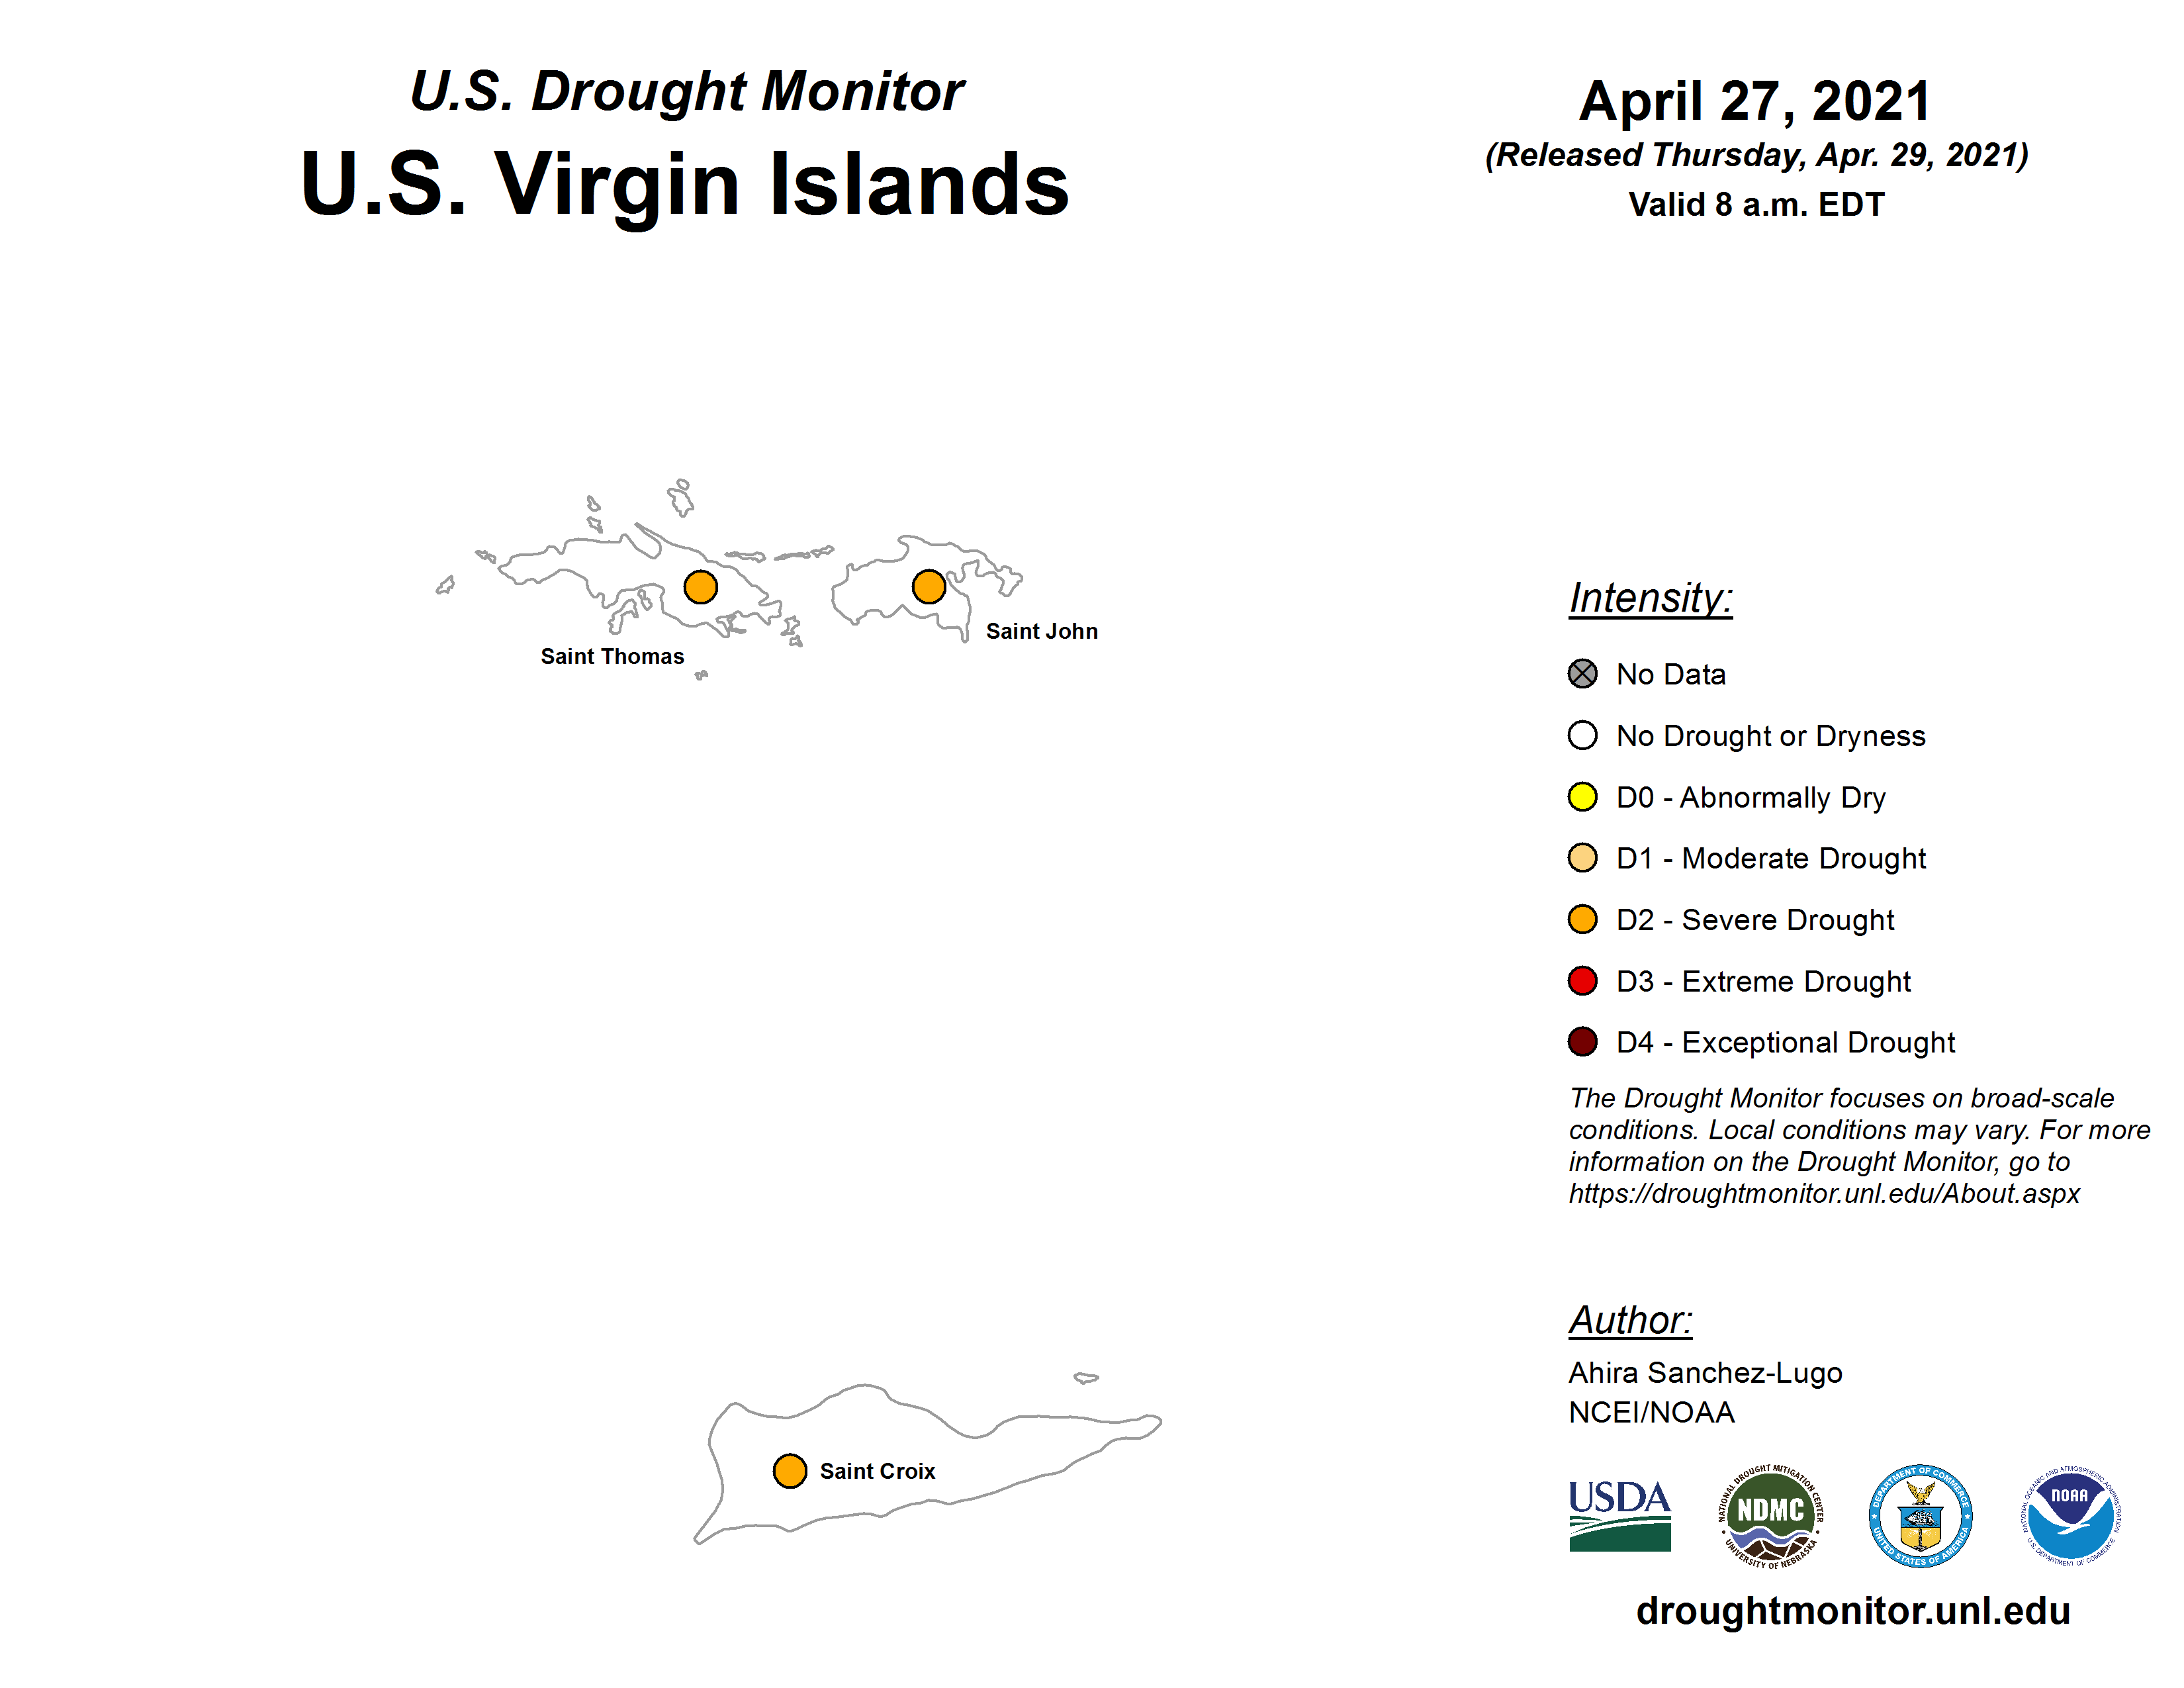
- Moderate drought and abnormal dryness expanded across Puerto Rico, 14.3 percent of the territory for moderate drought and 77.0 percent for abnormal dryness to moderate drought, while severe drought spread across the U.S. Virgin Islands (USVI).
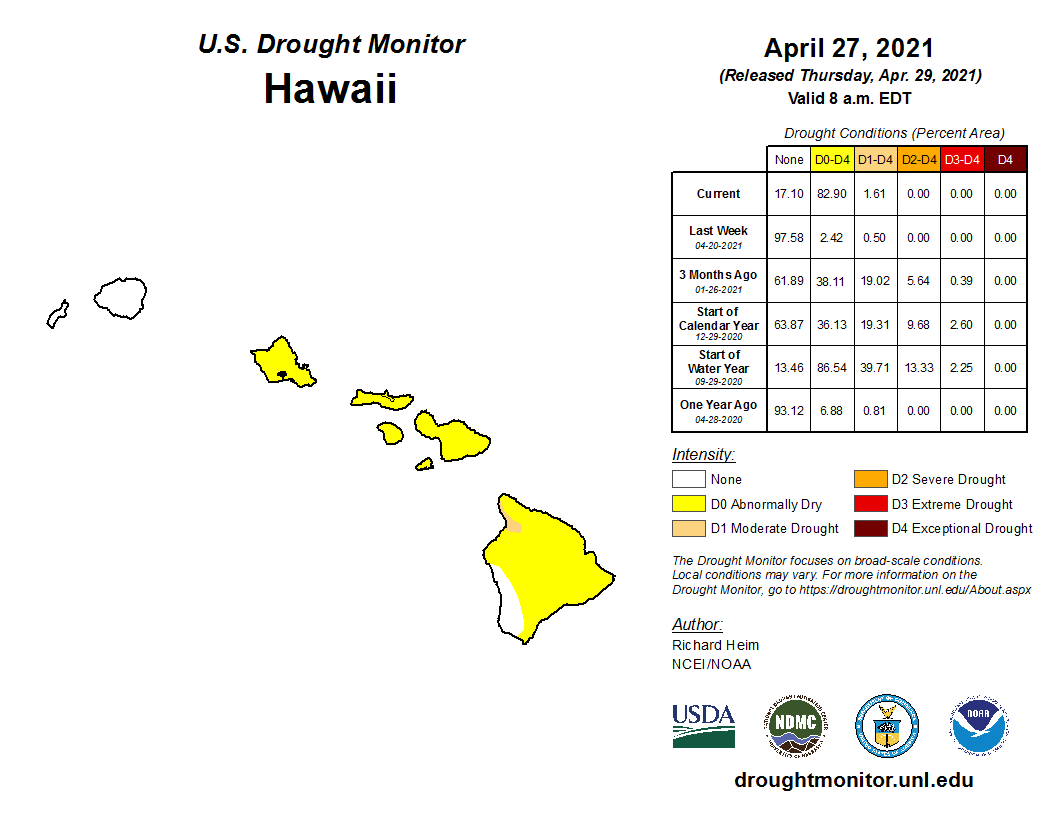
- Below-normal precipitation brought the return of moderate drought to Hawaii, with abnormal dryness expanding to cover 82.9 percent of the state.
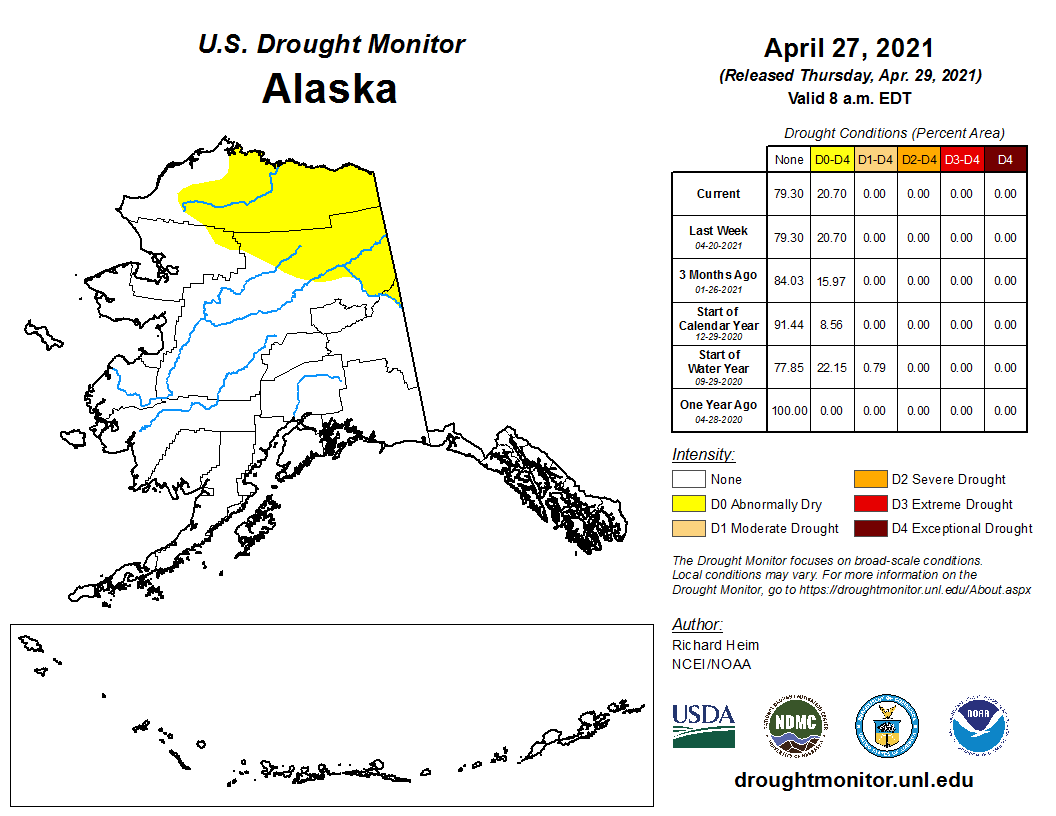
- Abnormal dryness shrank slightly to cover 20.7 percent of Alaska.
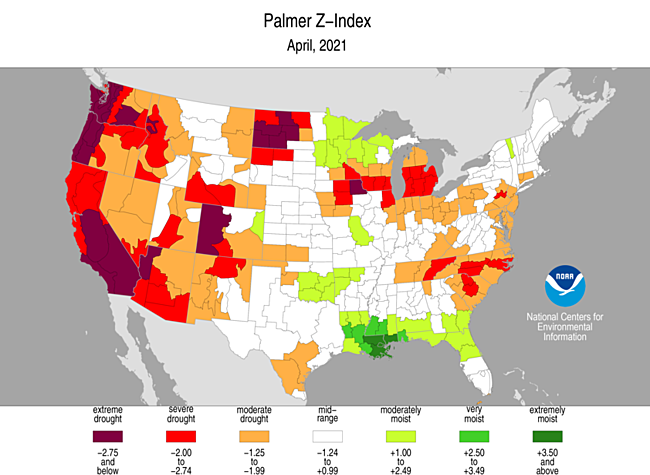
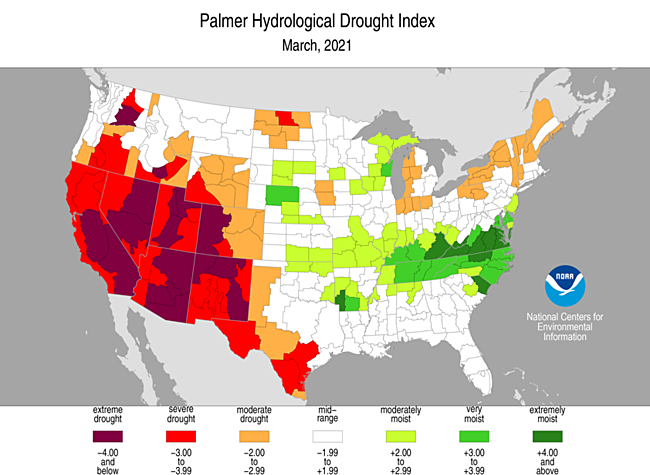
Palmer Drought Index
The Palmer drought indices measure the balance between moisture demand (evapotranspiration driven by temperature) and moisture supply (precipitation). The Palmer Z Index depicts moisture conditions for the current month, while the Palmer Hydrological Drought Index (PHDI) and Palmer Drought Severity Index (PDSI) depict the current month's cumulative moisture conditions integrated over the last several months. While both the PDSI and PHDI indices show long-term moisture conditions, the PDSI depicts meteorological drought while the PHDI depicts hydrological drought. The PDSI map may show less severe and extensive drought (as well as wet spell conditions) in some parts of the country than the PHDI map because the meteorological conditions that produce drought and wet spell conditions are not as long-lasting as the hydrological impacts.
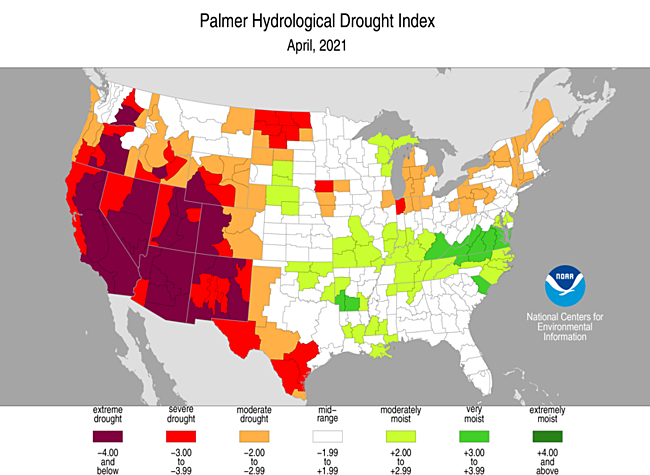
Used together, the Palmer Z Index and PHDI maps show that short-term drought occurred across most of the West, parts of the Plains (especially the northern Plains), much of the Midwest to northern Appalachians, and parts of southern New England, expanding or intensifying long-term drought in these areas (PHDI maps for April compared to March). Short-term drought also occurred in the Tennessee Valley to southern Appalachians, parts of the Upper Mississippi Valley, and along the East Coast from New Jersey to the Carolinas, shrinking or reducing the intensity of long-term wet conditions. Short-term wet conditions along the Gulf of Mexico coast contributed to long-term wet conditions in the Lower Mississippi Valley.
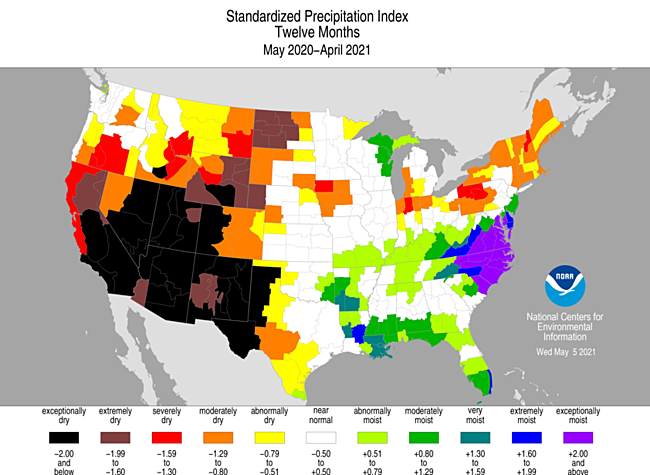
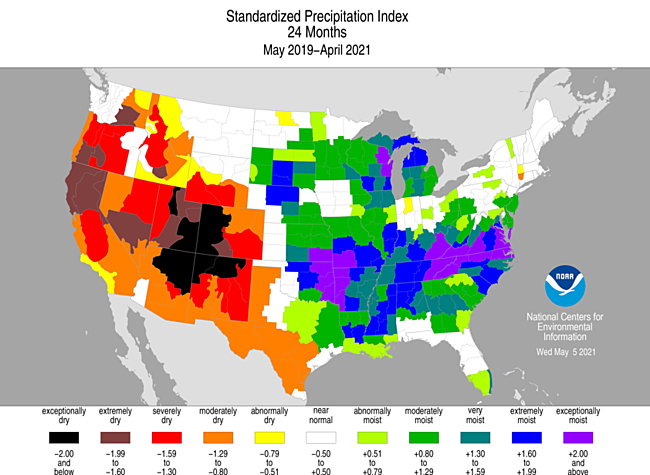
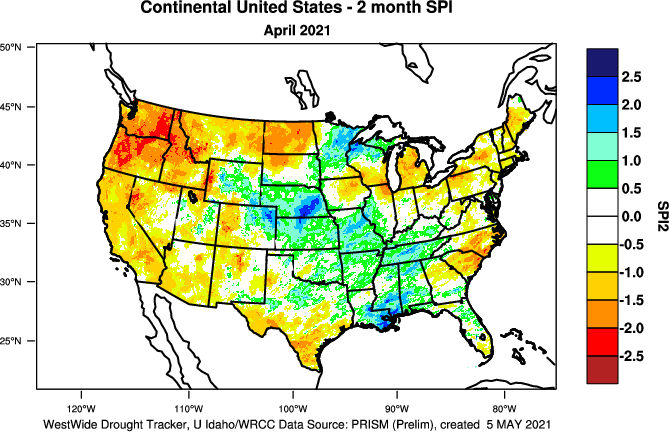
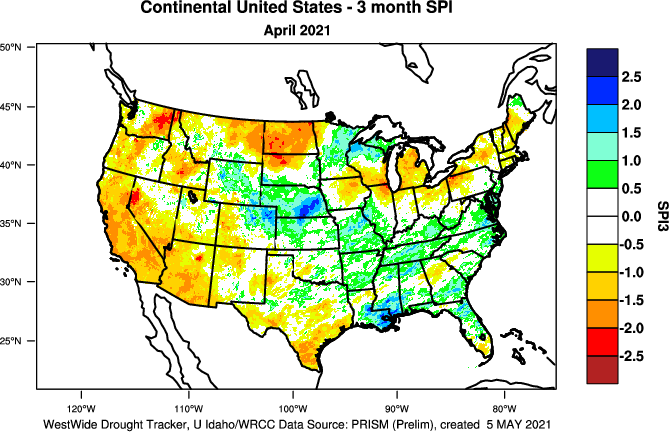
Standardized Precipitation Index
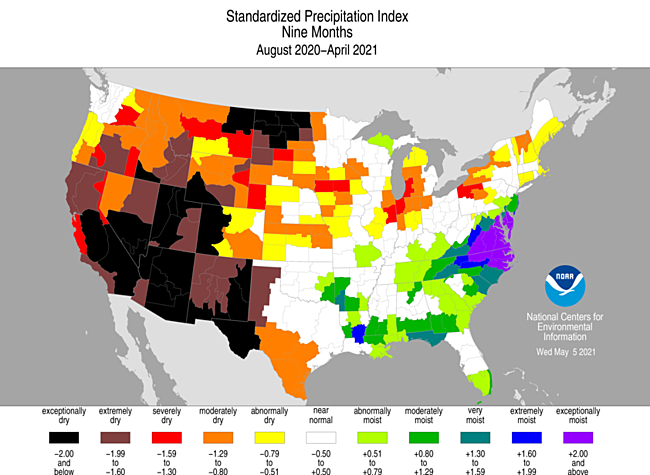
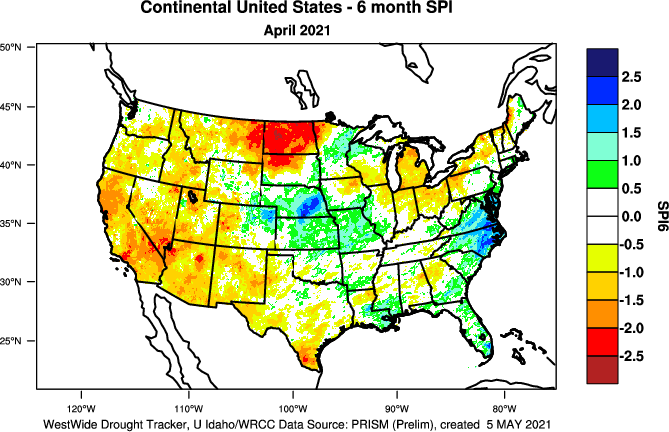
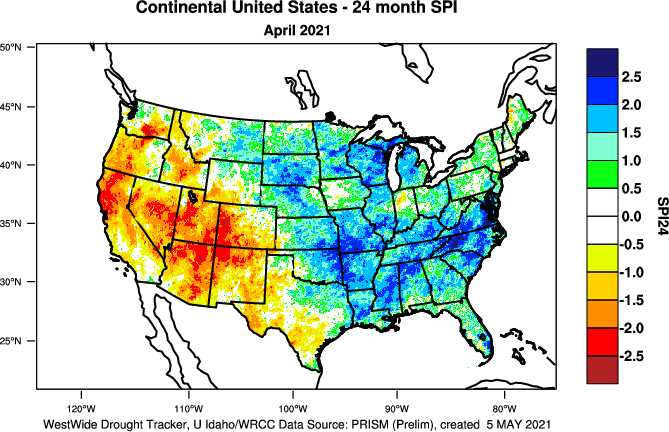
The Standardized Precipitation Index (SPI) measures moisture supply. The SPI maps here show the spatial extent of anomalously wet and dry areas at time scales ranging from 1 month to 24 months.
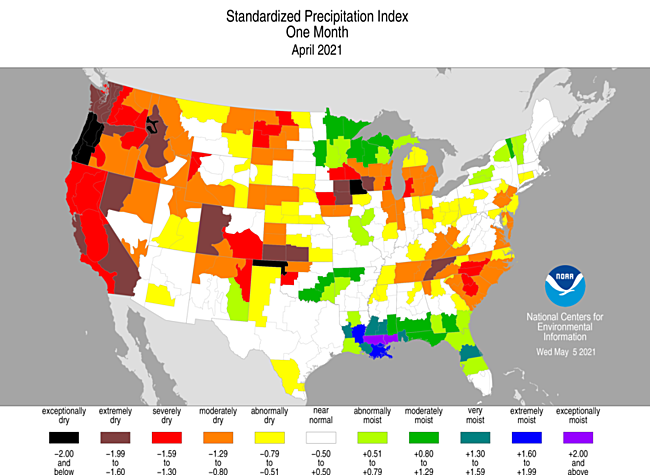
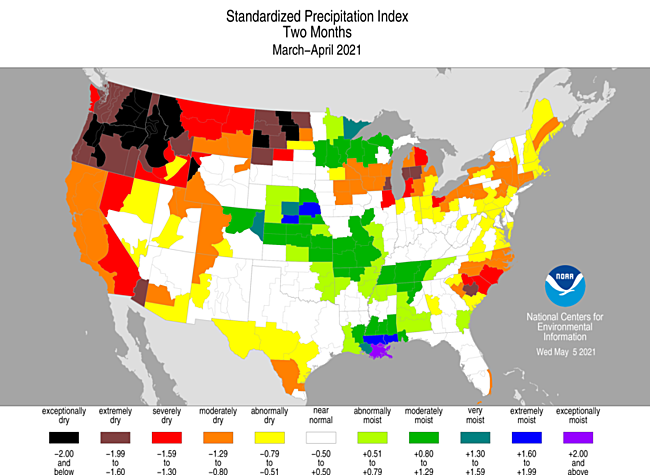
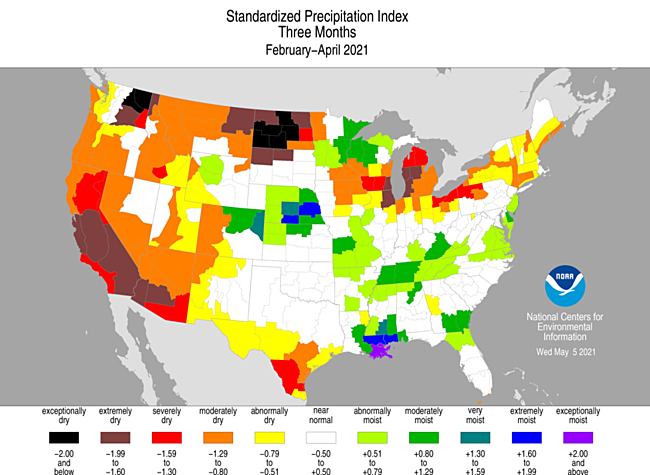
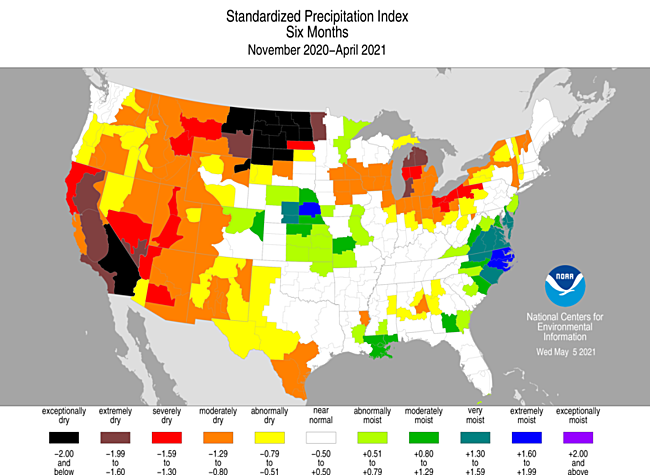
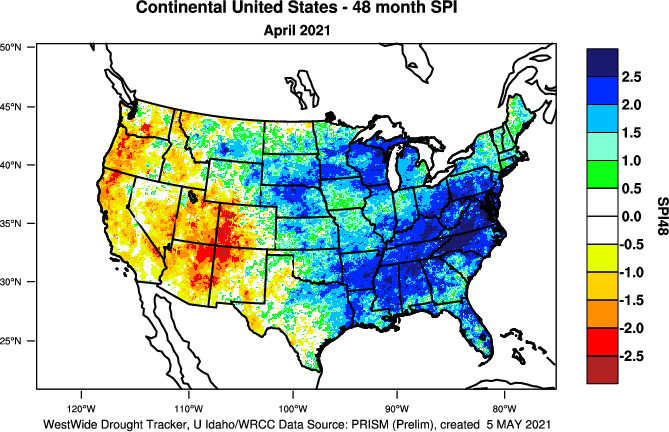
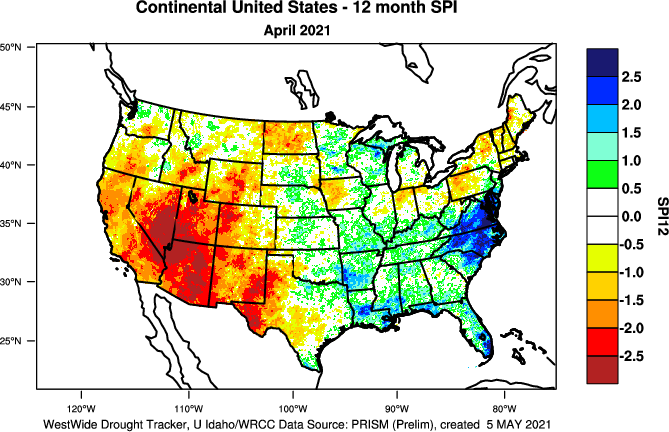
The SPI maps illustrate how moisture conditions have varied considerably through time and space over the last two years. Dry conditions dominate the West to western and southern Texas at all time scales, especially in the Pacific Northwest at 2 months and Southwest at 9-24 months, and the northern Plains at 1 to 12 months. The southern Great Lakes and parts to most of the Northeast are dry at the 1- to 12-month time scales. The Carolina Coast is dry at the 2-month time scale with the dryness extending into the southern Appalachians and Tennessee Valley at the 1-month time scale. Parts of the central Plains are dry at the 1-, 9-, and 12-month time scales. Wet conditions dominate the Upper Mississippi Valley at 1-3 months, central Plains at 2-6 months, Tennessee Valley at 2-3 months, the central to eastern Gulf of Mexico coast at 1 and 9-12 months, and the Mid-Atlantic to Carolina coast at 6 to 24 months. Wet conditions dominate the Lower Mississippi Valley at all time scales, and most of the CONUS east of the Rockies at 24 months.
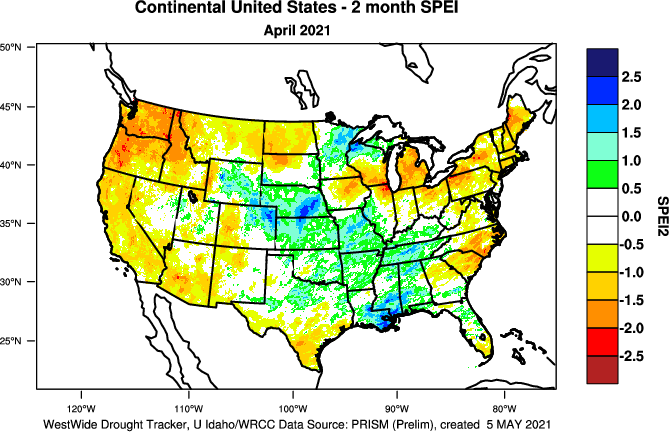
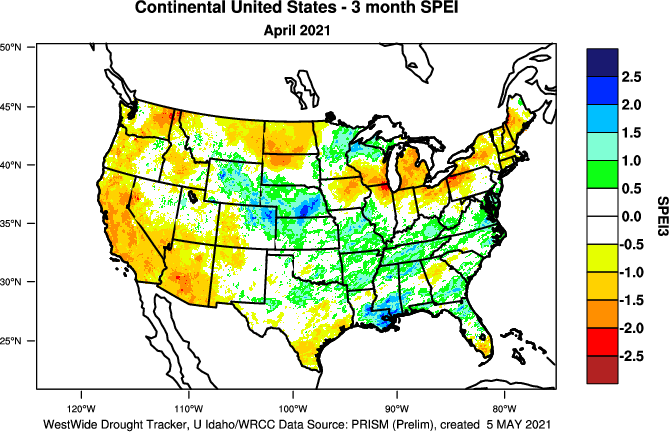
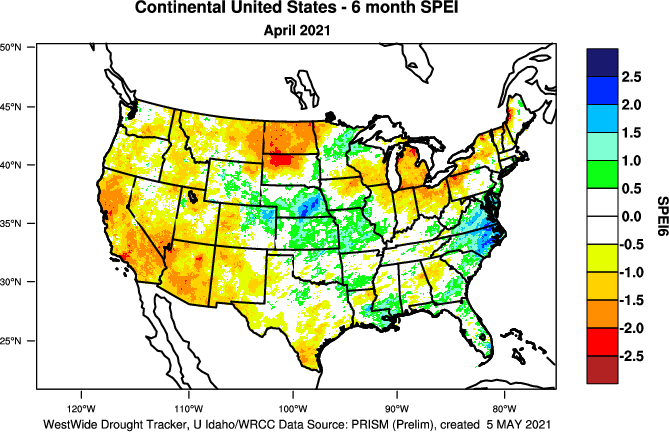
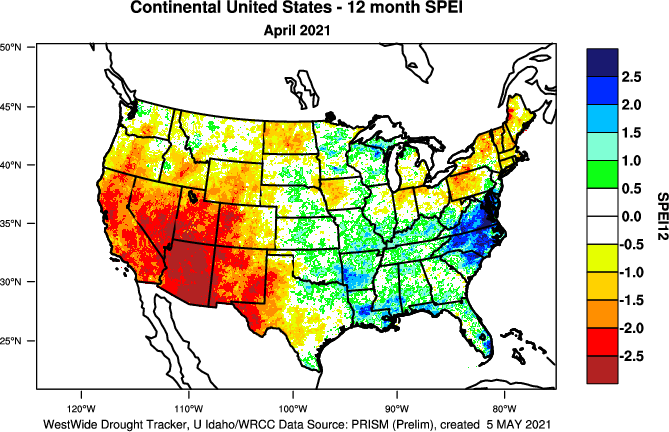
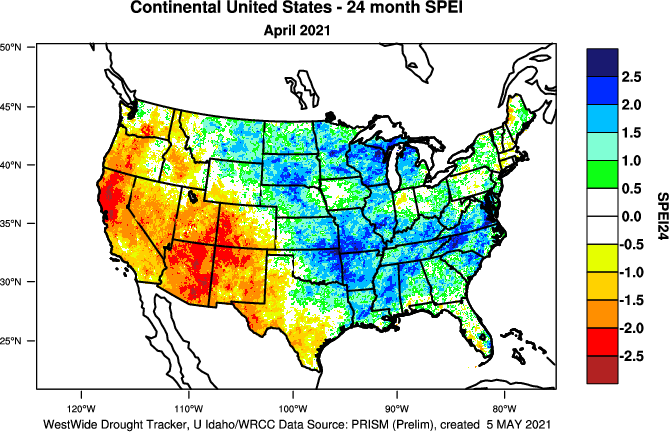
Standardized Precipitation Evapotranspiration Index
The SPI measures water supply (precipitation), while the SPEI (Standardized Precipitation Evapotranspiration Index) measures the combination of water supply (precipitation) and water demand (evapotranspiration as computed from temperature). Warmer temperatures tend to increase evapotranspiration, which generally makes droughts more intense.
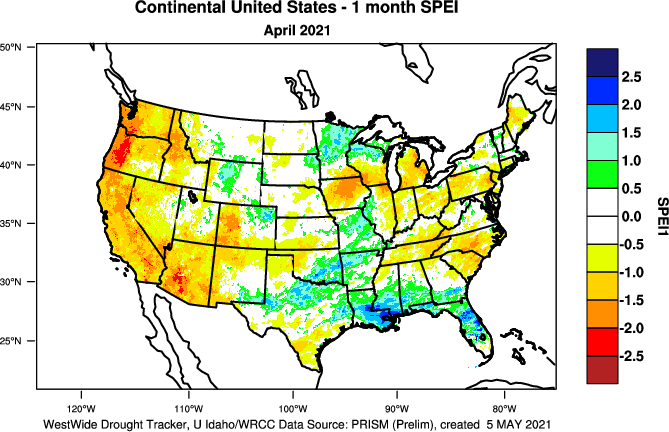
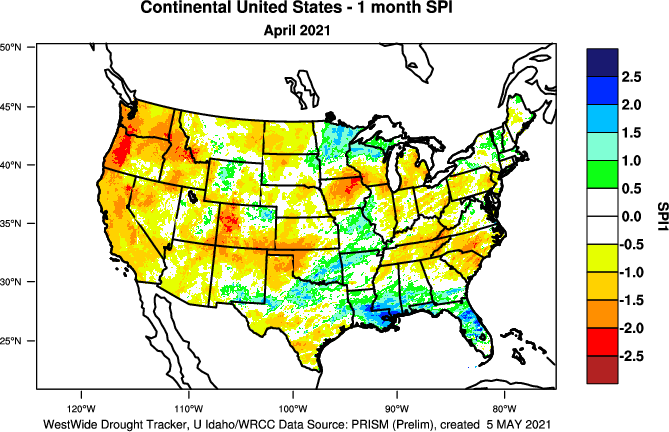
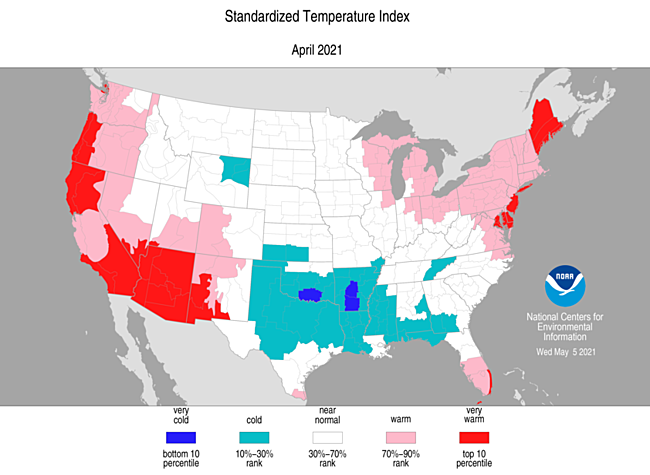
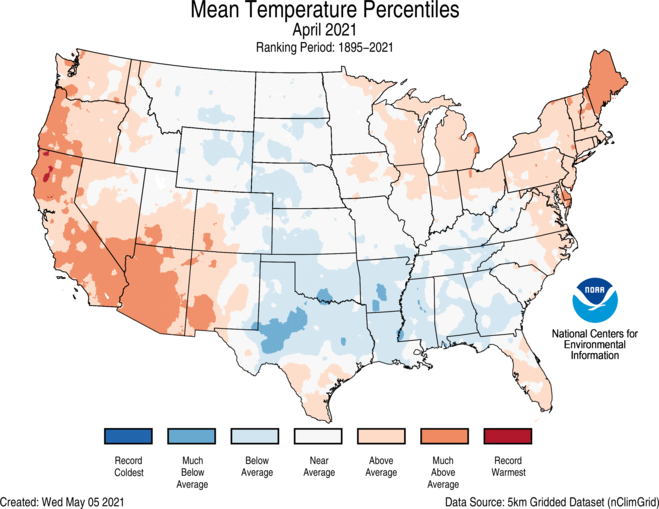
April is in the middle of spring, which is the transition season from winter (when evapotranspiration is minimal) to summer (when evapotranspiration reaches its annual maximum). During April 2021, temperatures were near to cooler than normal from the Rockies to Southeast, and warmer than normal only in the Northeast, Far West, and parts of the Southwest. This resulted in SPEI and SPI maps for April that had similar anomaly patterns and intensities. With the weather features alternating between warm ridging and cold Canadian outbreaks over much of the late winter and early spring, temperatures have averaged out to near normal across many of the drought areas, so the SPEI and SPI maps are similar for much of the last six months (SPEI maps for the last 1, 2, 3, 6 months) (SPI maps for the last 1, 2, 3, 6 months).
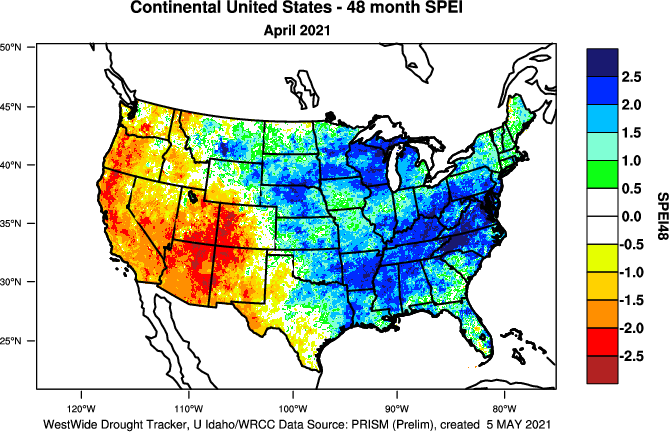
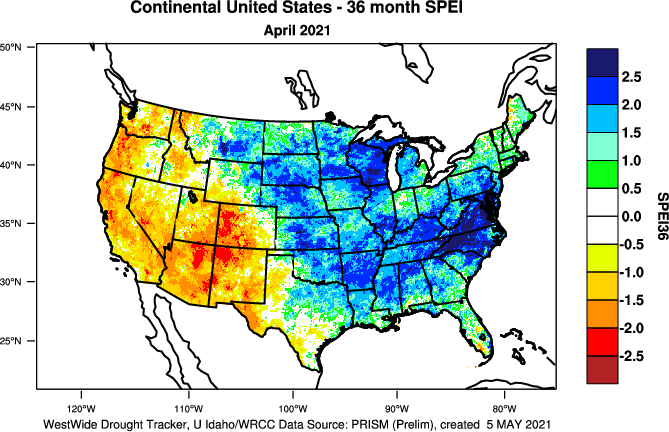
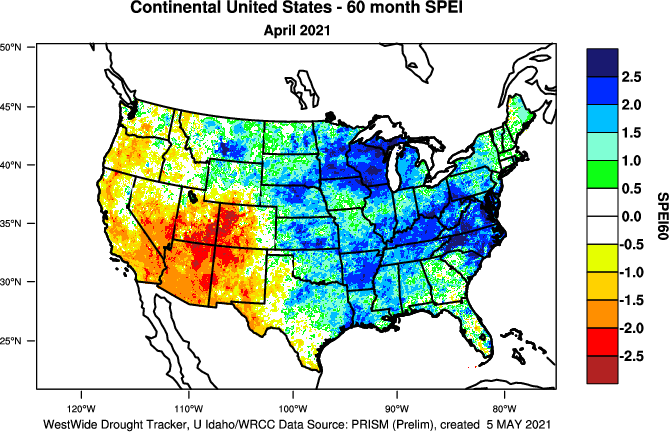
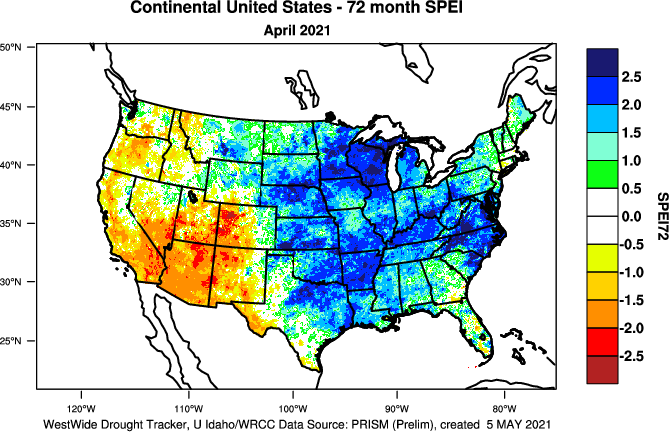
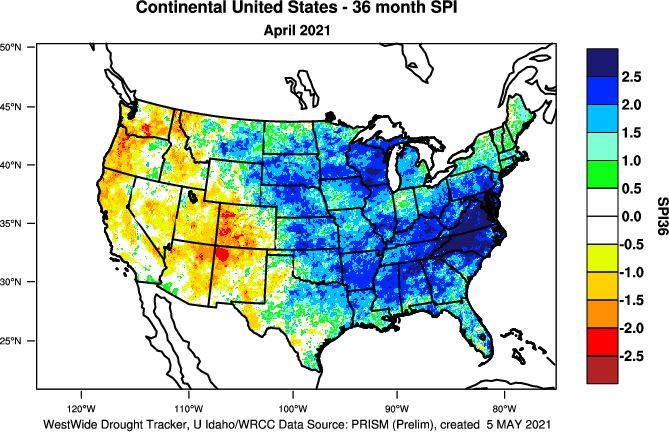
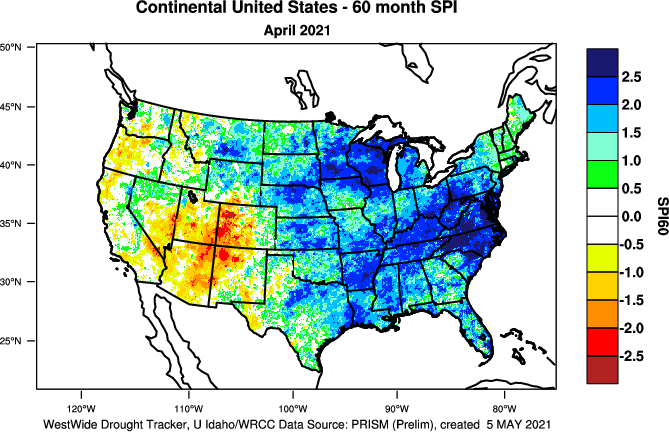
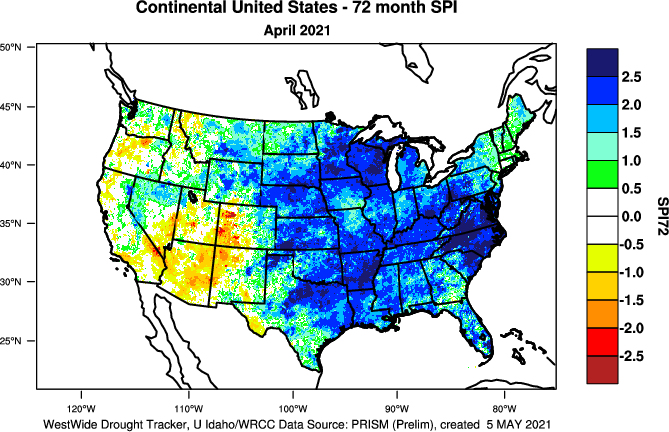
Temperatures have been much warmer than normal in the Southwest for much of the last one to six years. The excessive evapotranspiration, especially during the warm season, has contributed to more extreme SPEI values than SPI values for much of this period (SPEI maps for the last 12, 24, 36, 48, 60, 72 months) (SPI maps for the last 12, 24, 36, 48, 60, 72 months).
Regional Discussion
Hawaii
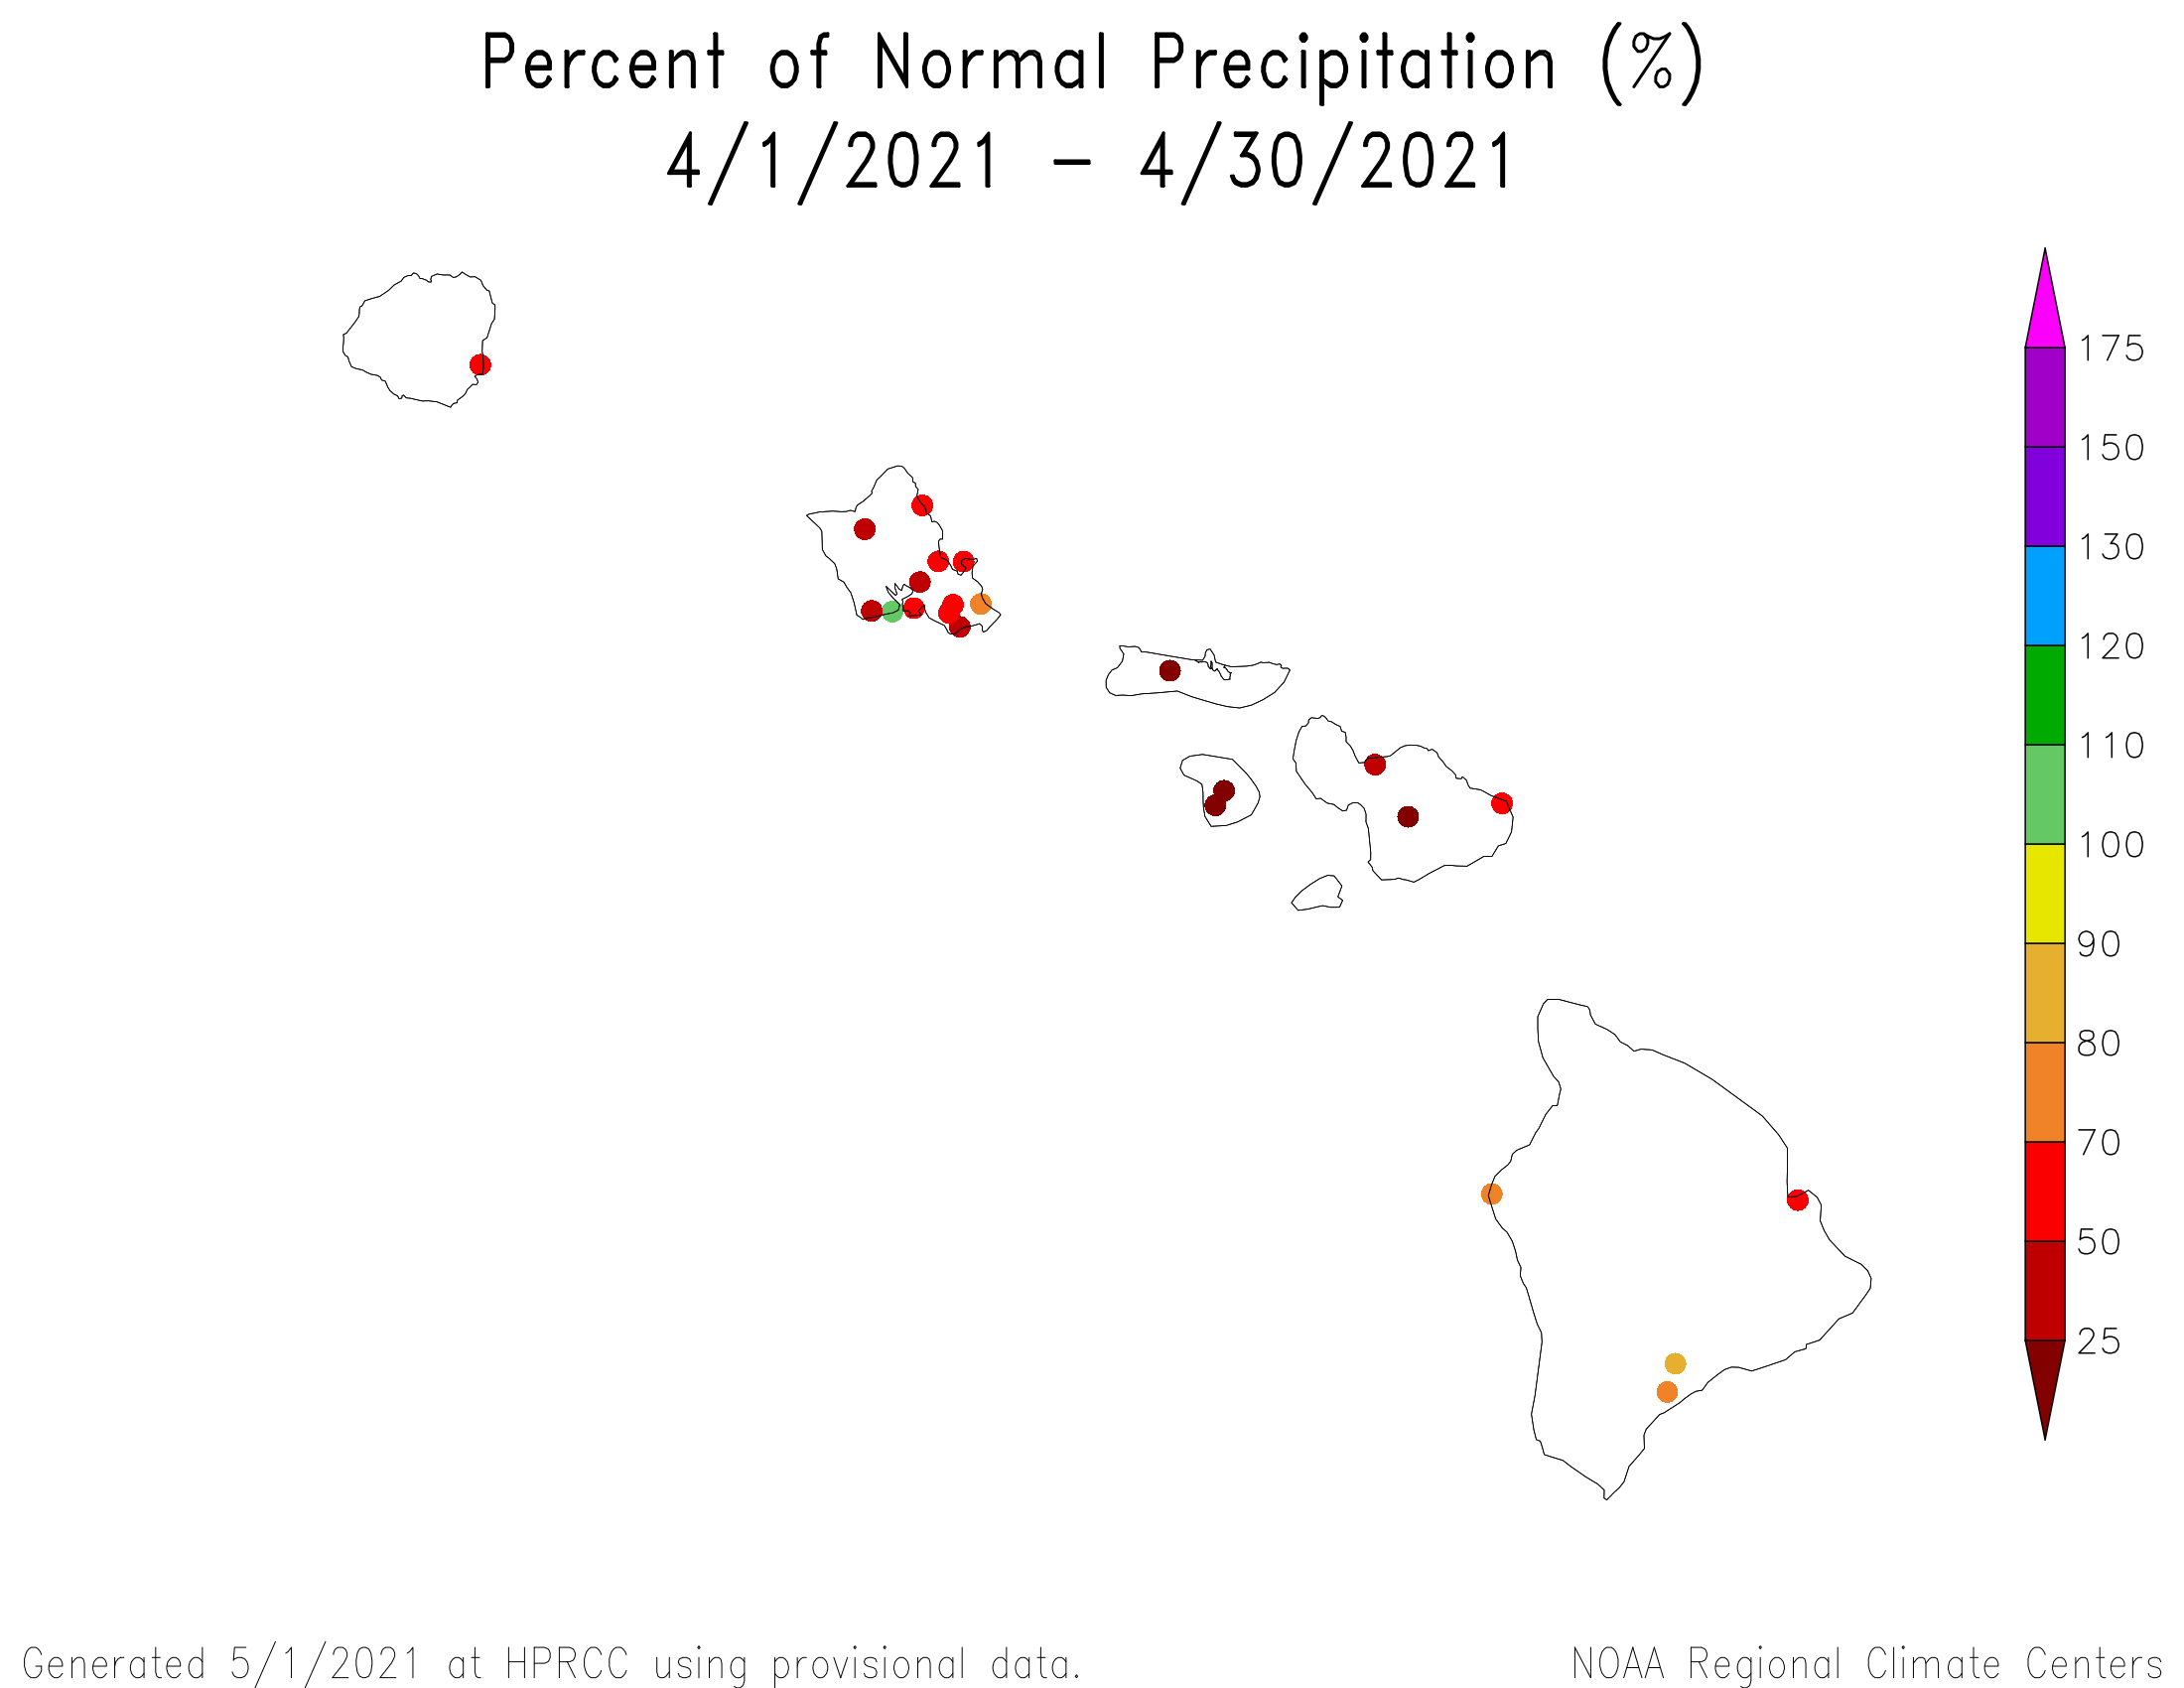

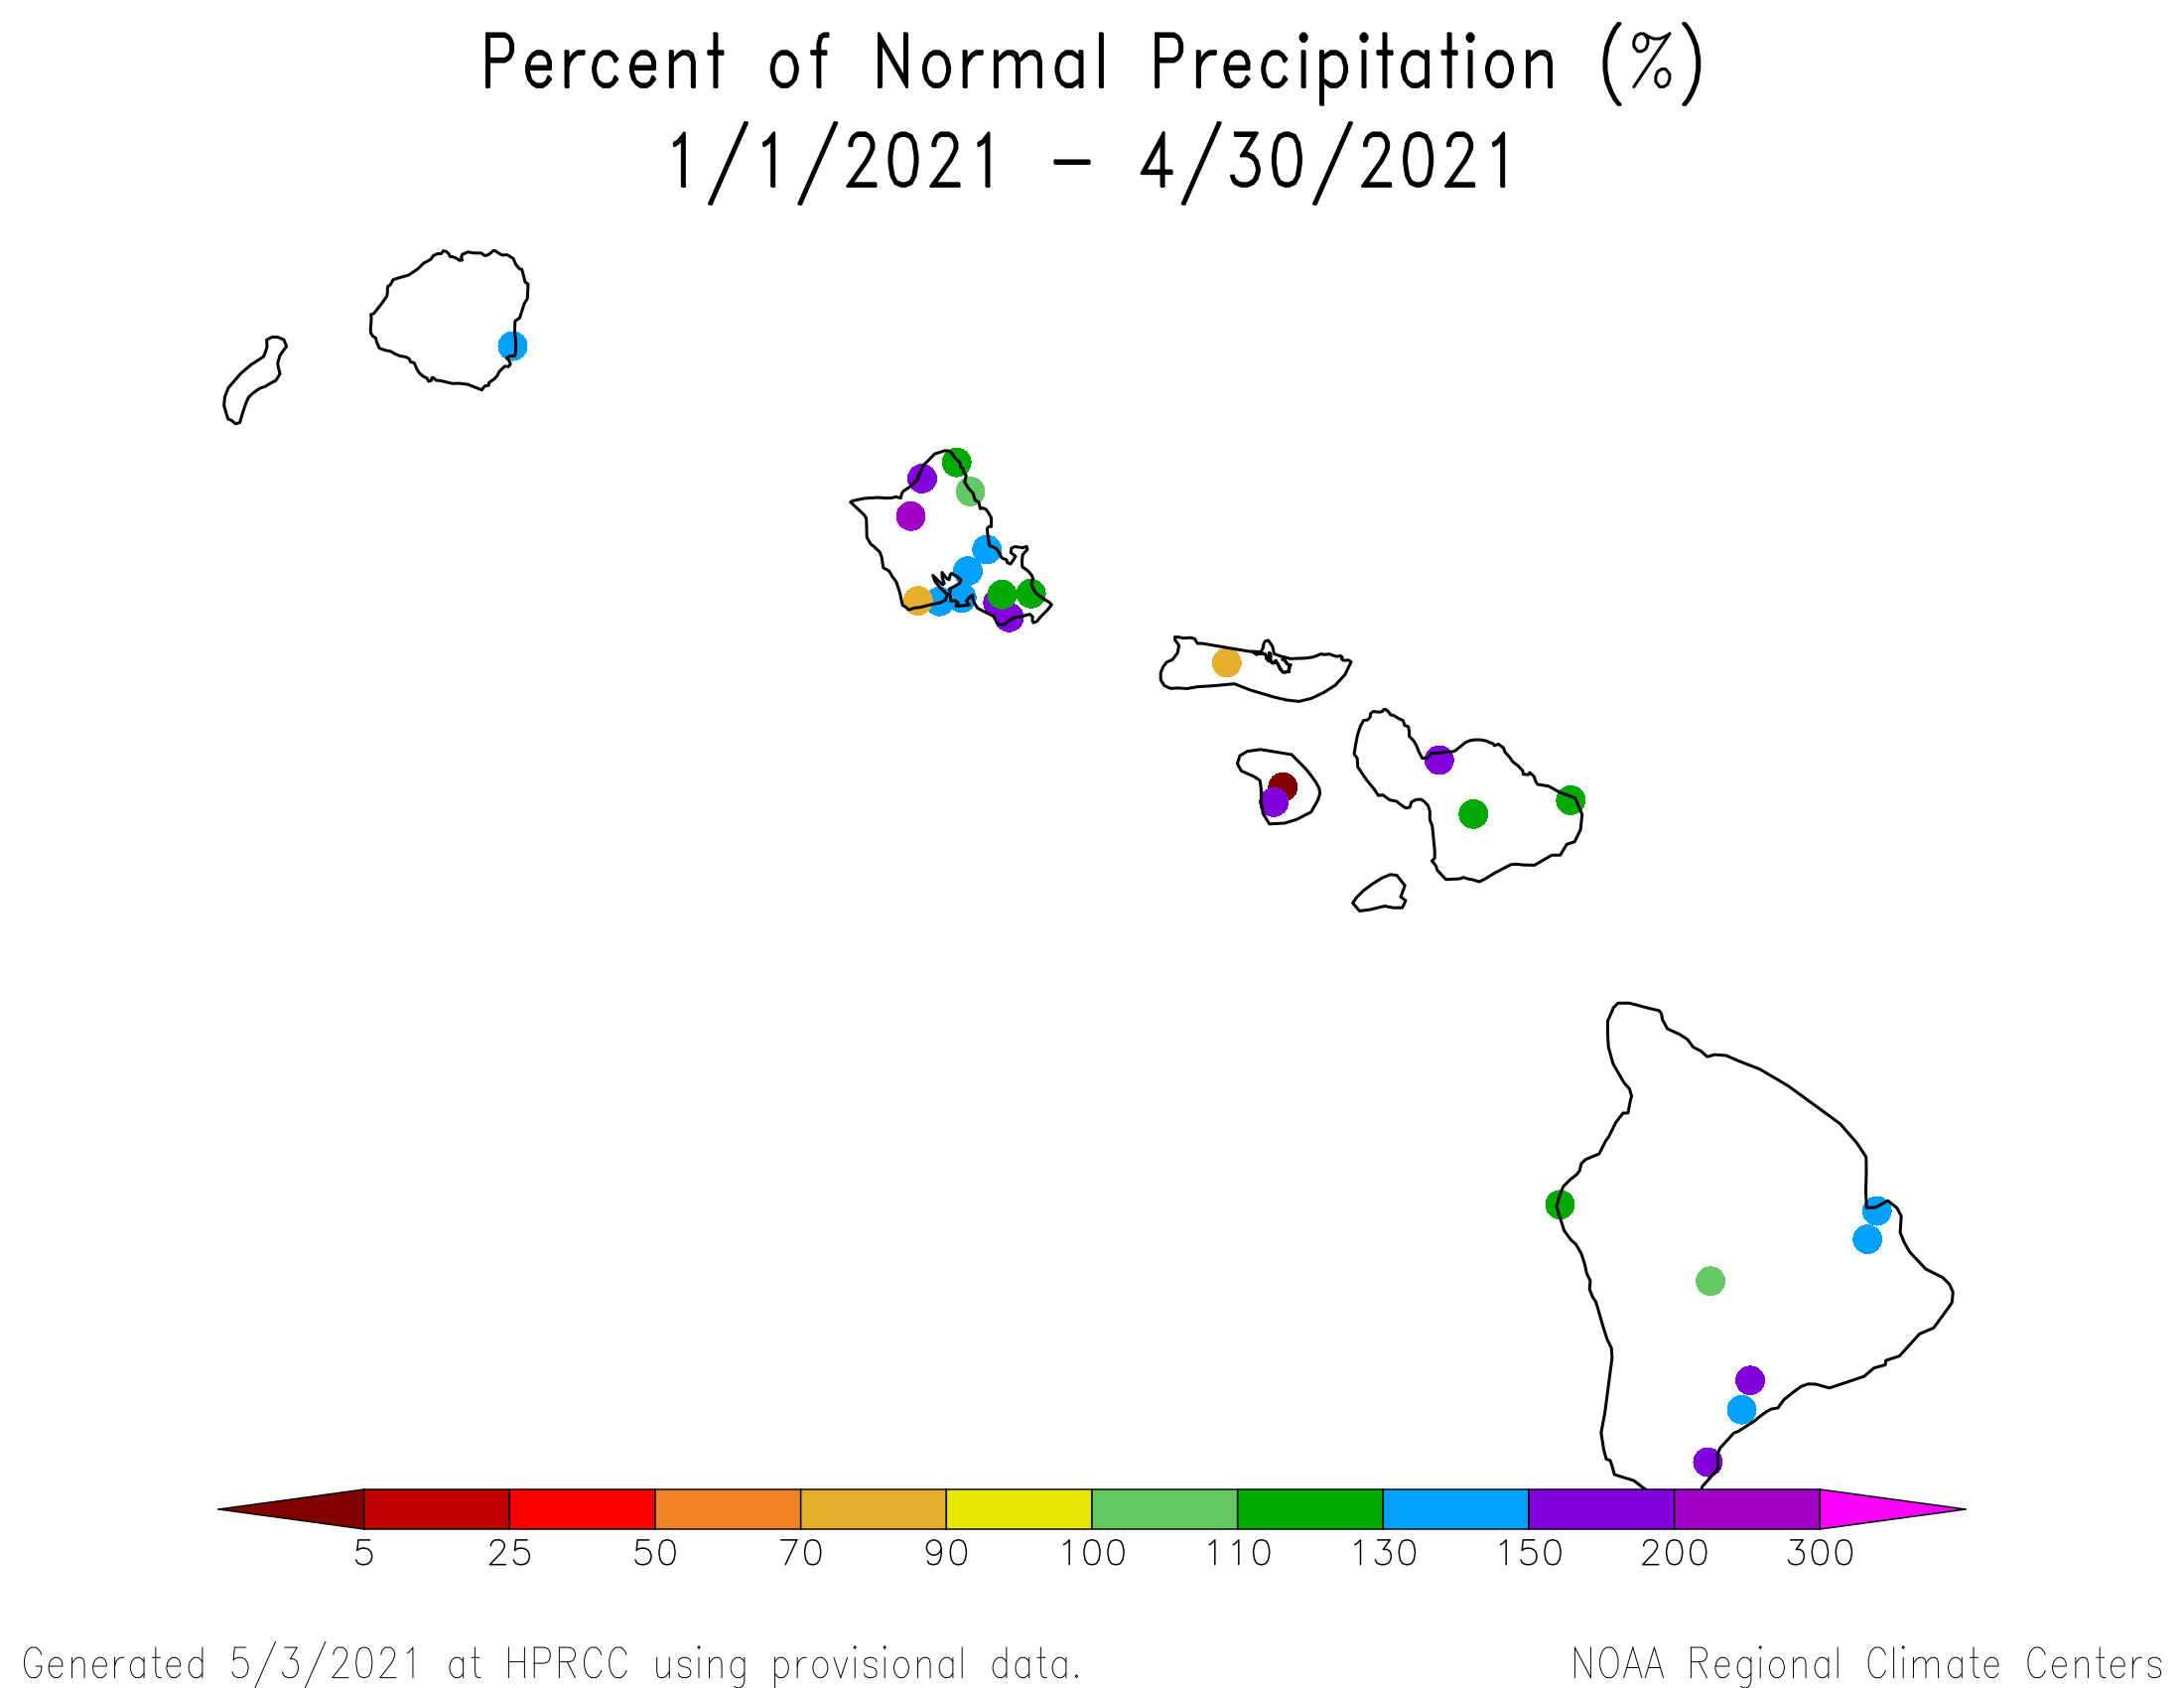
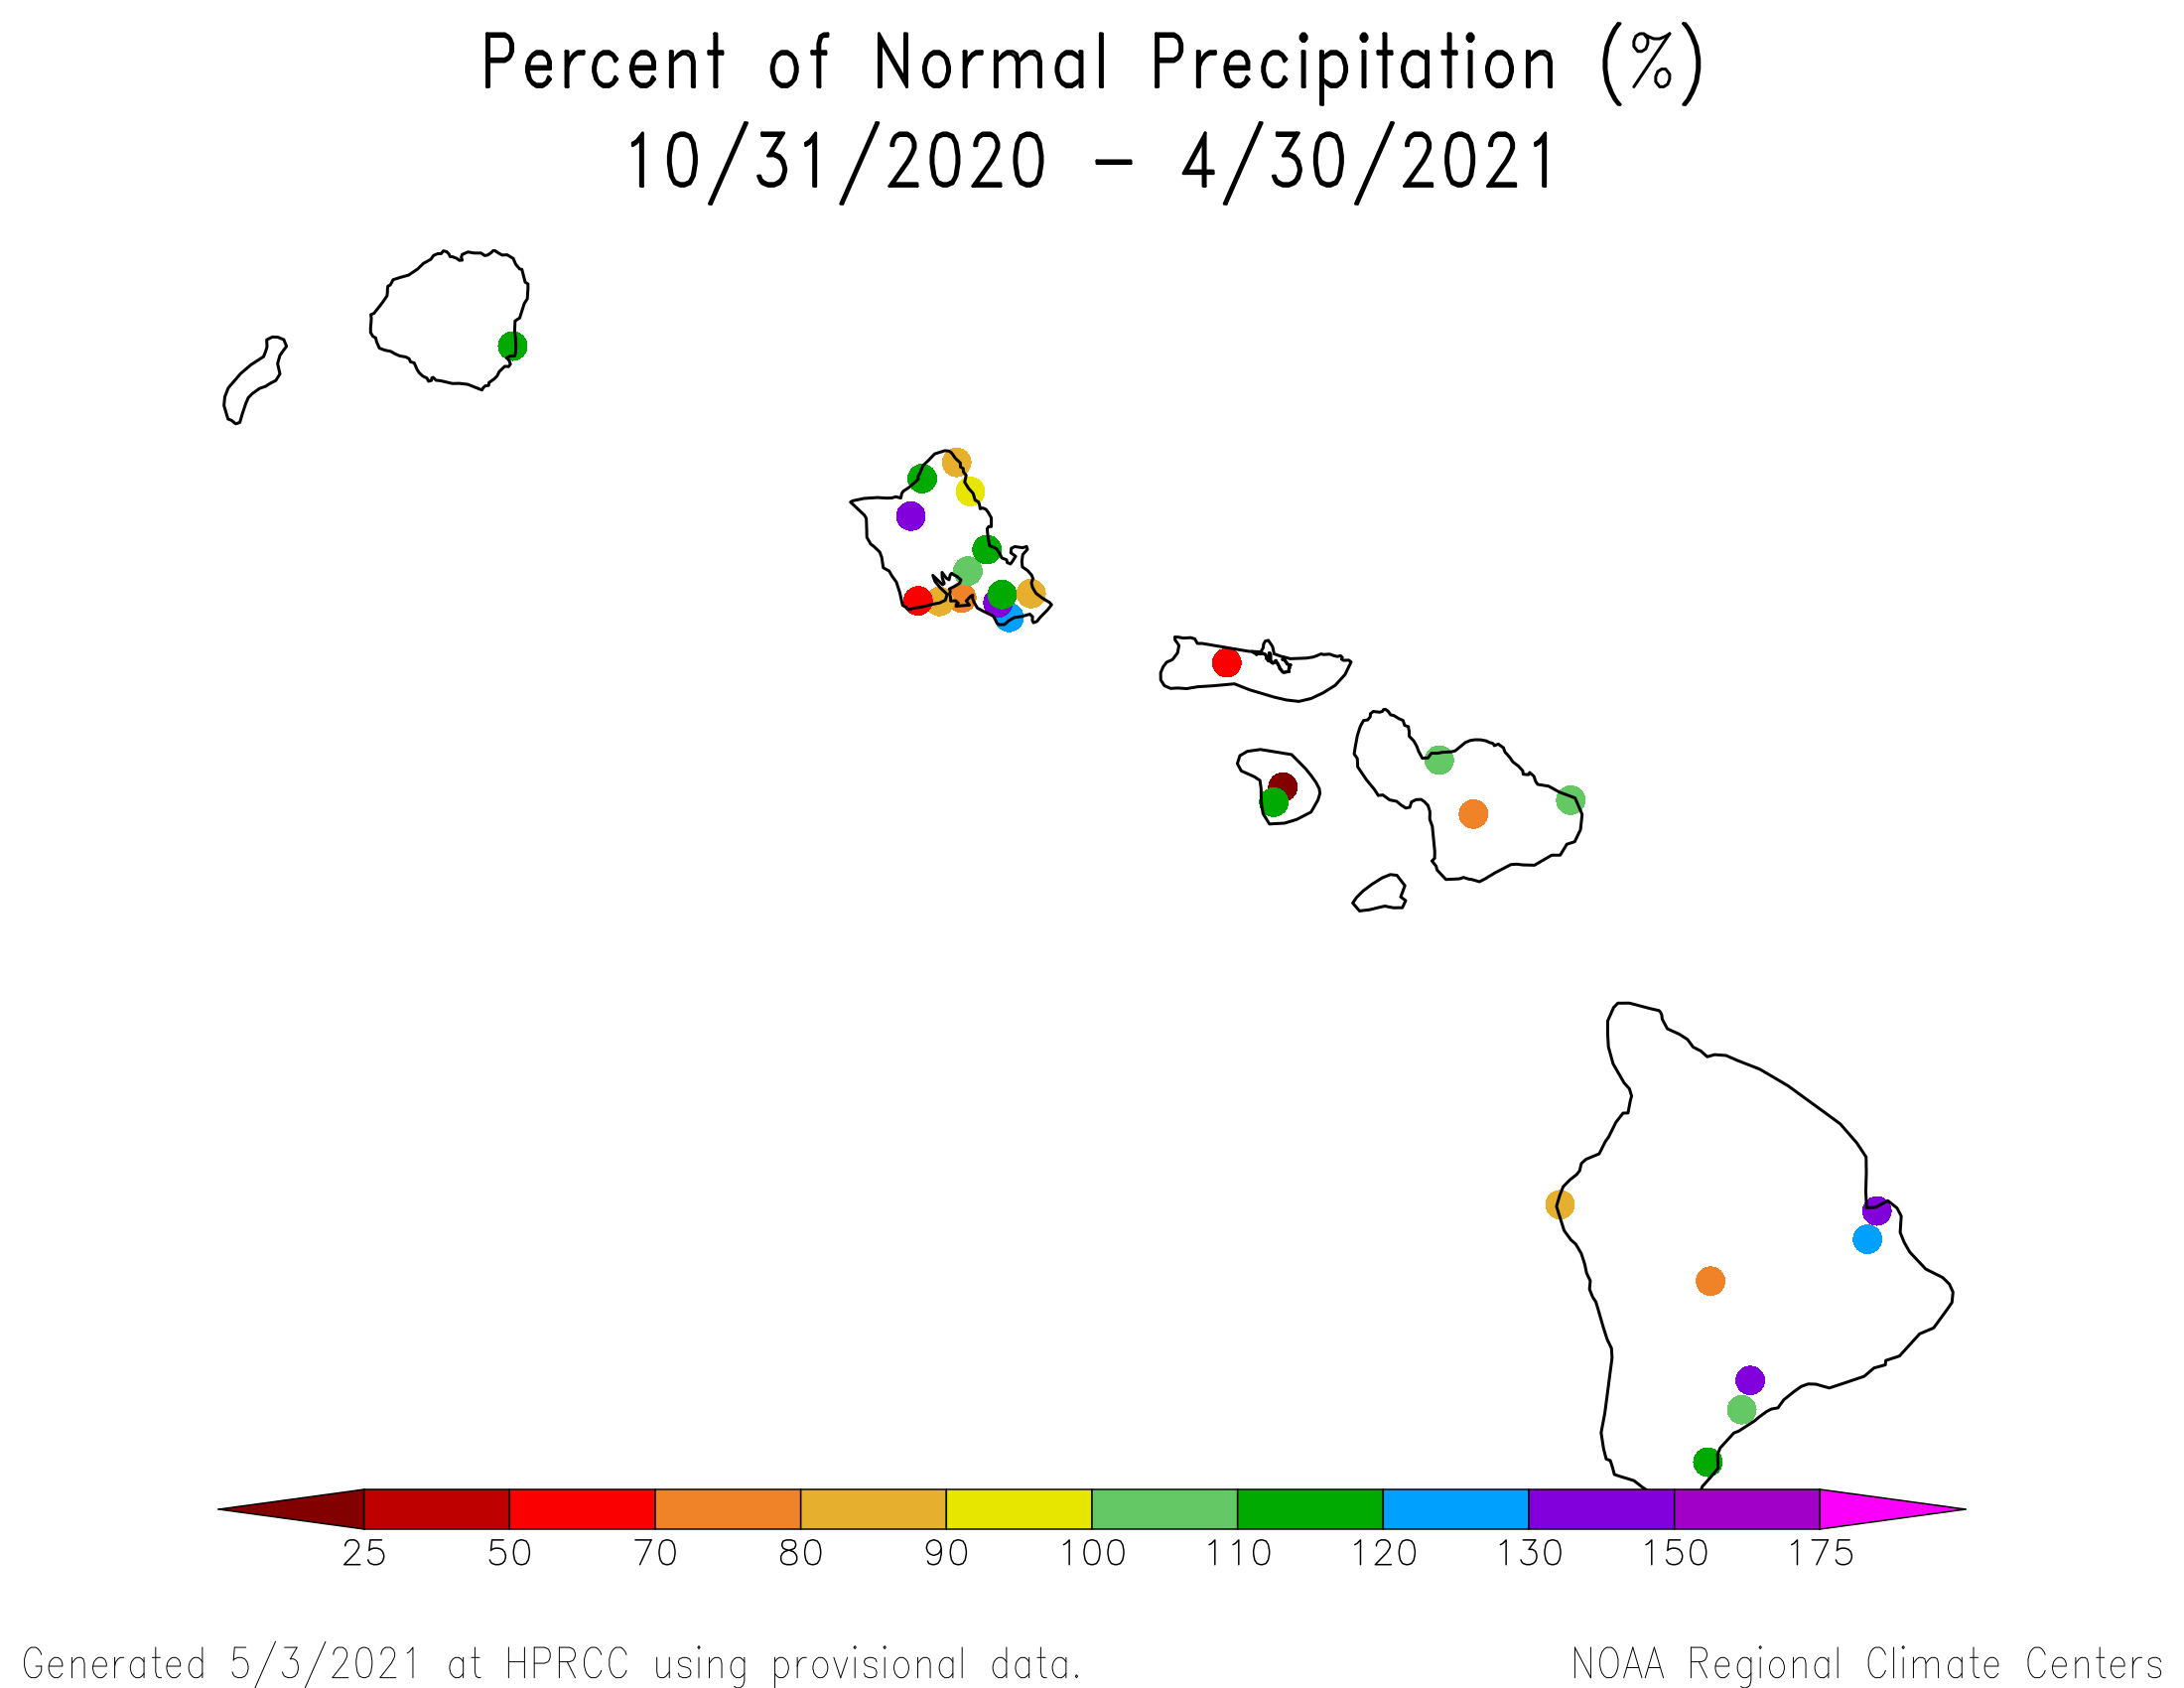
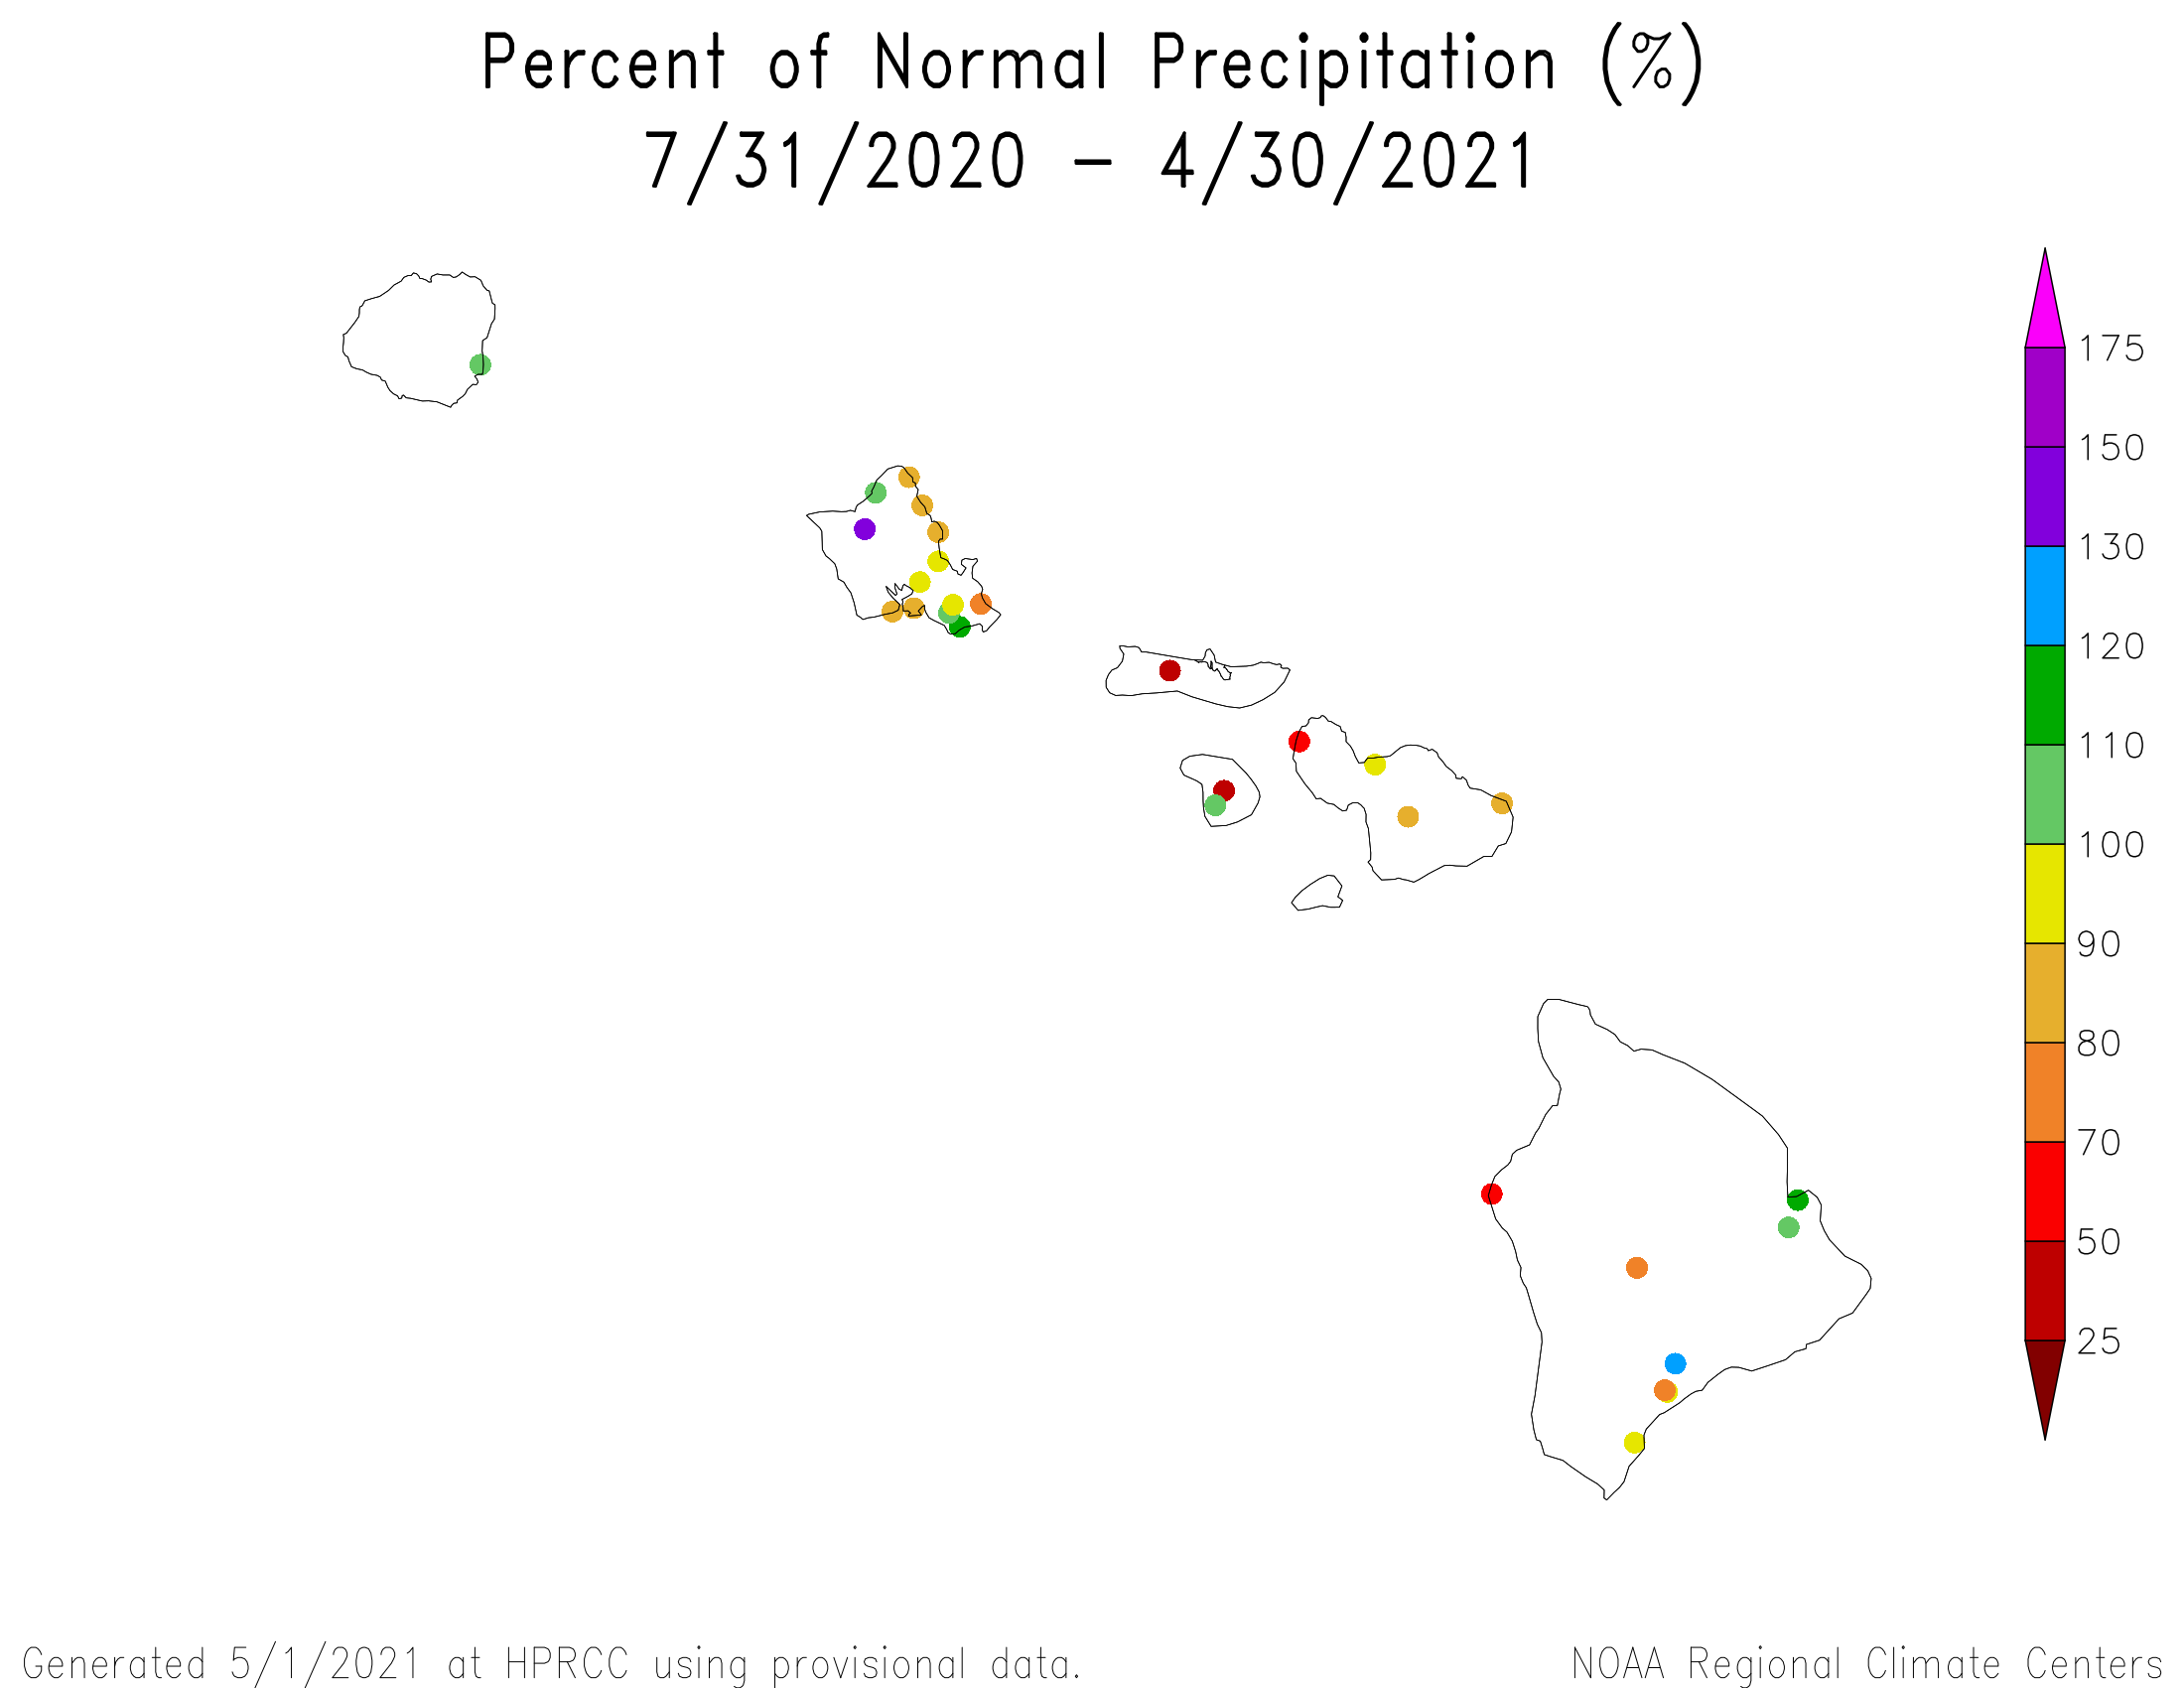
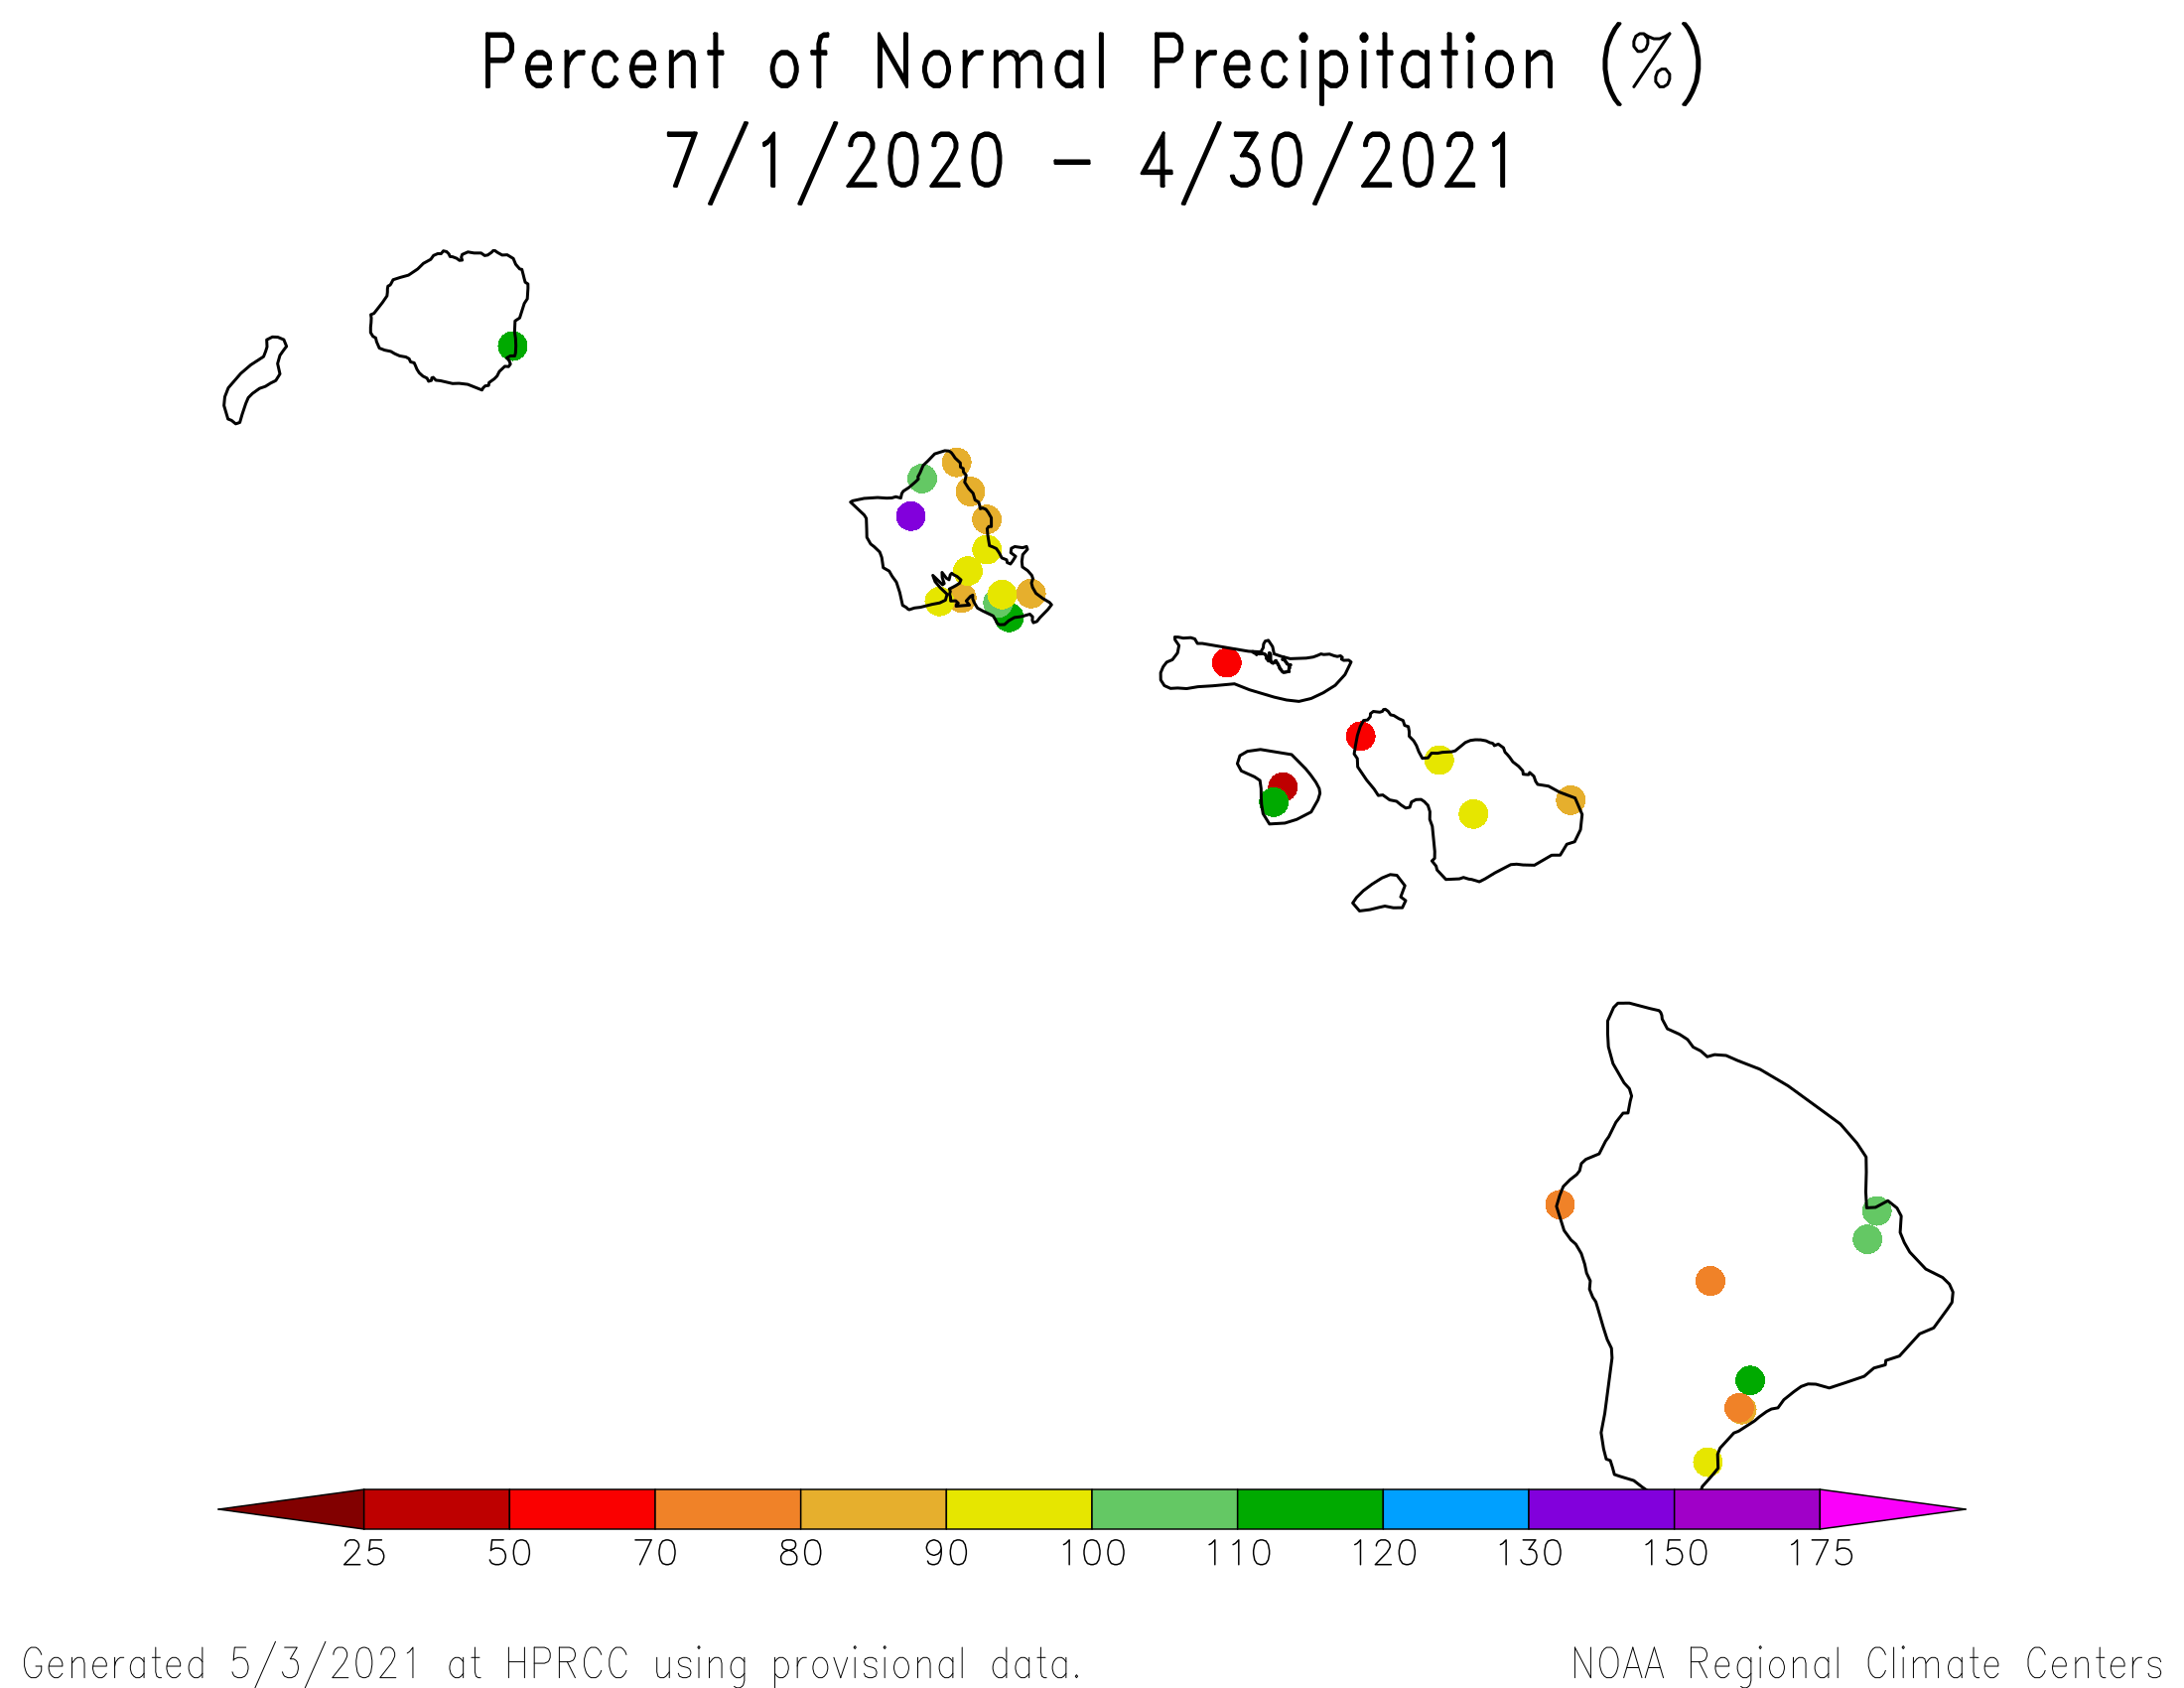
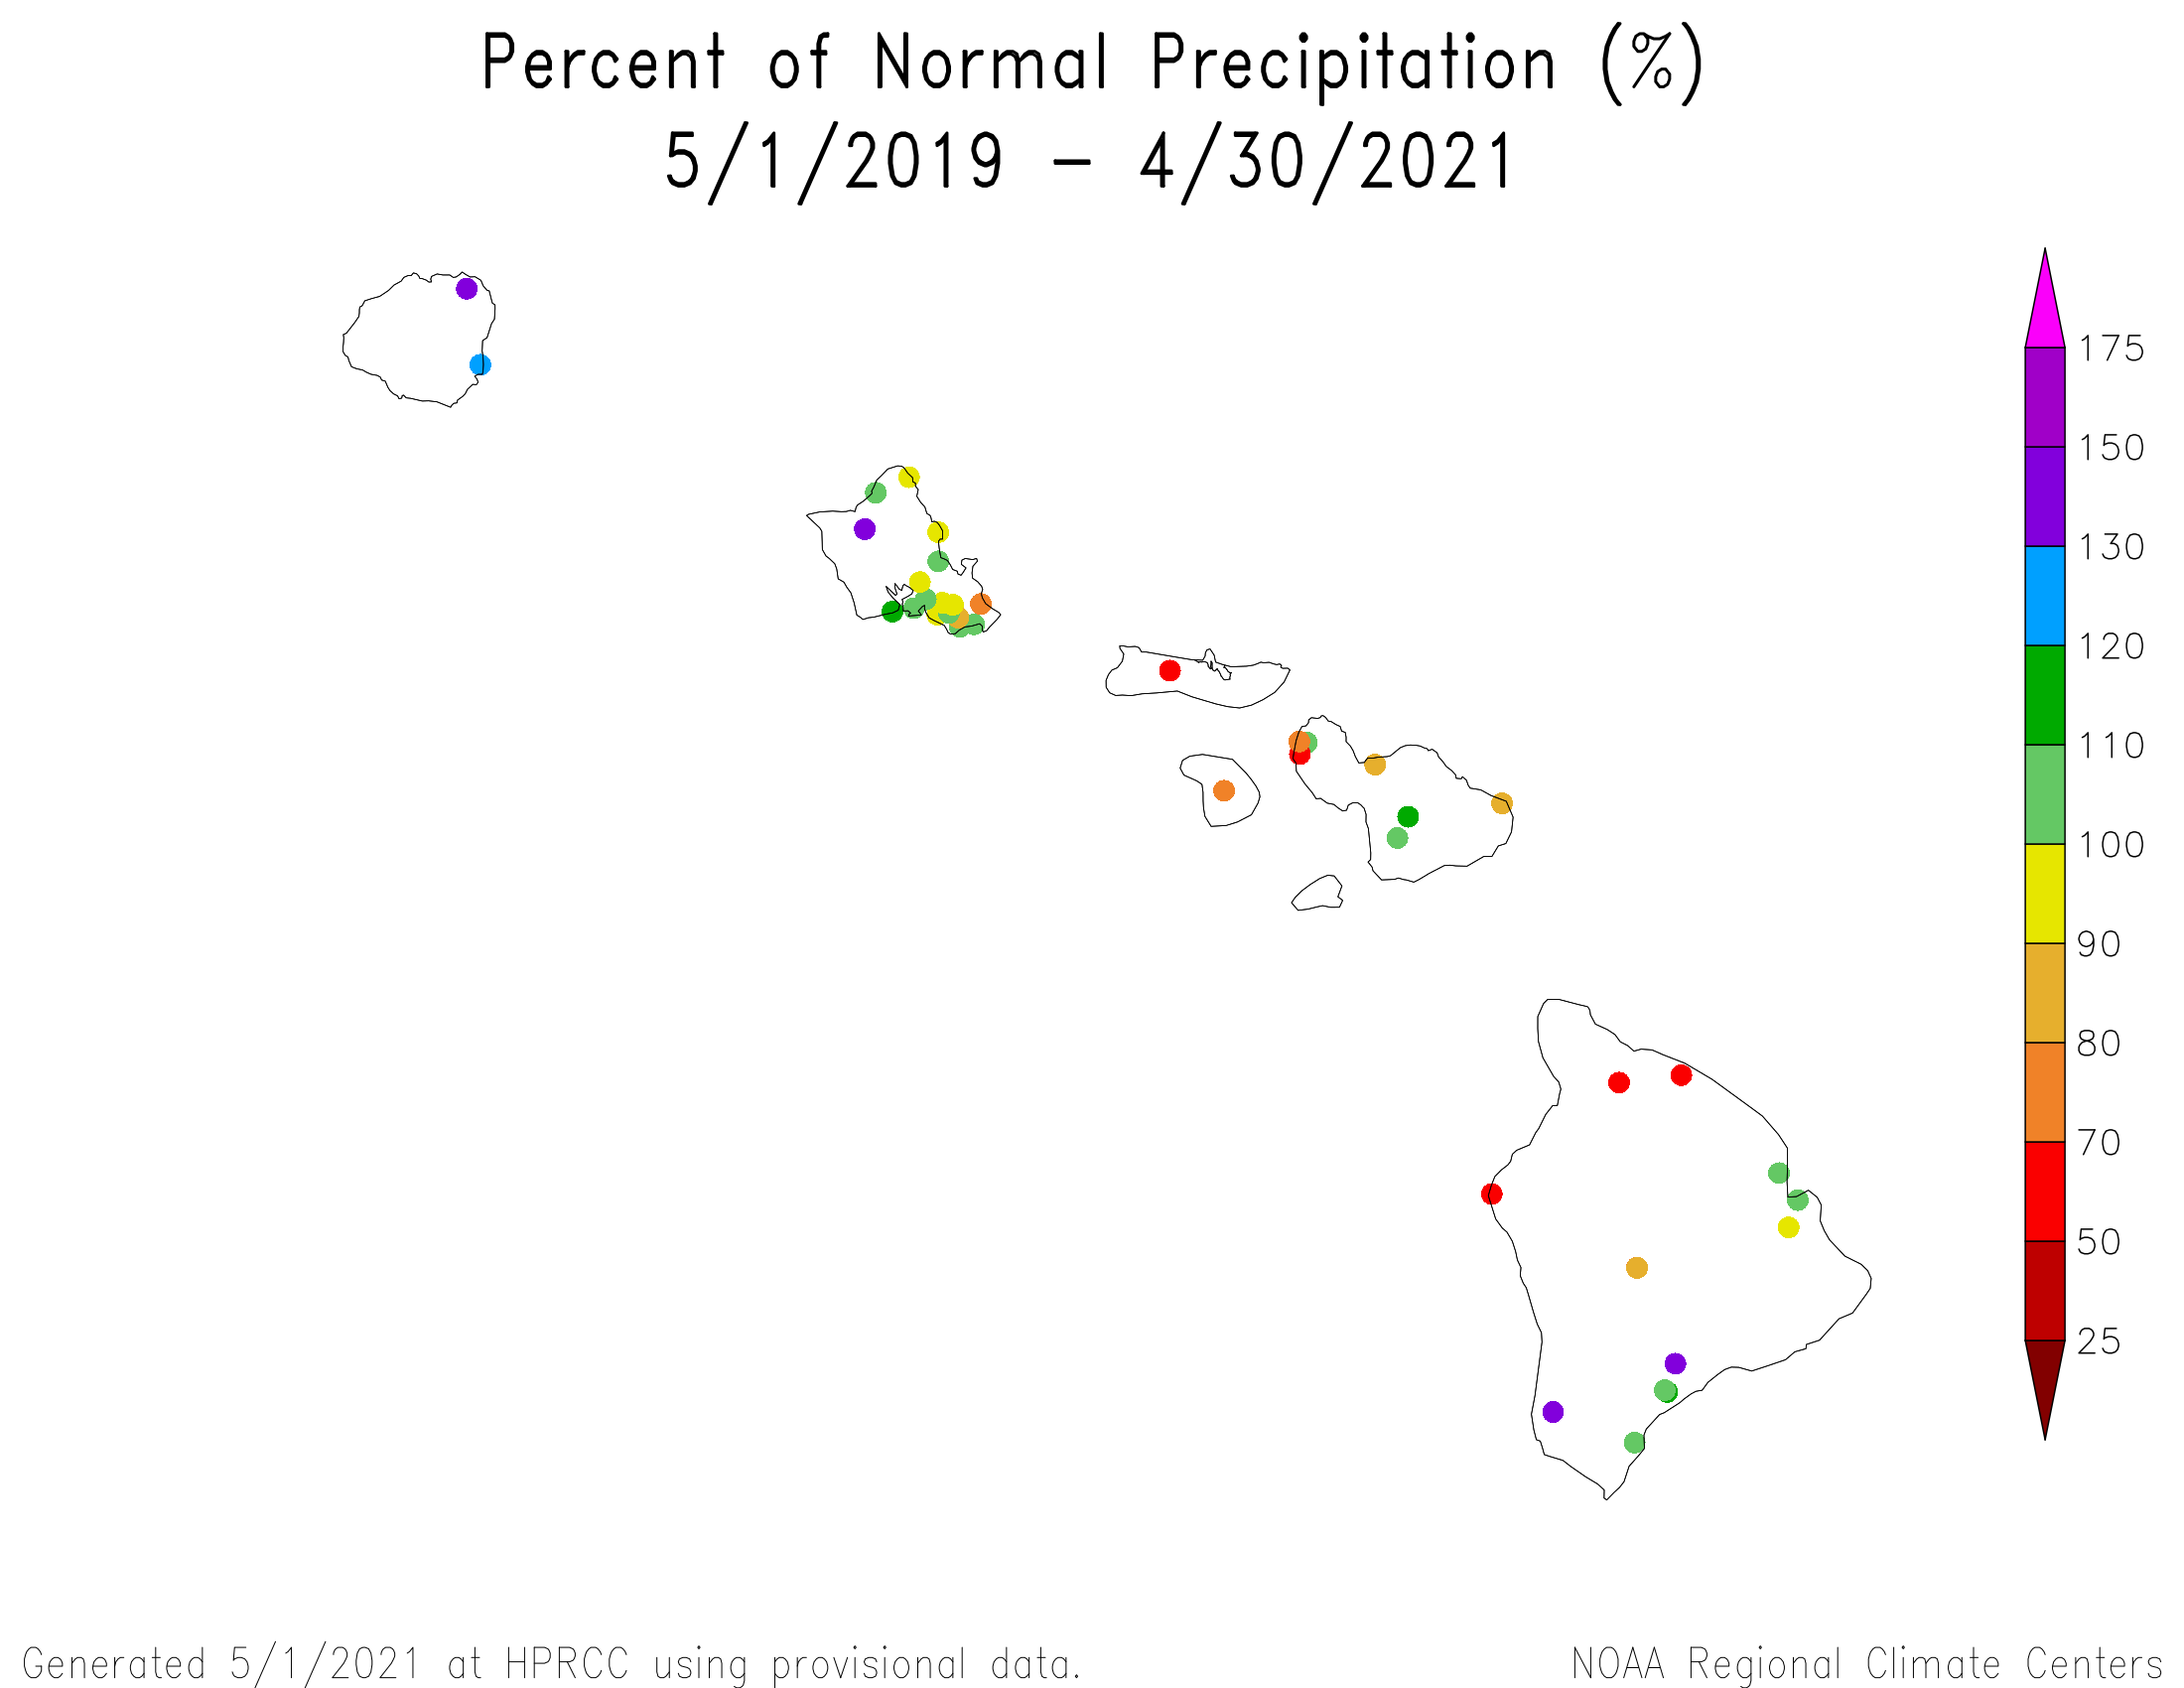
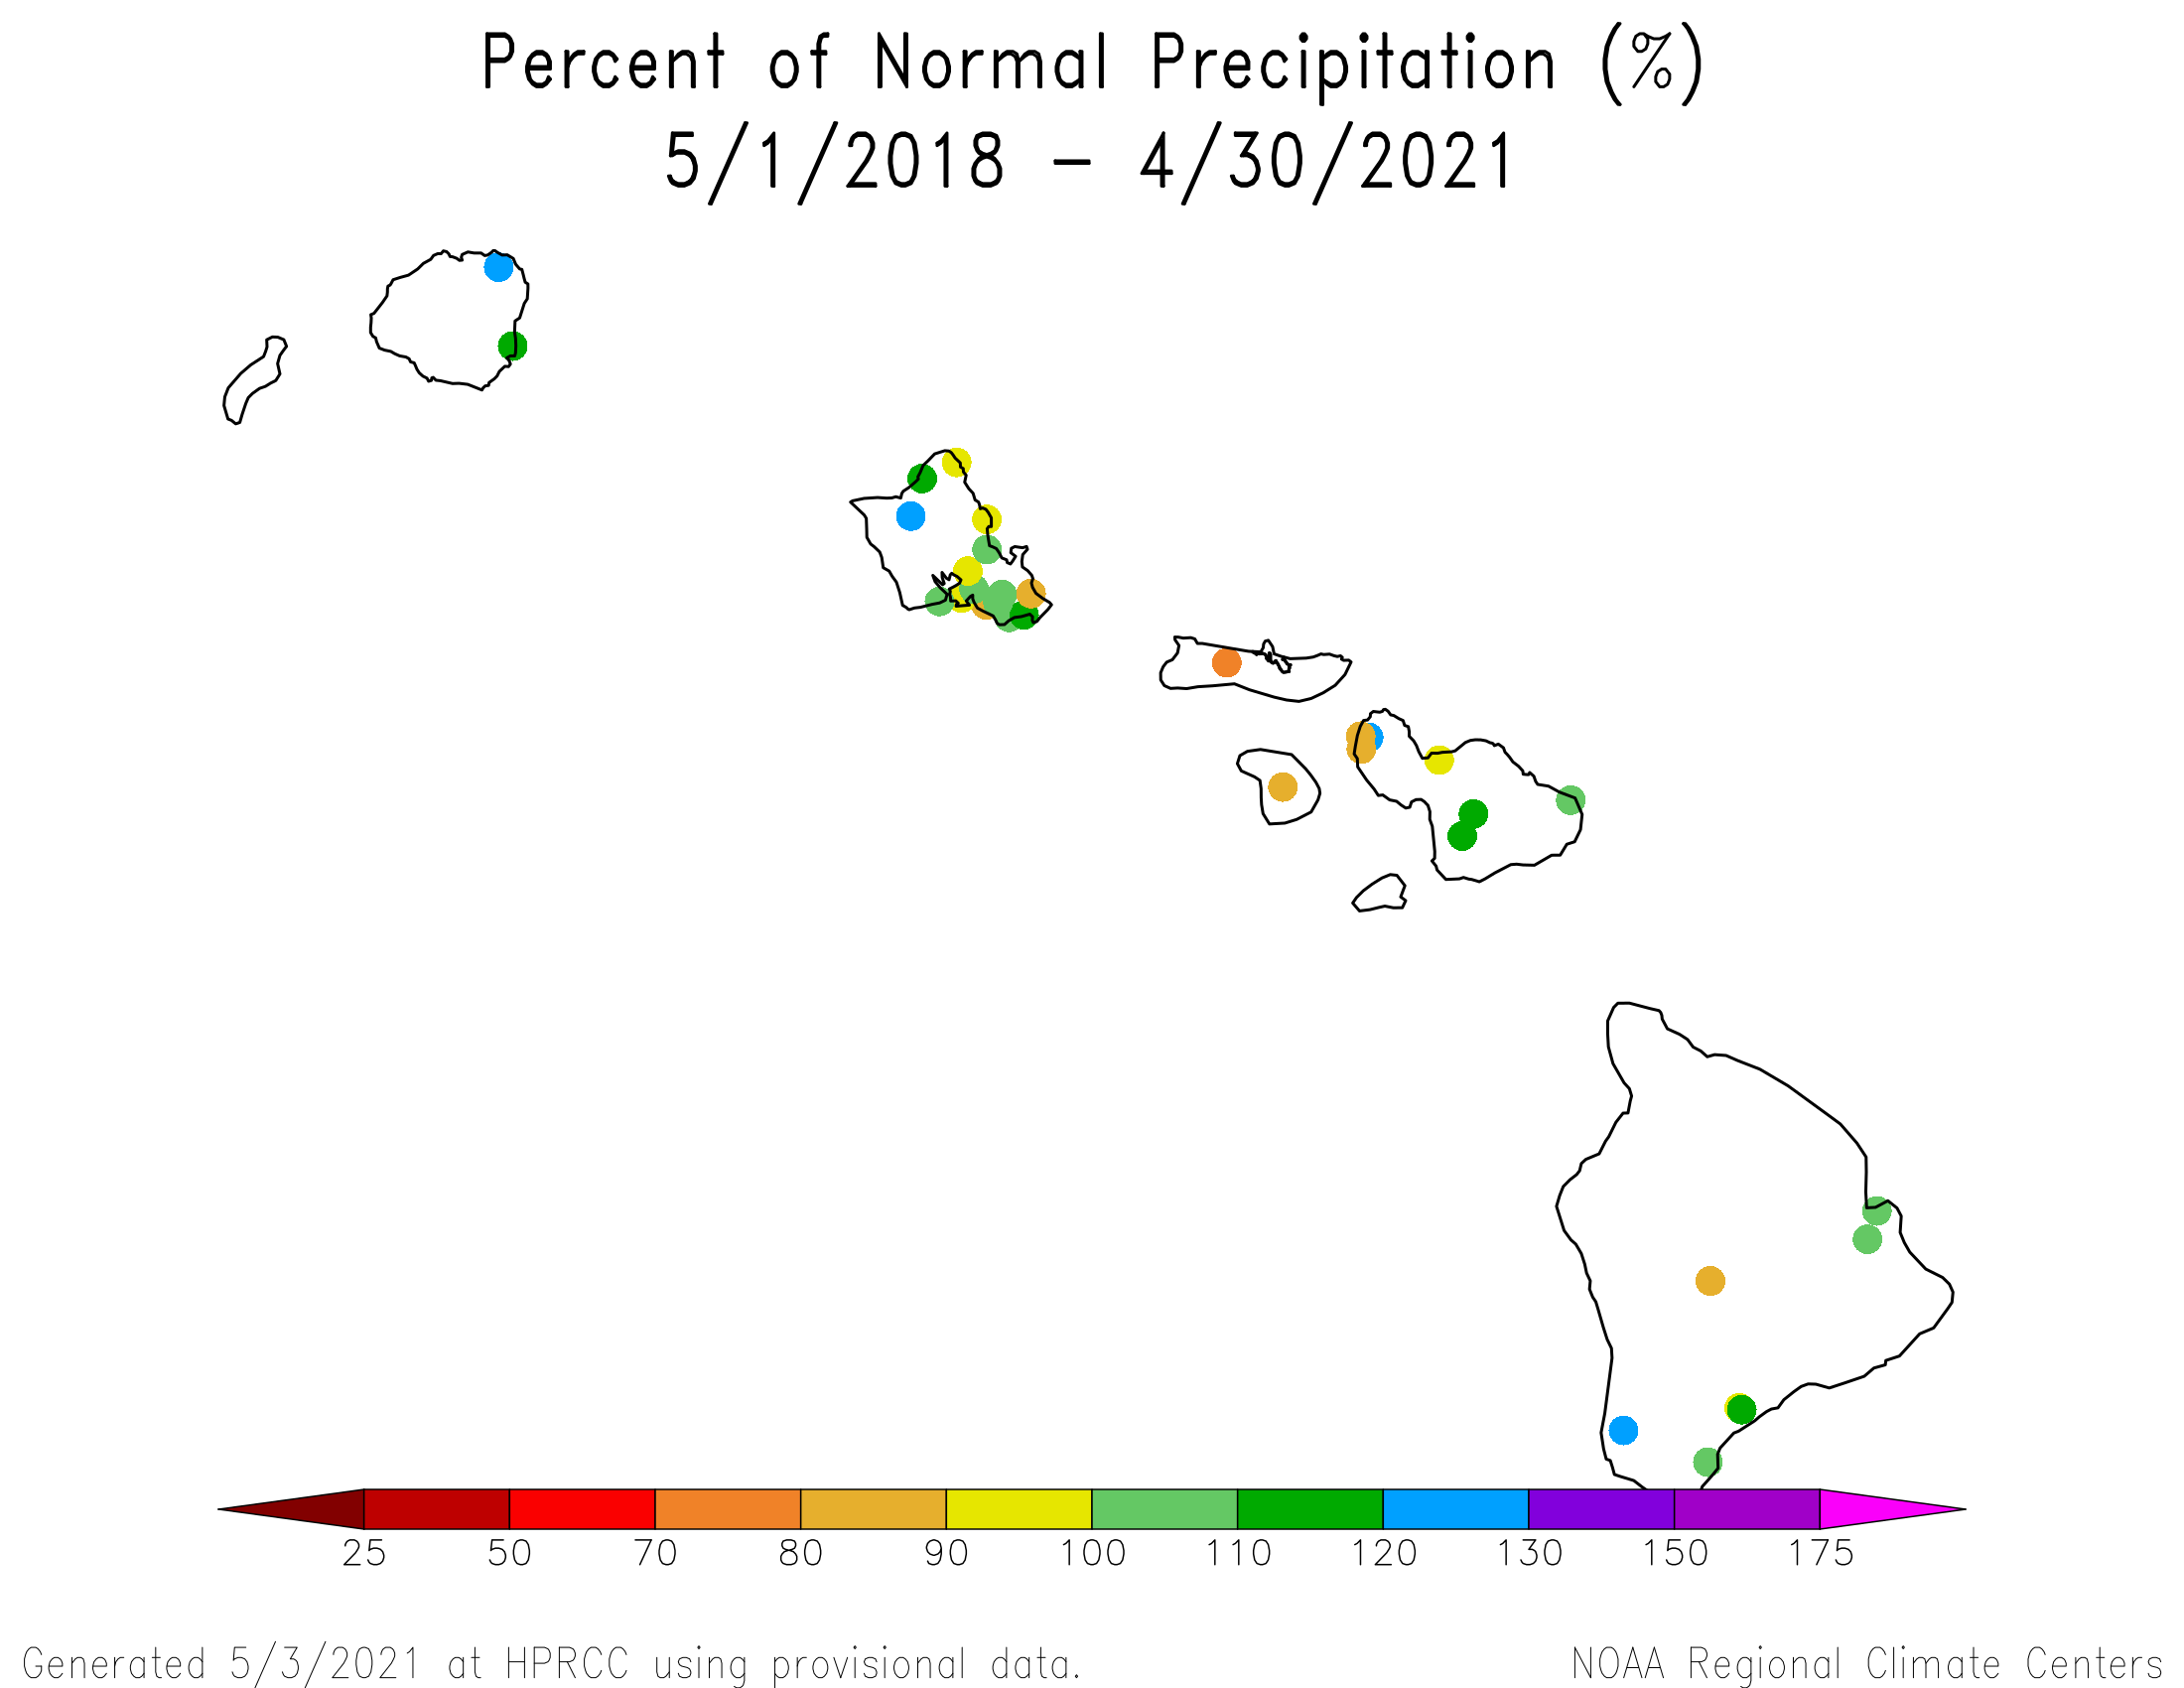
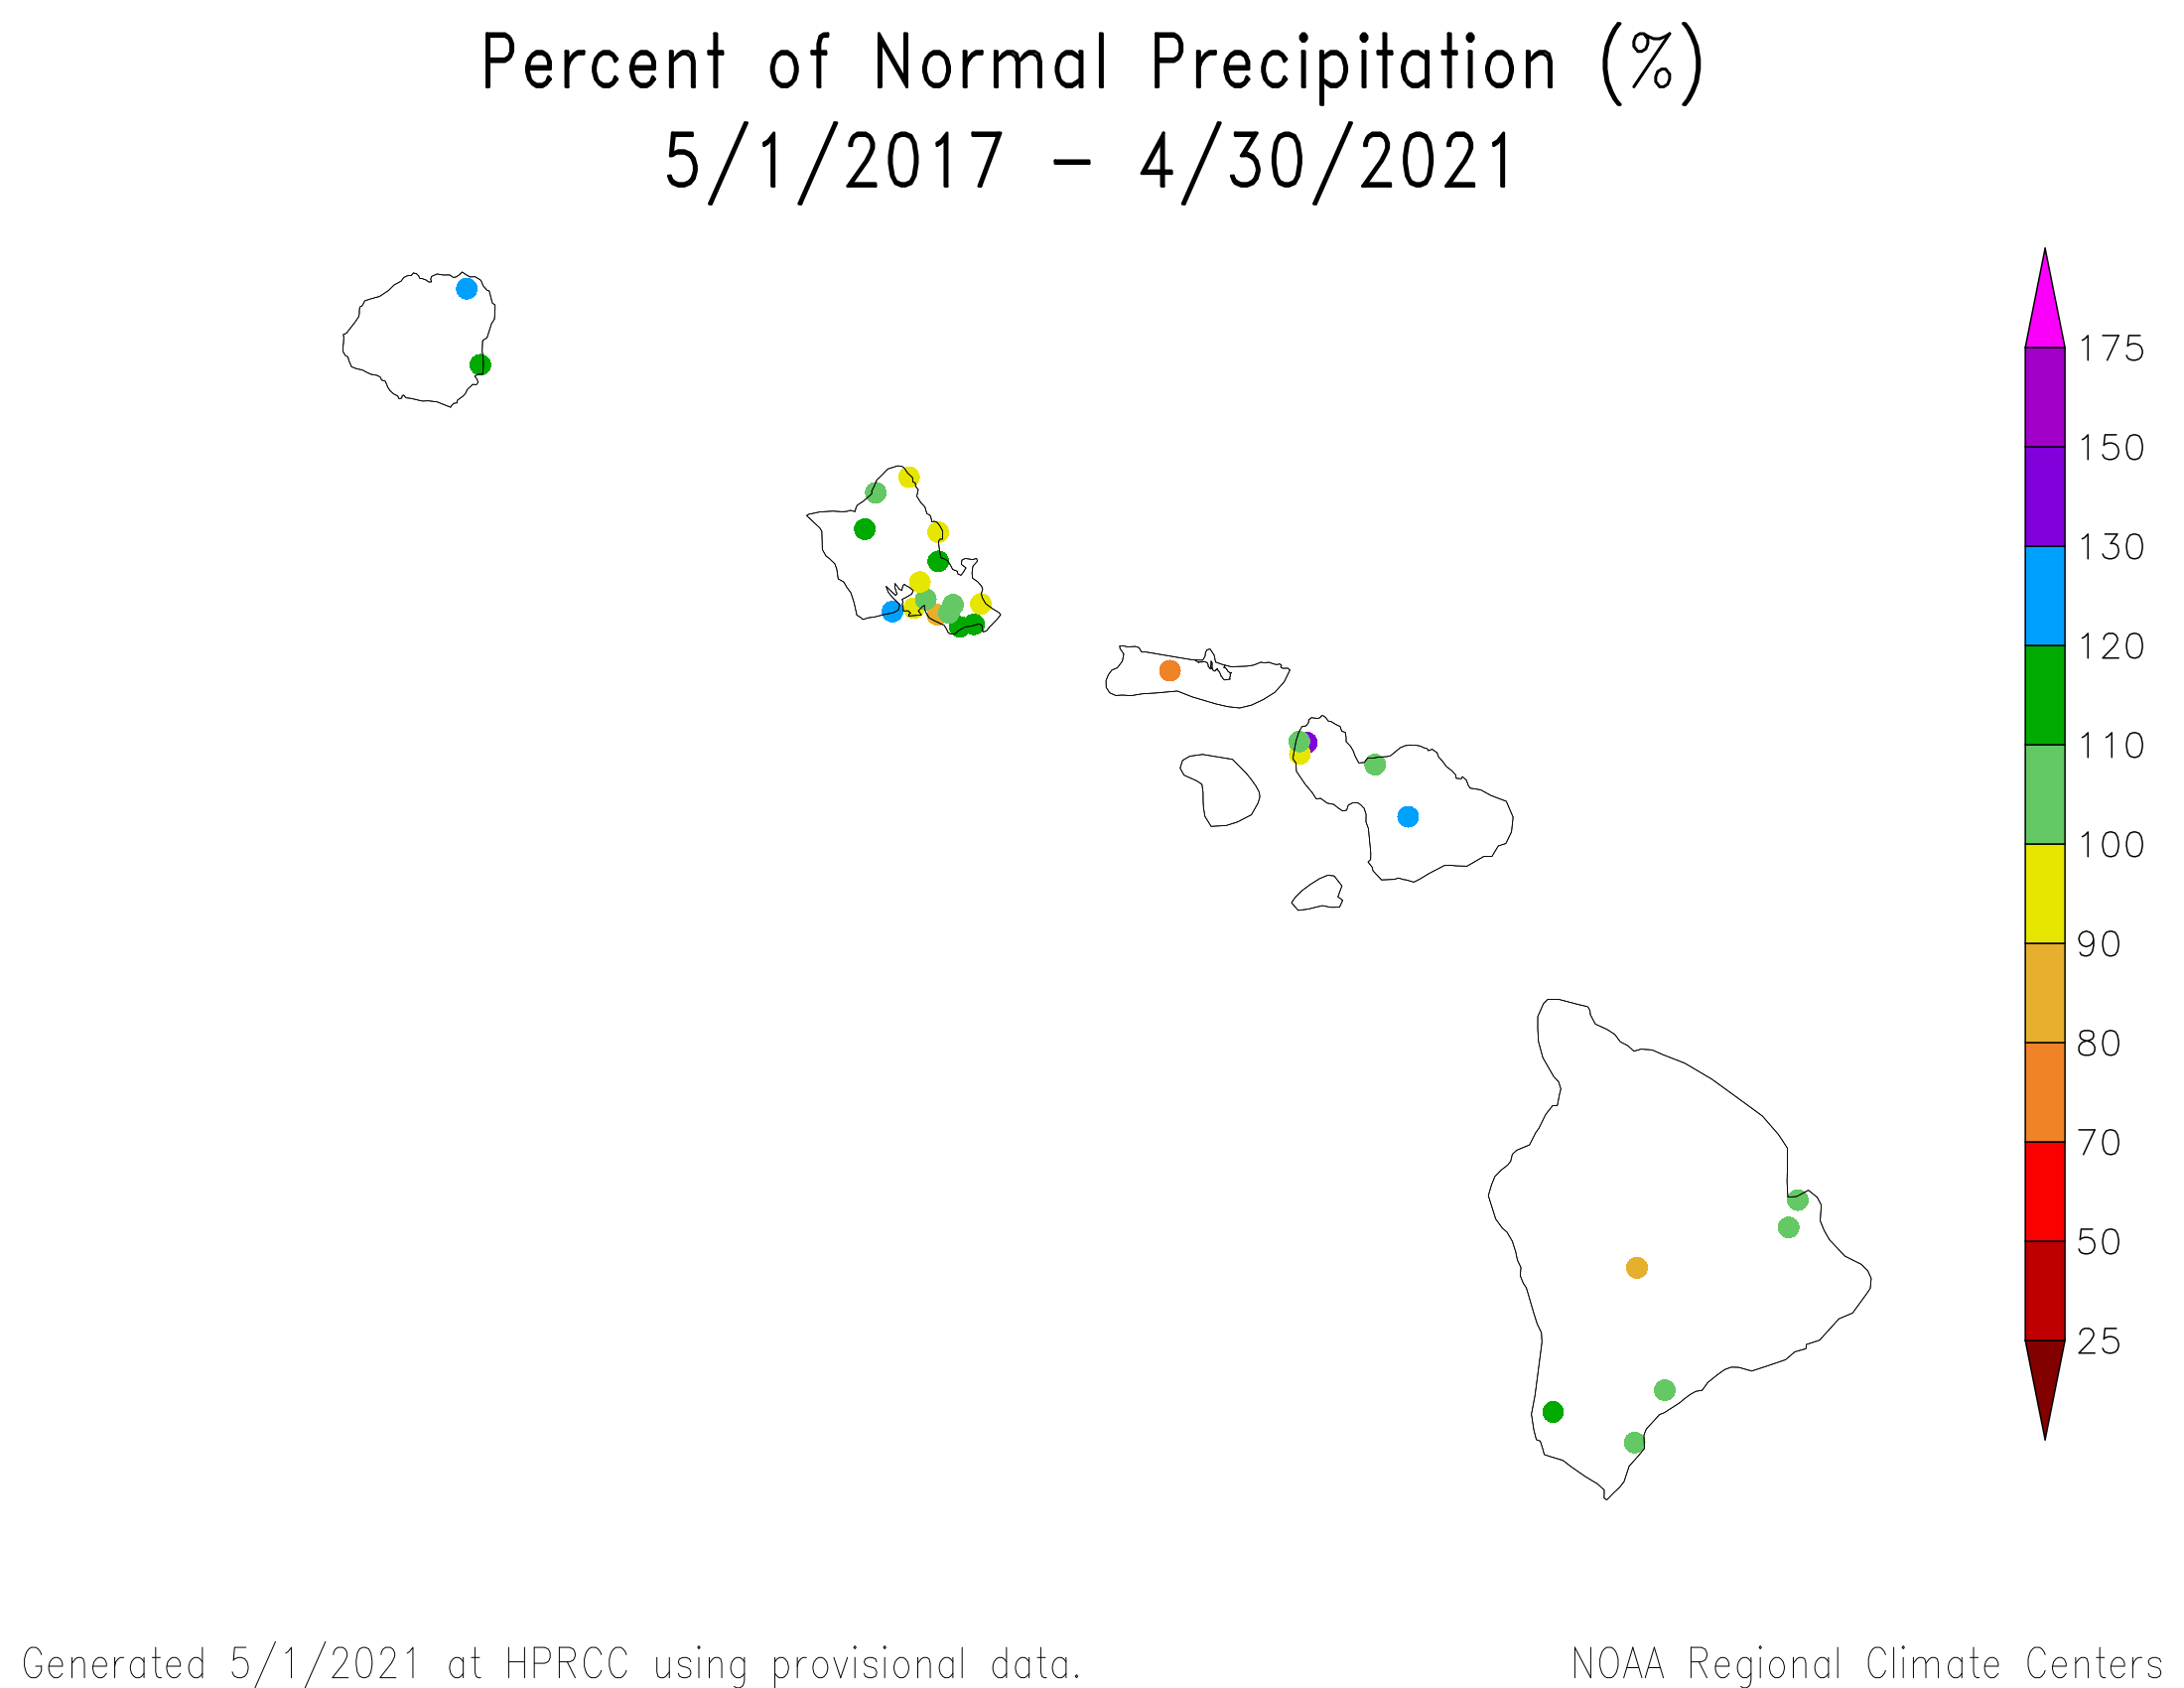
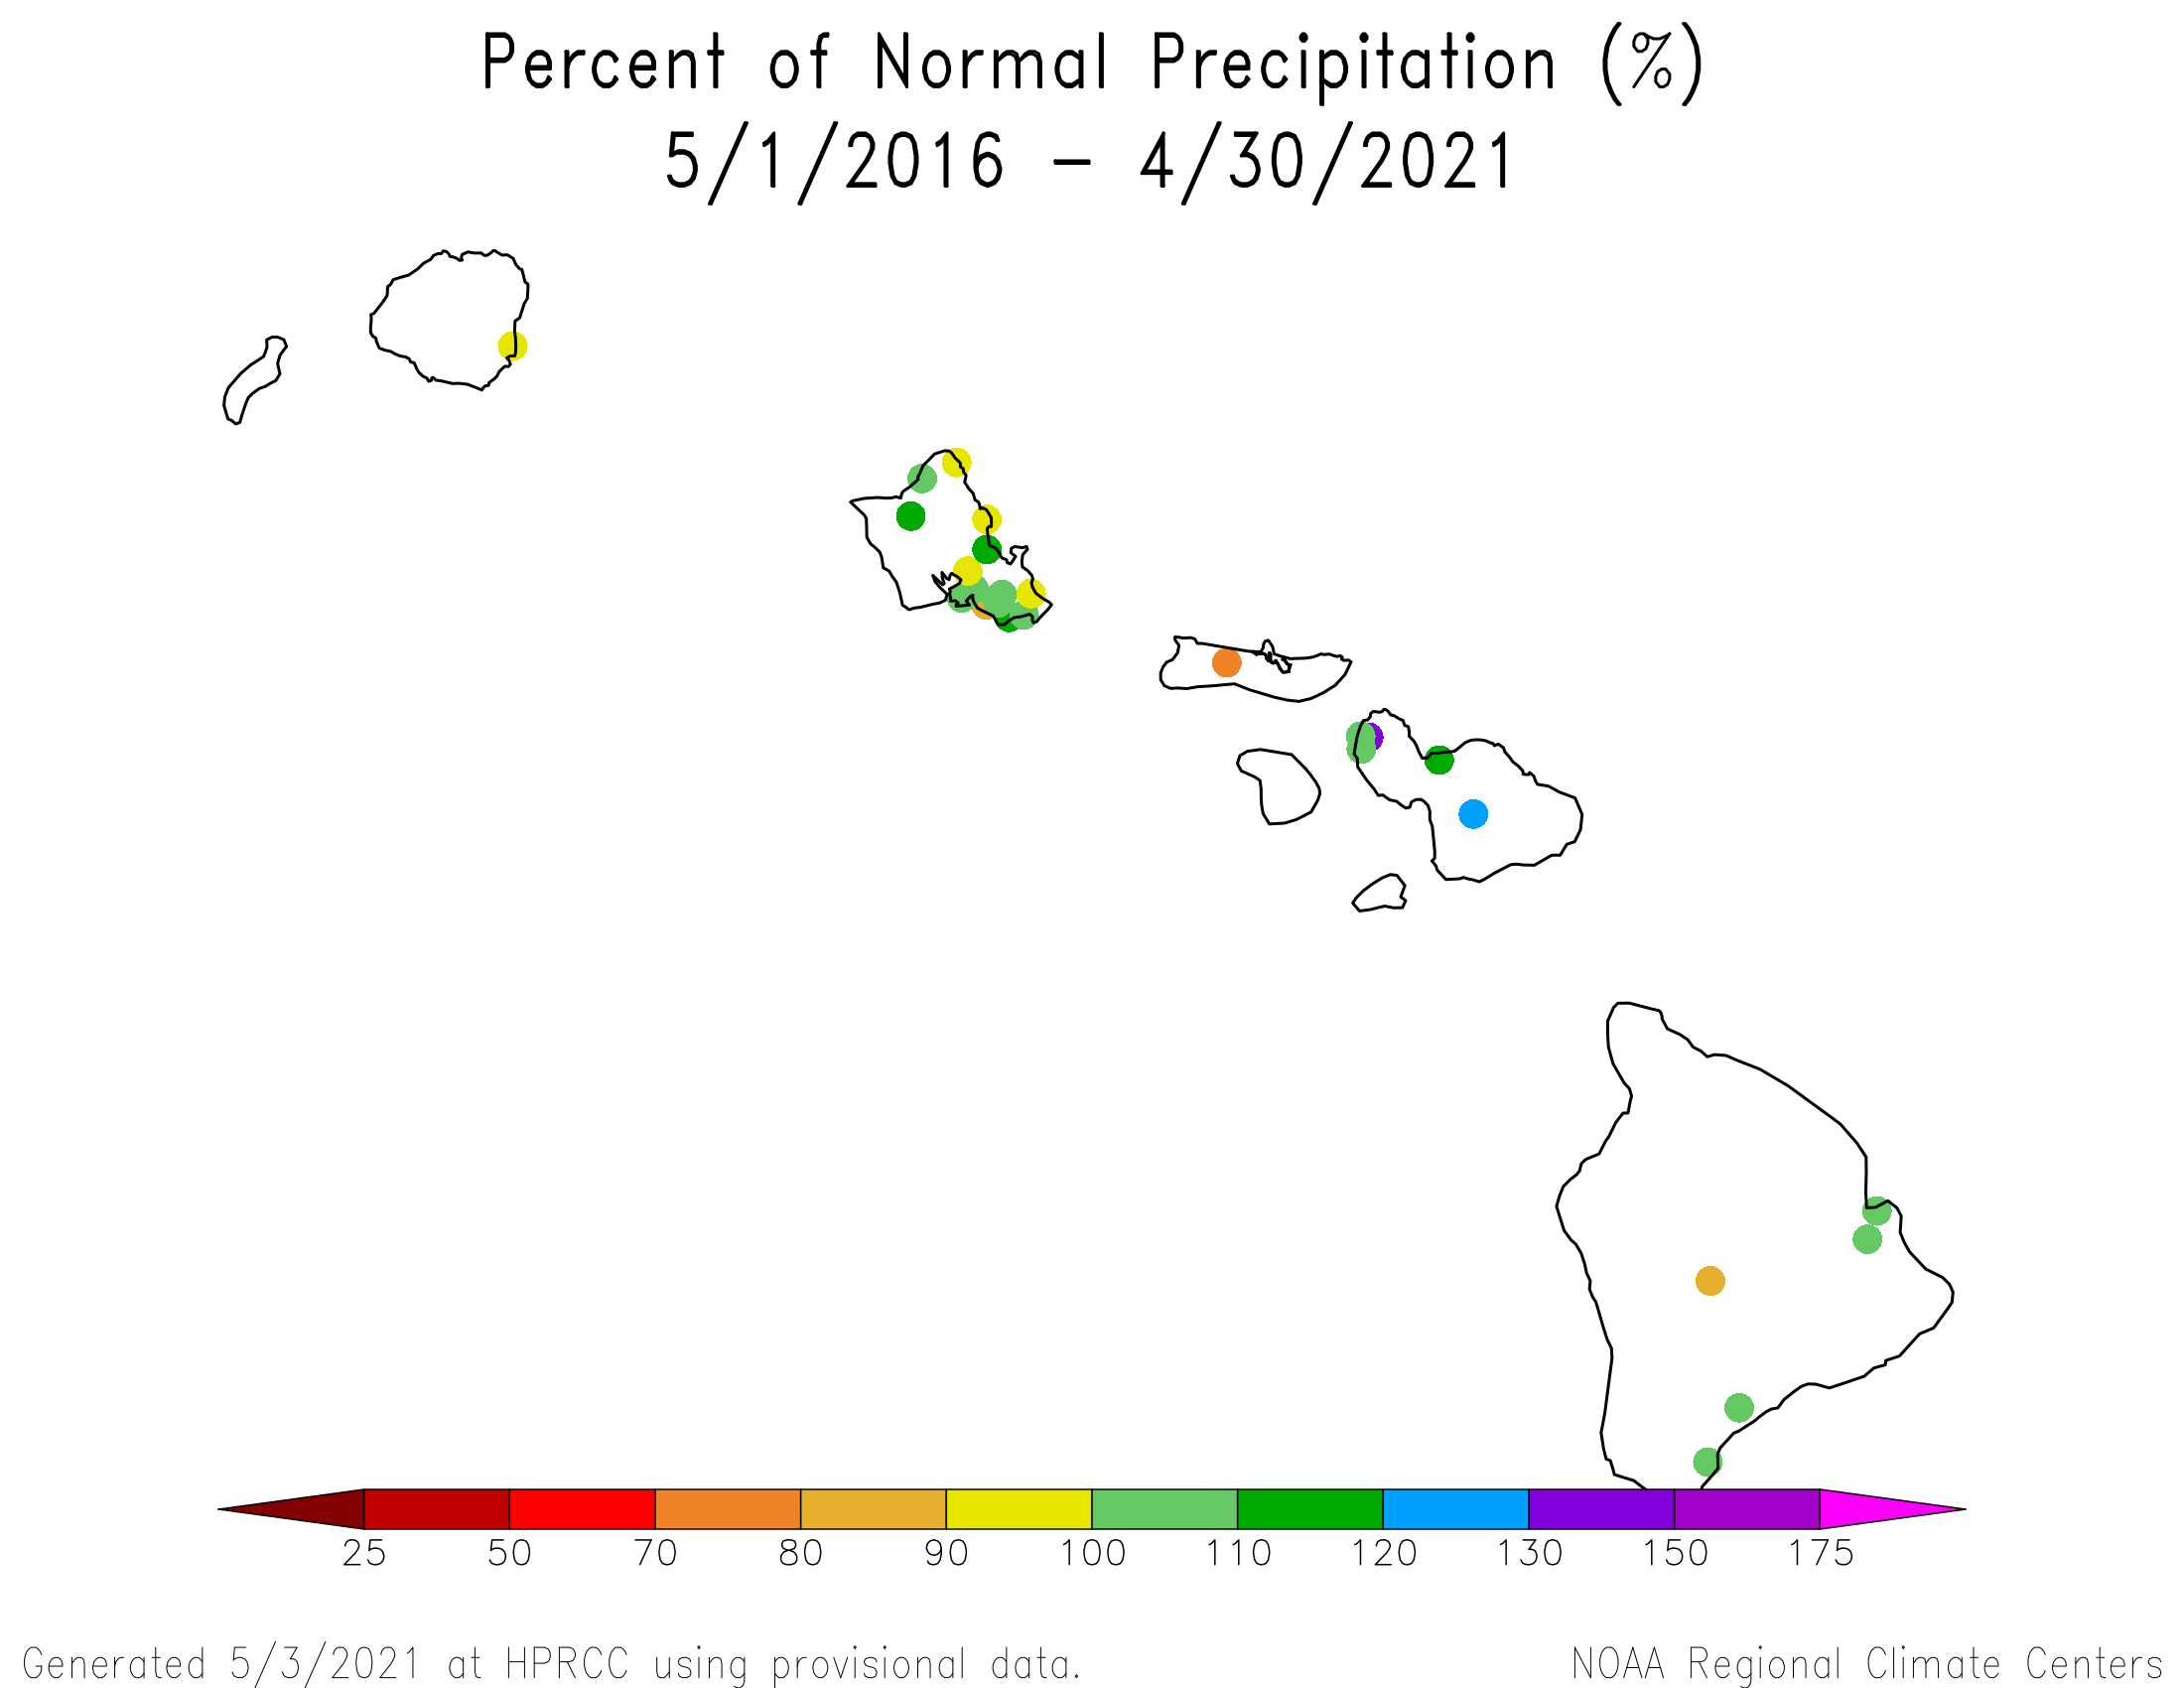
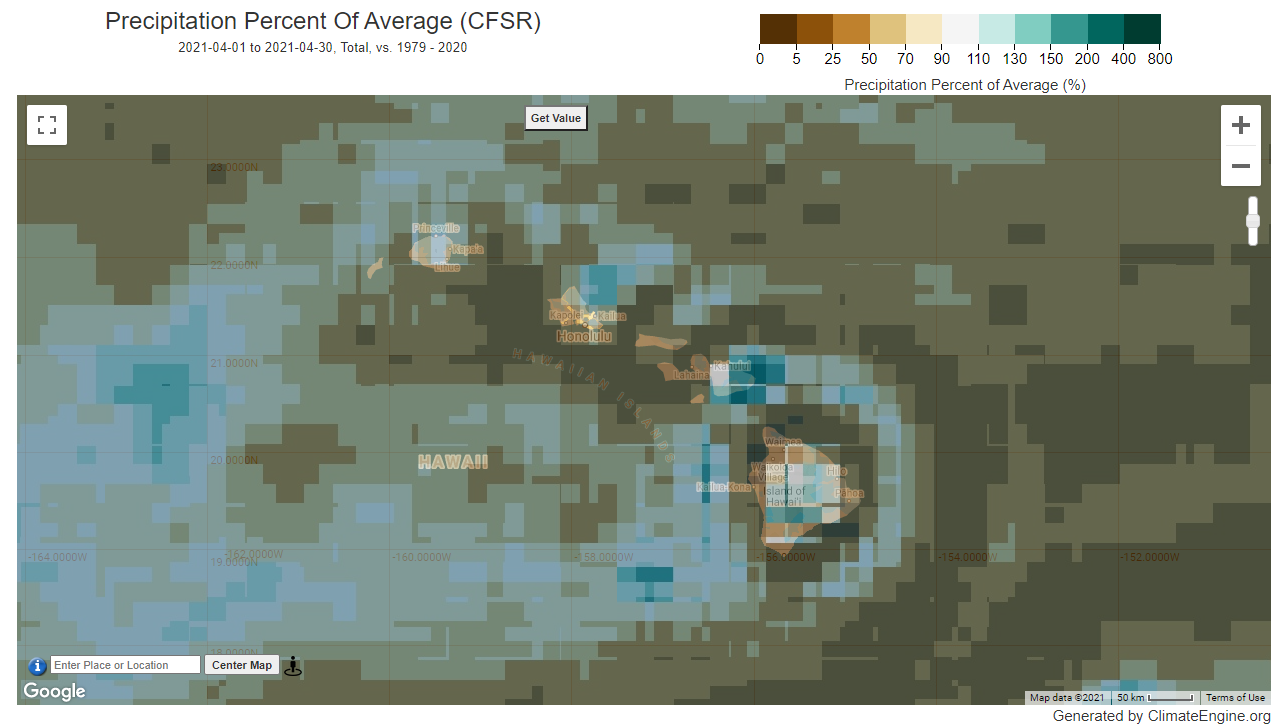
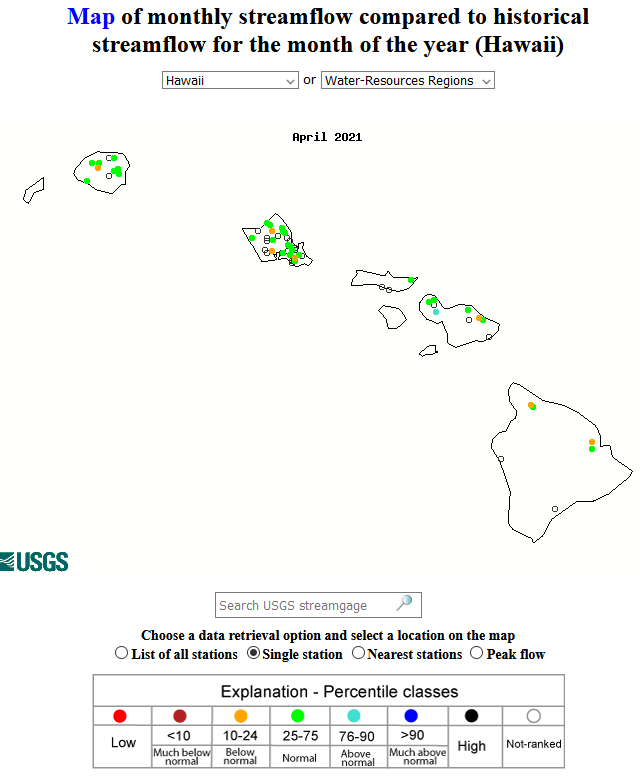
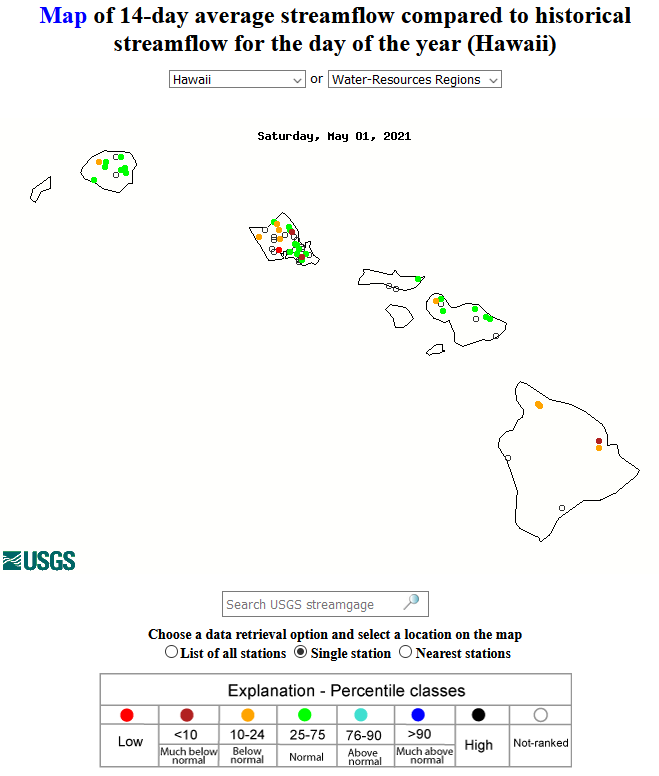
April 2021 was drier than normal across the Hawaiian Islands. But with a wet March, wetter-than-normal conditions dominated at most locations at the 2- to 4-month time scales. A mixed precipitation anomaly pattern was evident at 6 to 7 months, with drier-than-normal conditions widespread at 9 to 12 months, then basically mixed again at longer time scales (last 1, 2, 3, 4, 6, 7, 9, 10, 12, 24, 36, 48, 60 months) (climate engine model percent of normal precipitation map for the last month). Monthly streamflow was near to above normal at most gauges across the islands, although below-normal streamflow was evident at some gauges at the 14-day time scale. With the lack of precipitation this month, moderate drought returned to the Big Island and abnormal dryness spread across most of Hawaii on the April 27th USDM map.
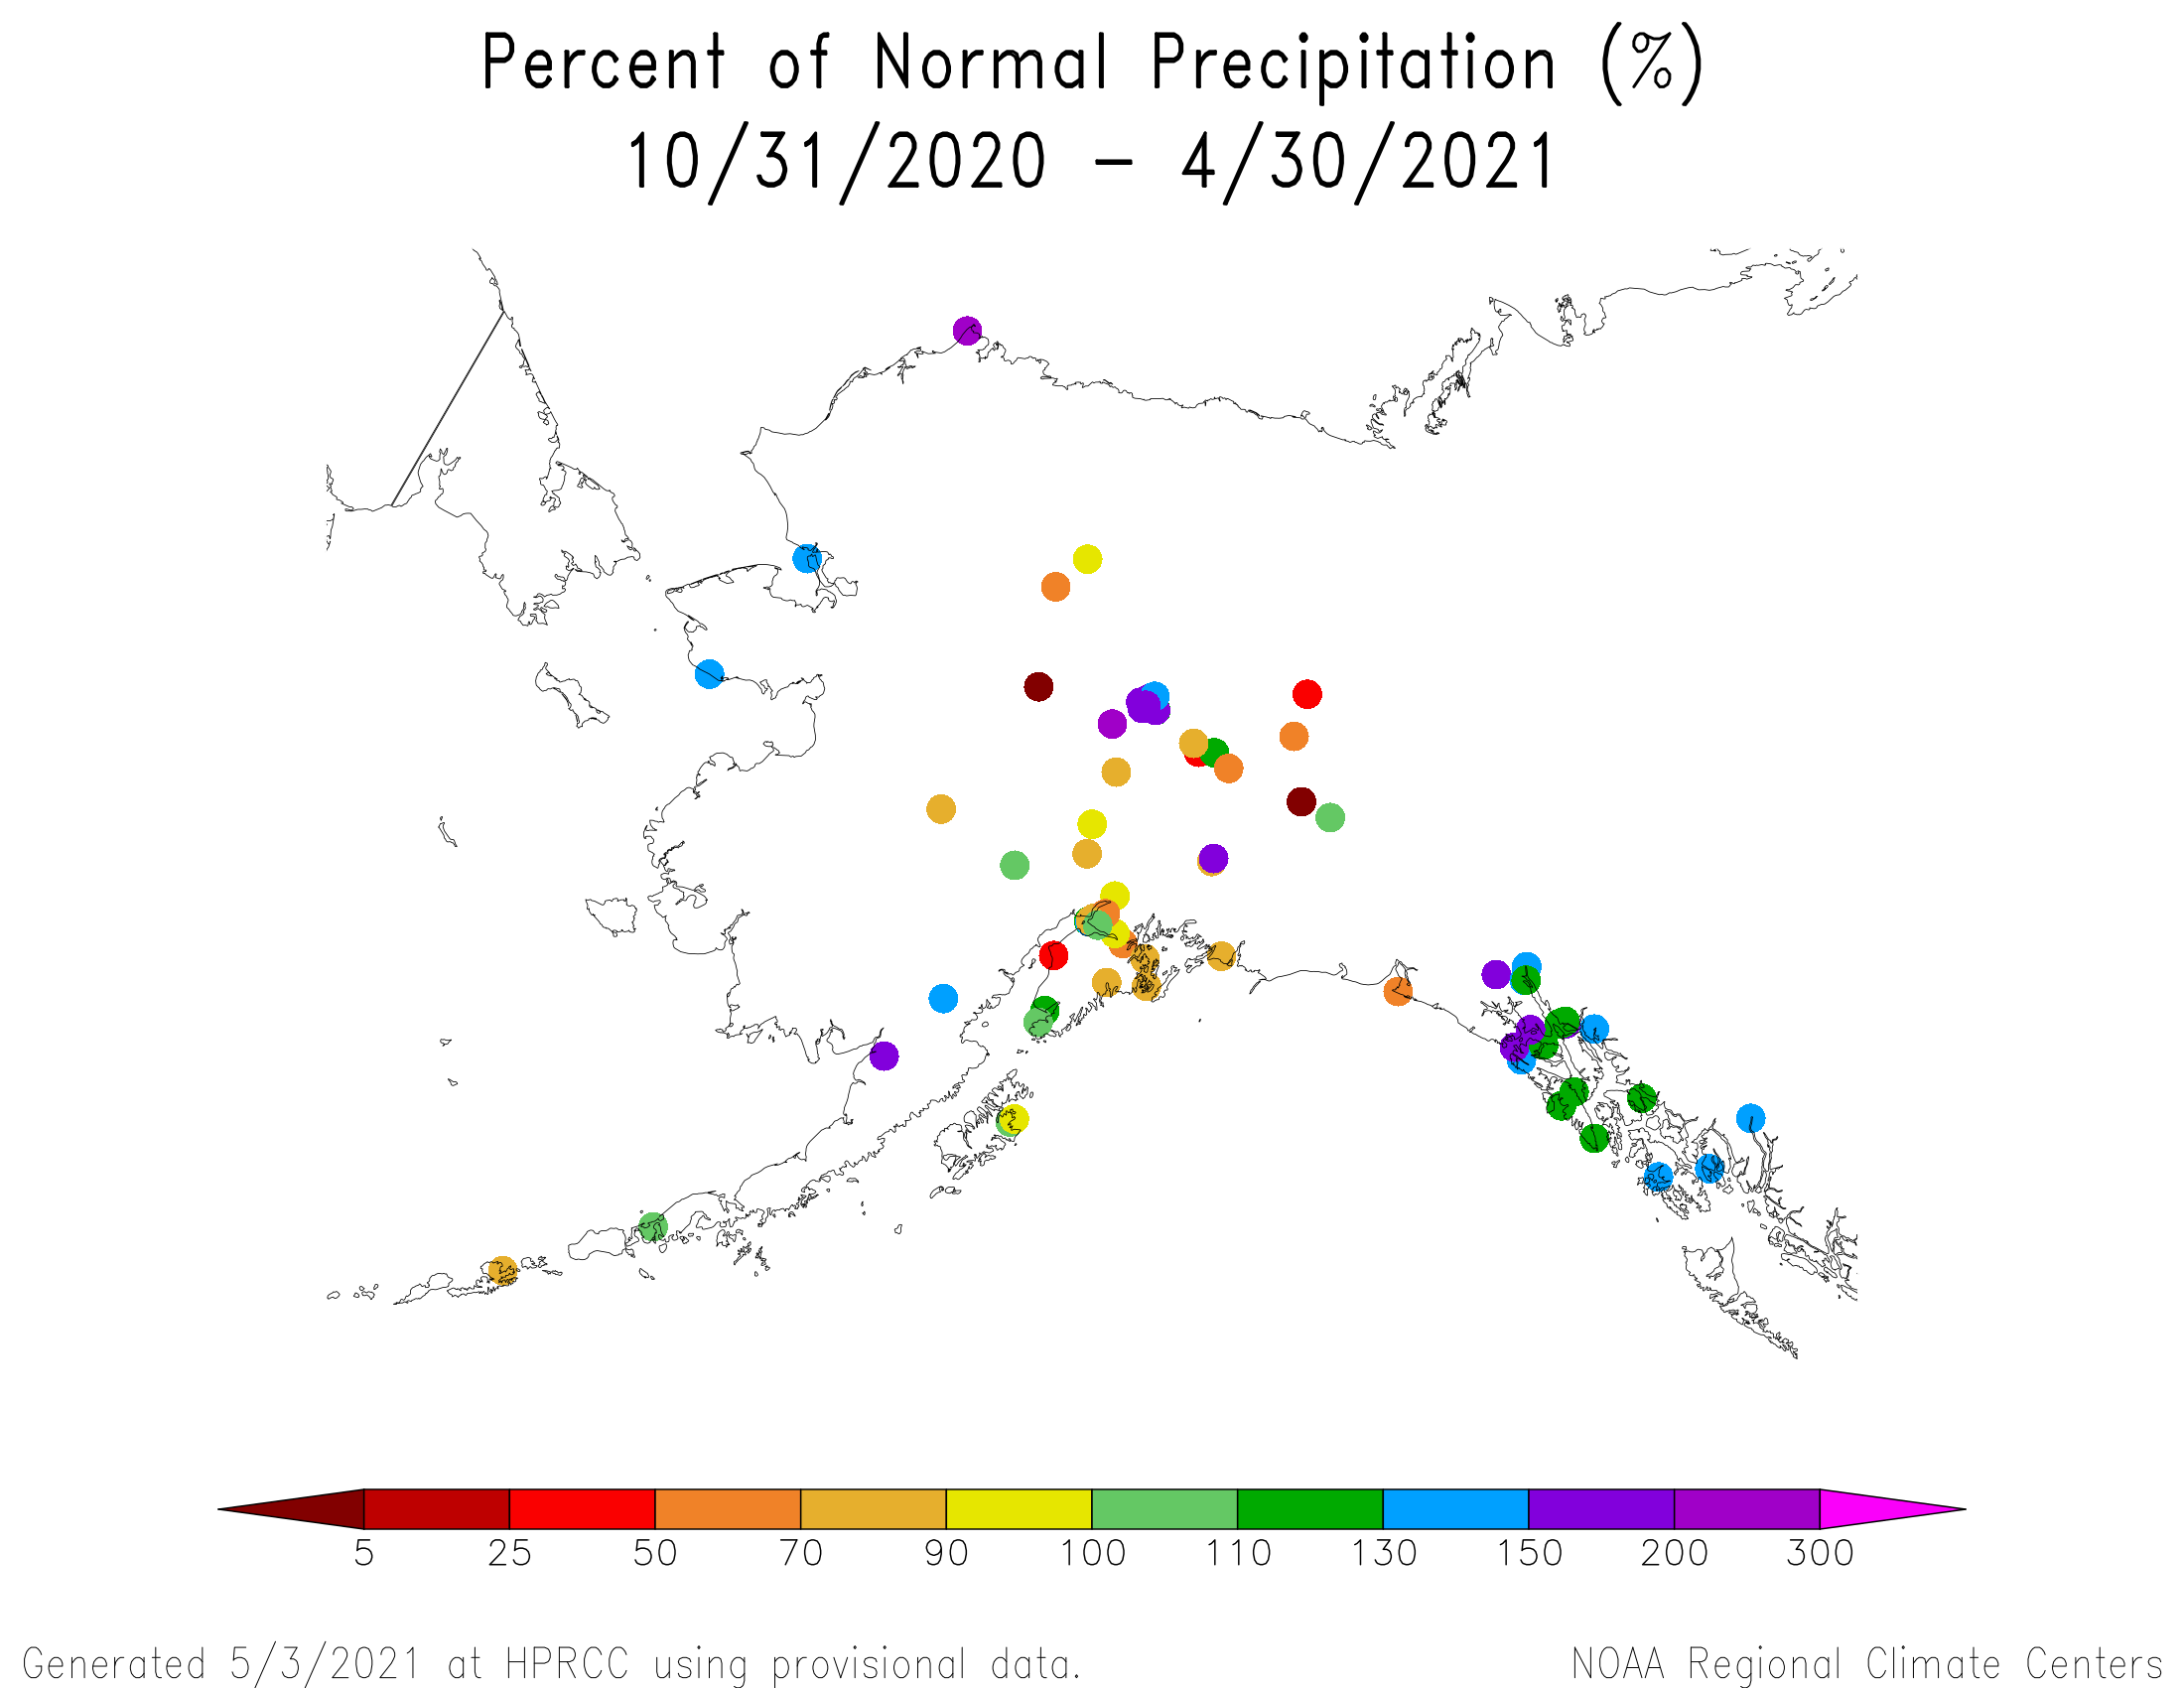
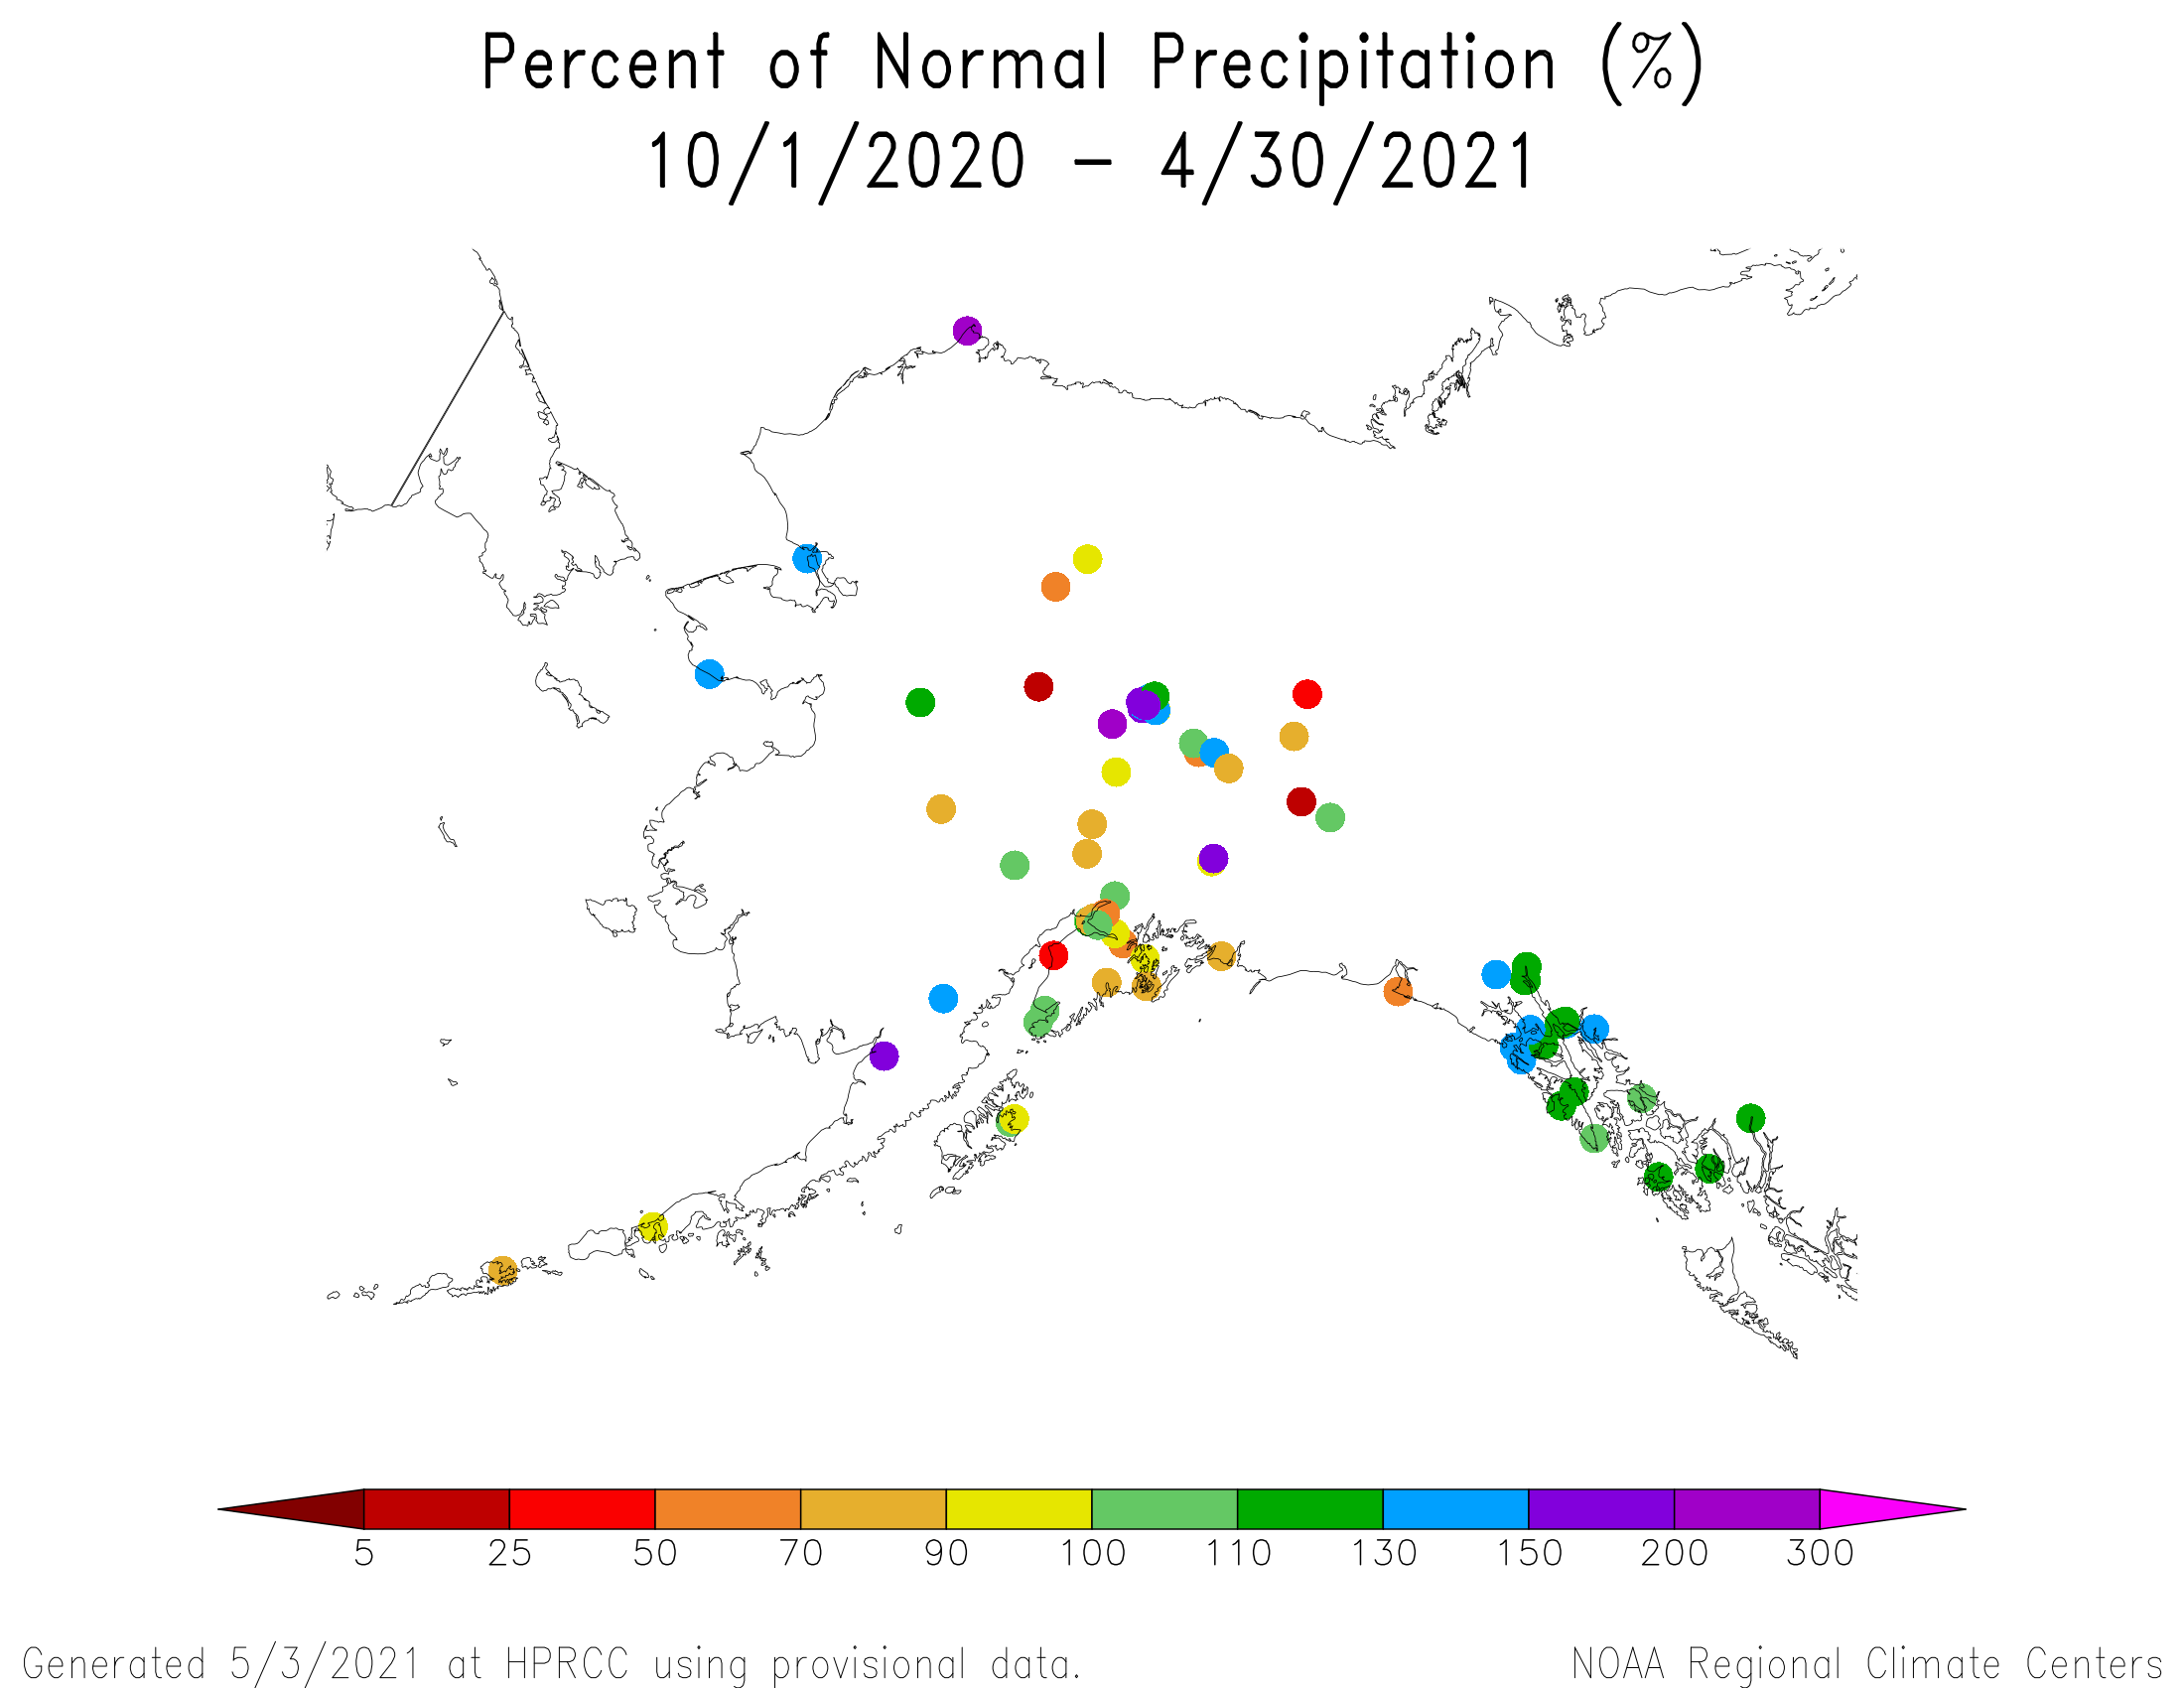
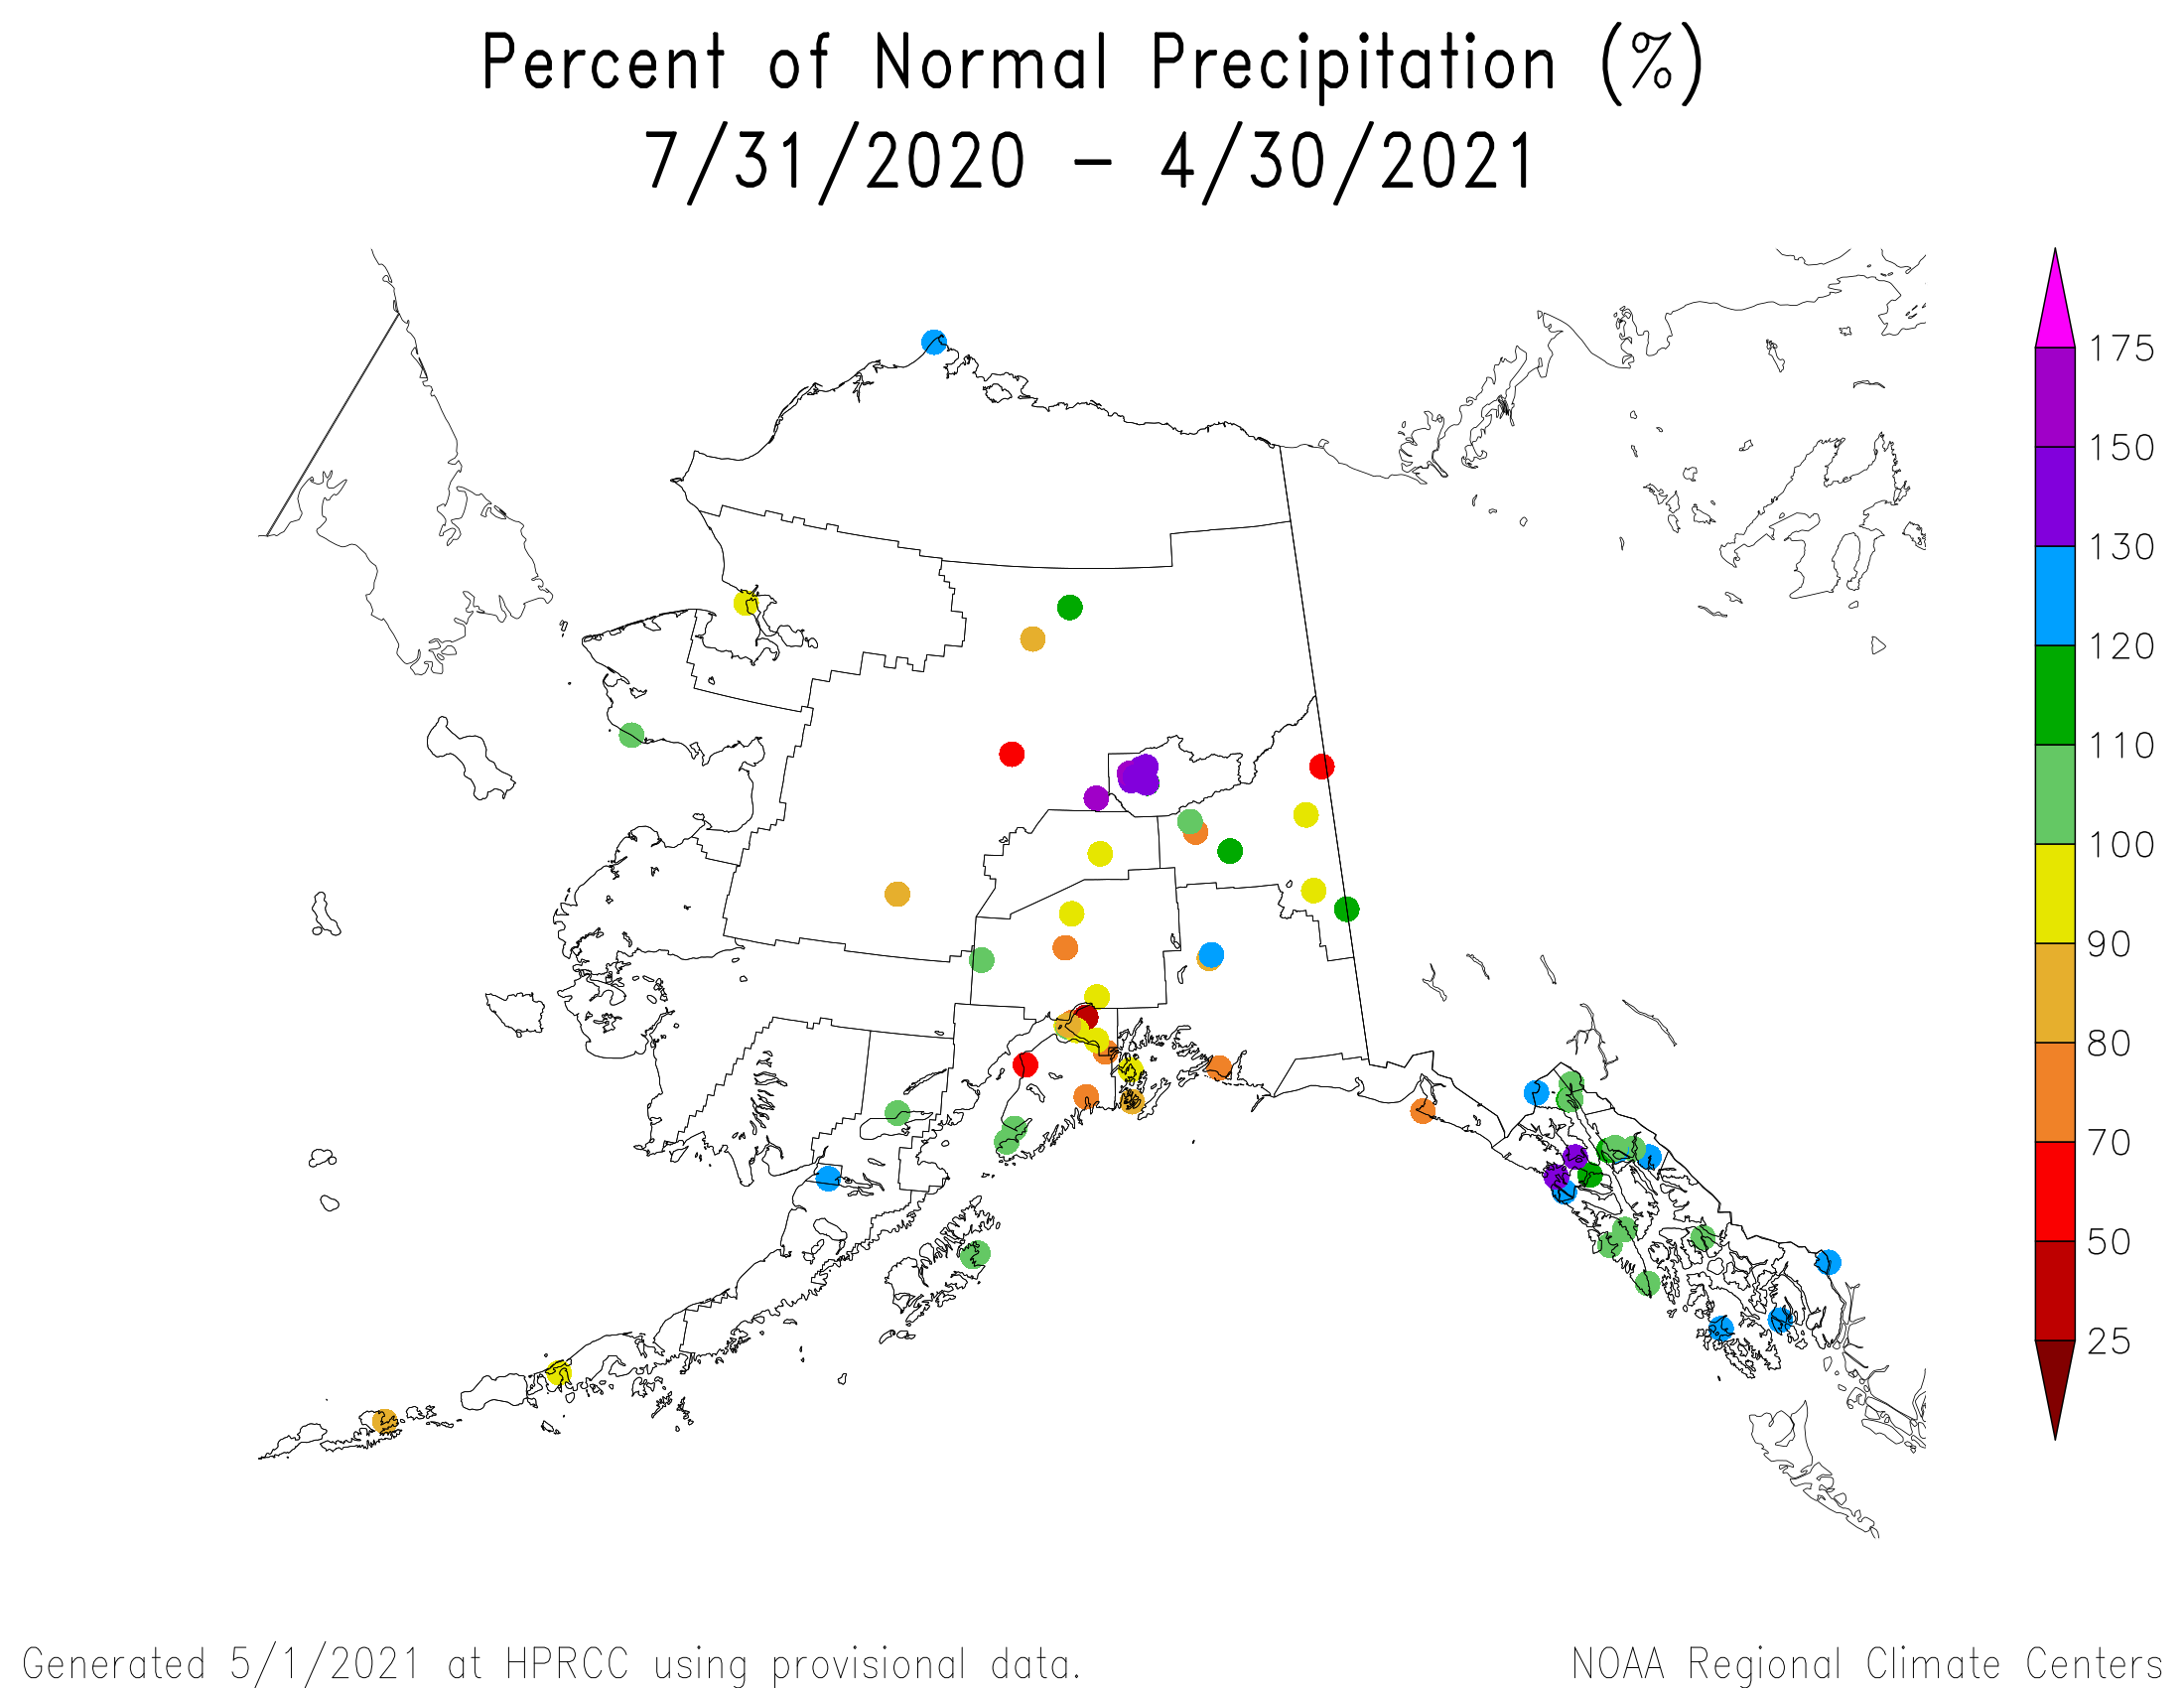
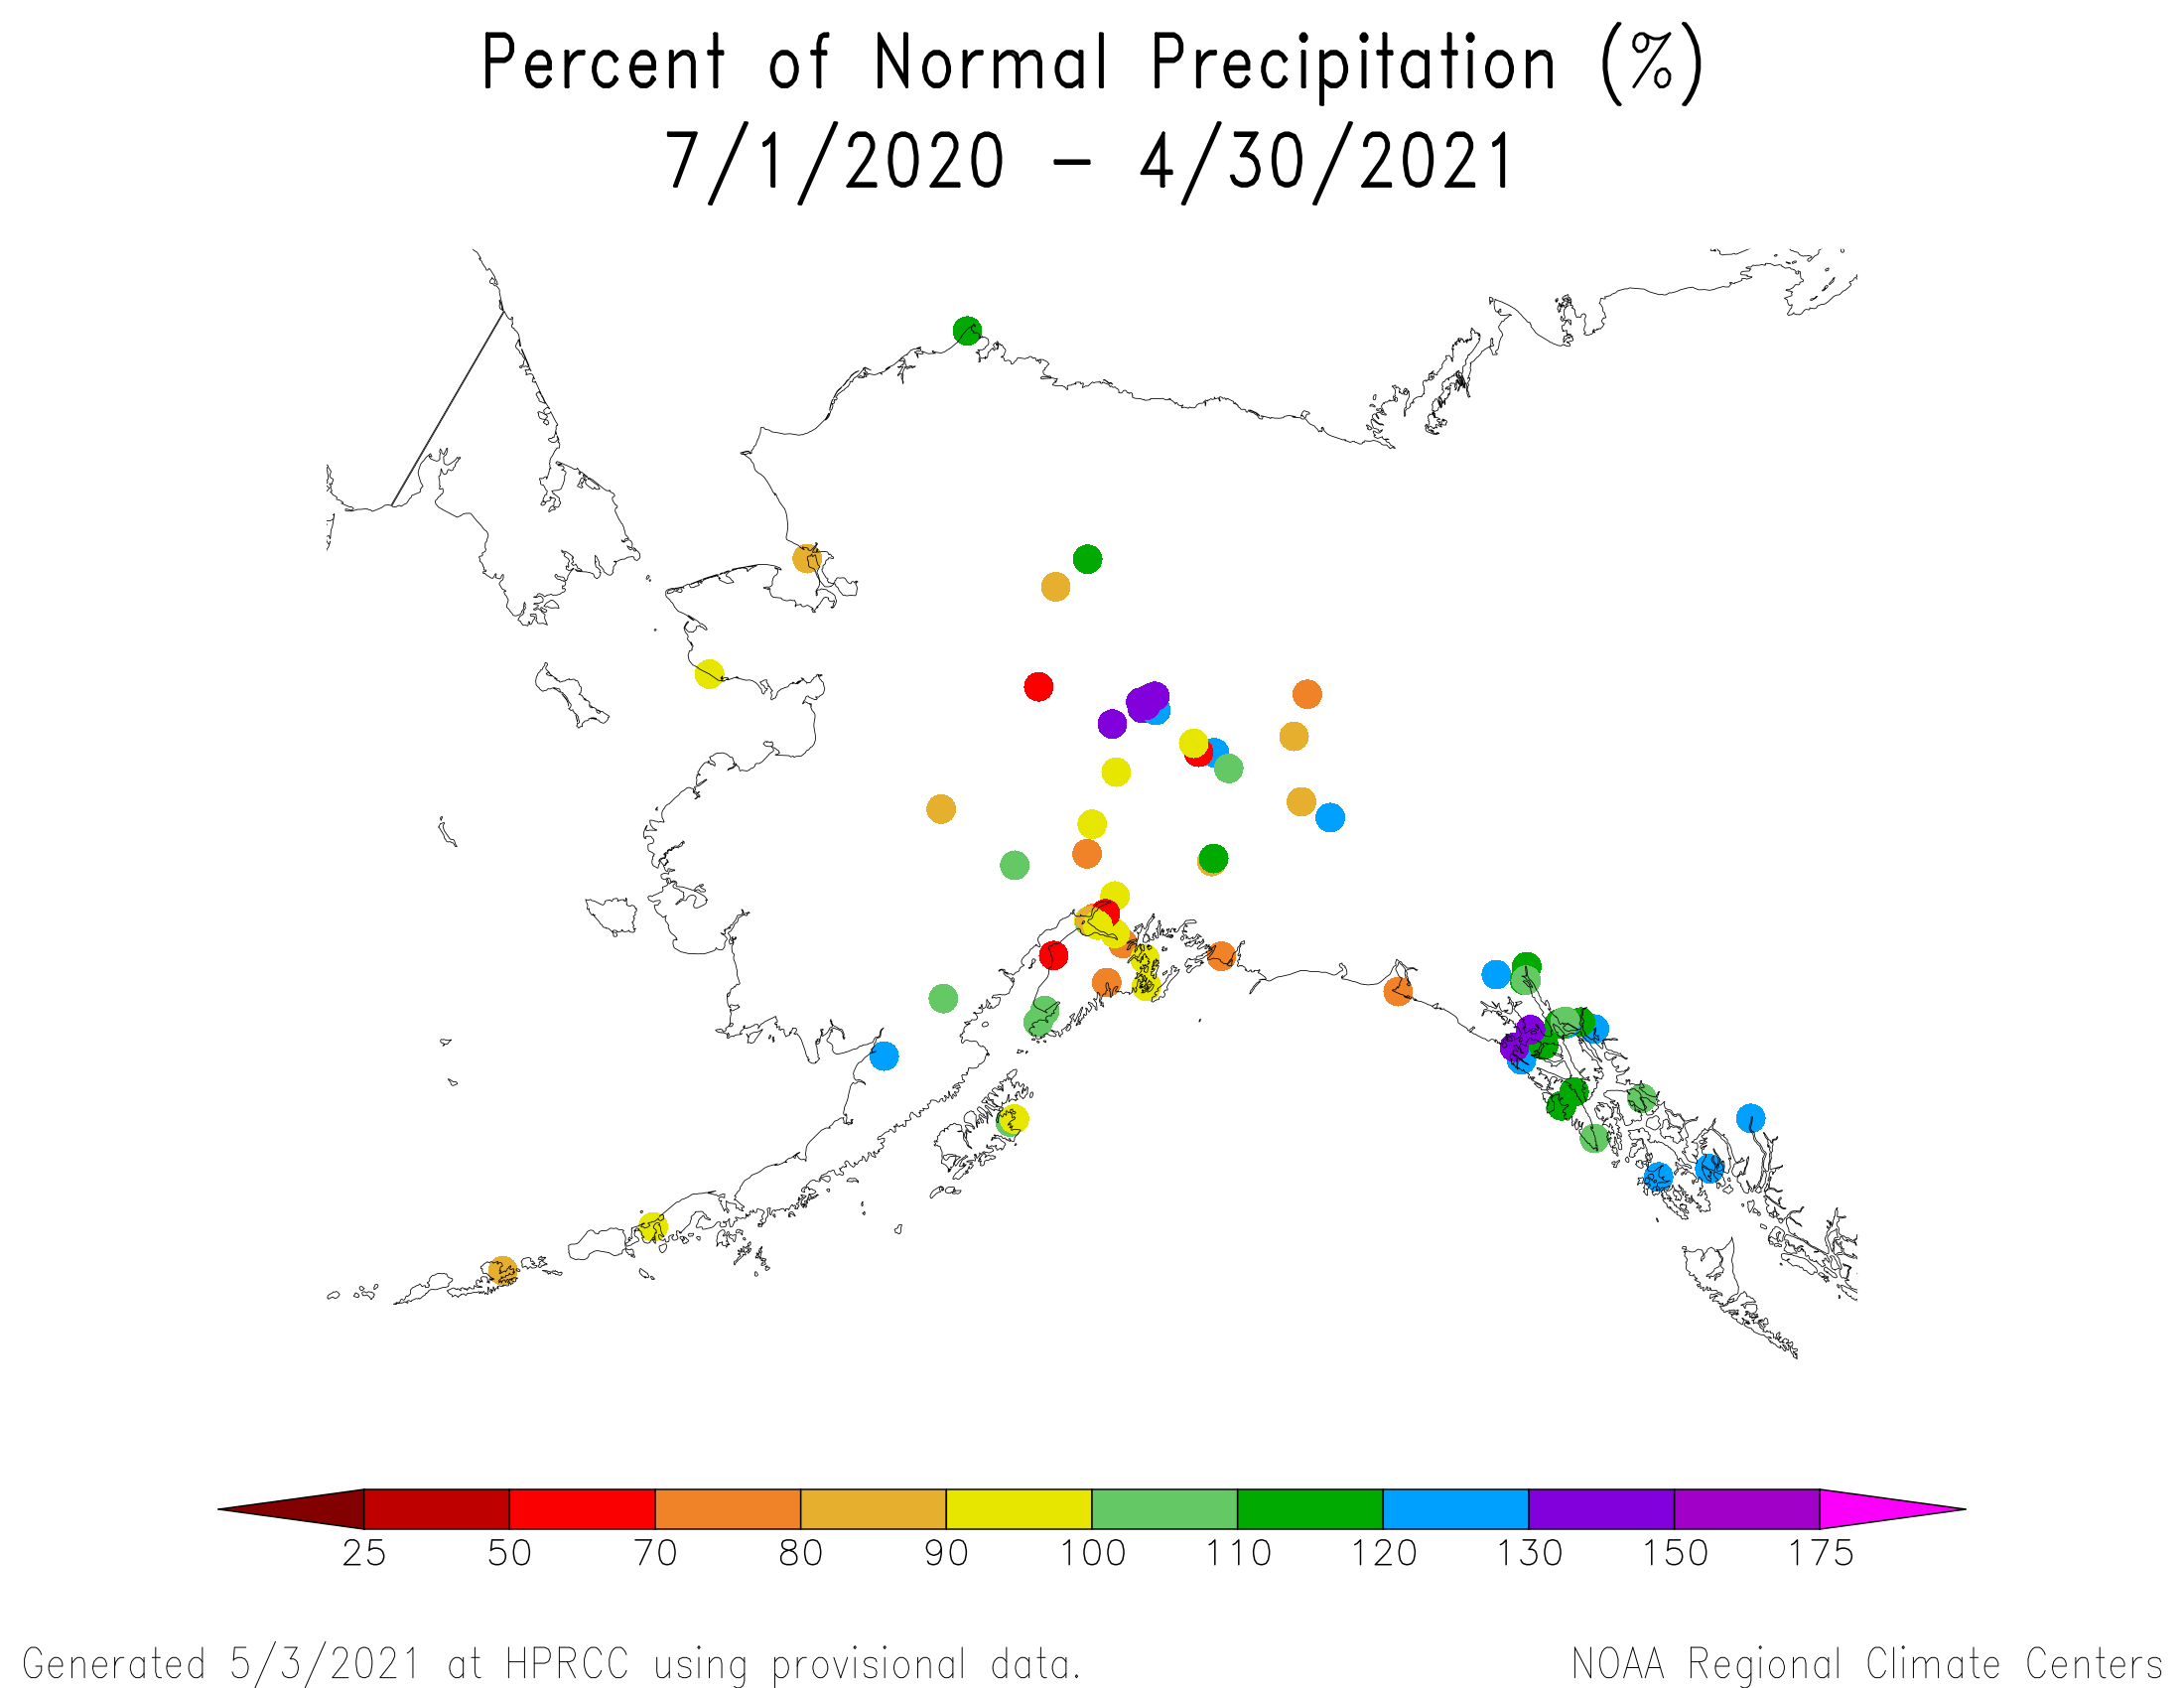
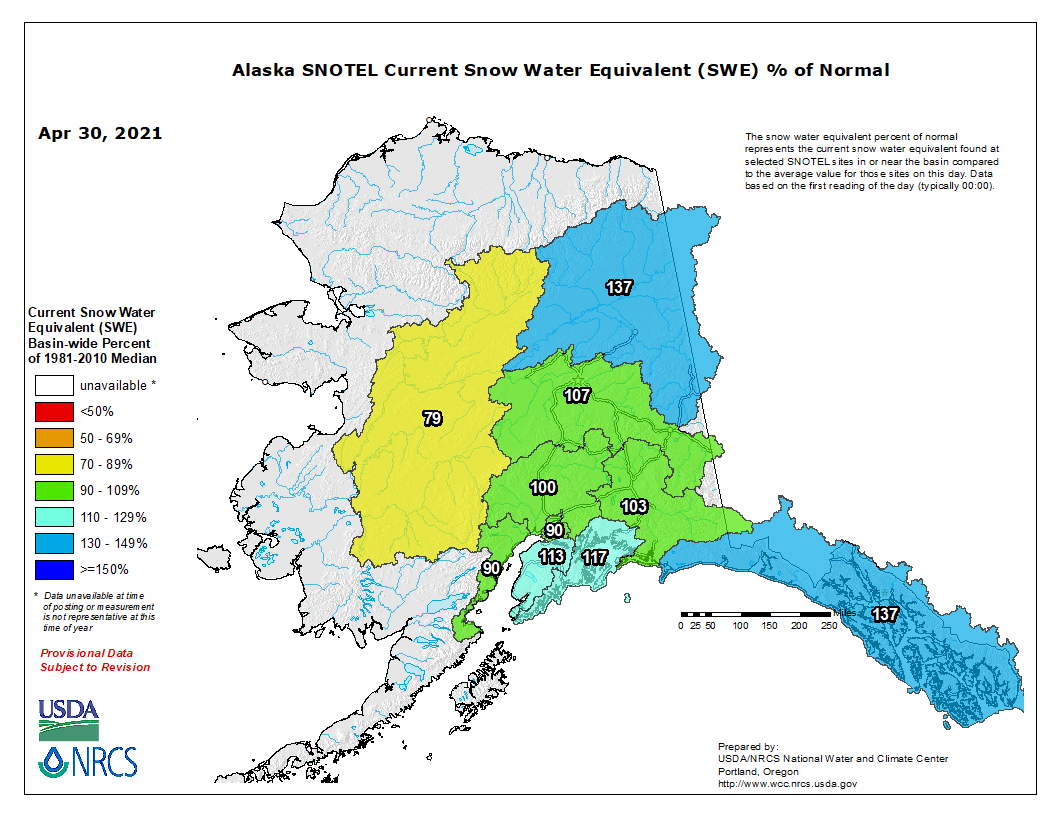
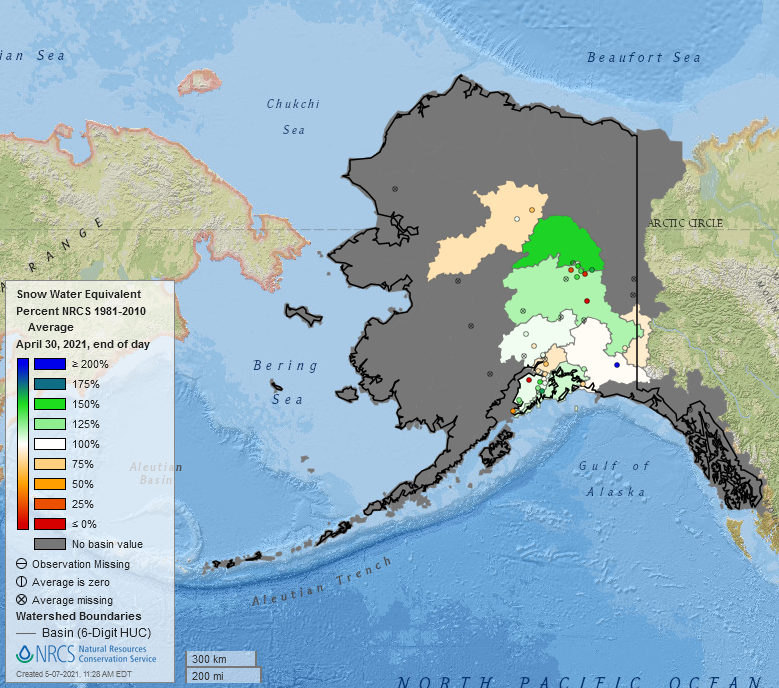
Alaska
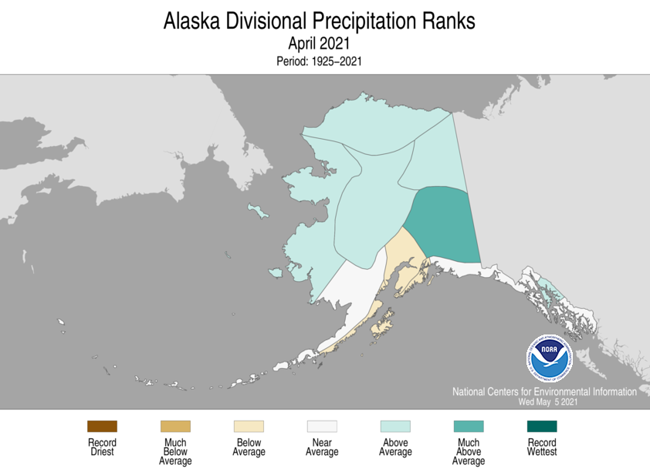
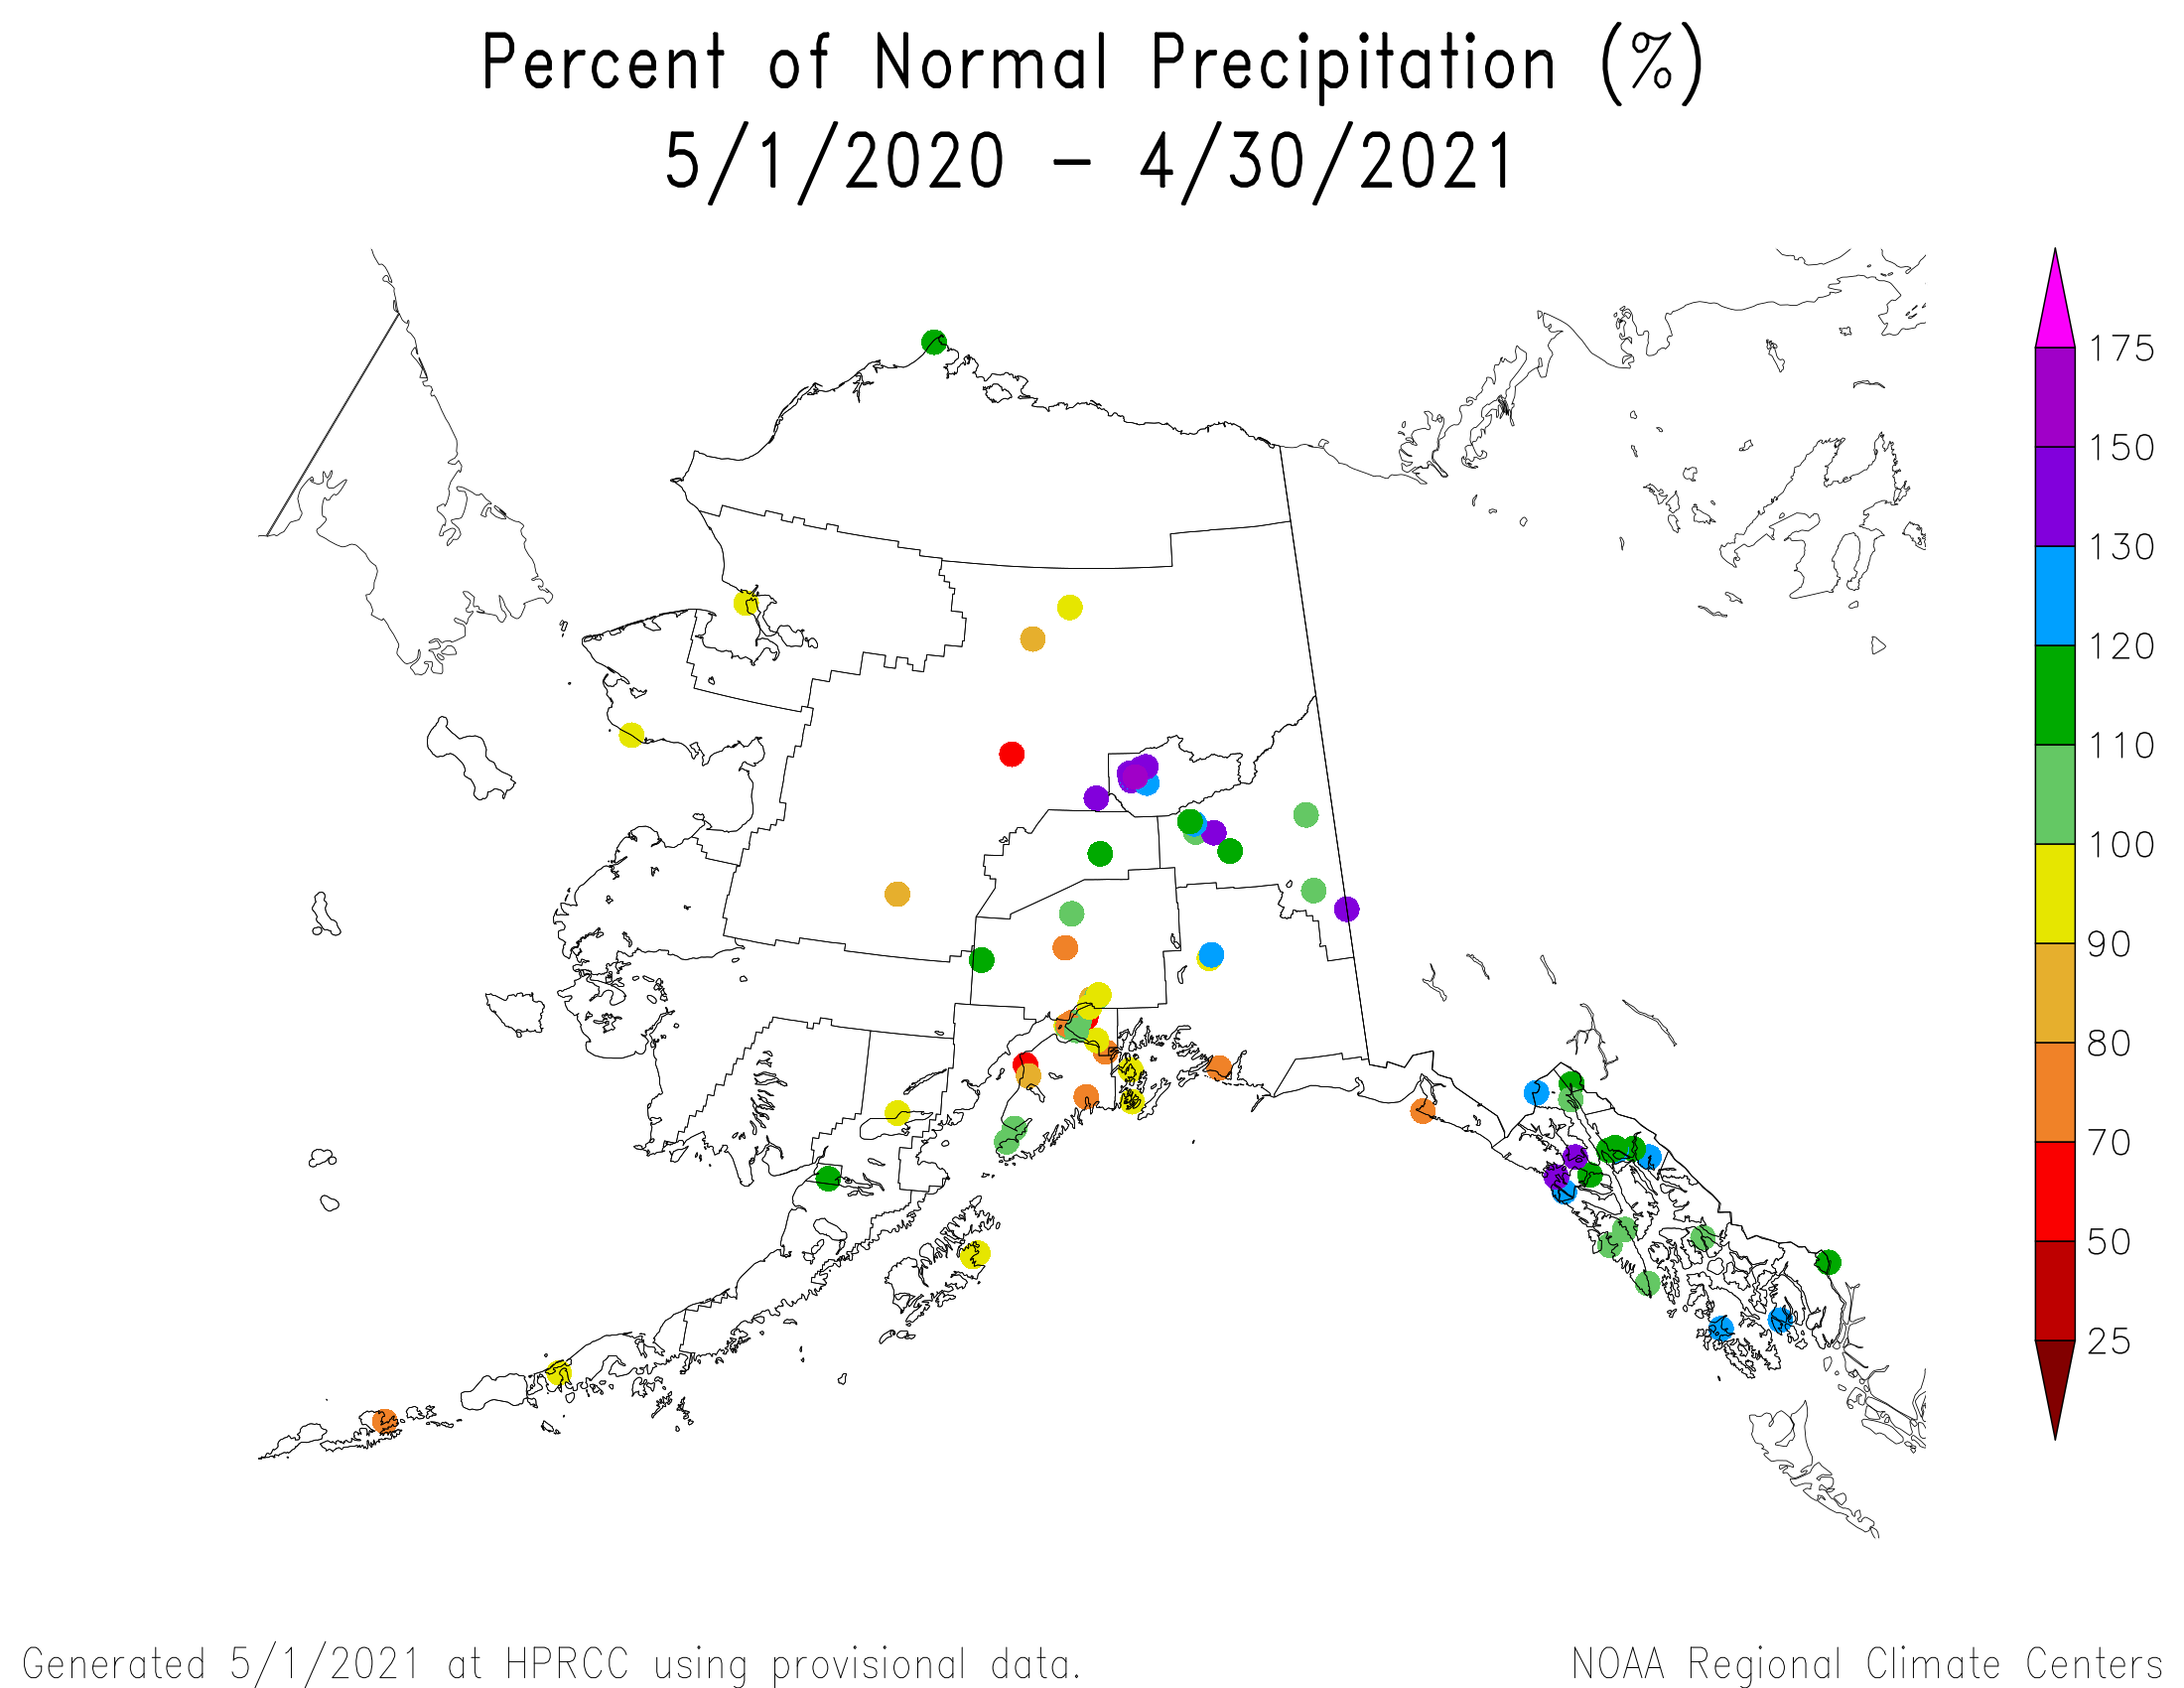
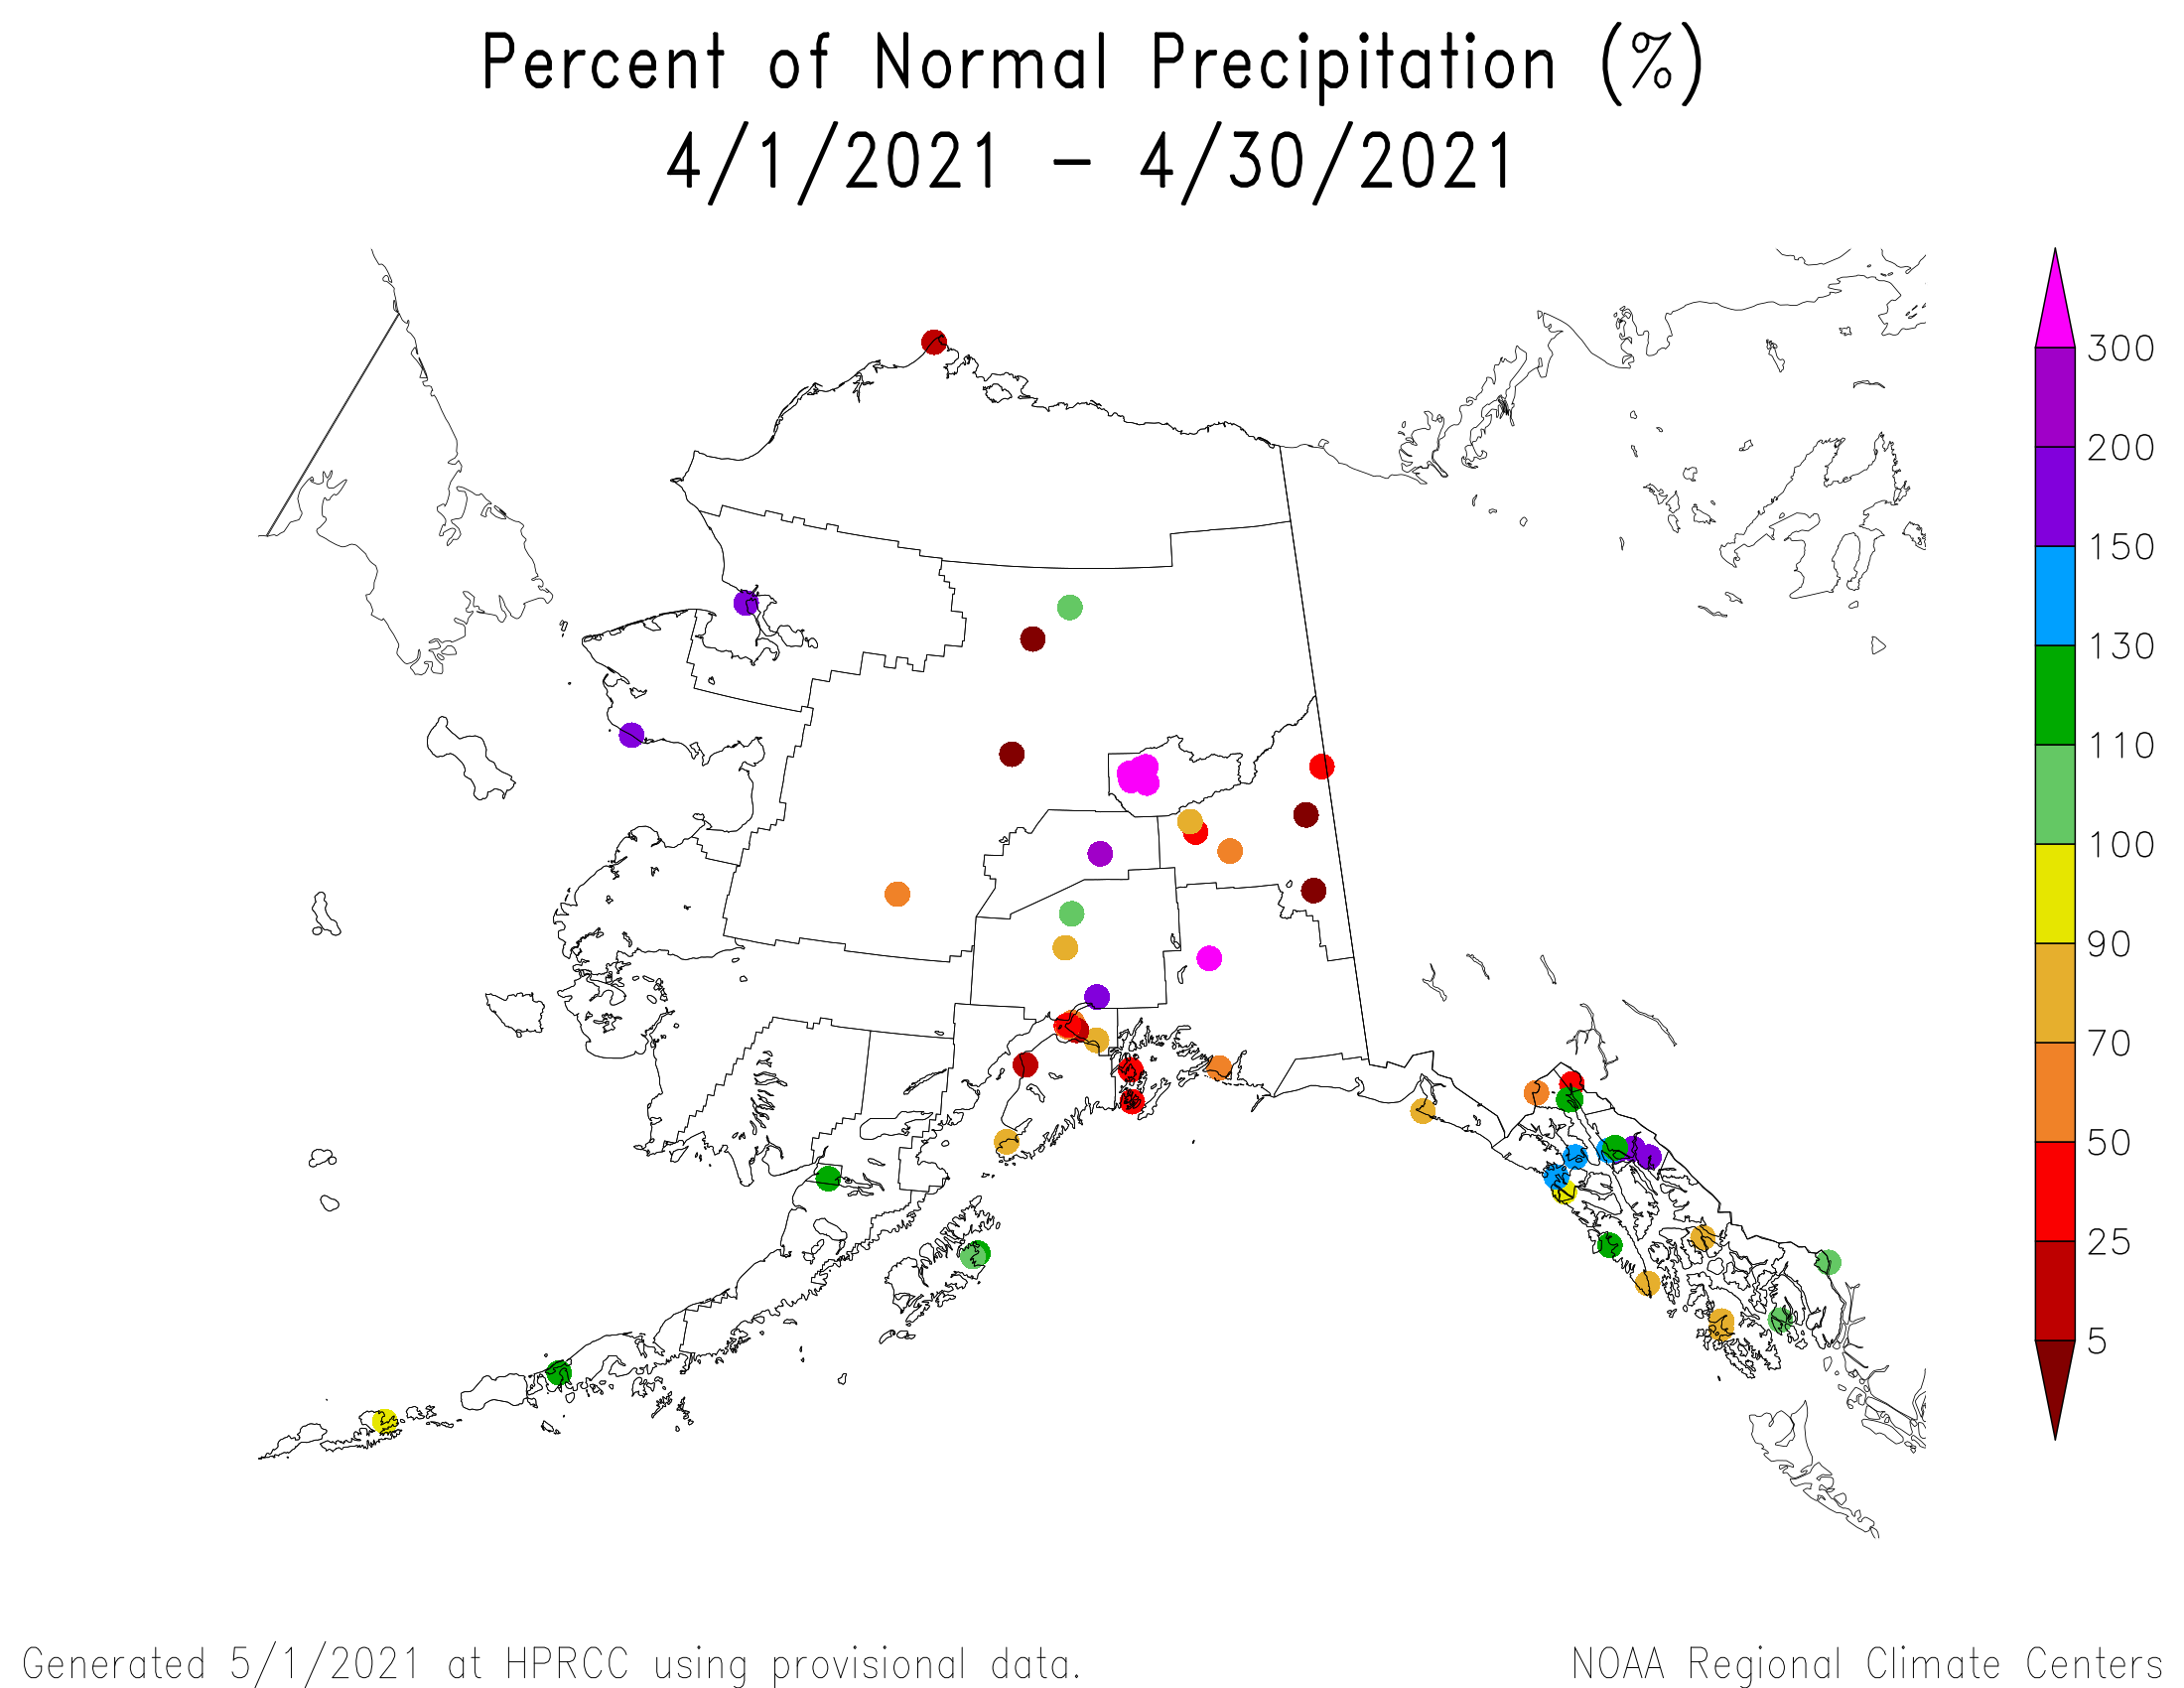
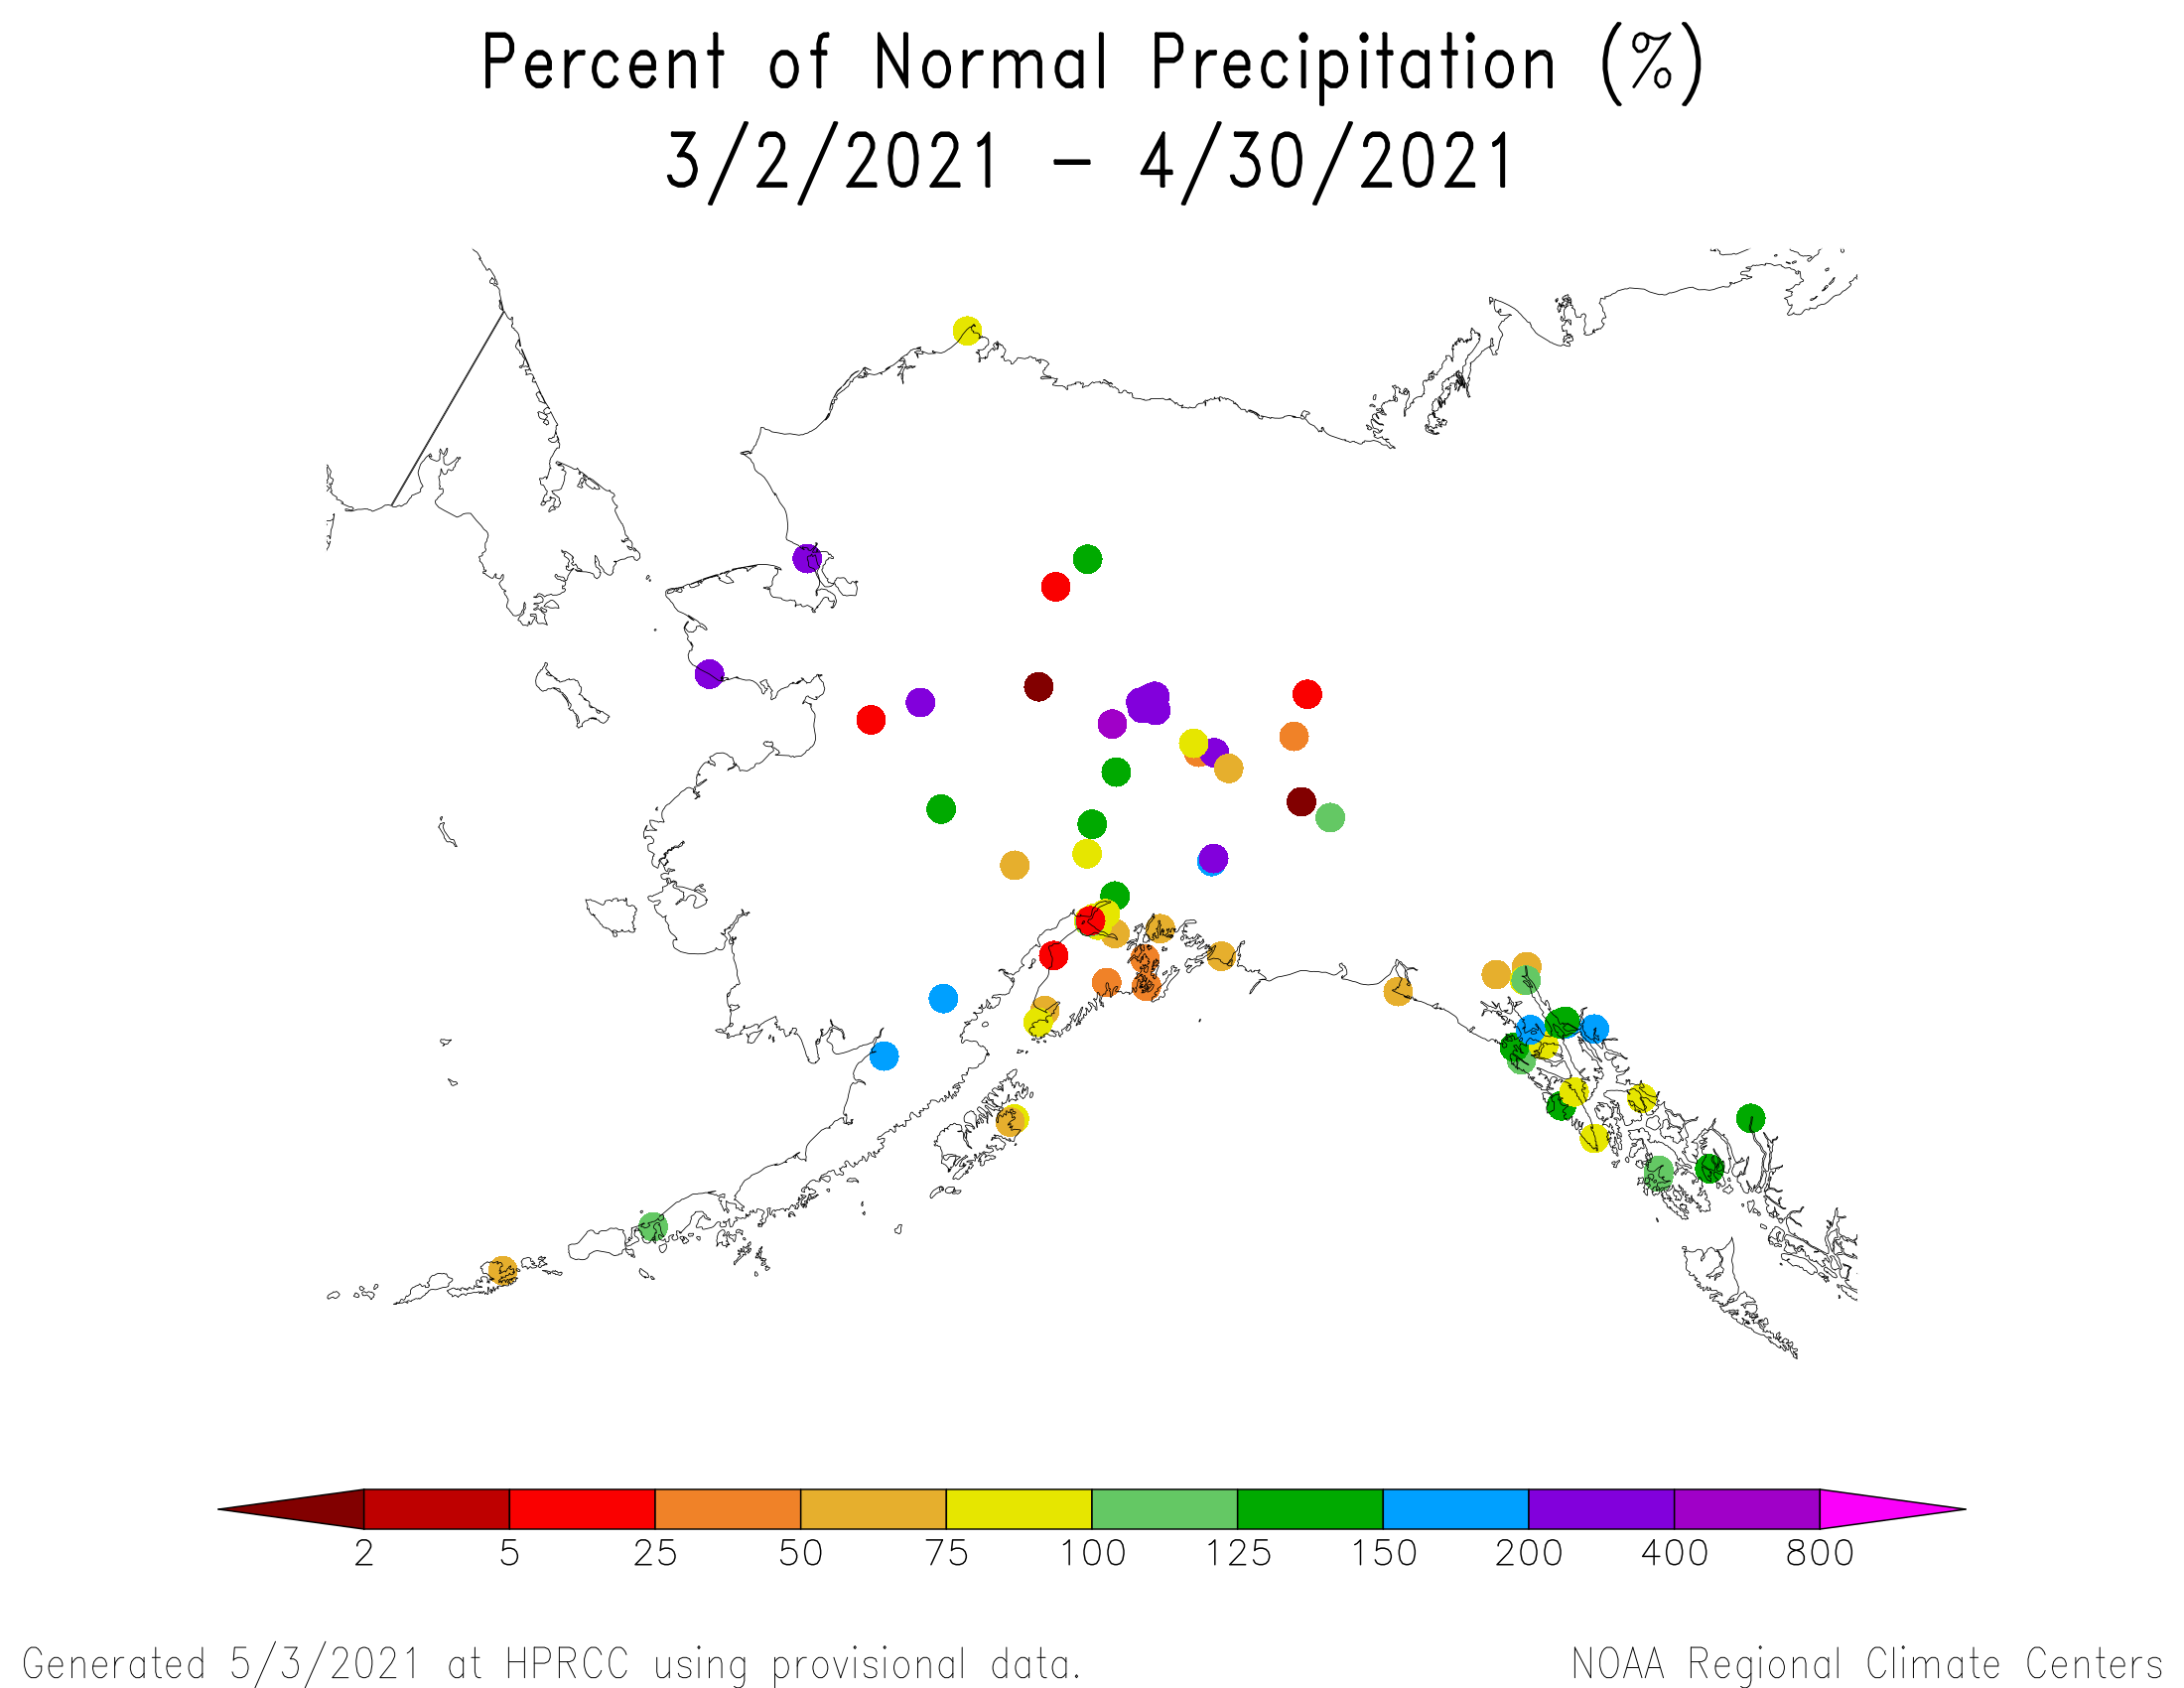
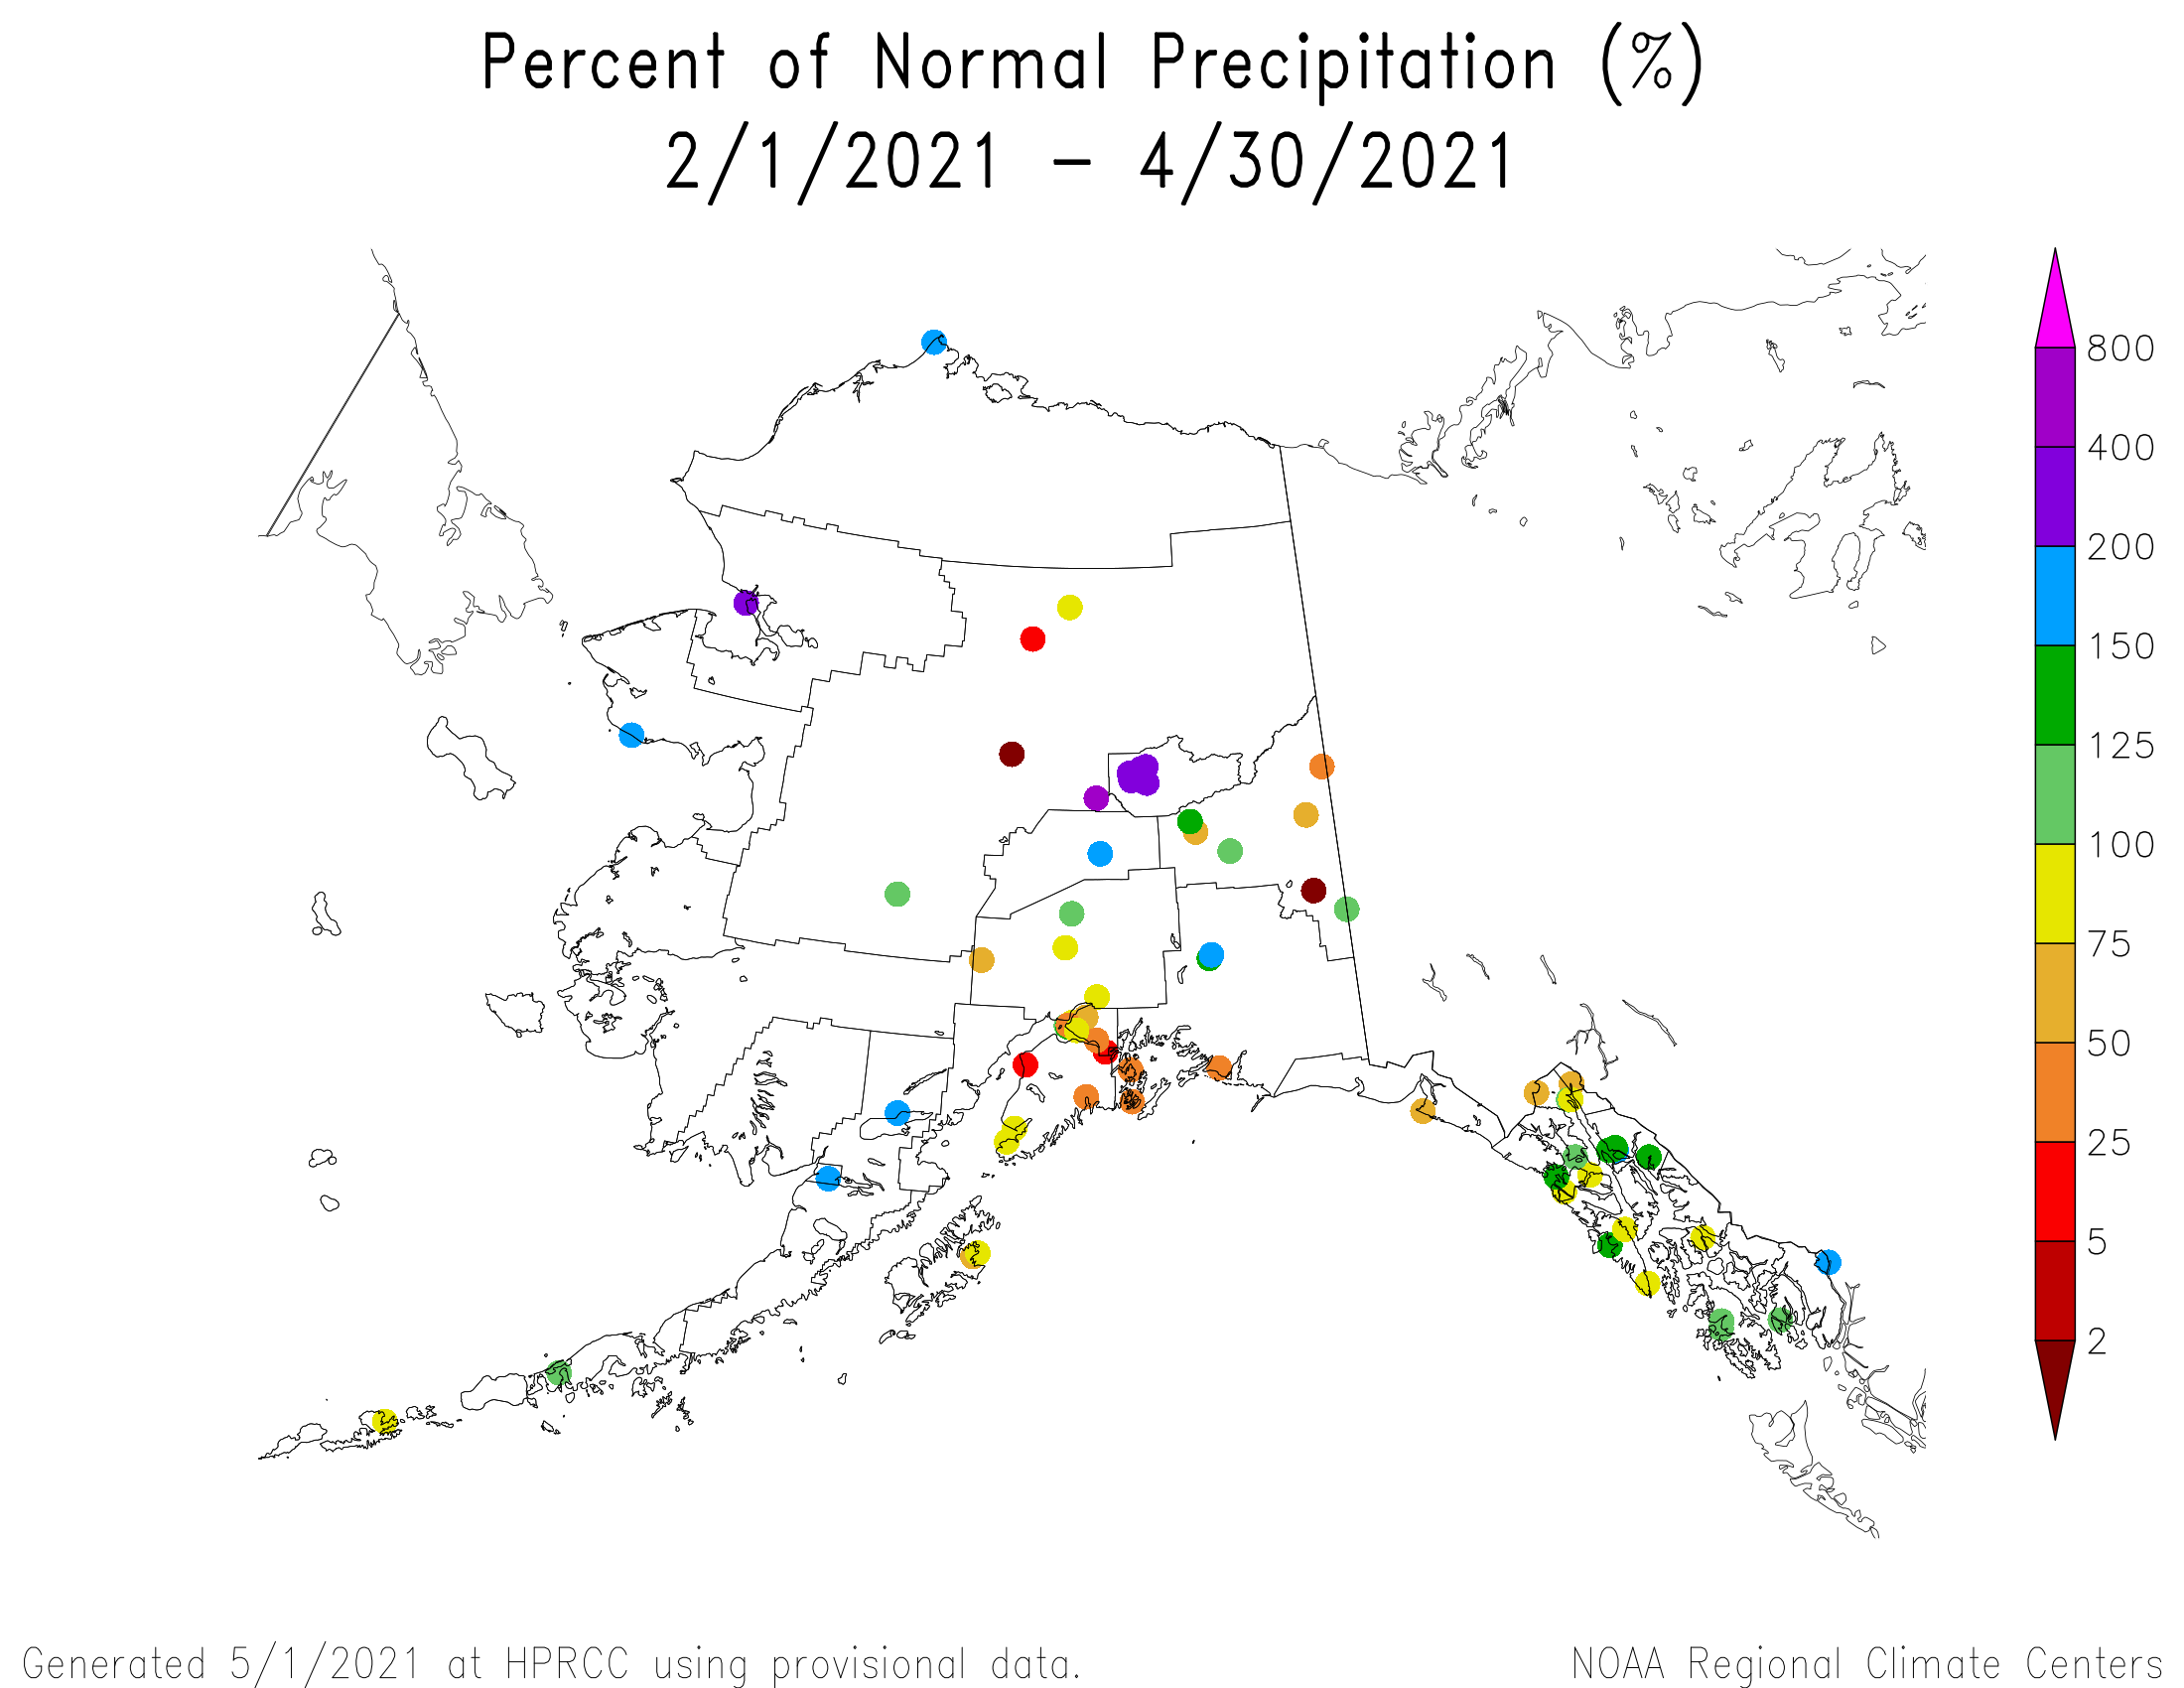
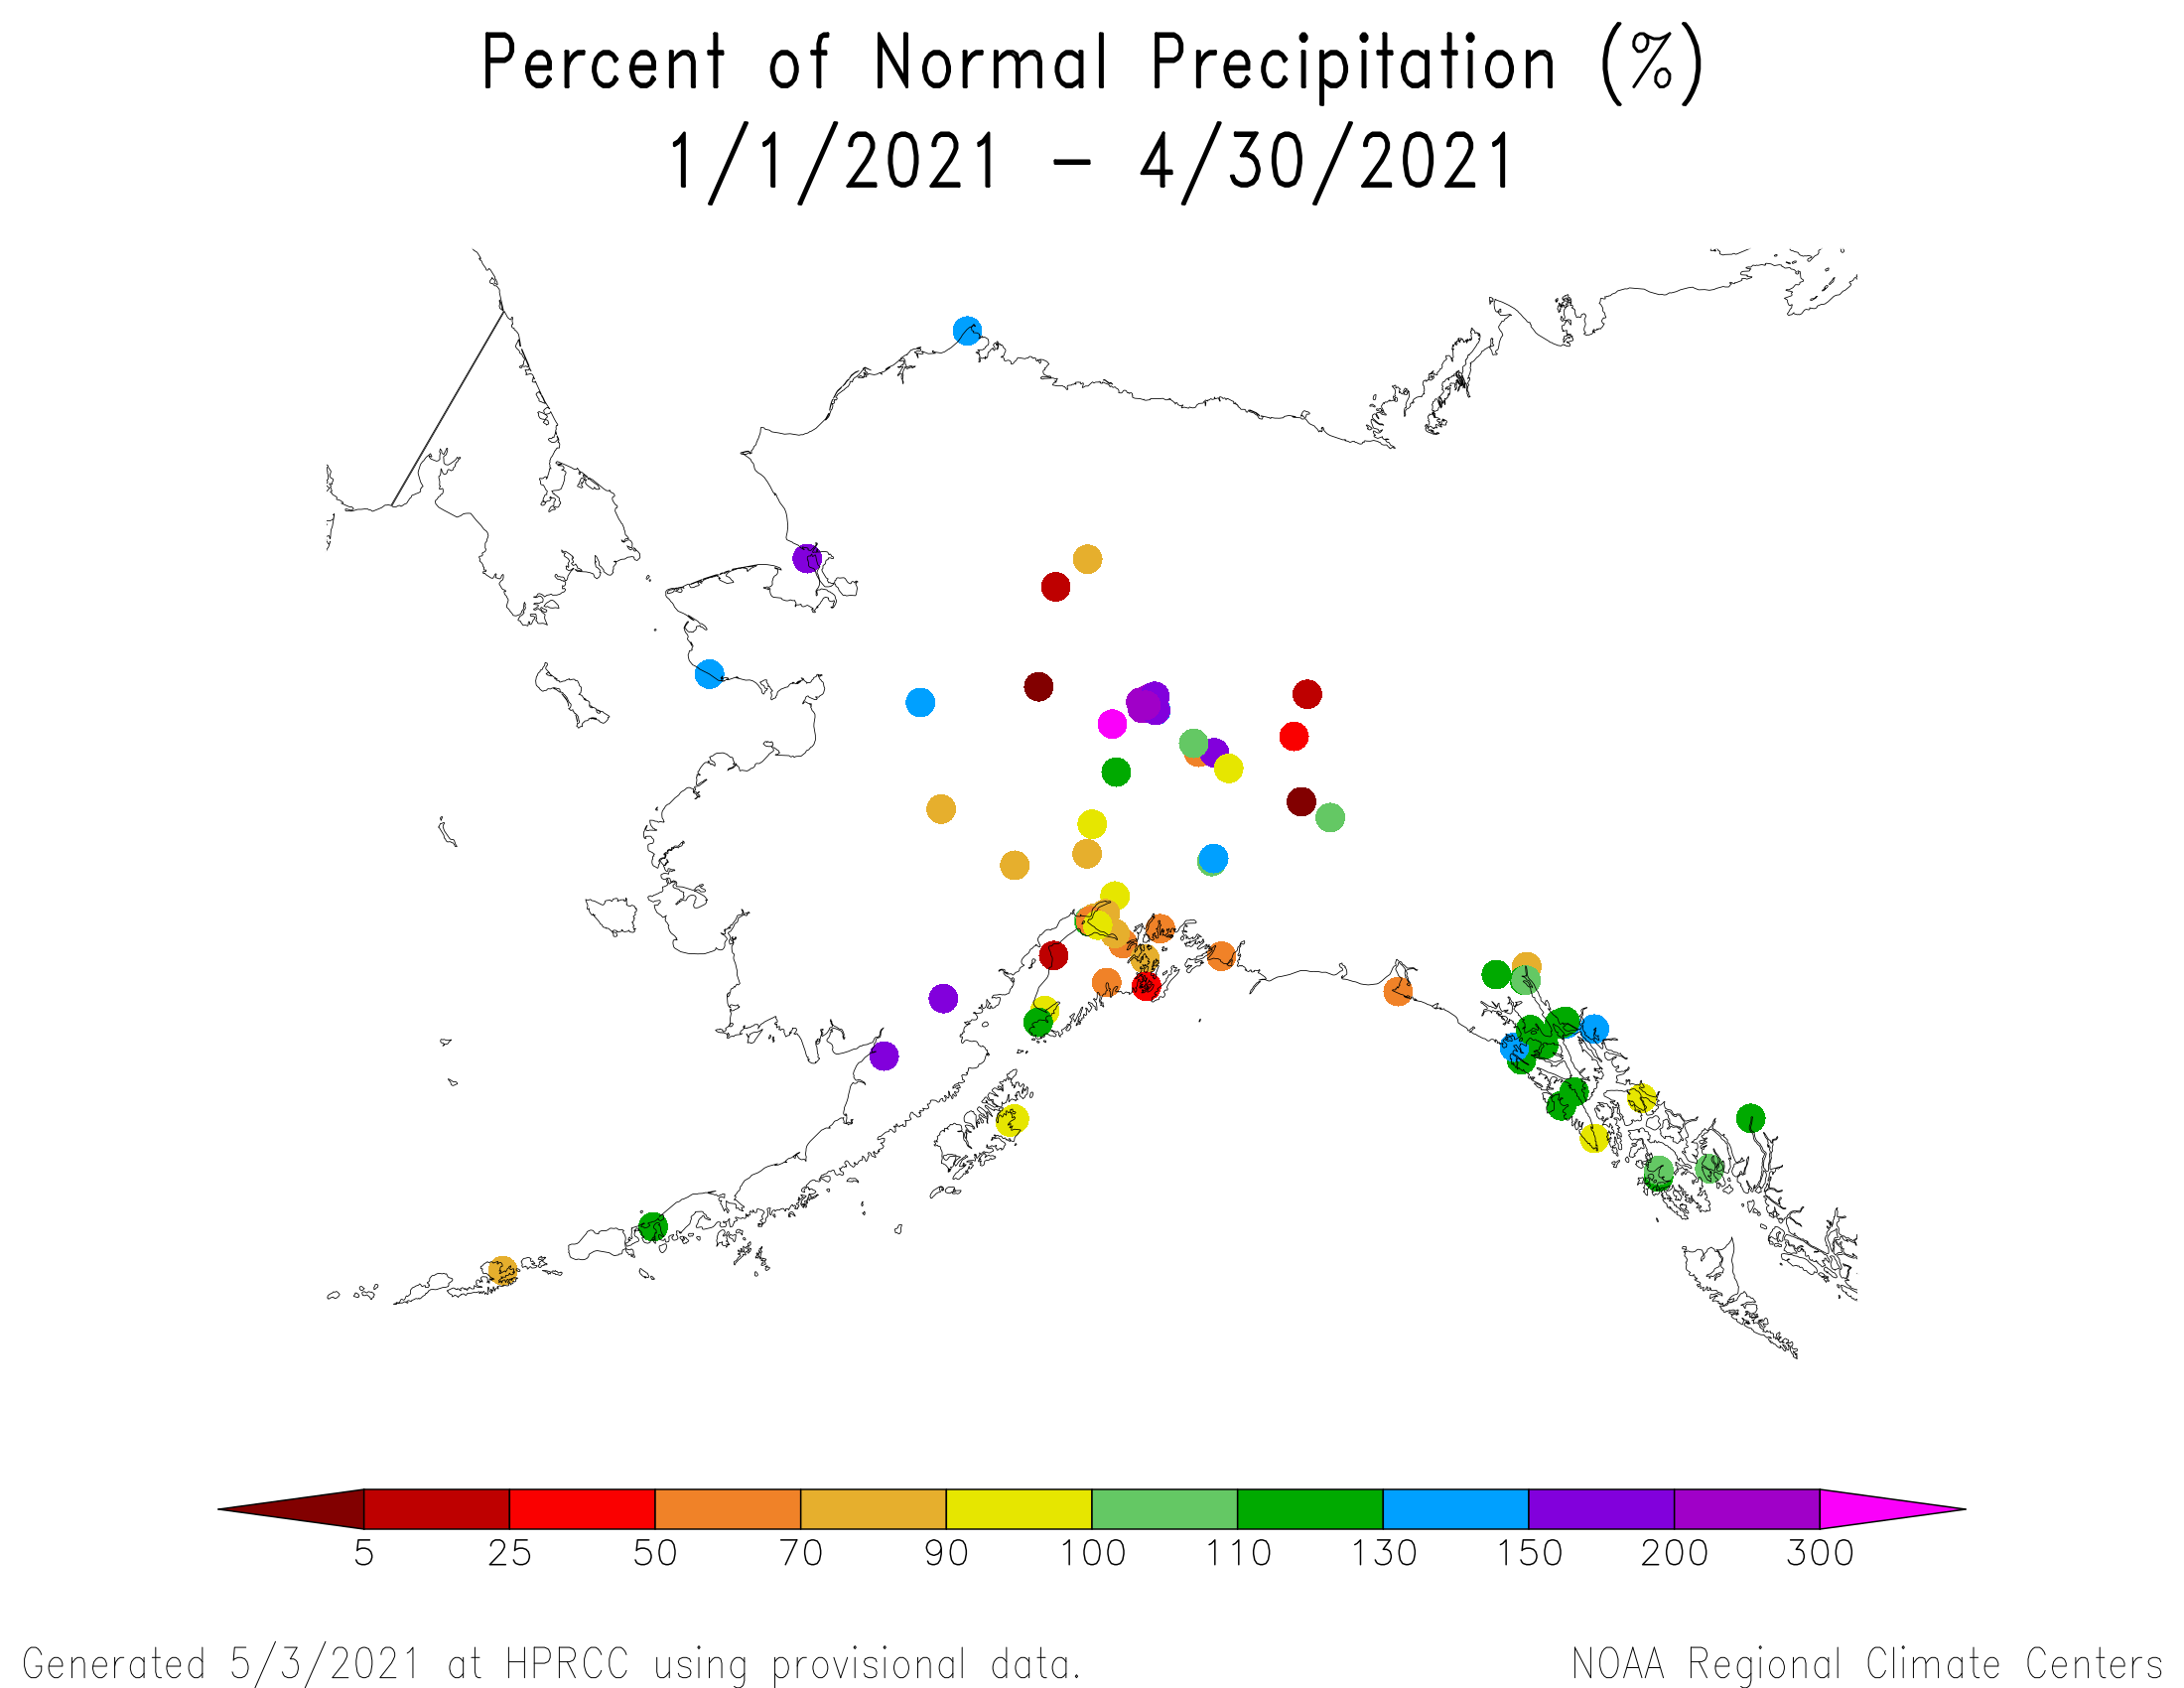
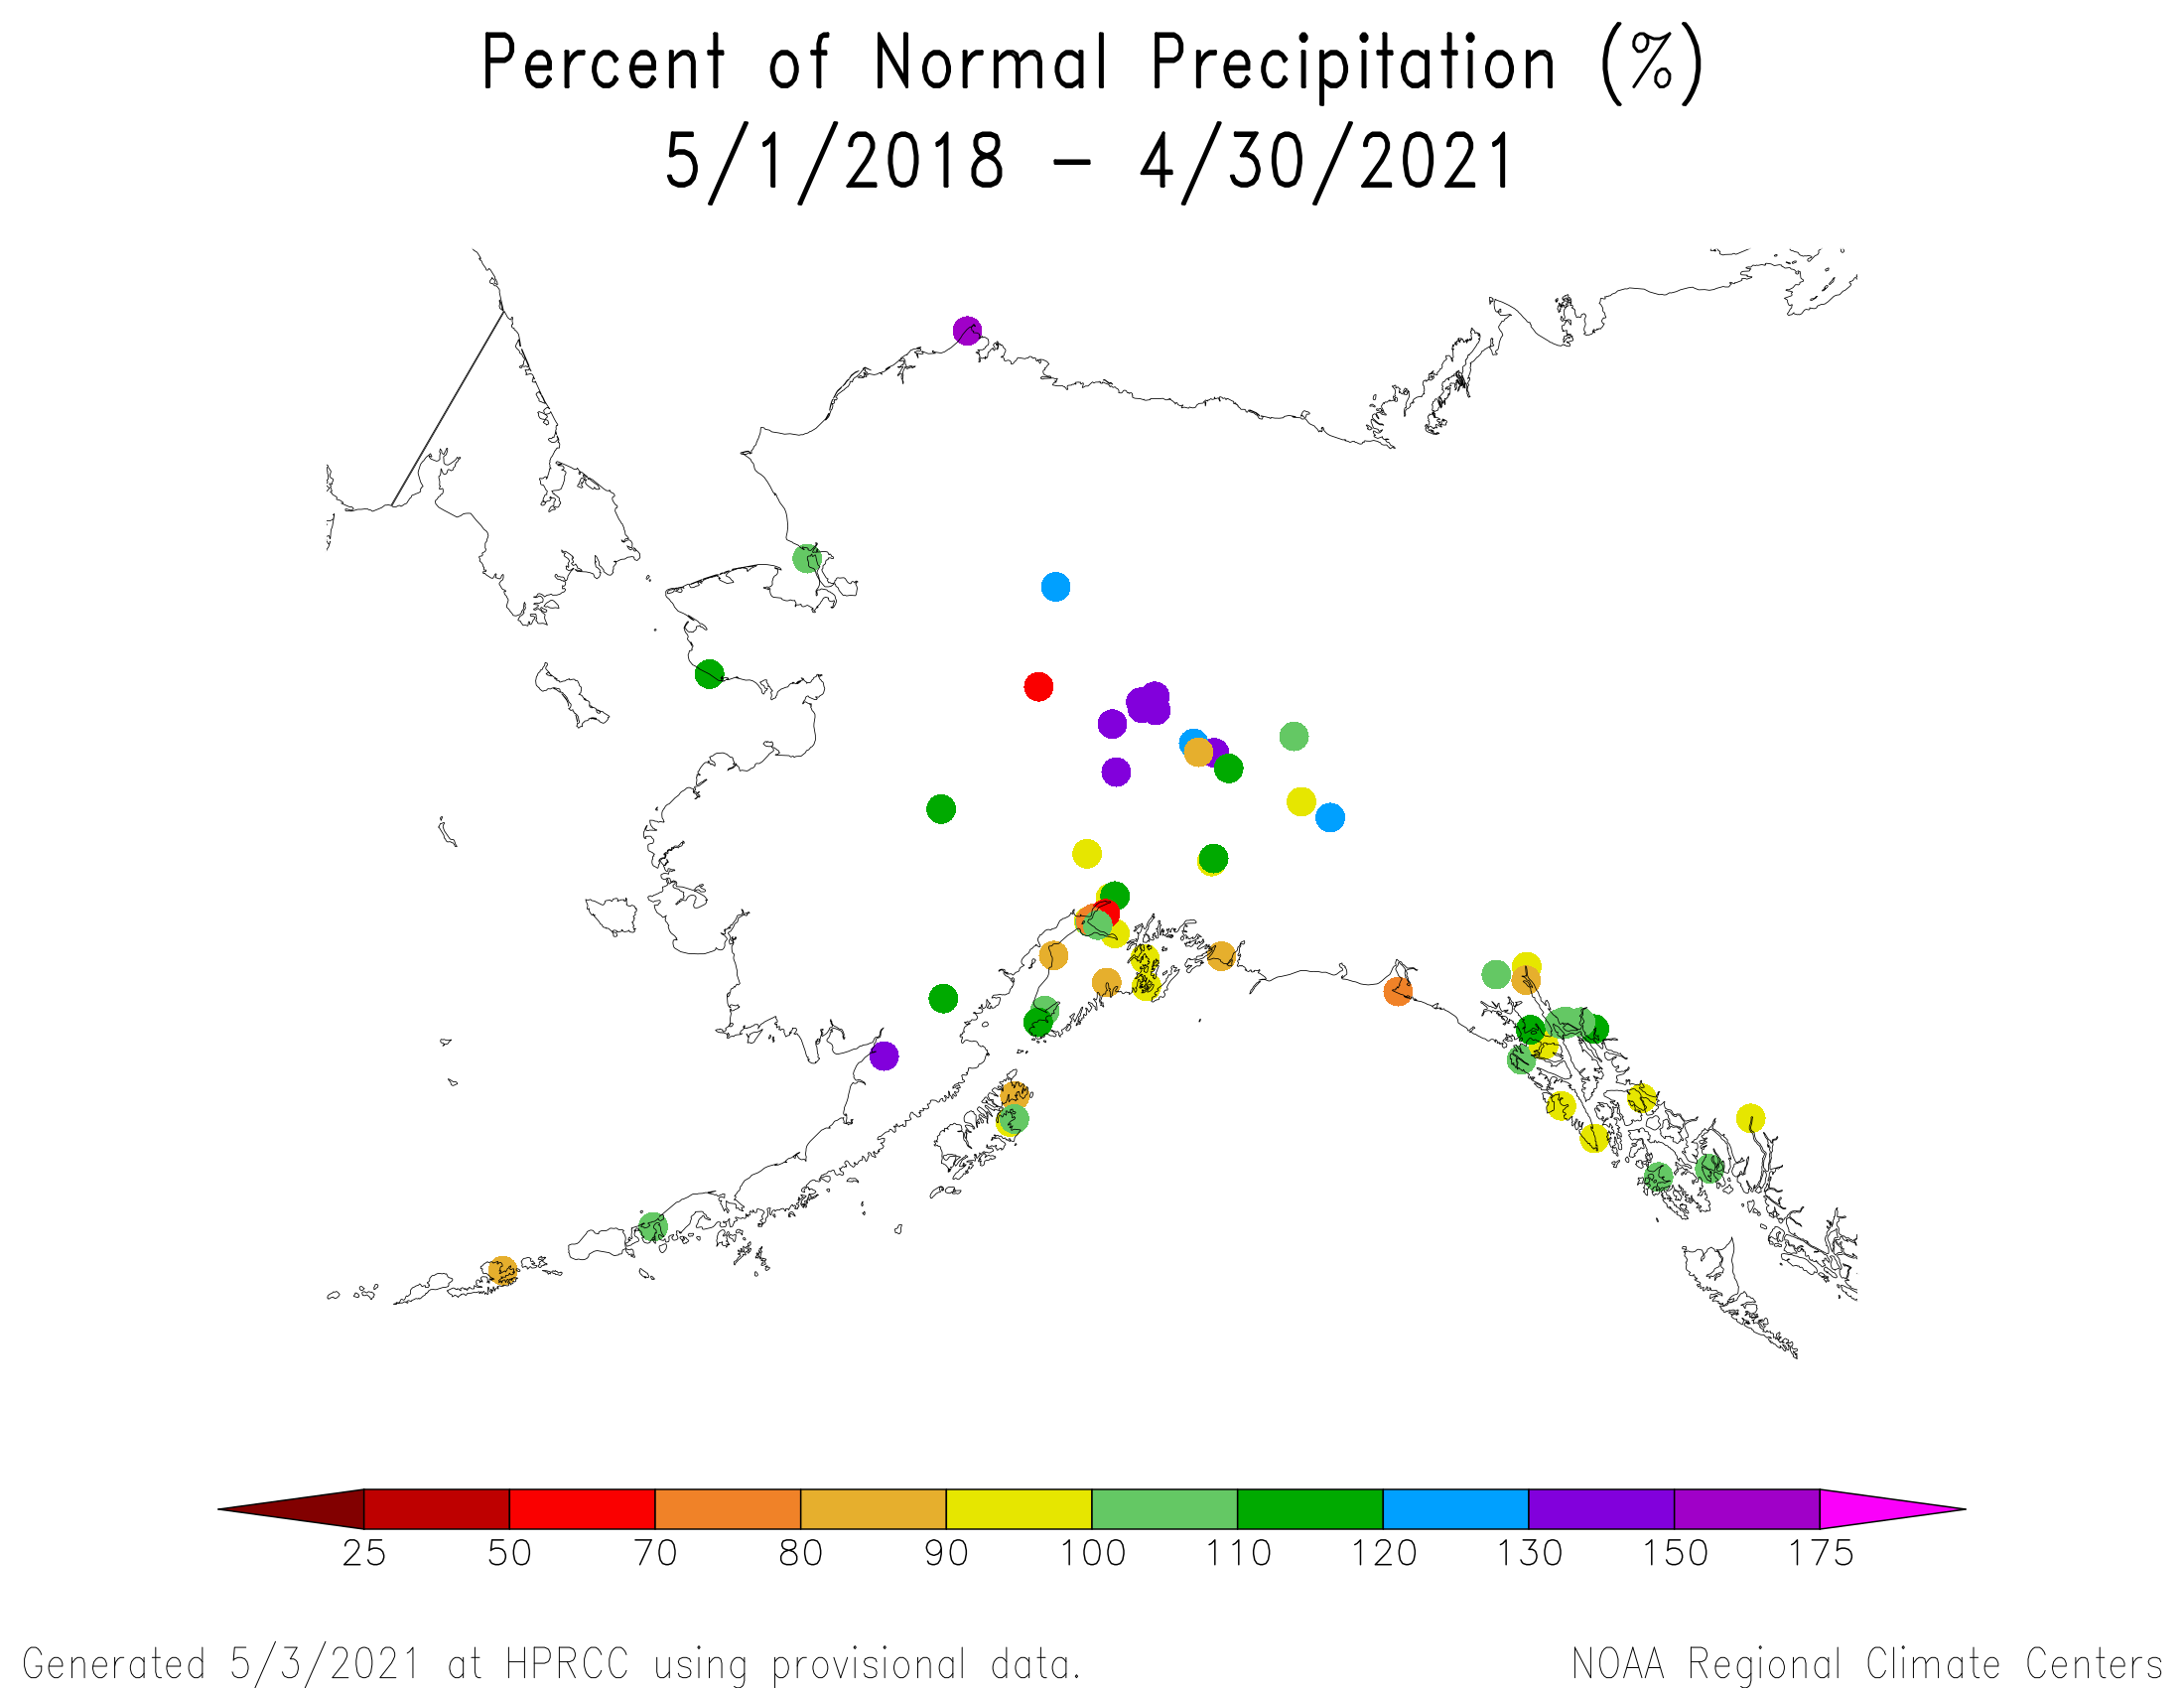
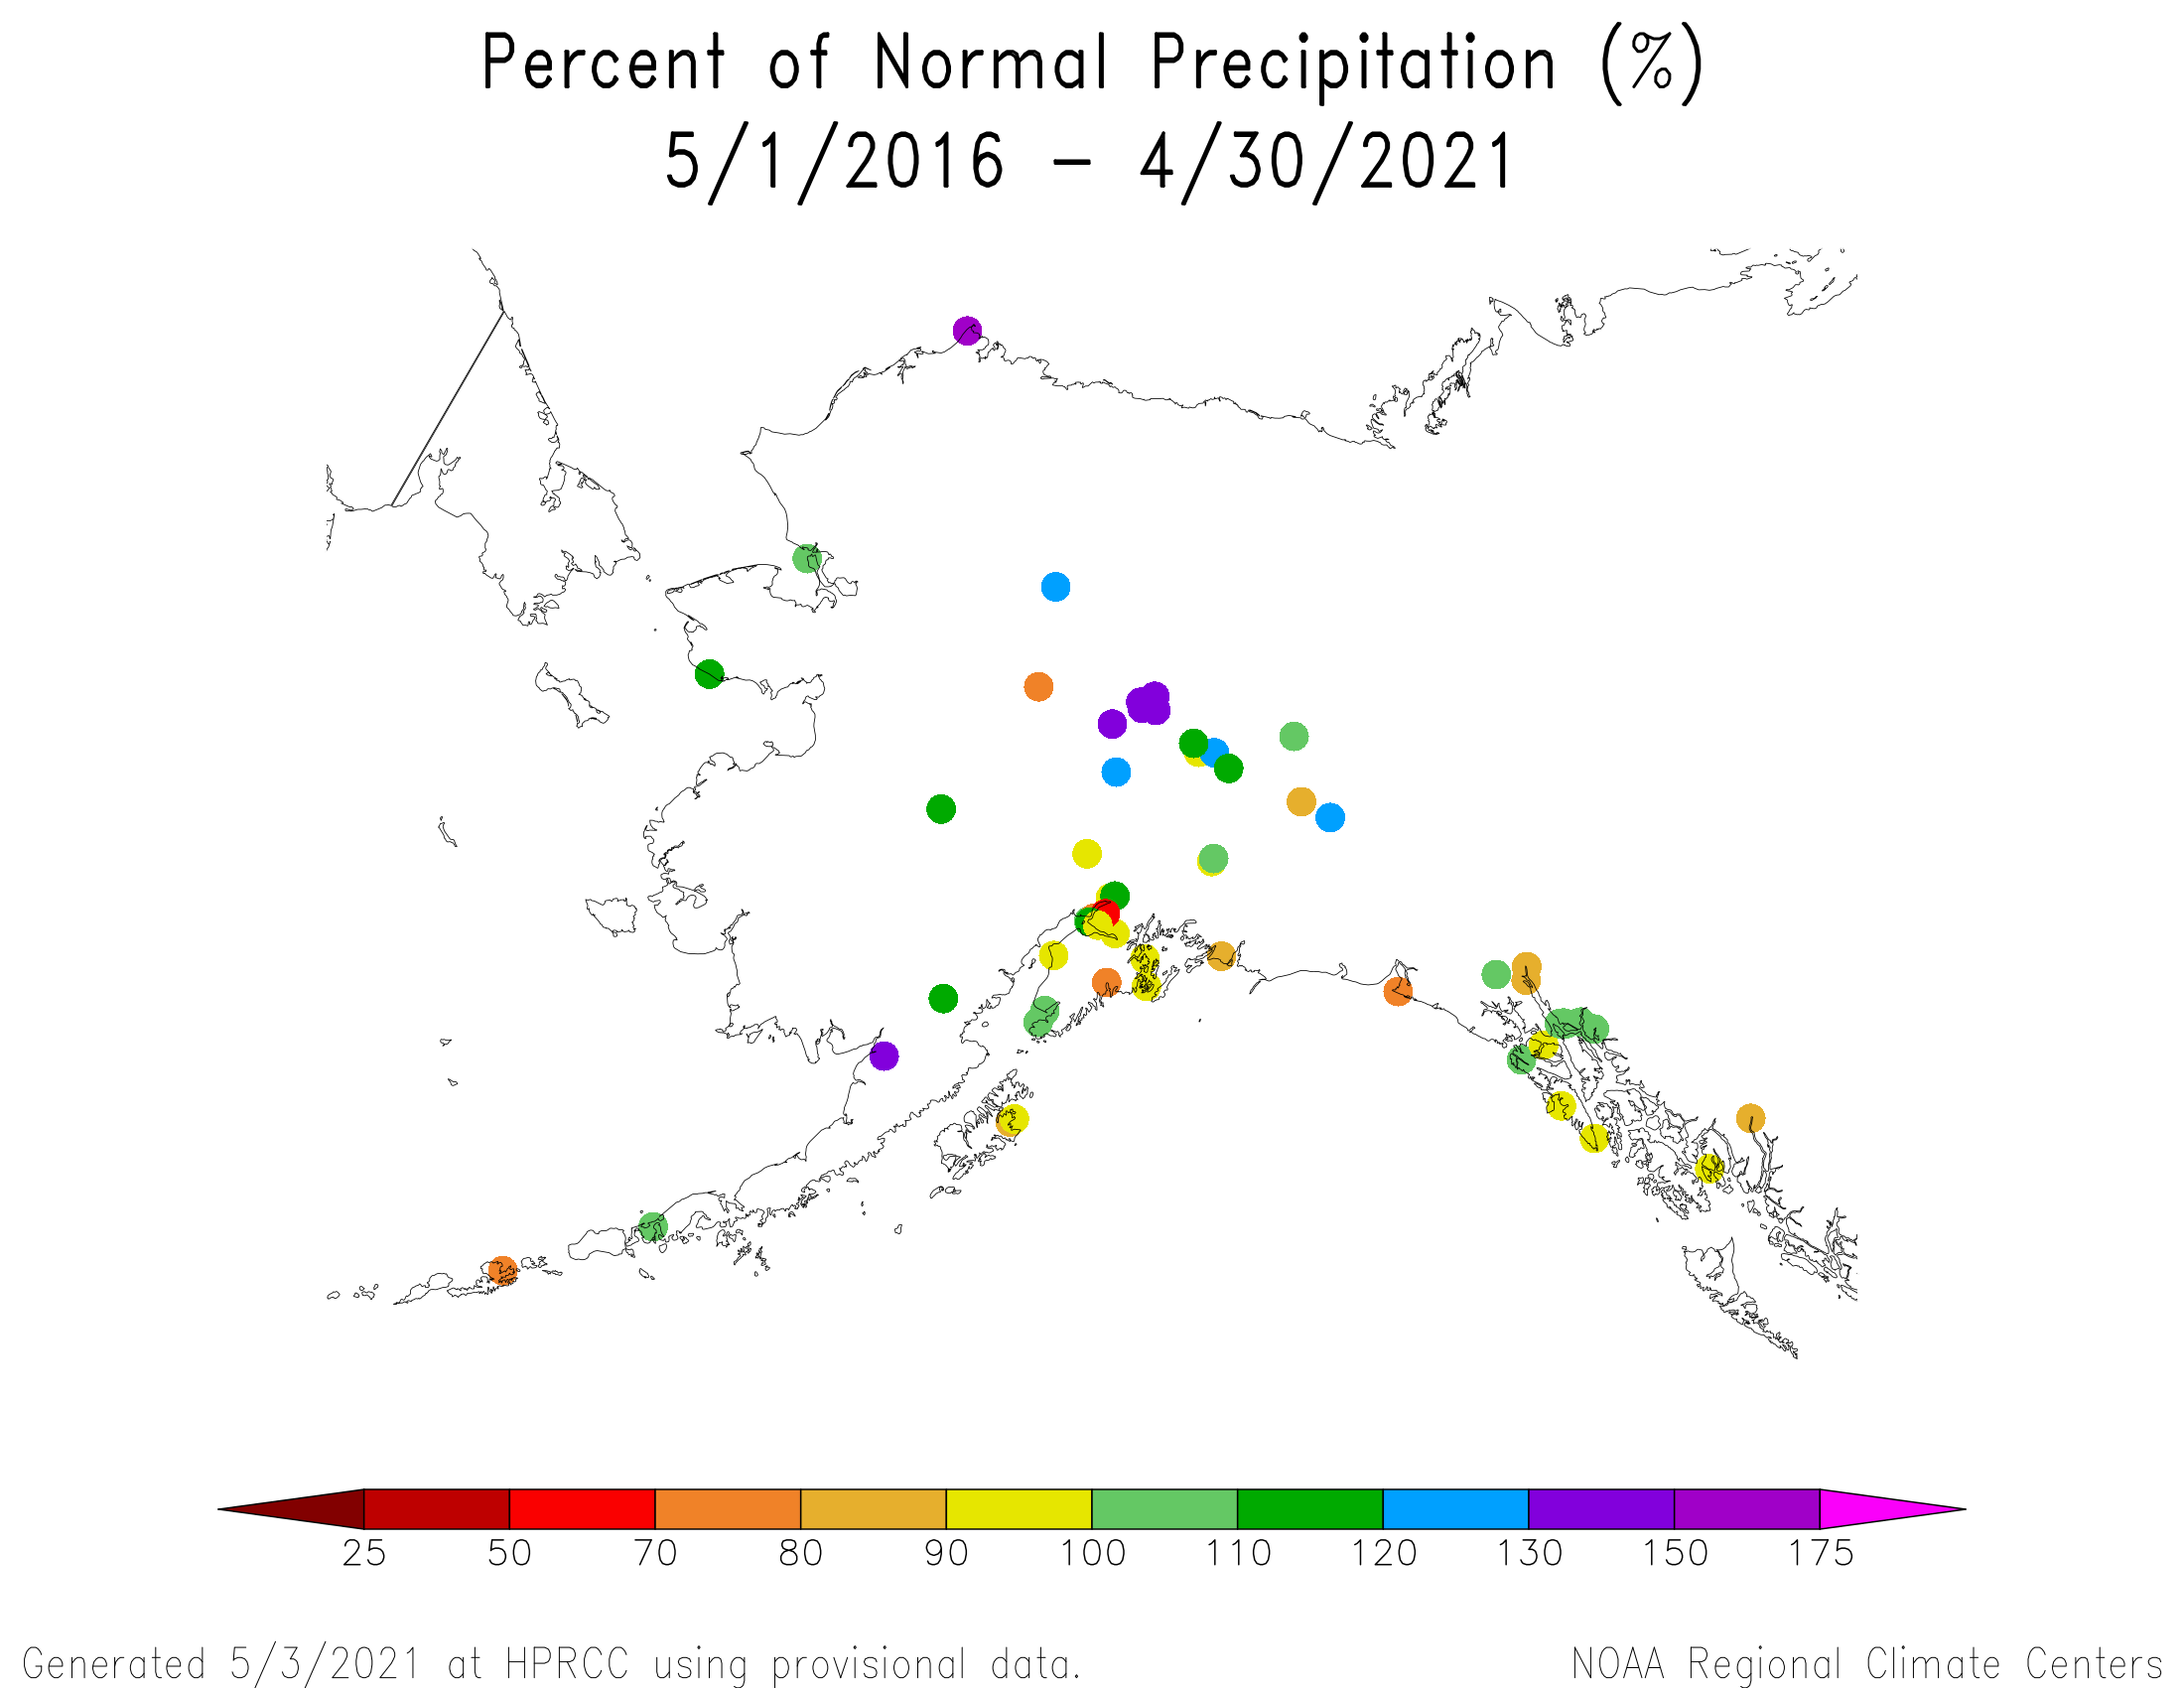
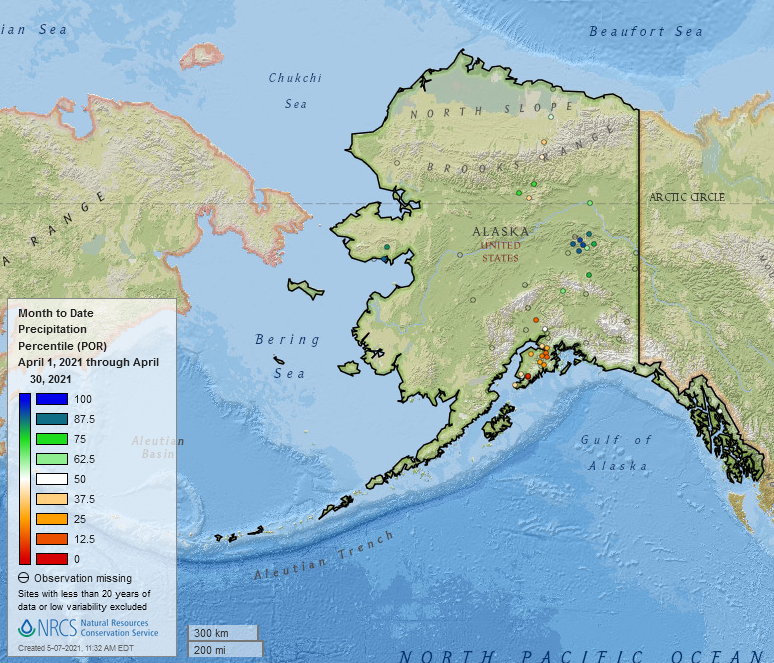
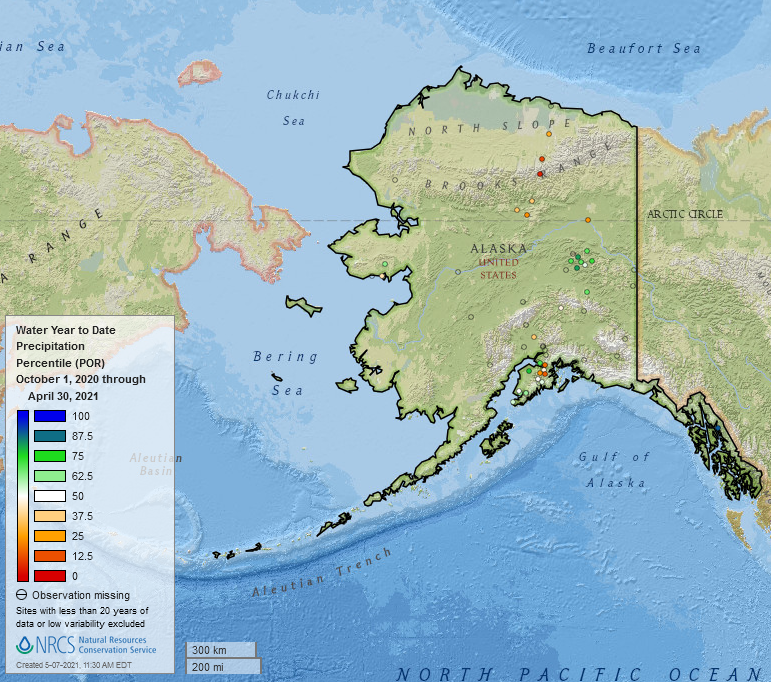
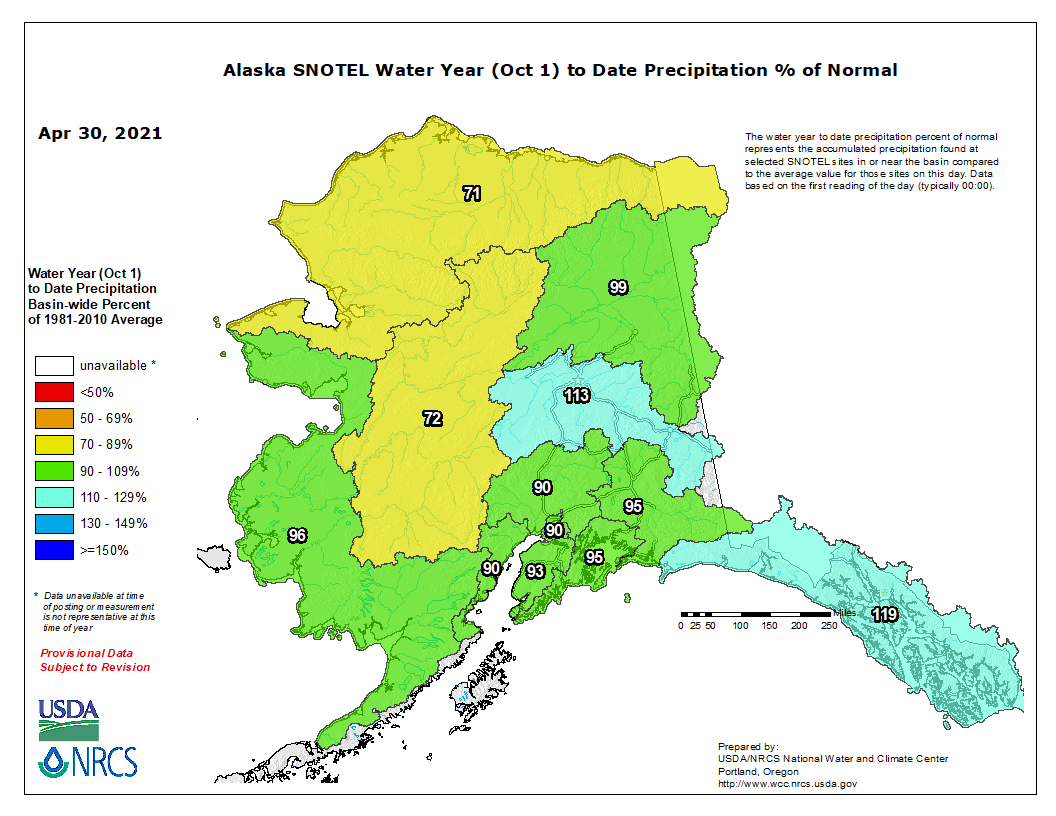
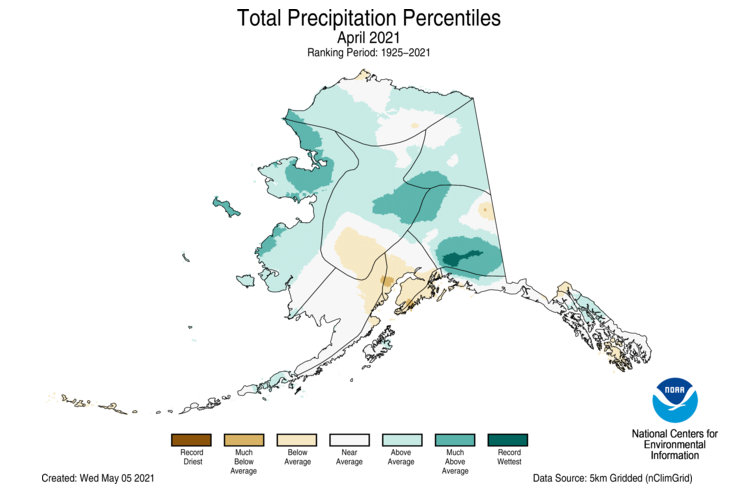
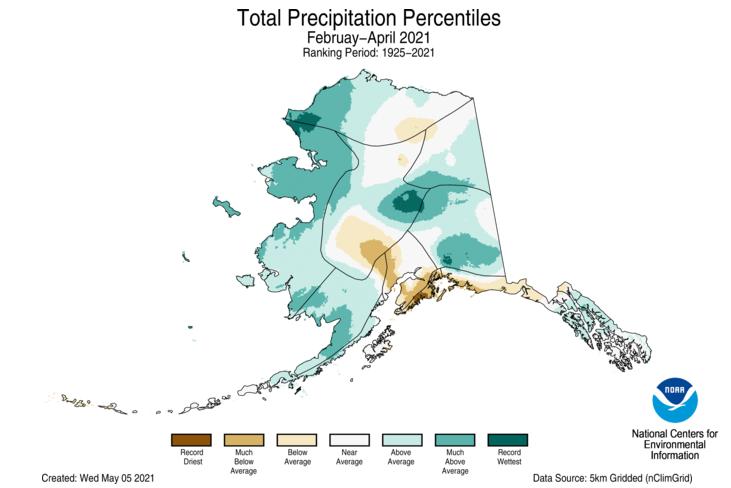
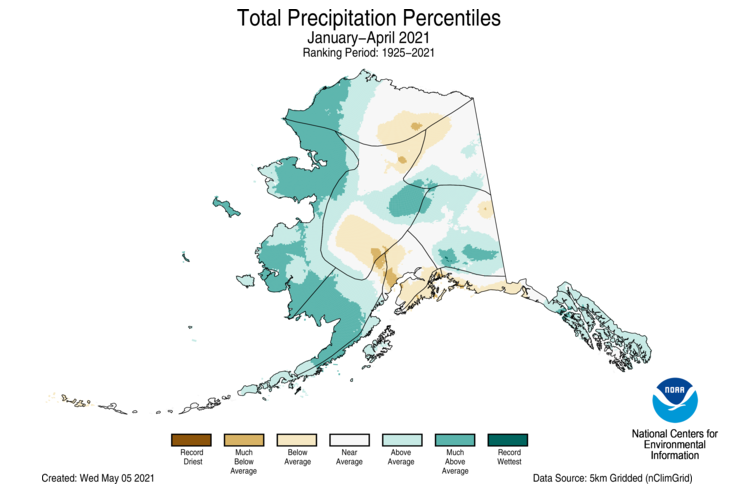
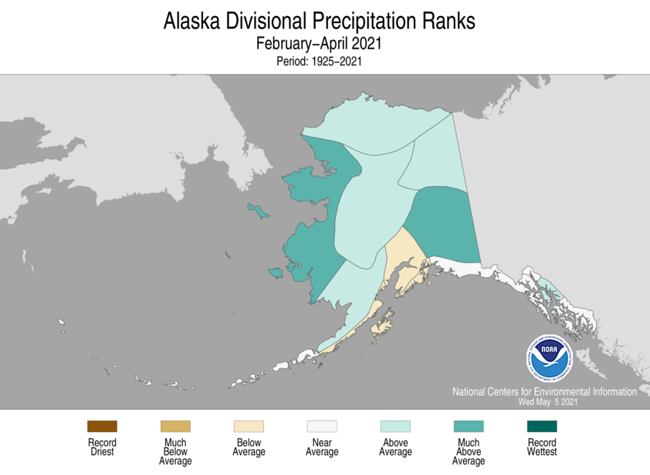
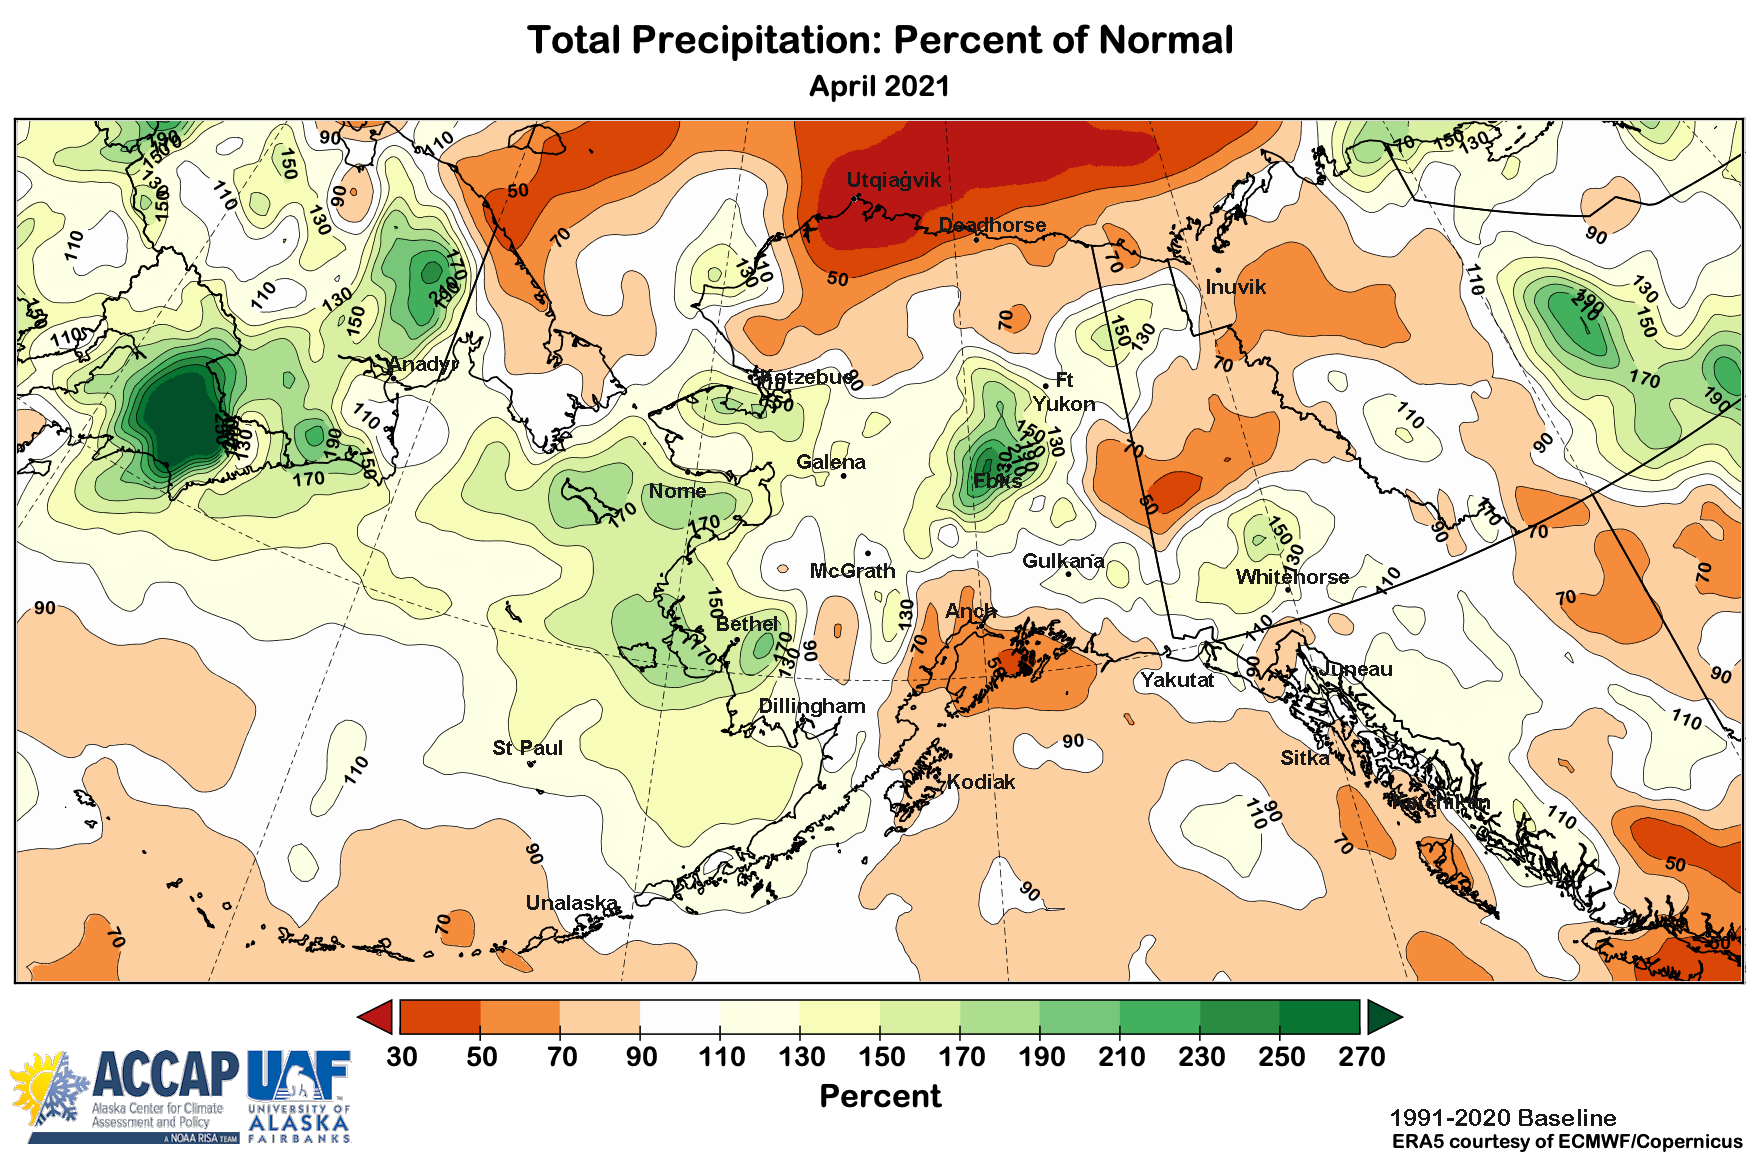
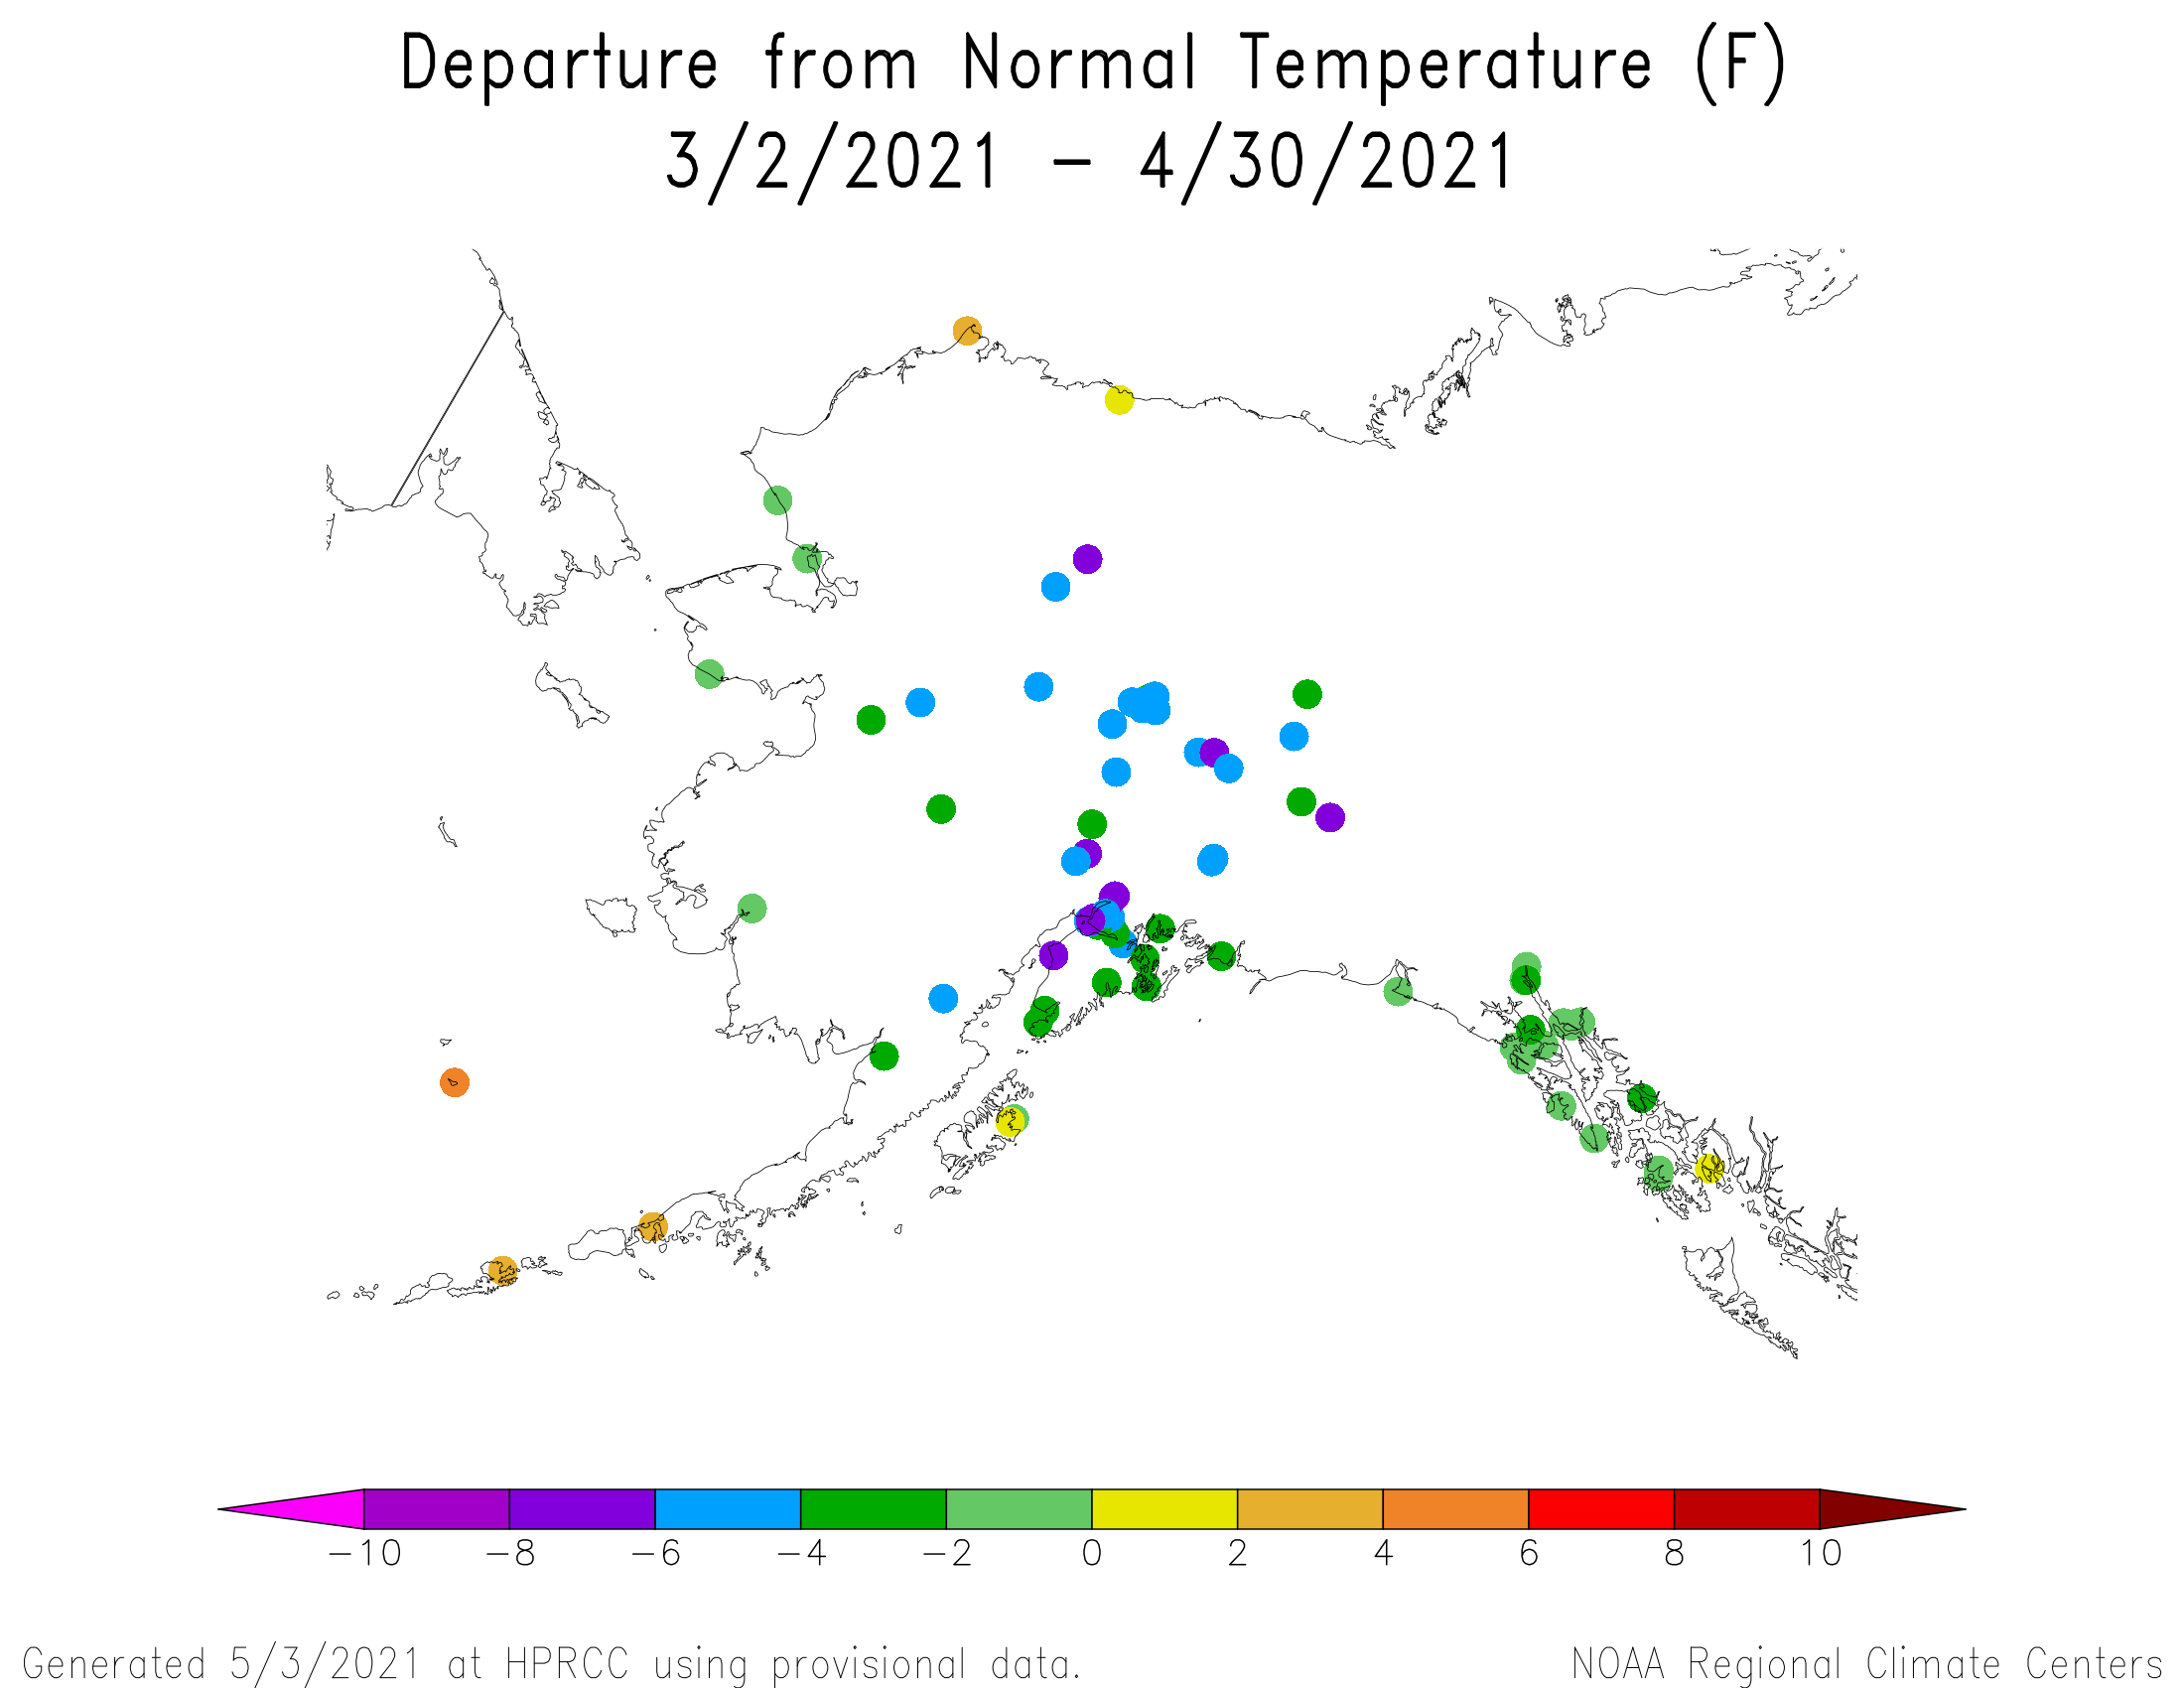
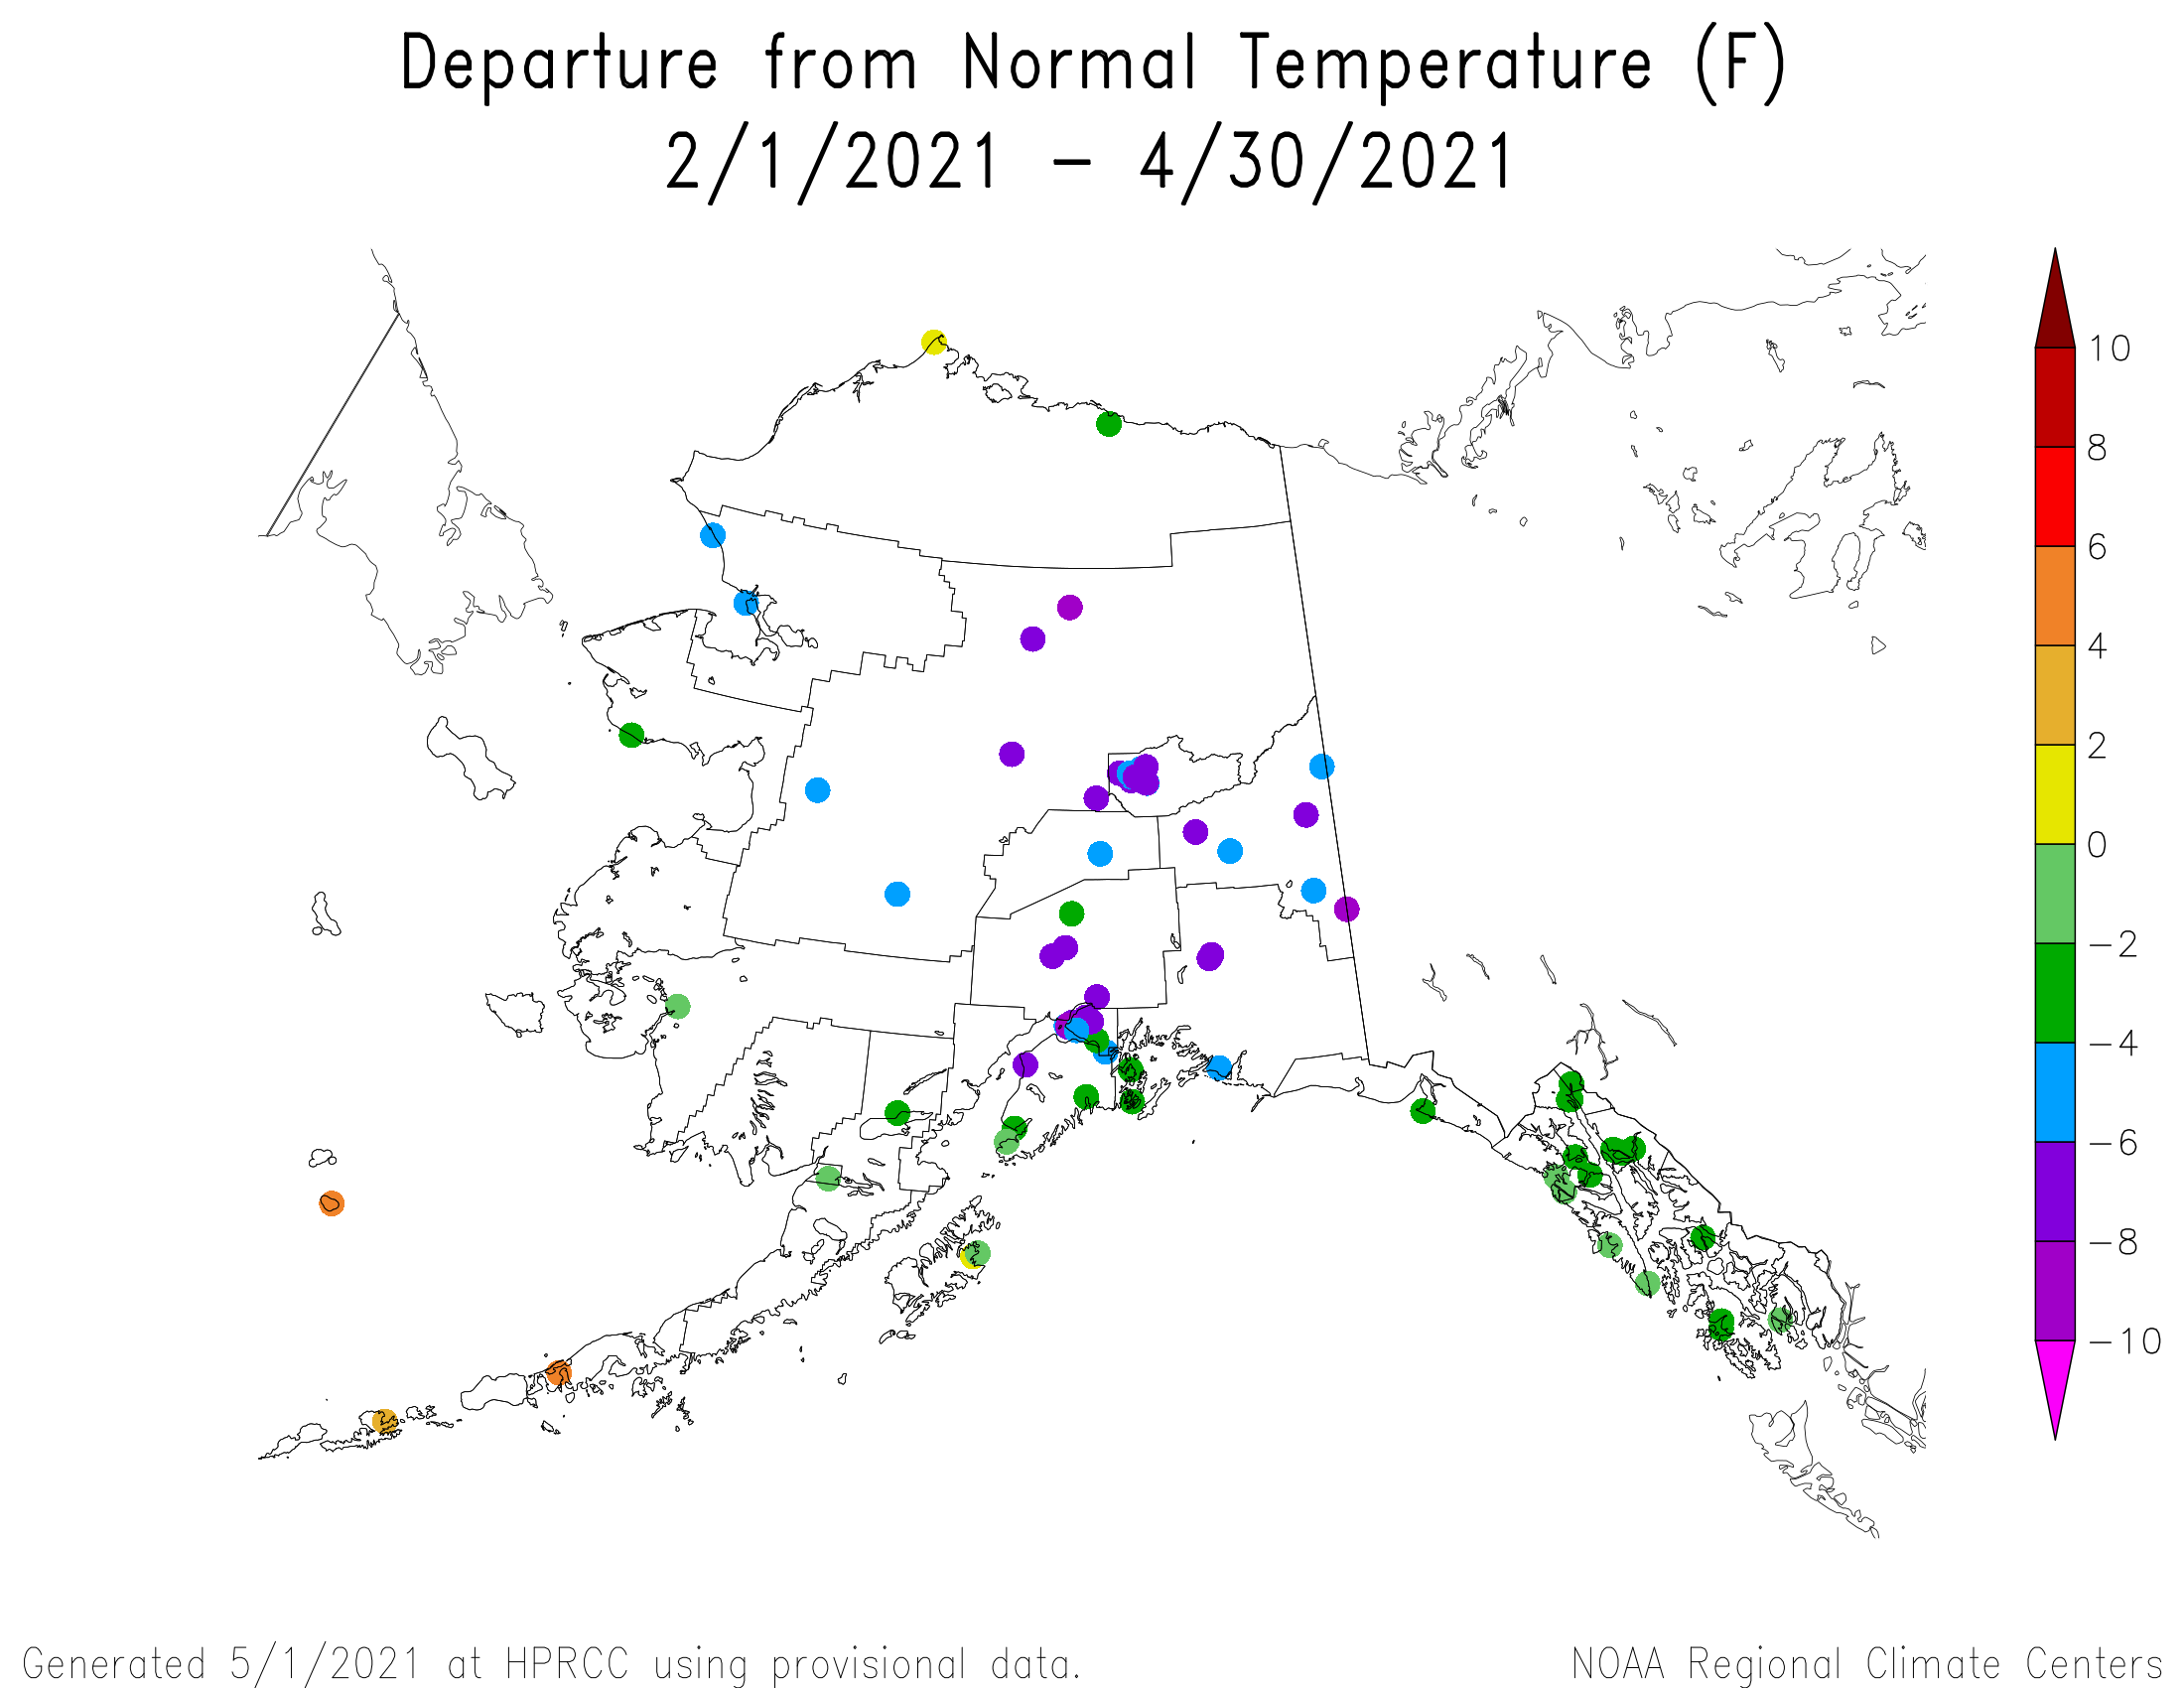
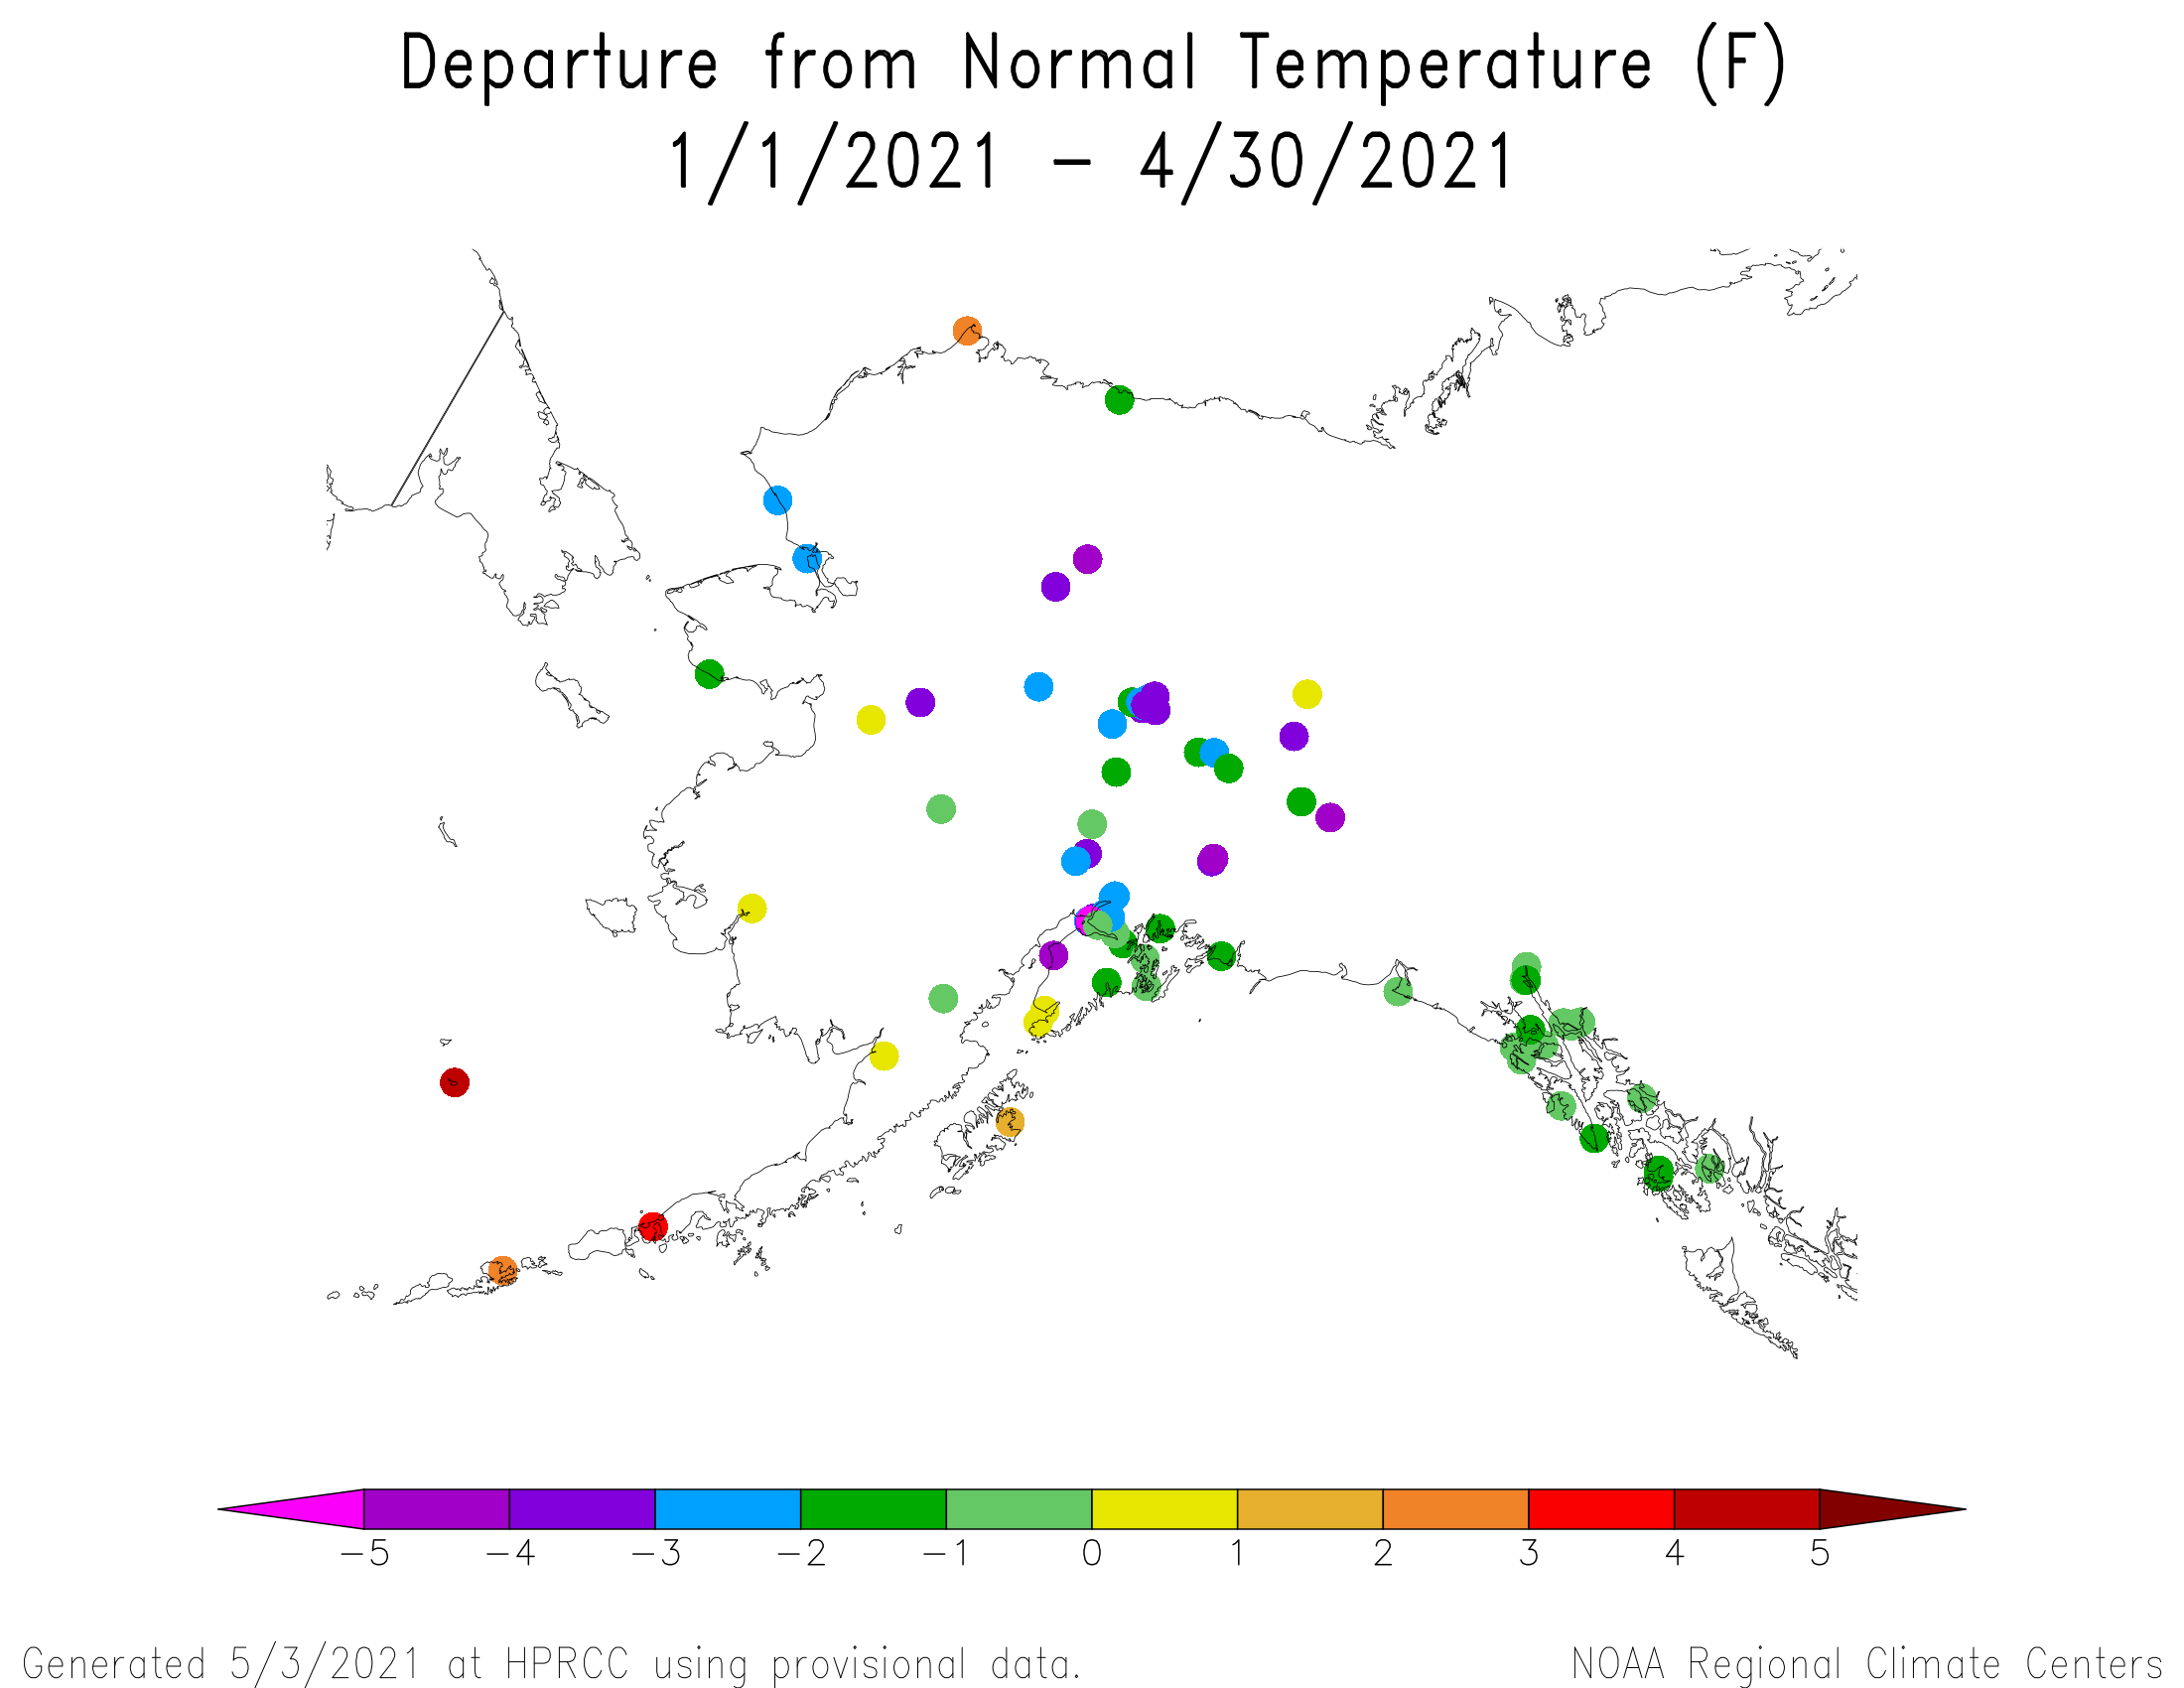
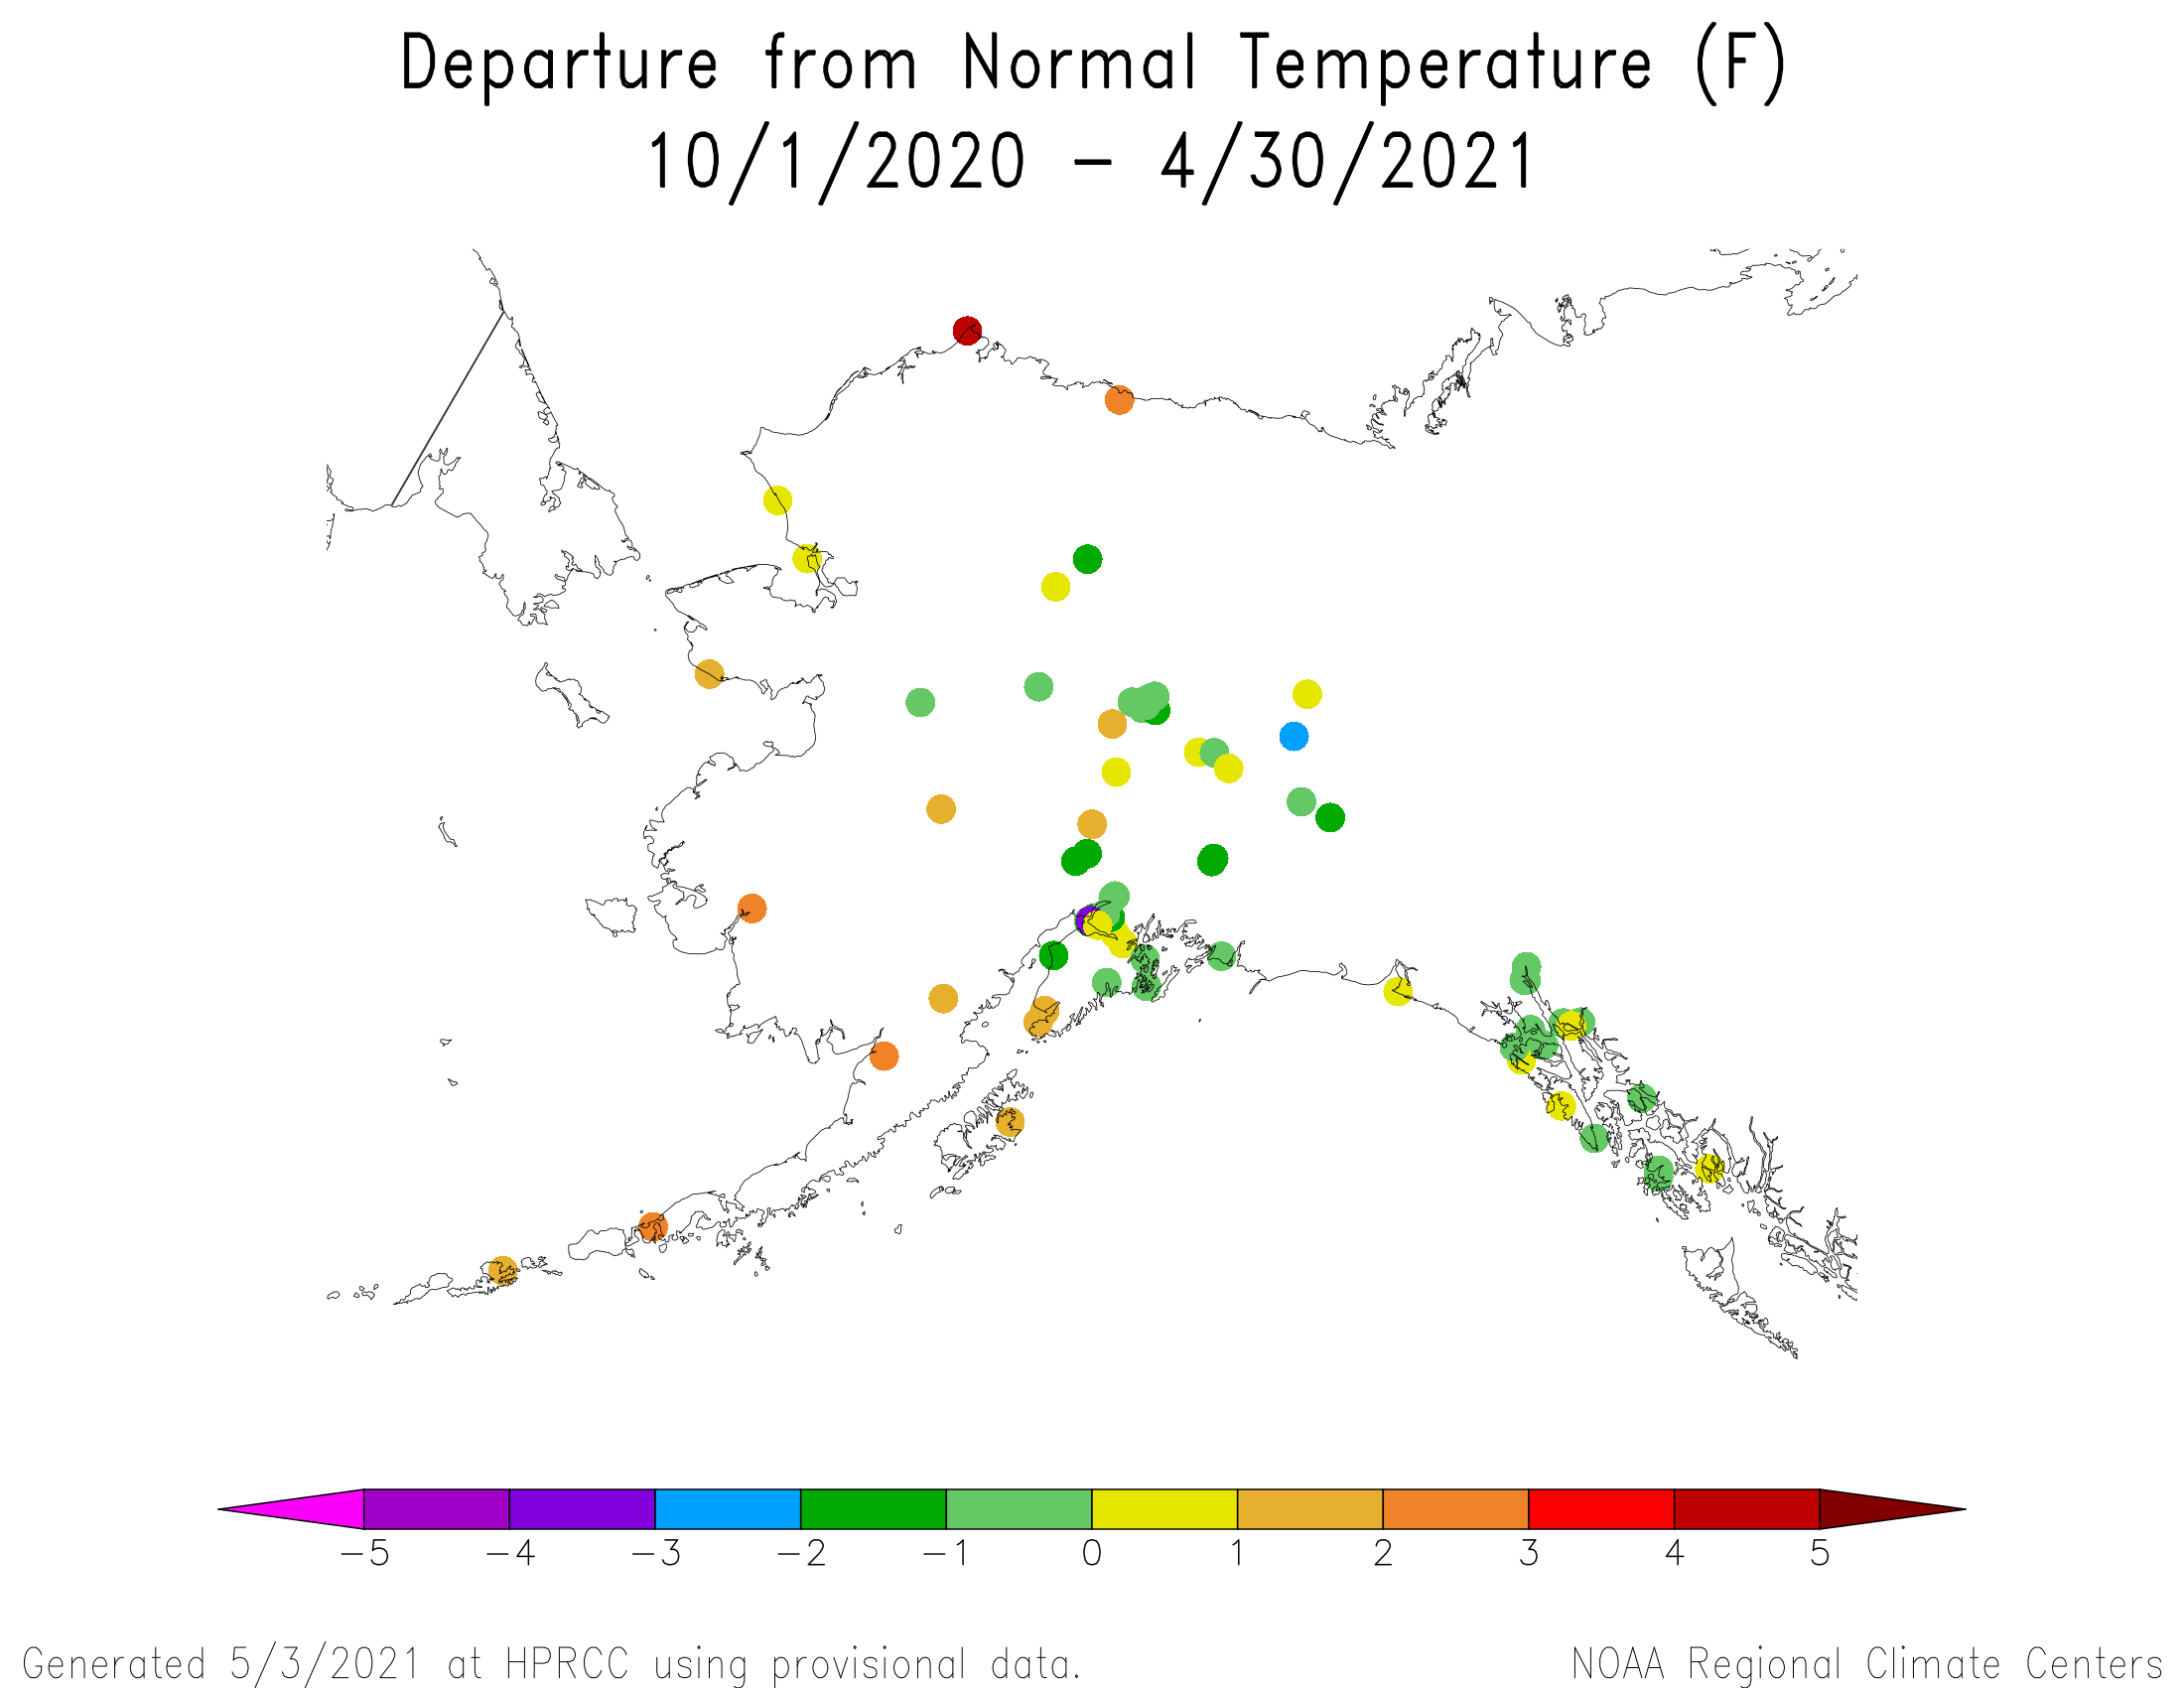
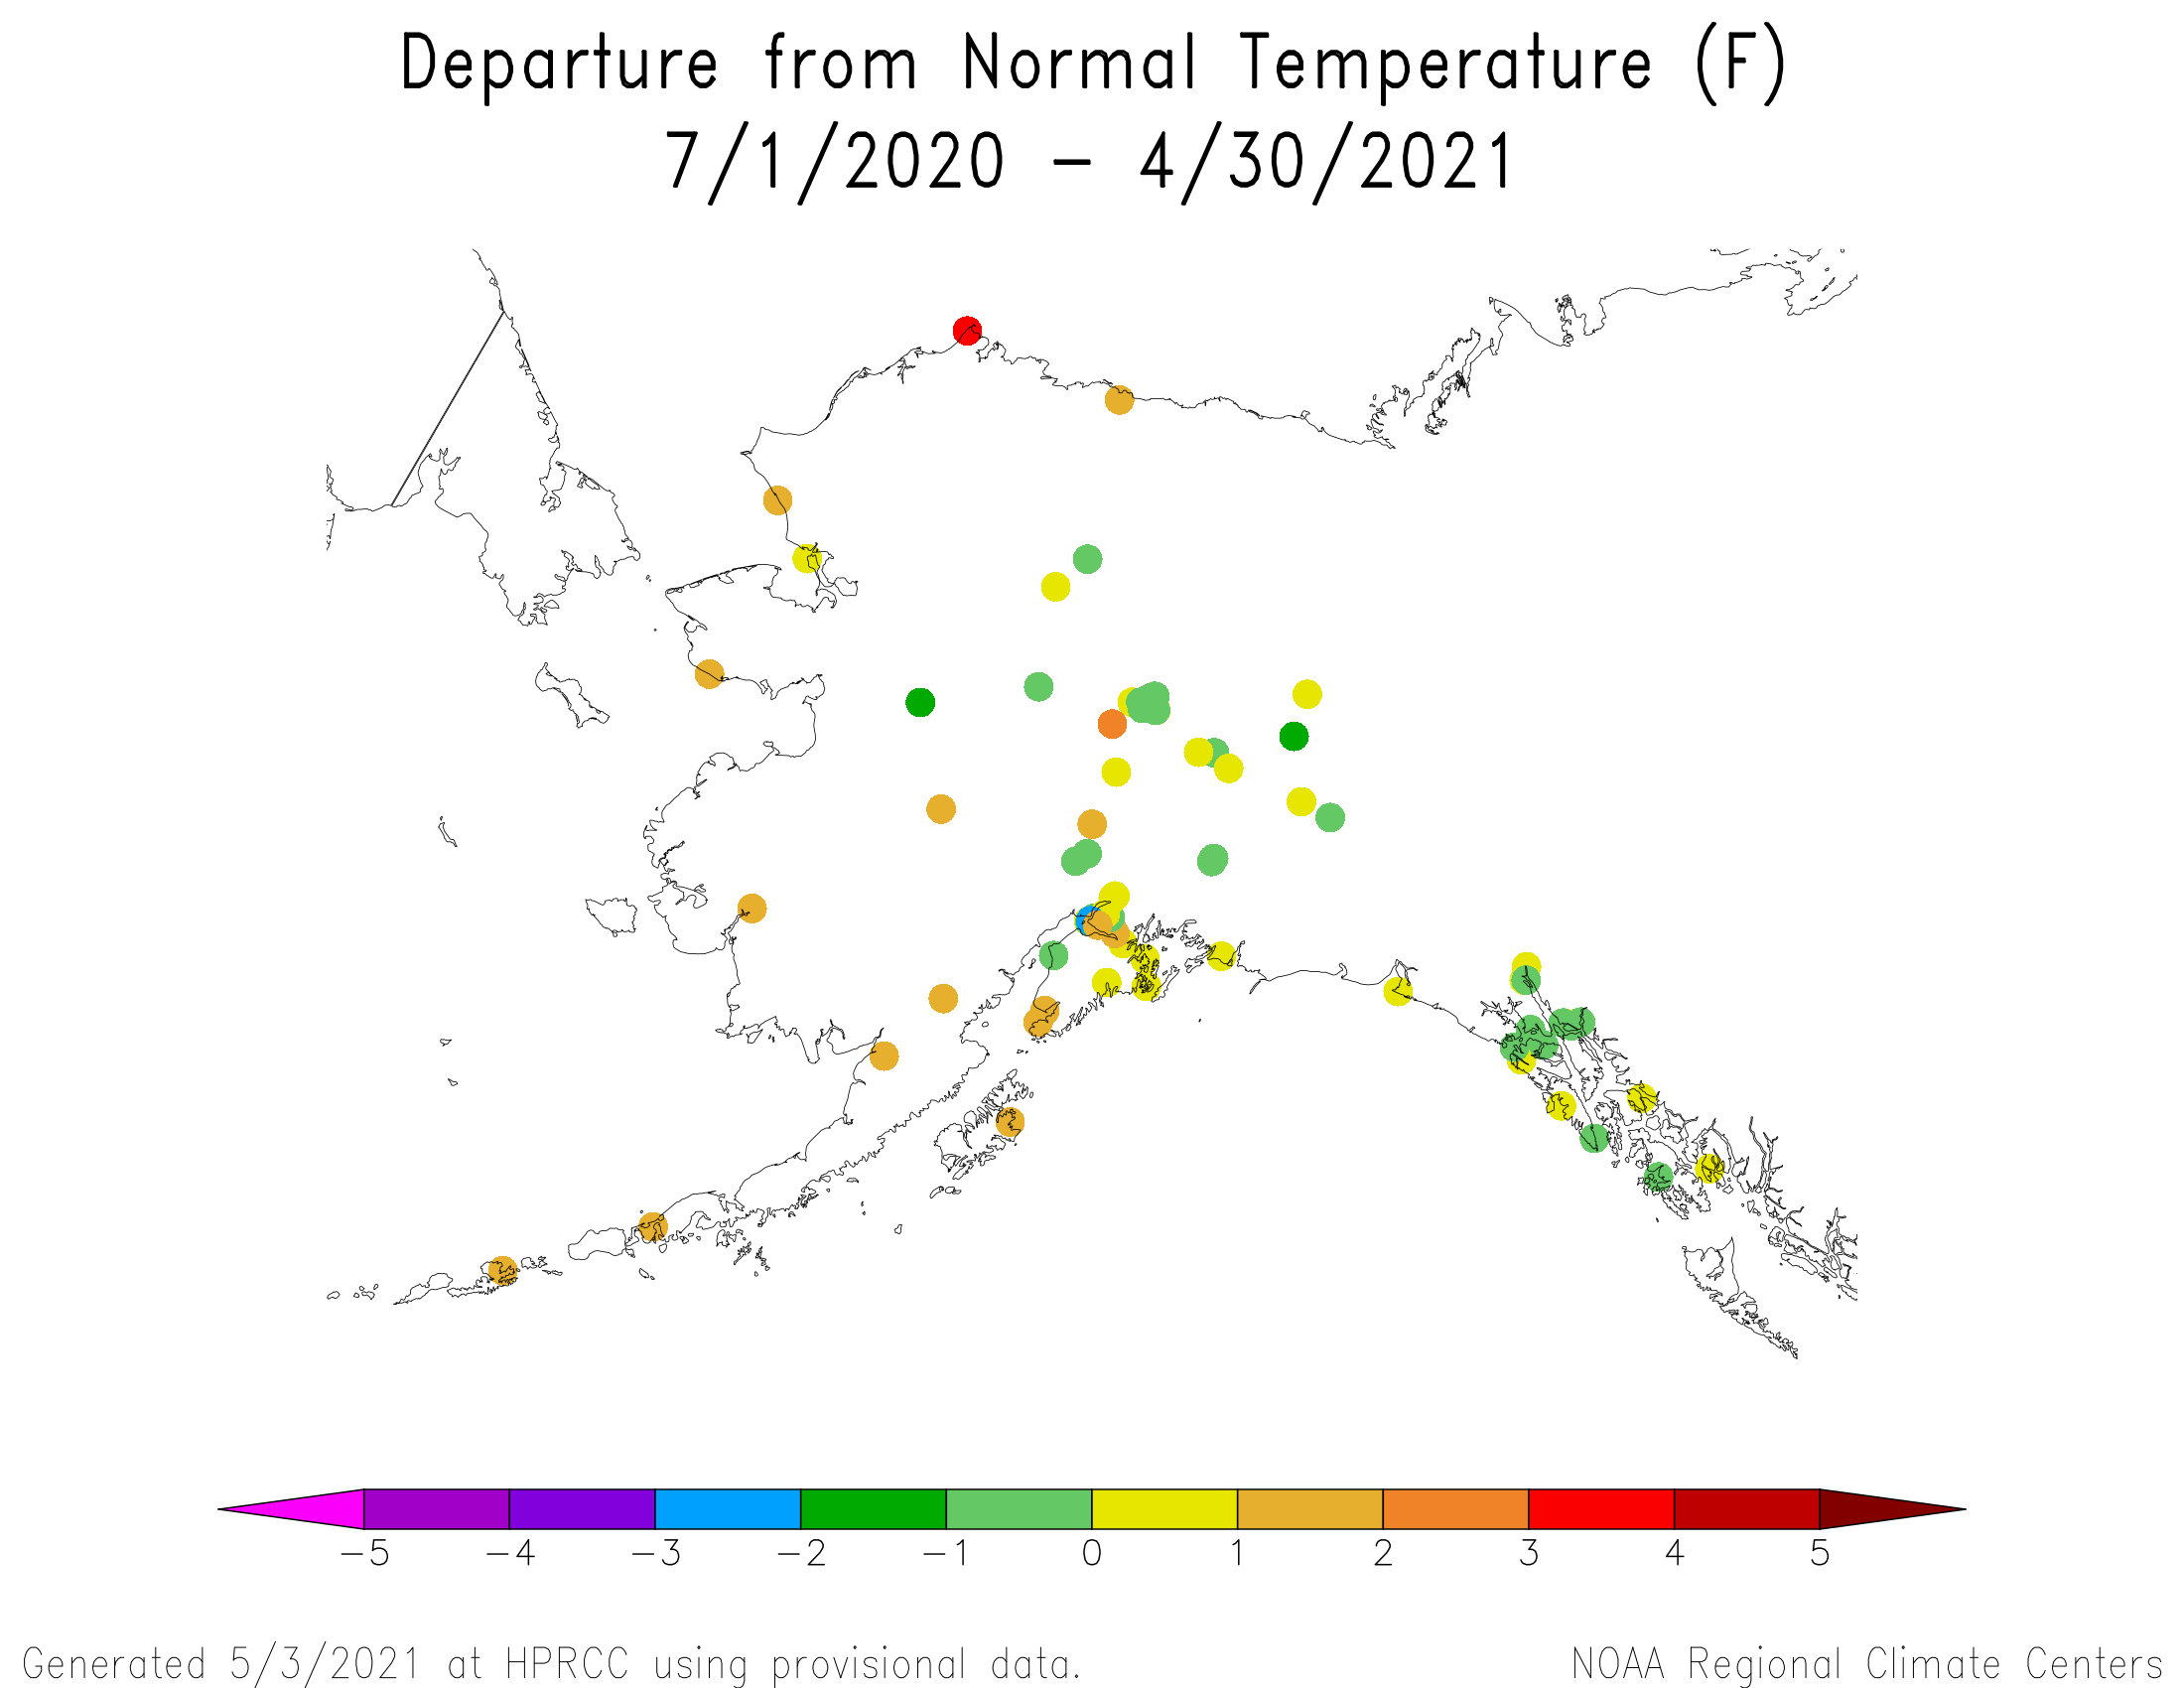
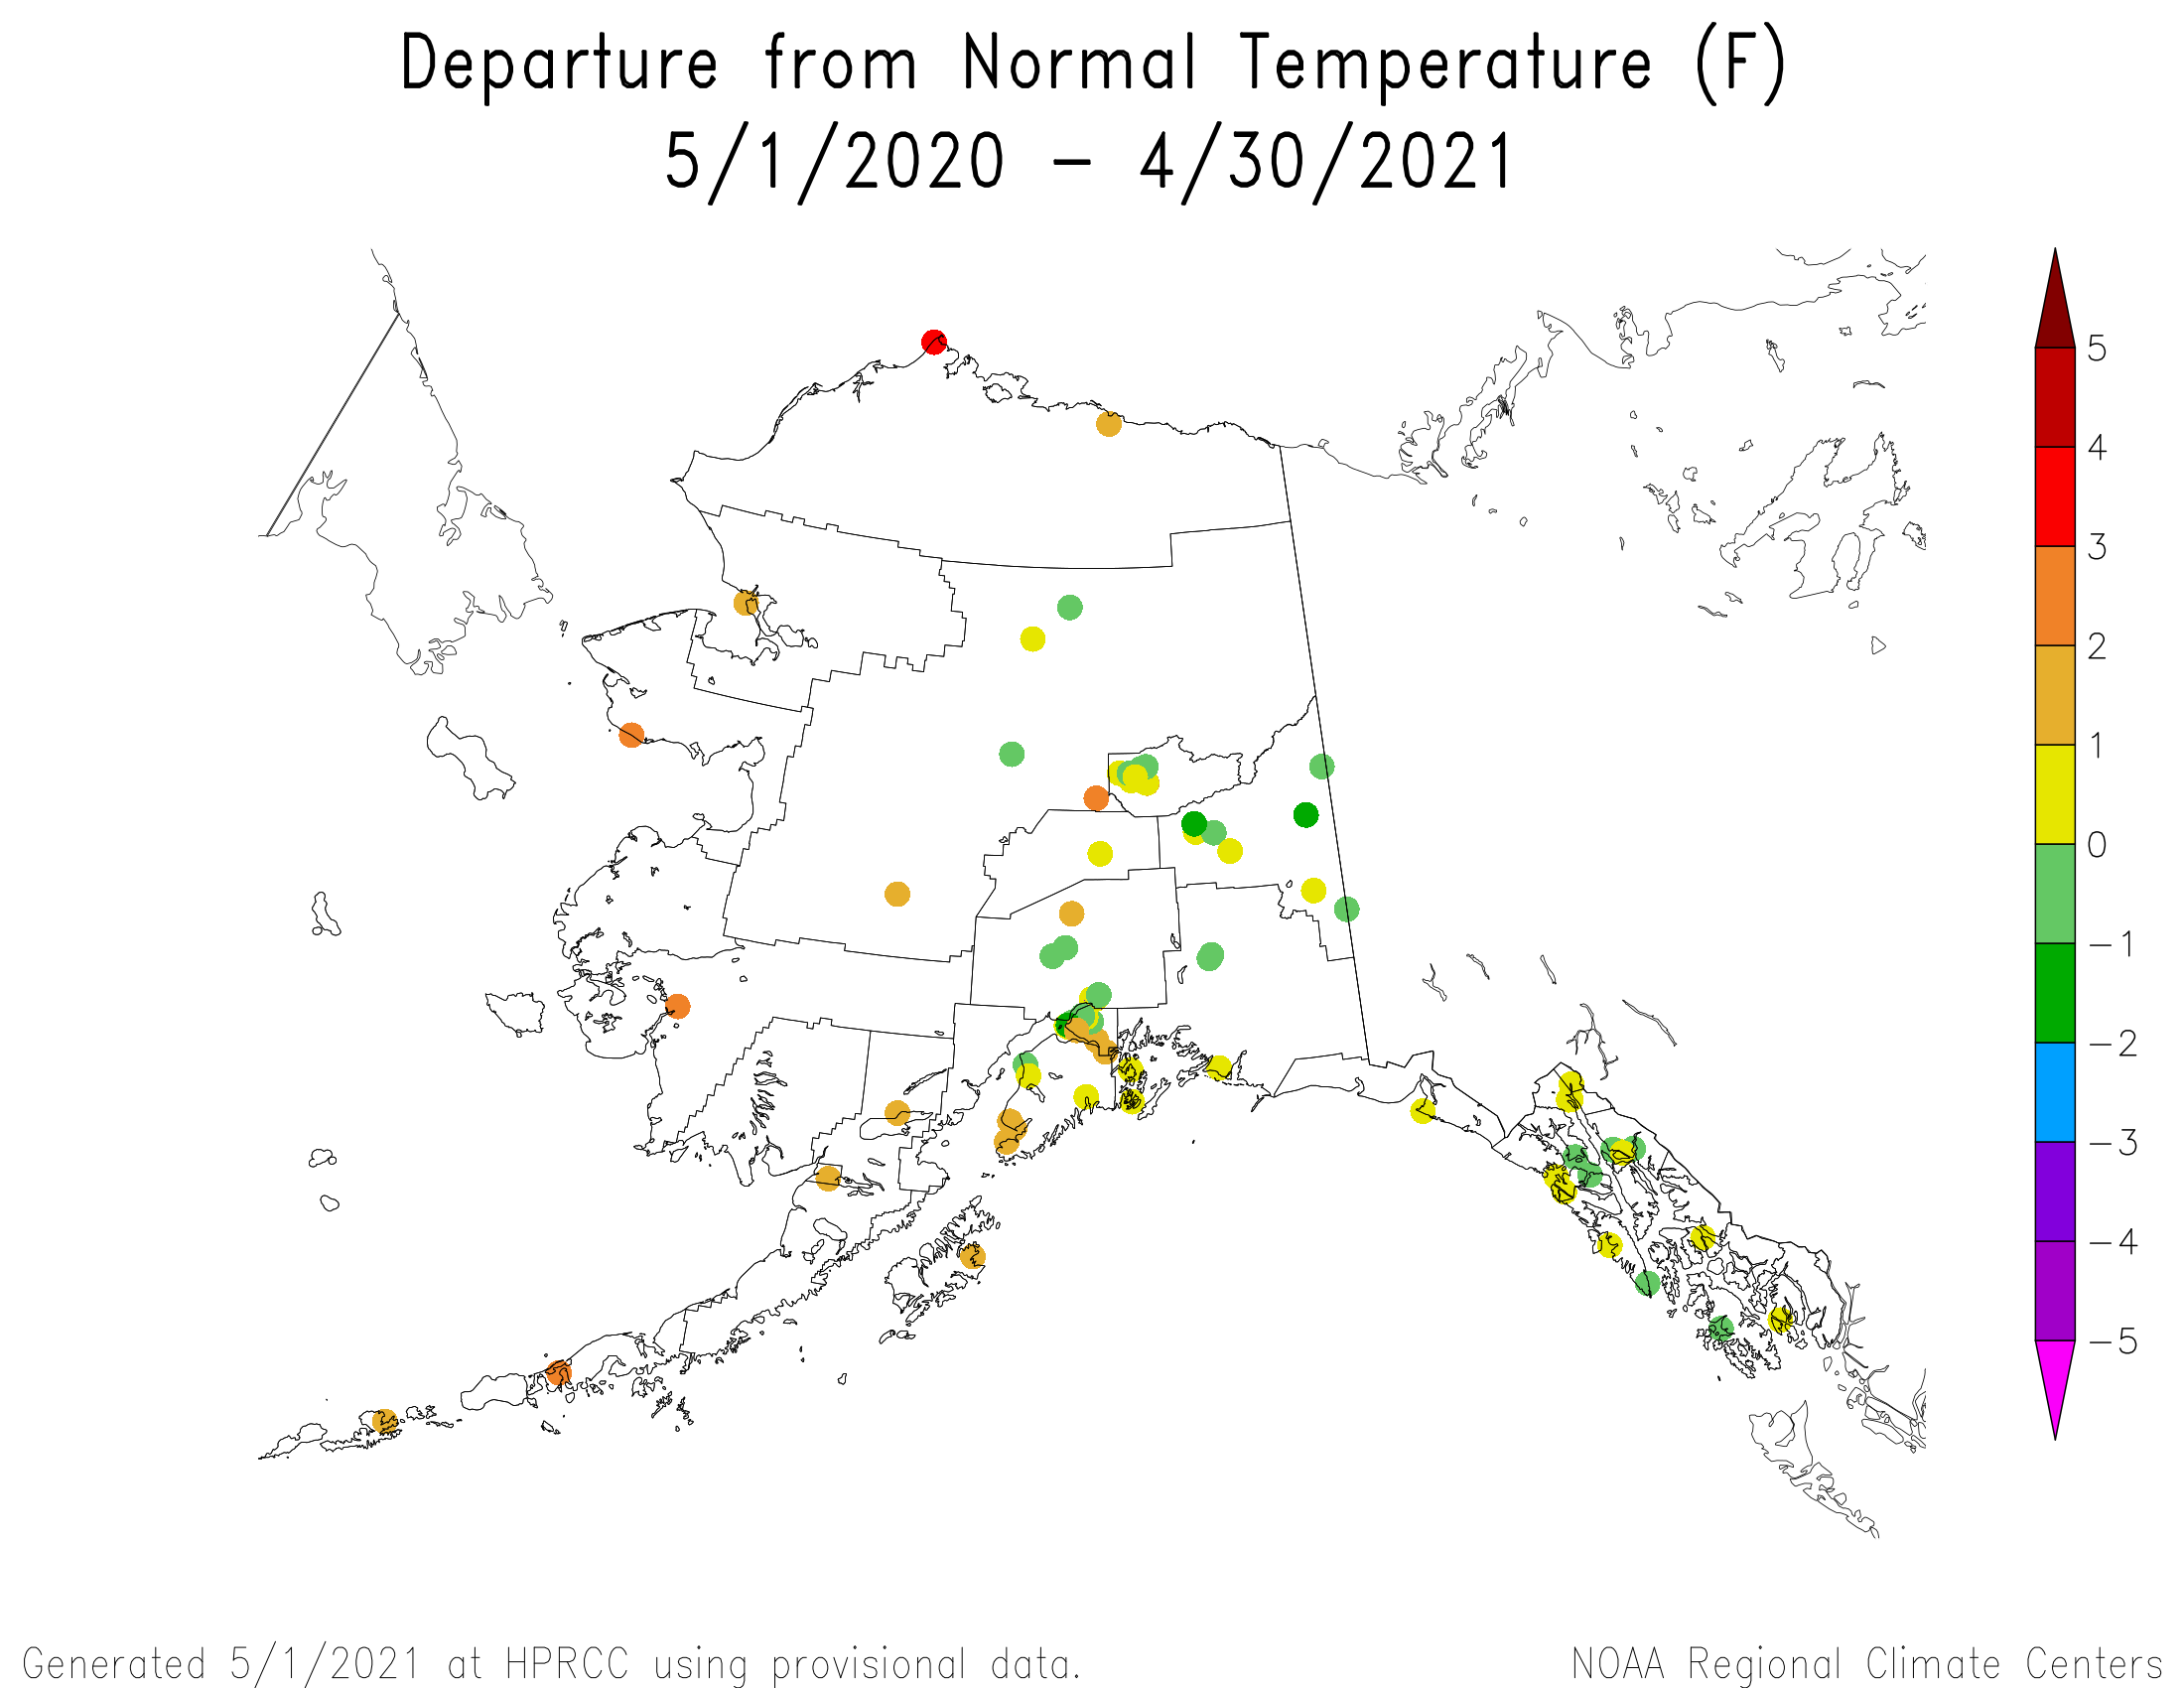
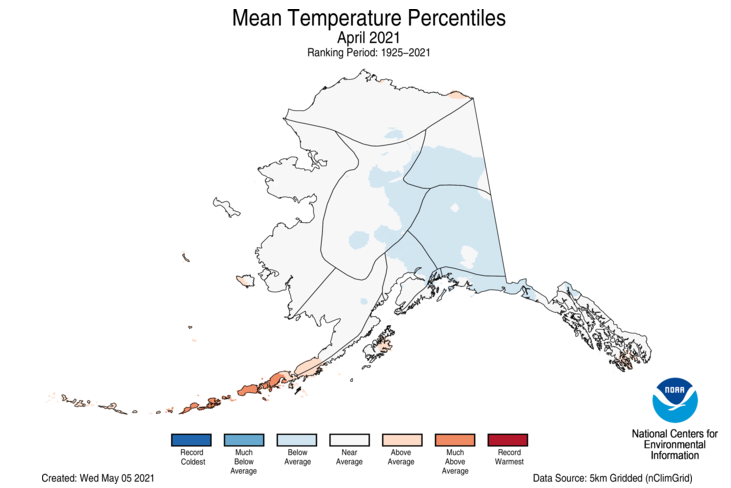
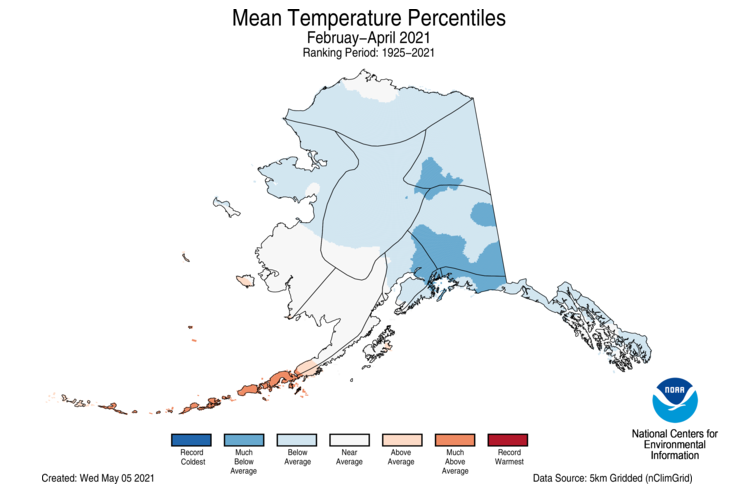
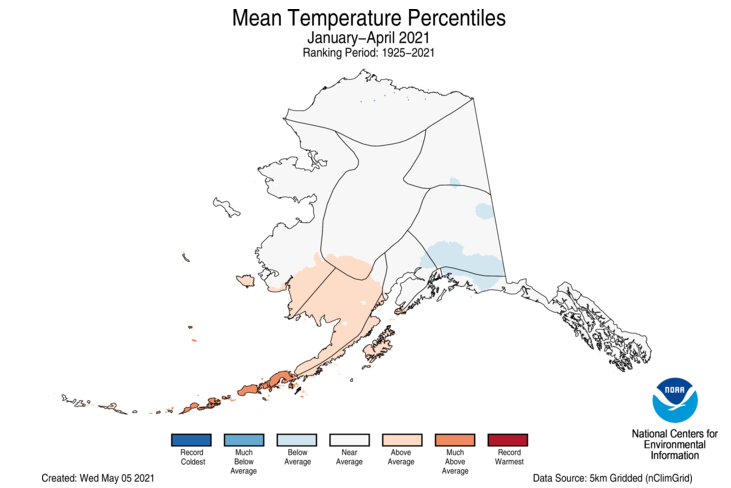
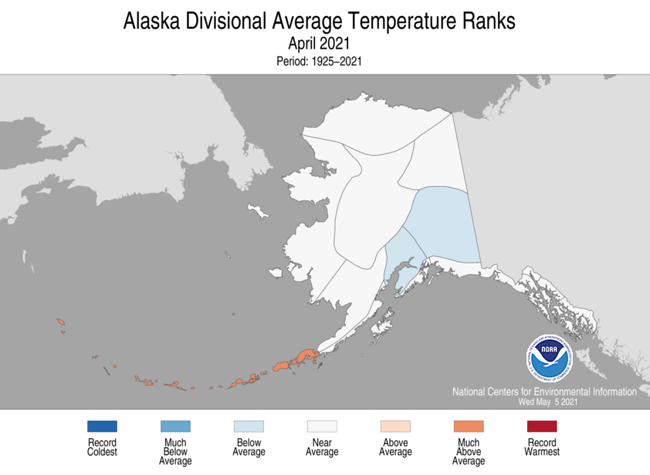
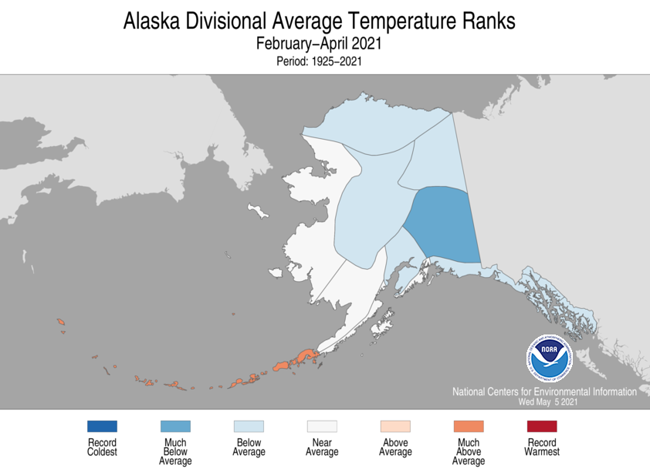
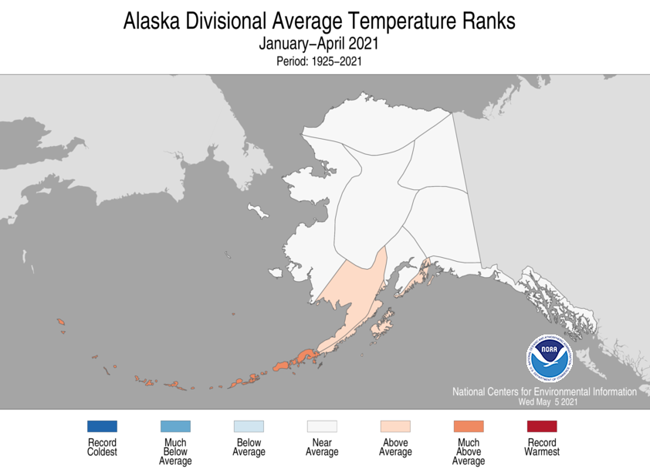
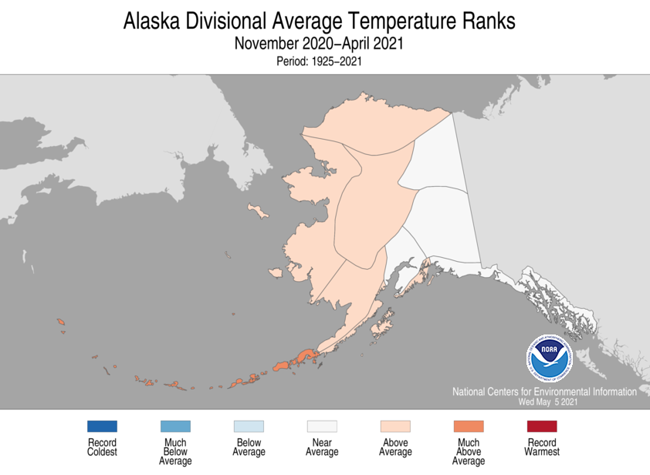
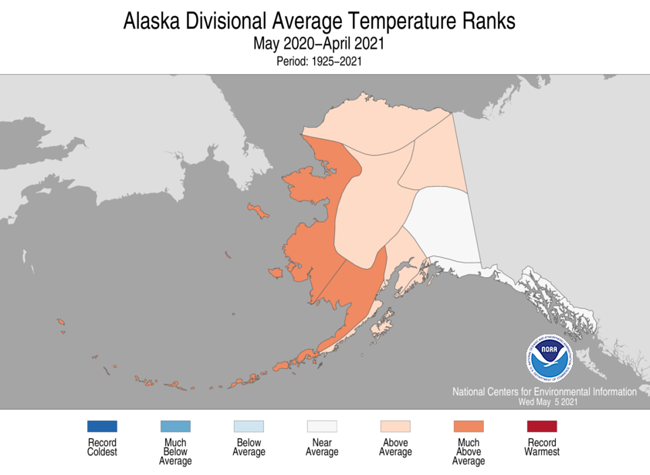
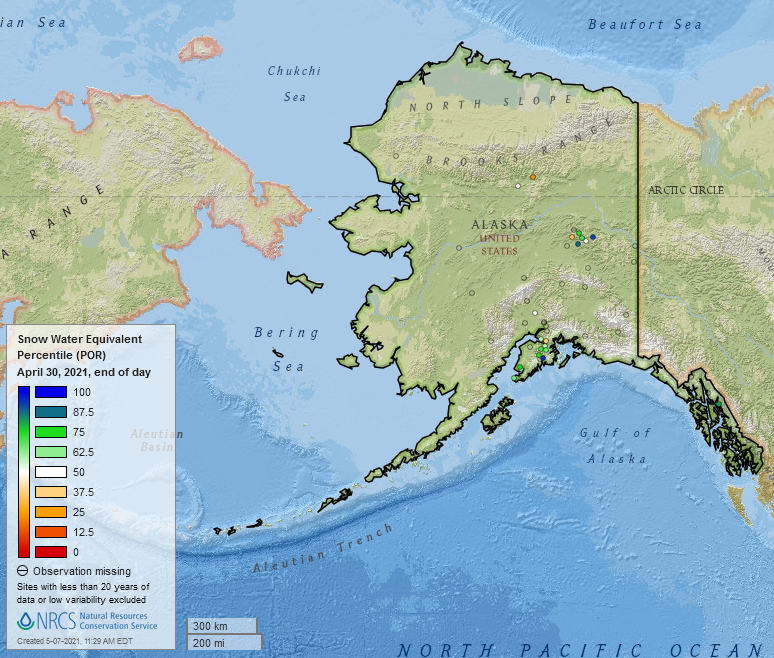
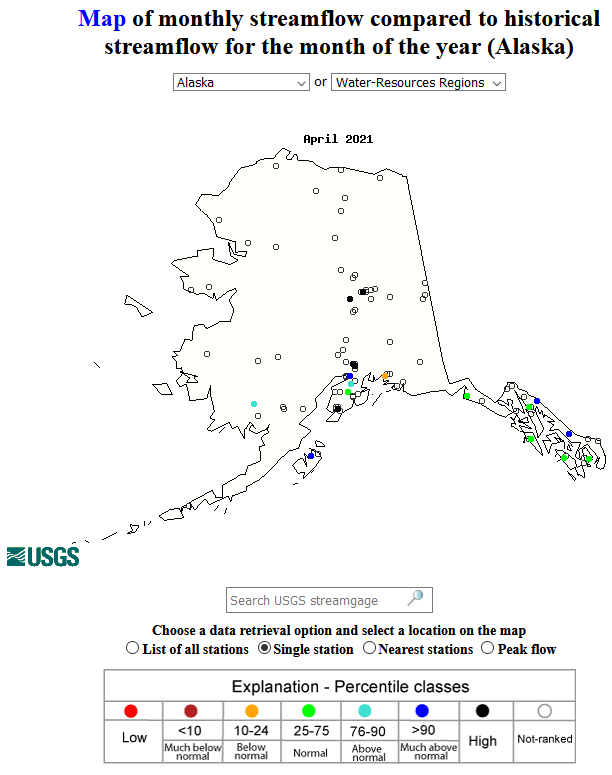
April was drier than normal in some northern, southern coastal, and interior eastern sections of Alaska, and wetter than normal in the central interior and west coast sections. Below-normal precipitation persisted at the southern coastal, eastern interior, and northern interior areas at the 2-12 month time periods, spread across the Aleutians by the 7-month time period, and developed at some west coast locations at the 10-12 month time periods. the southern coastal to Aleutian areas were drier than normal at the 24-month time scale, with dryness dominating at longer time scales along the south coastal area and panhandle (low elevation station precipitation anomaly maps for the last 1, 2, 3, 4, 6, 7, 9, 10, 12, 24, 36, 48, 60 months) (high elevation SNOTEL station precipitation percentile maps for the last 1 and 7 months) (high elevation SNOTEL station precipitation anomaly maps for the last 1 and 7 months) (SNOTEL basin precipitation anomaly map for the last 7 months) (gridded precipitation percentile maps for the last 1, 3, and 4 months) (climate division precipitation rank maps for the last 1, 3, 4, 6, and 12 months) (modeled percent of normal maps from ACCAP for the last month) (Leaky Bucket model precipitation percentile map). April was slightly cooler than normal central to southeast interior and panhandle regions, and warmer than normal in the Aleutians. Colder-than-normal temperatures dominated the state at the 2- to 3-month time scales, except for warmer-than-normal conditions which continued in the Aleutians. but warmer-than-normal conditions were evident in the southwest at 3 months. The temperature anomaly pattern became warmer with above-normal temperatures spreading from the West by 6 months and dominating the state by the 12-month time scale (low elevation station temperature anomaly maps for the last 1, 2, 3, 4, 7, 10, 12 months) (gridded temperature percentile maps for the last 1, 3, and 4 months) (climate division temperature rank maps for the last 1, 3, 4, 6, 12 months) (Leaky Bucket model temperature percentile map). End-of-April snow pack was below normal in some northern interior and southern areas. Monthly streamflow (for those streams that were not frozen) was mostly near to above normal. Abnormal dryness shrank to 20.7 percent of the state but continued in the northern and northeastern interior sections on the April 27th USDM map.
Puerto Rico and U.S. Virgin Islands
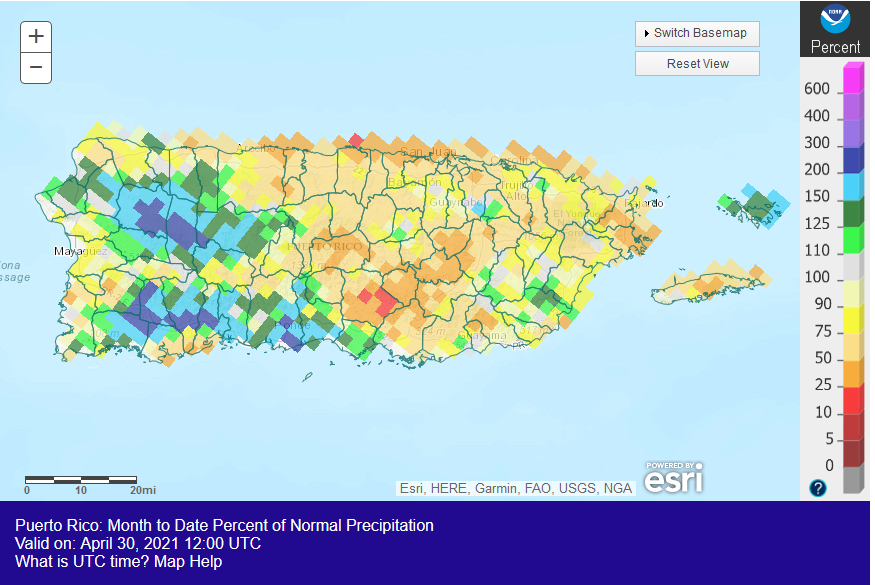
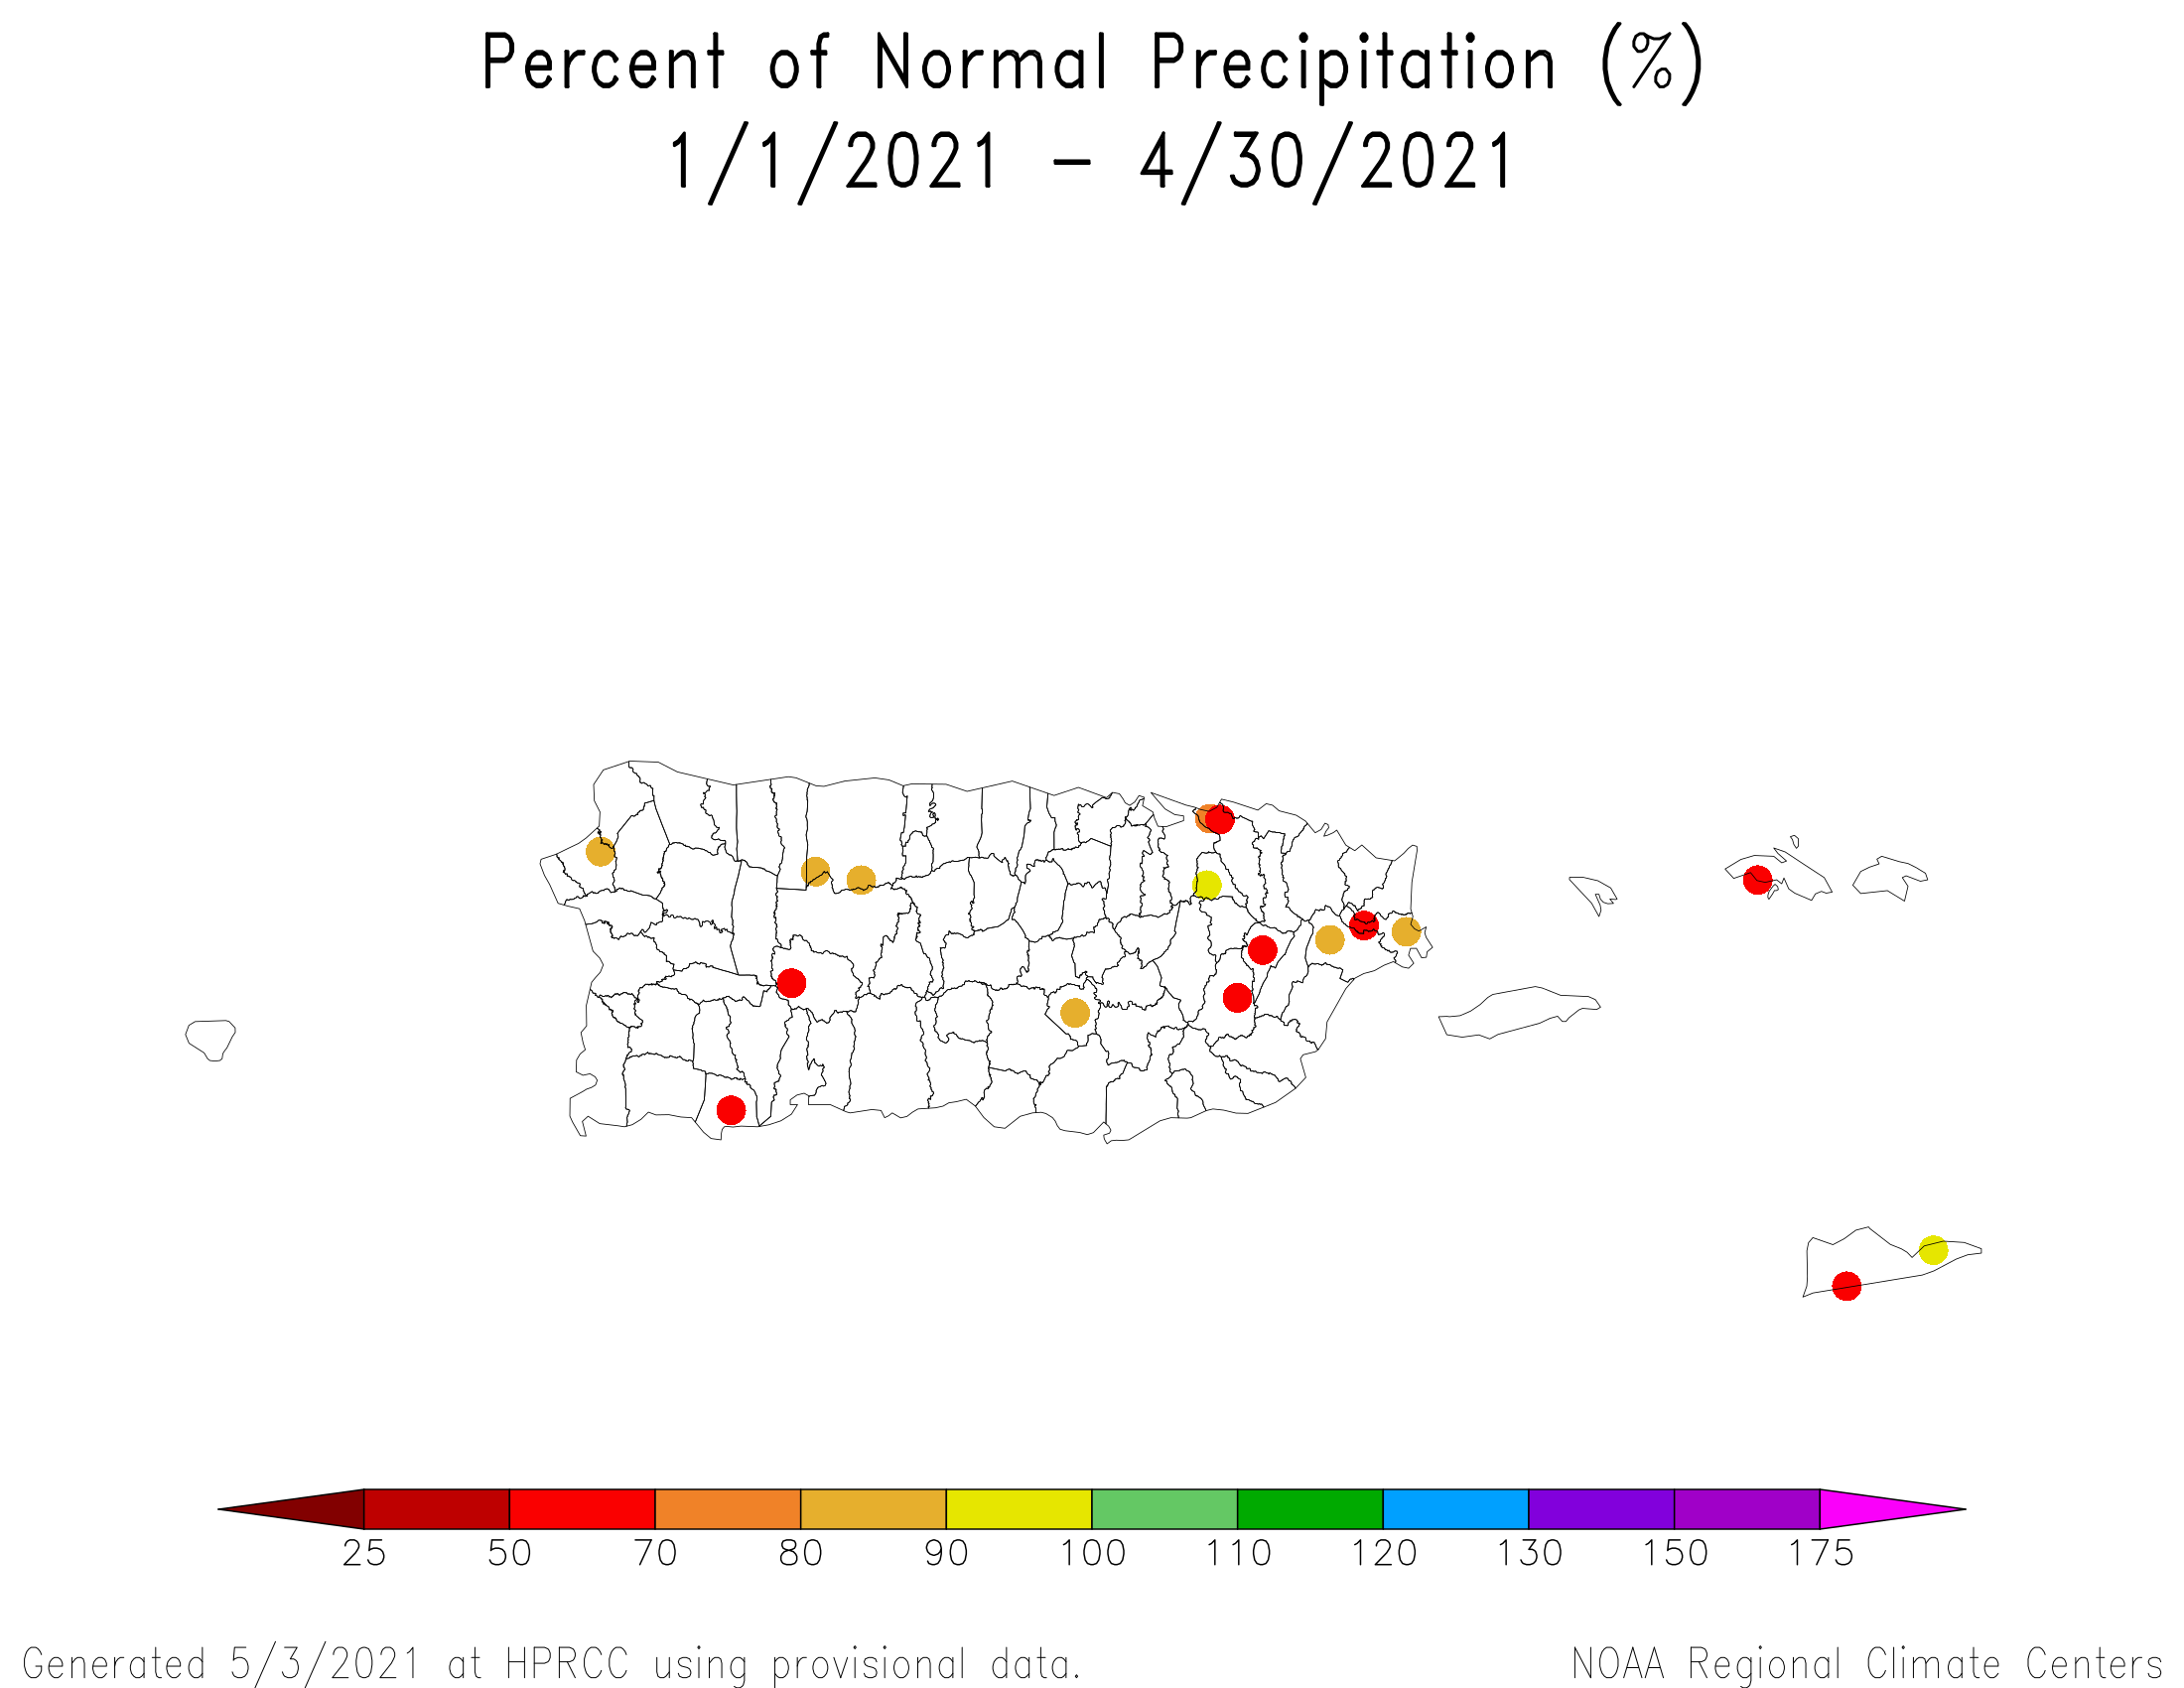
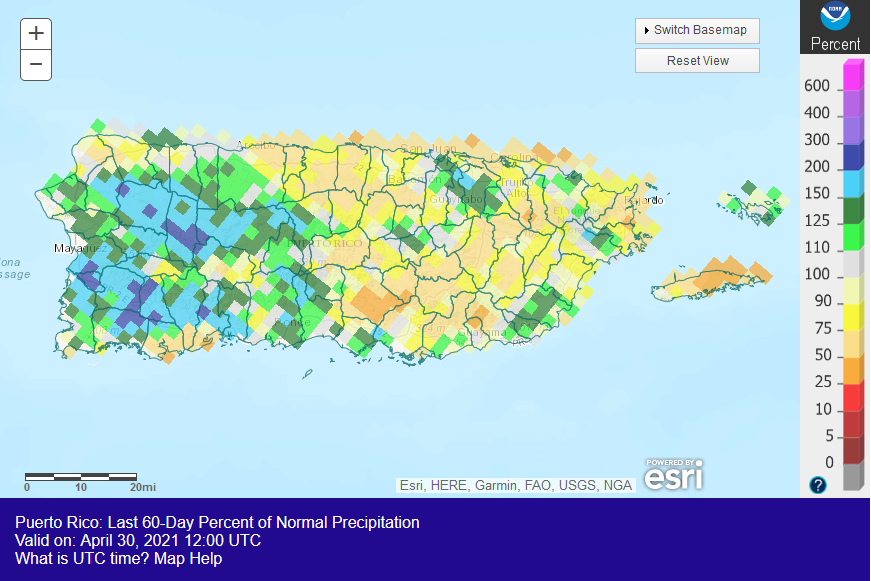
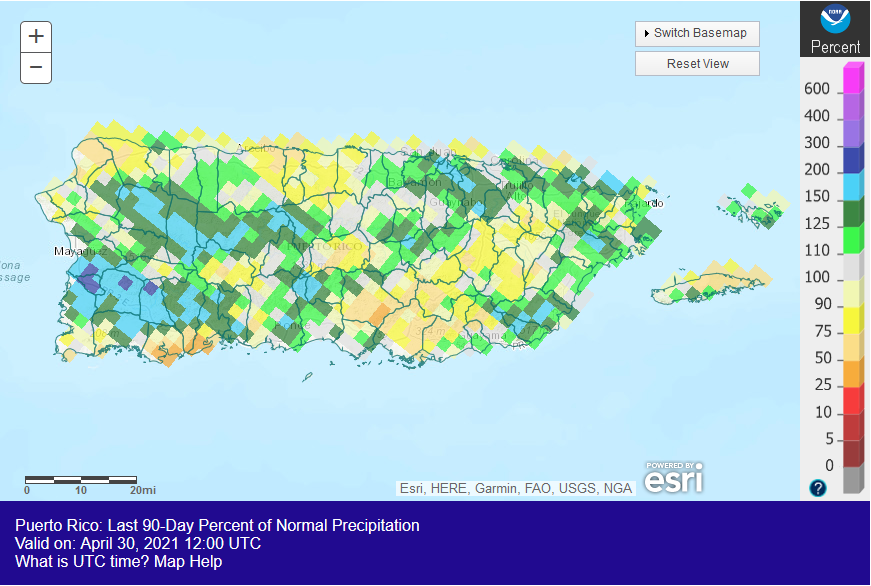
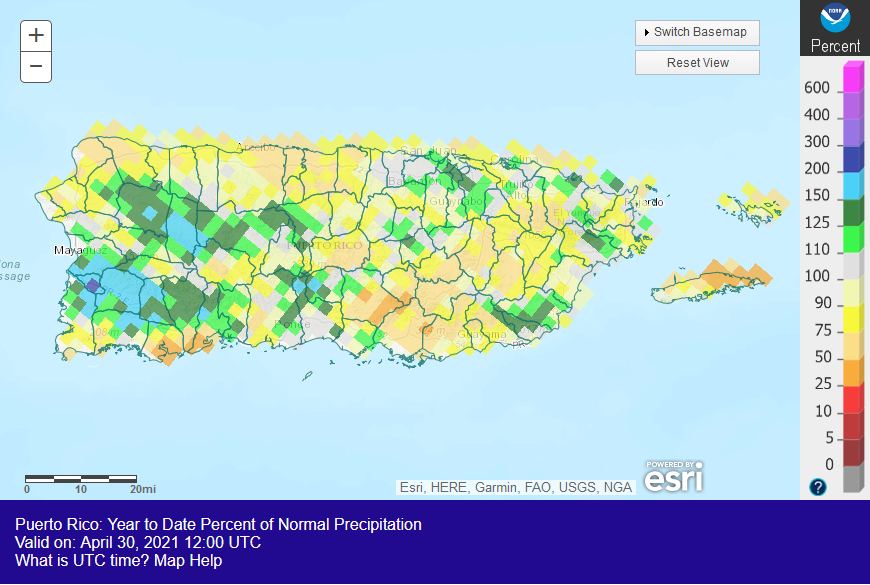
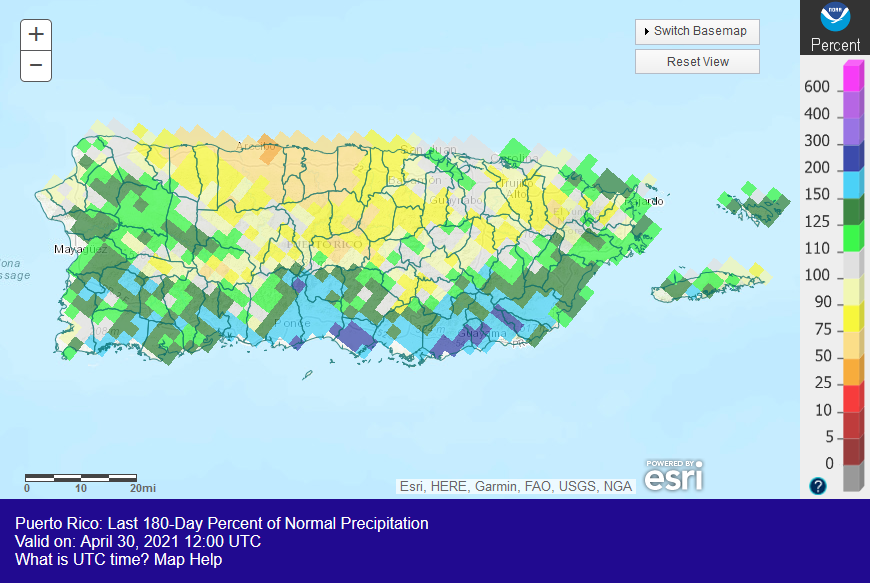
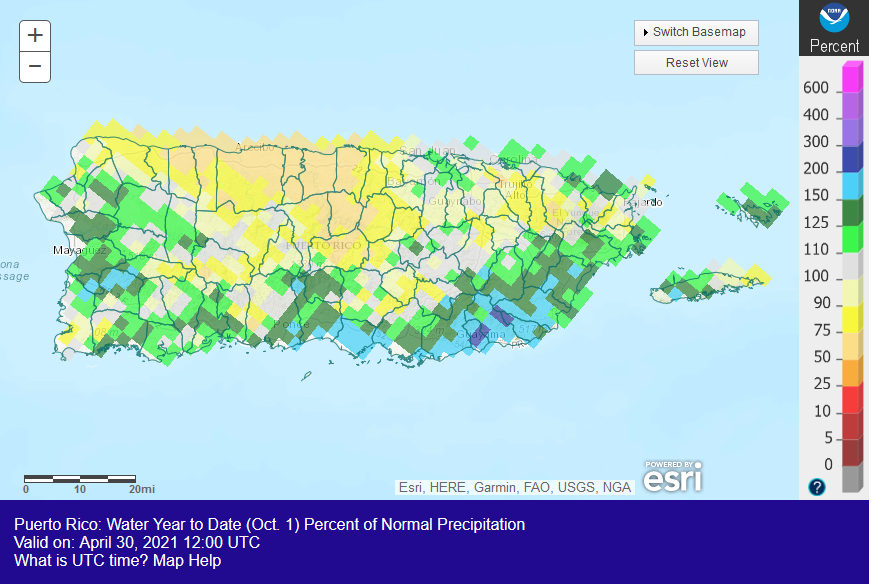
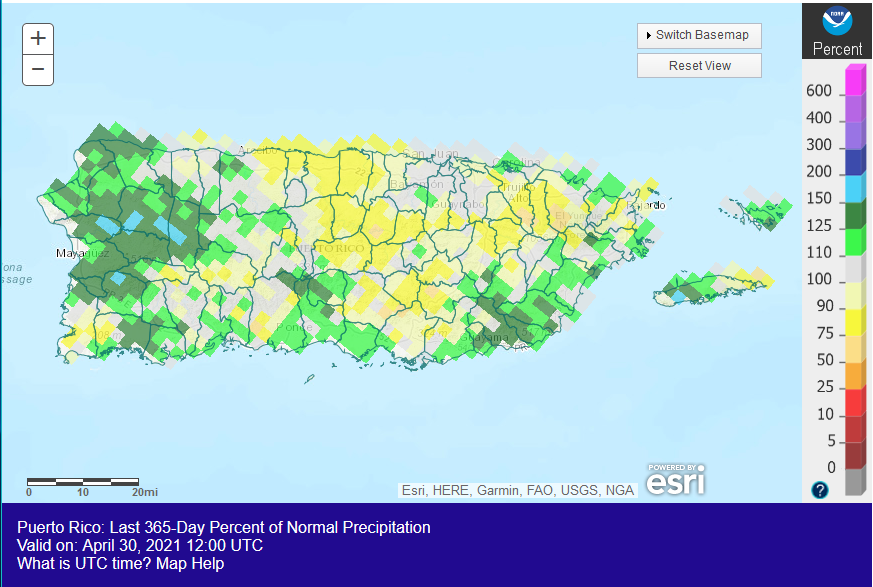
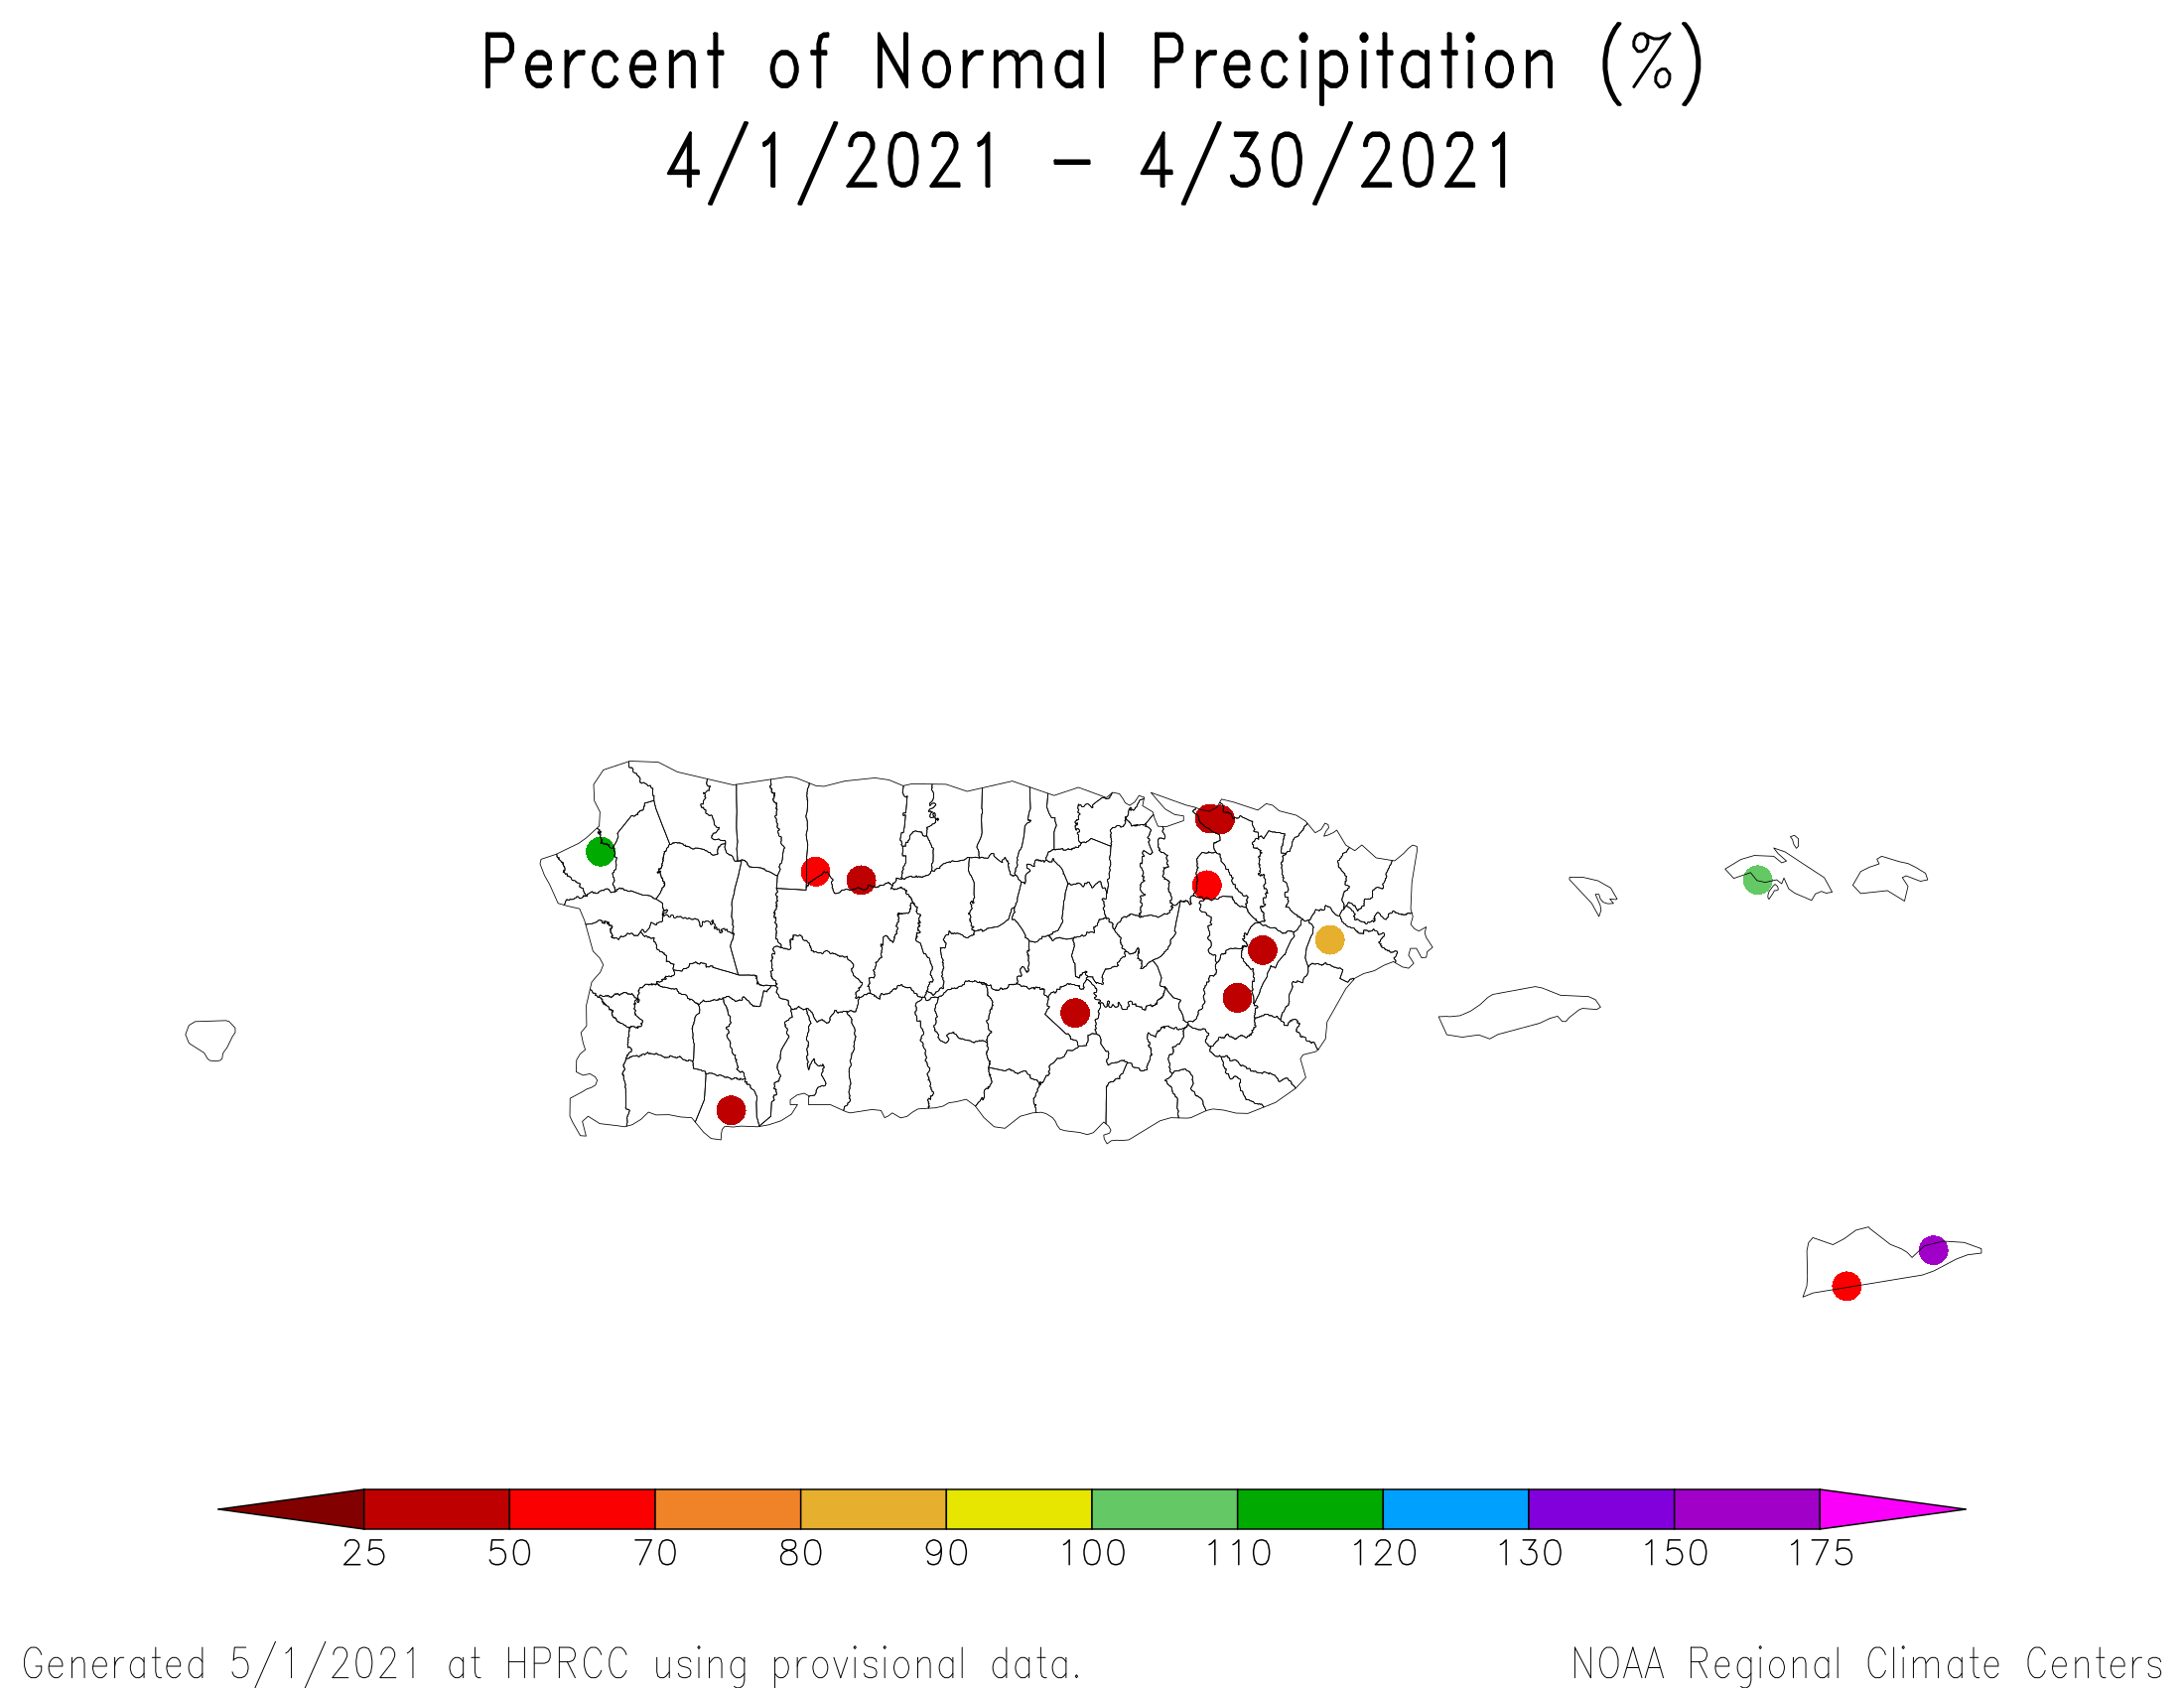
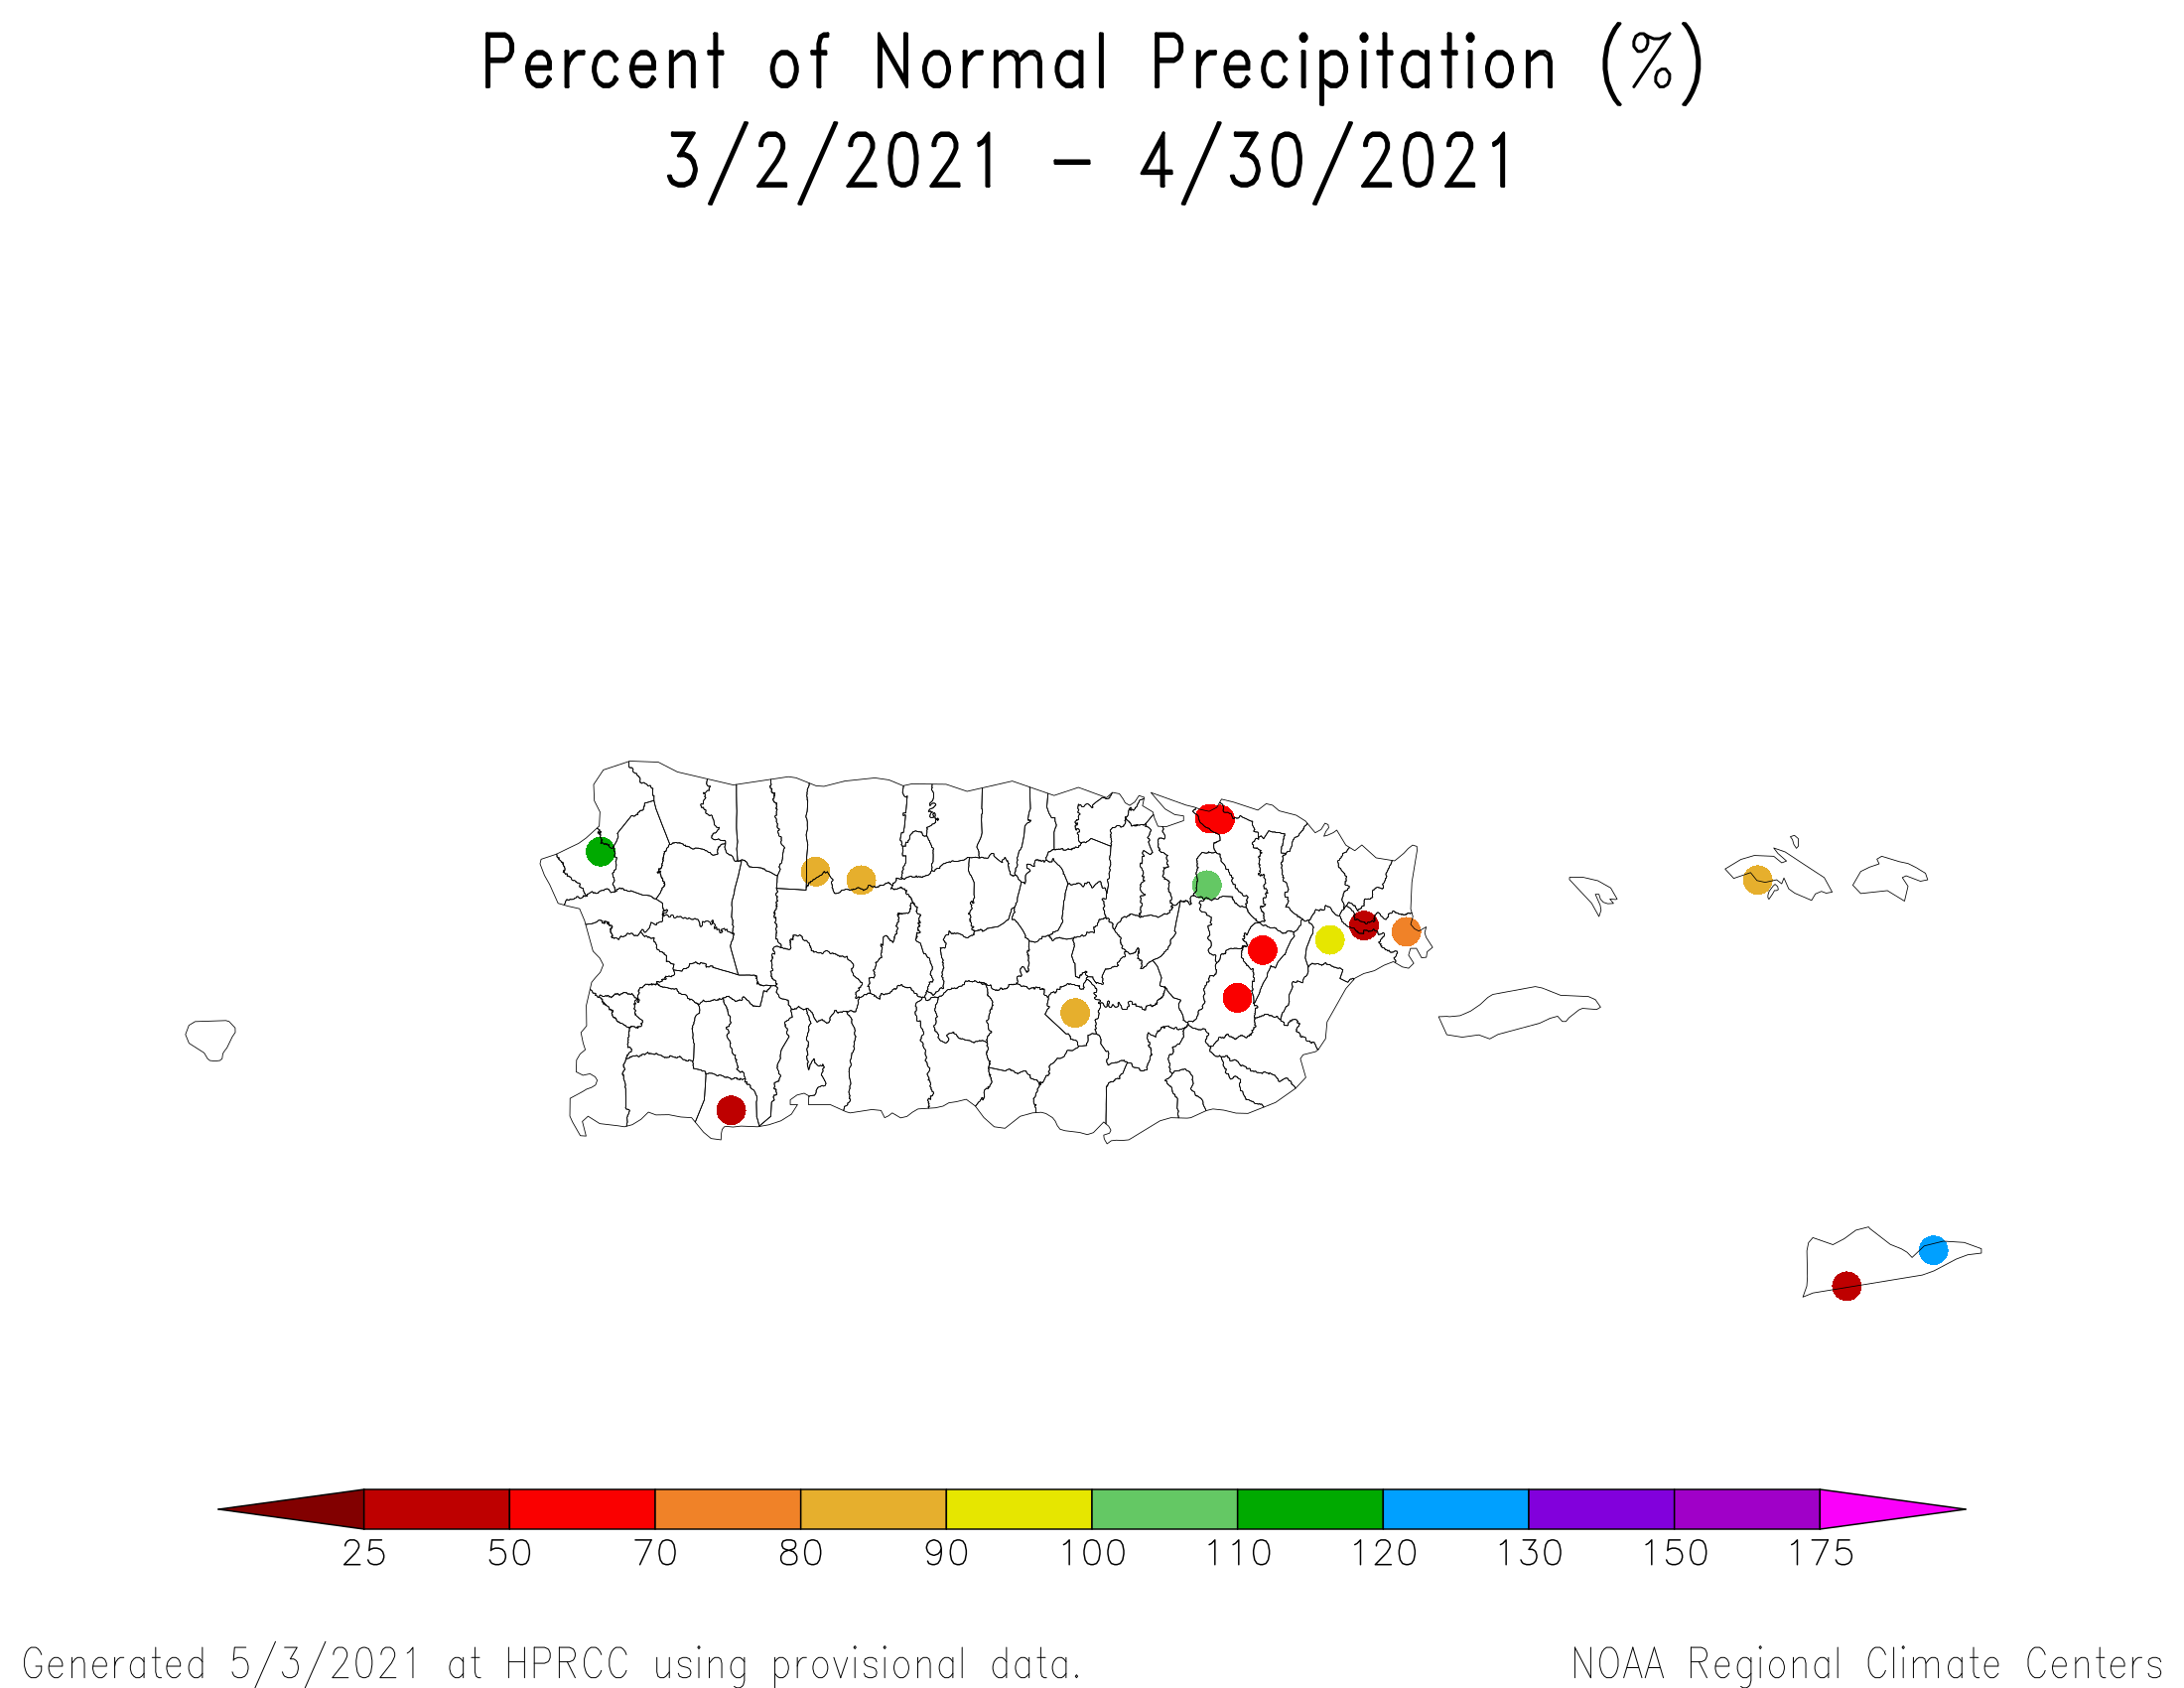
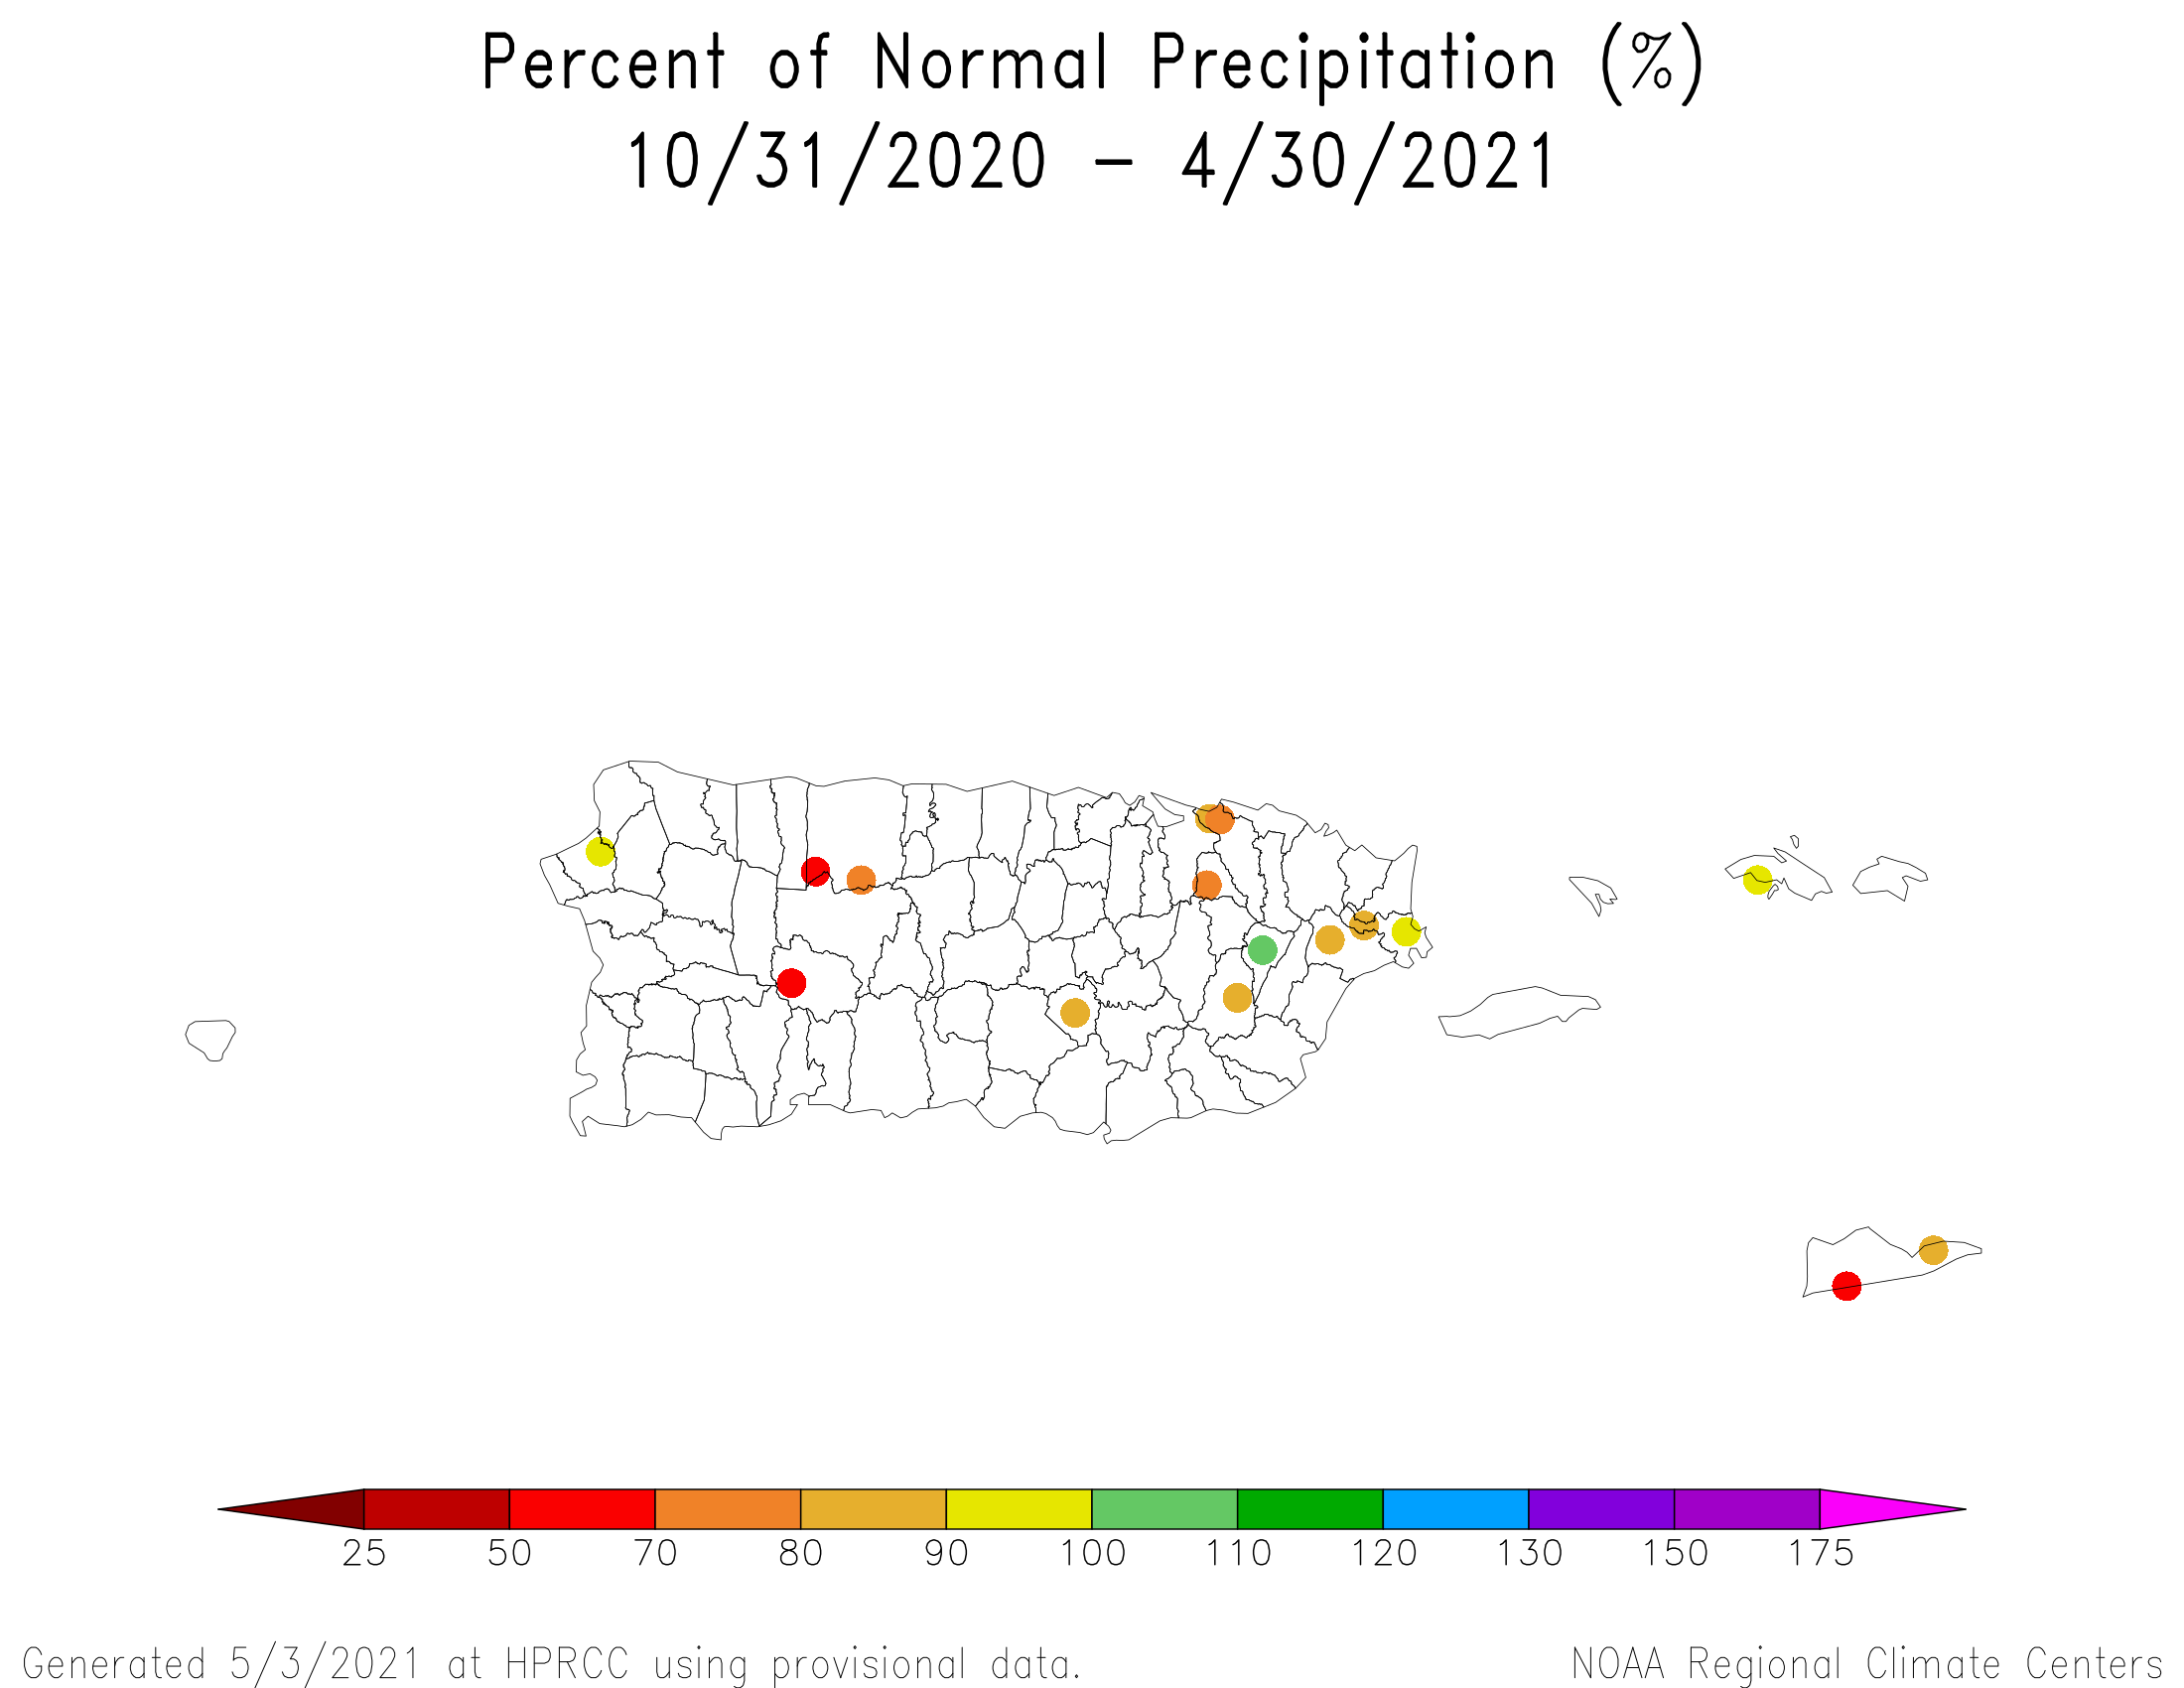
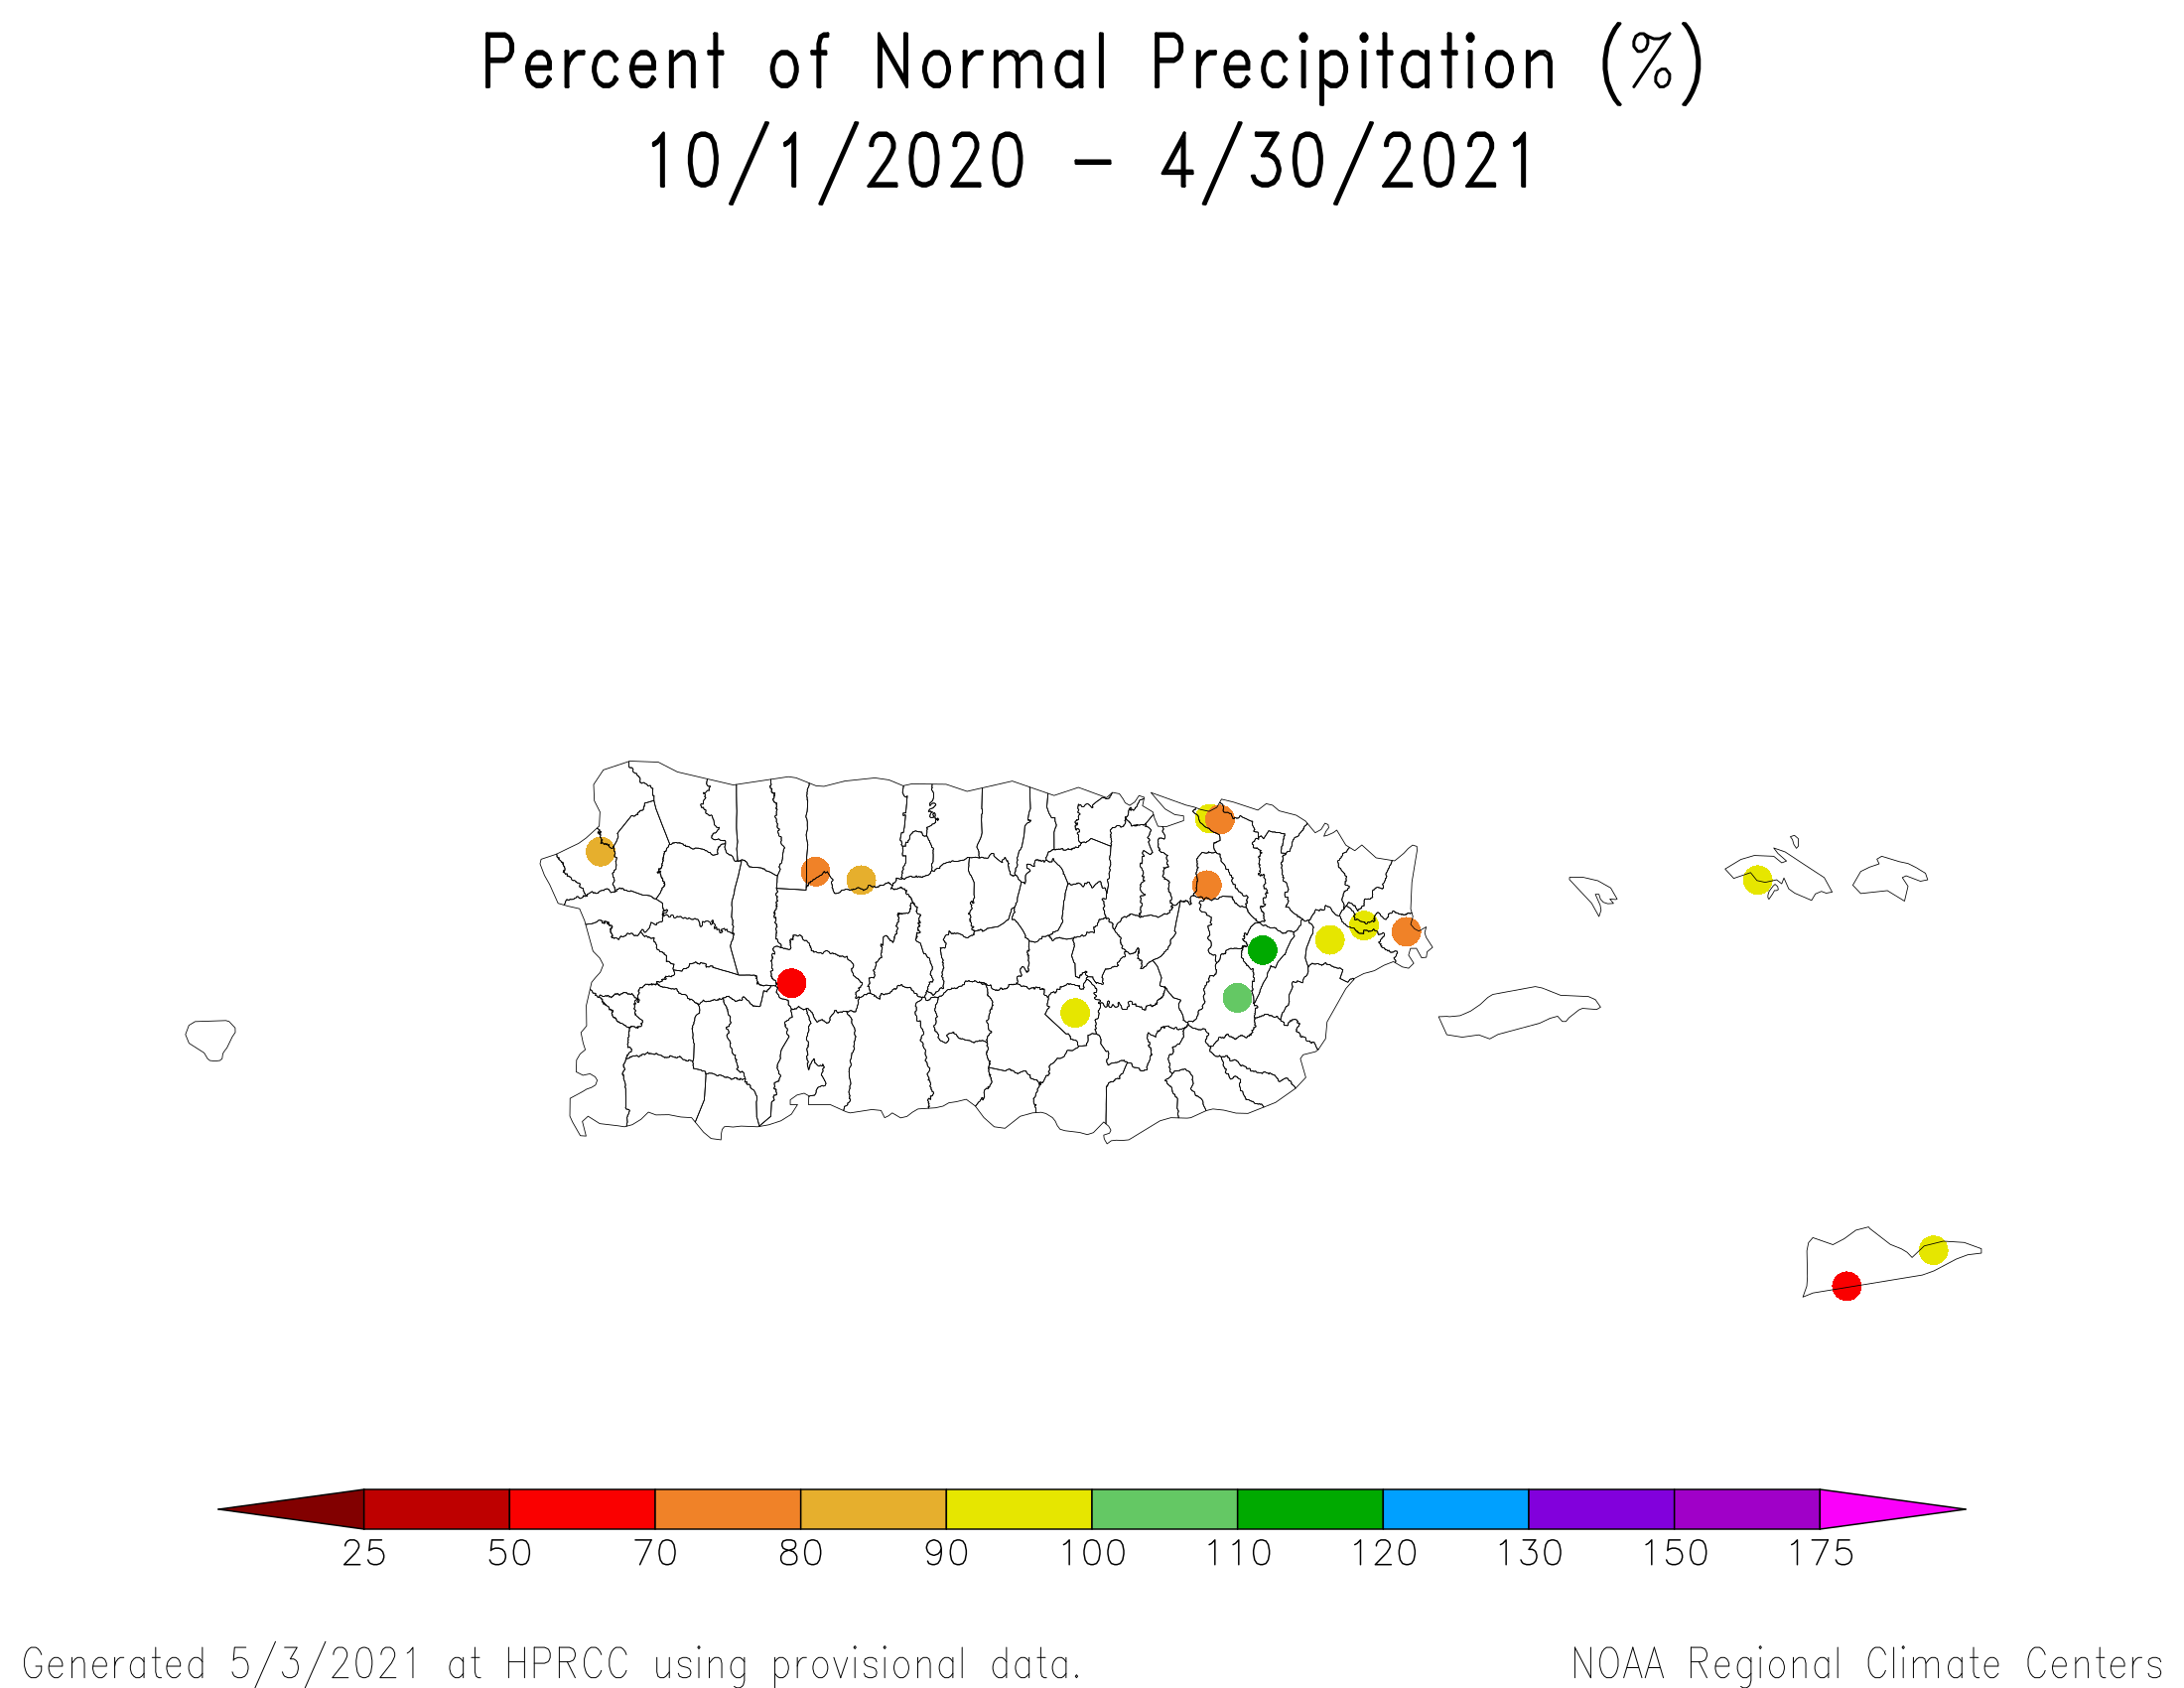
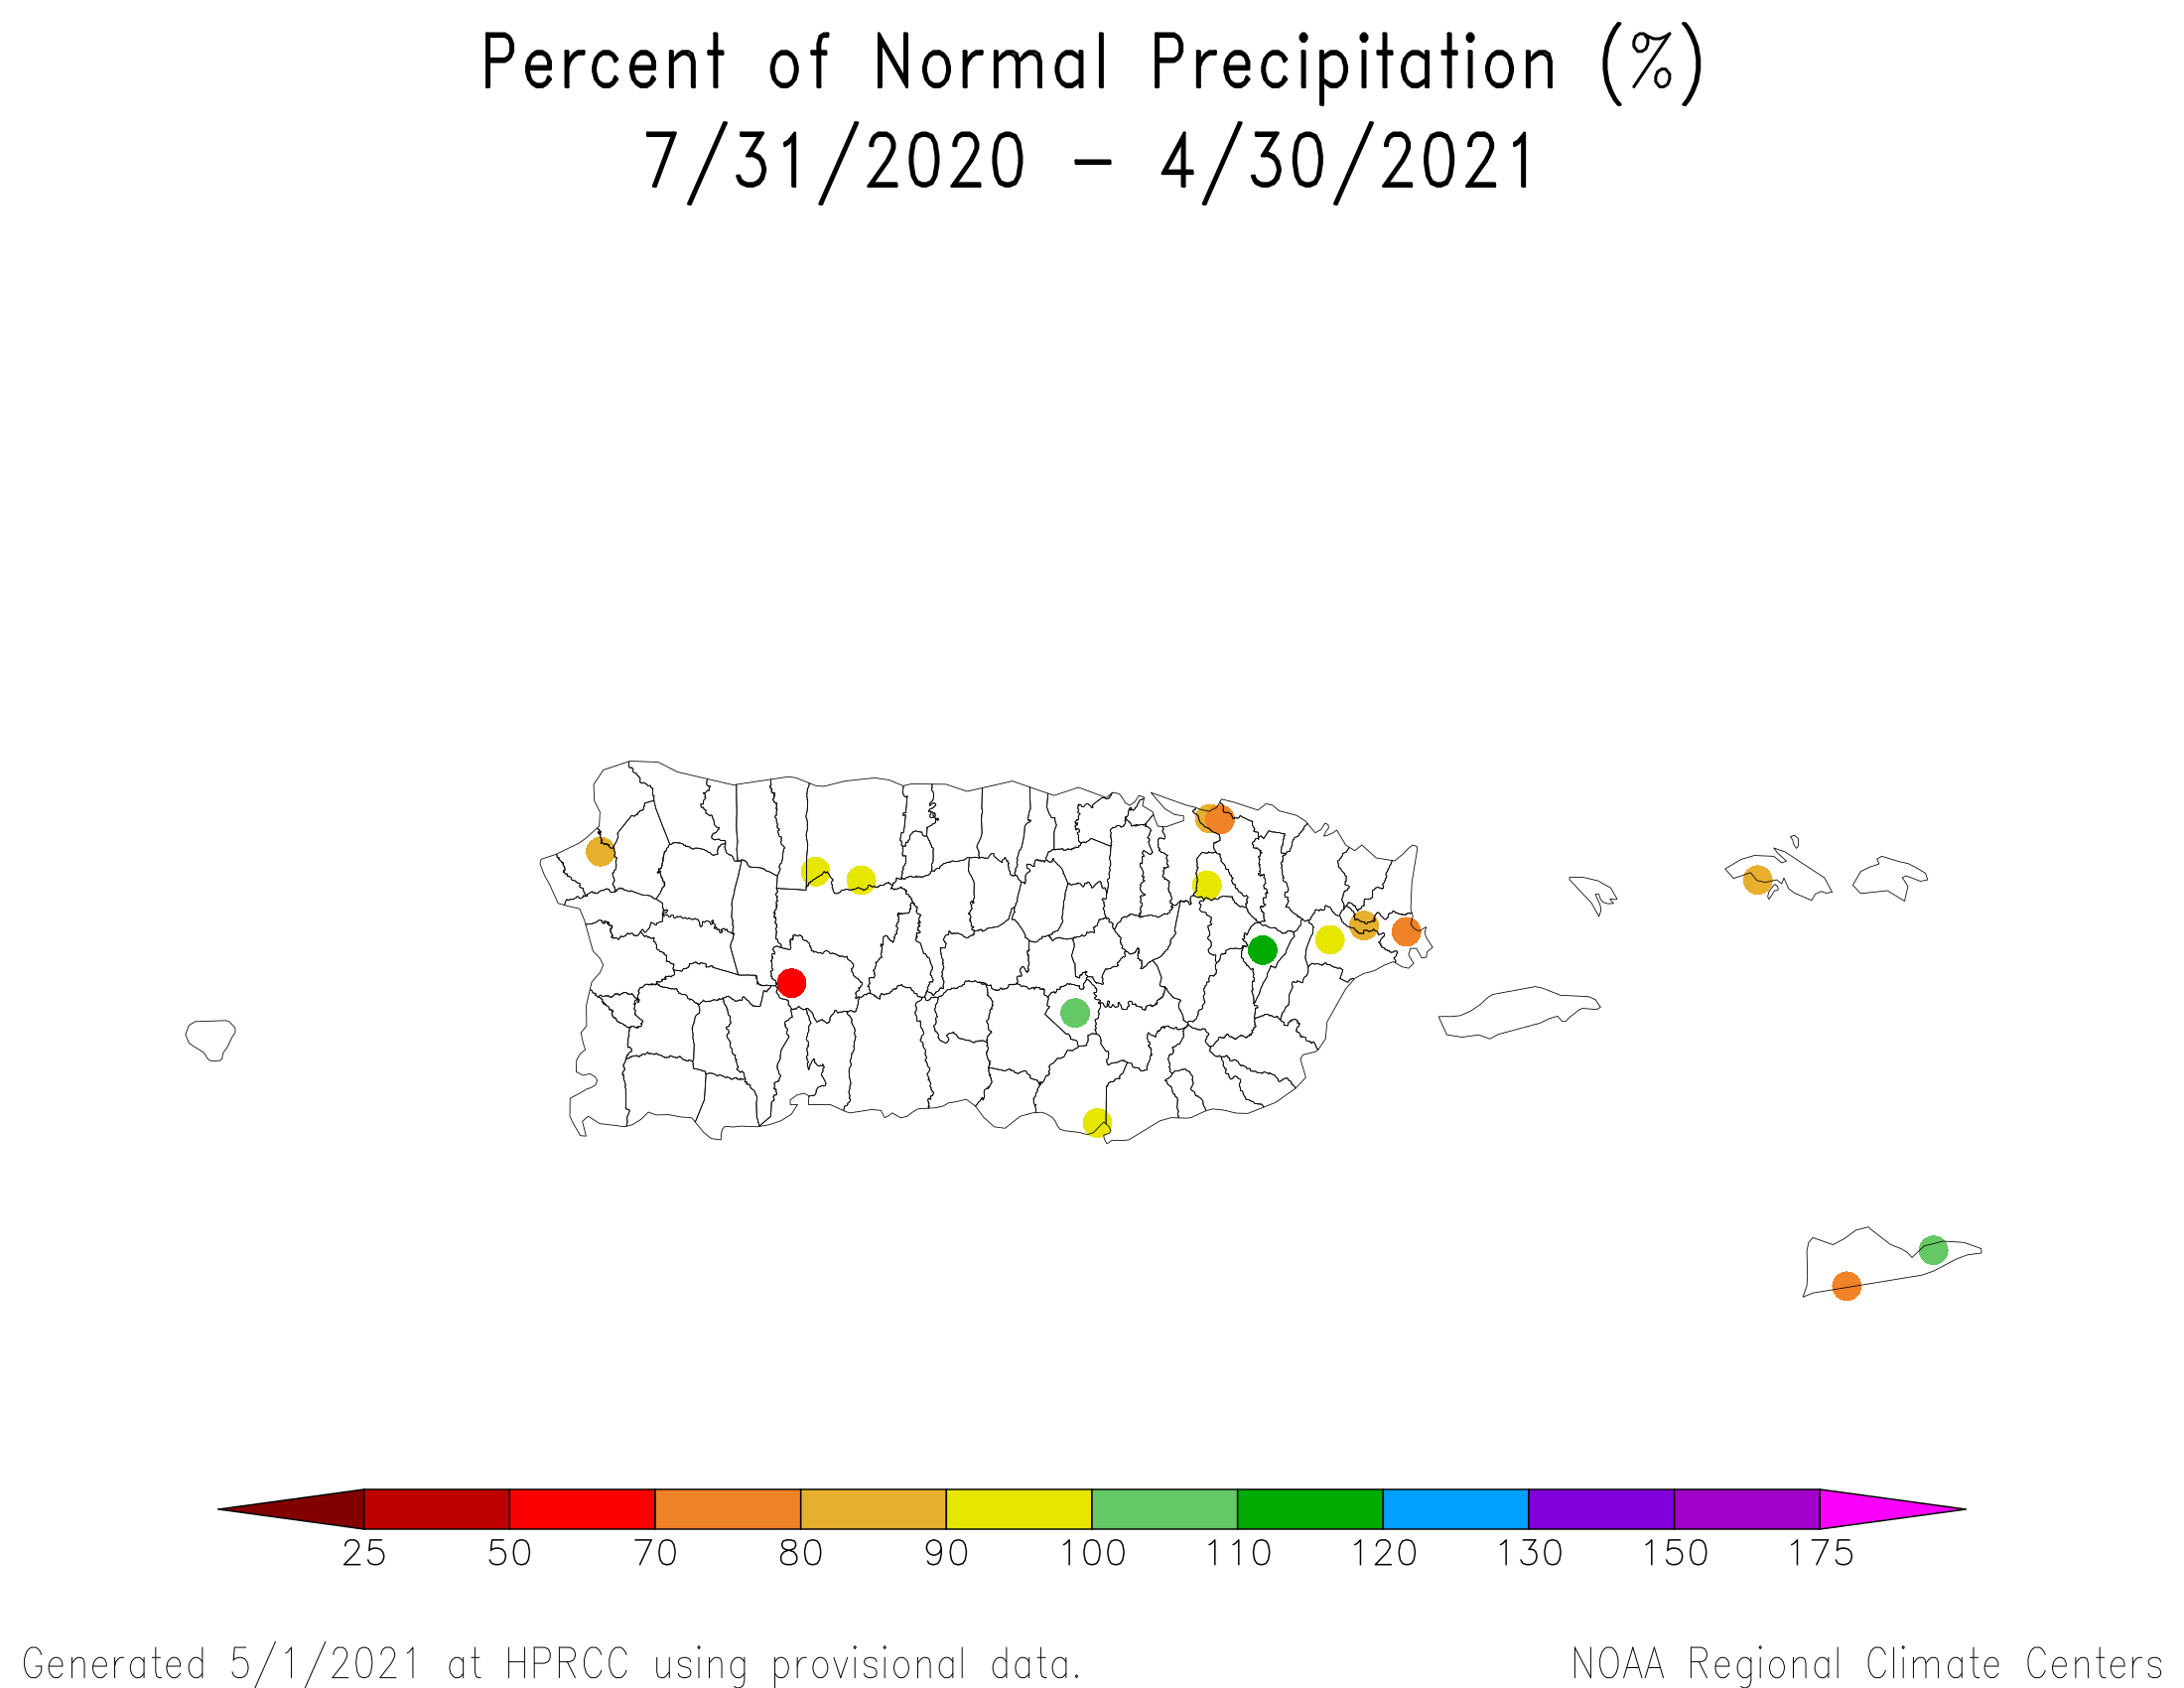
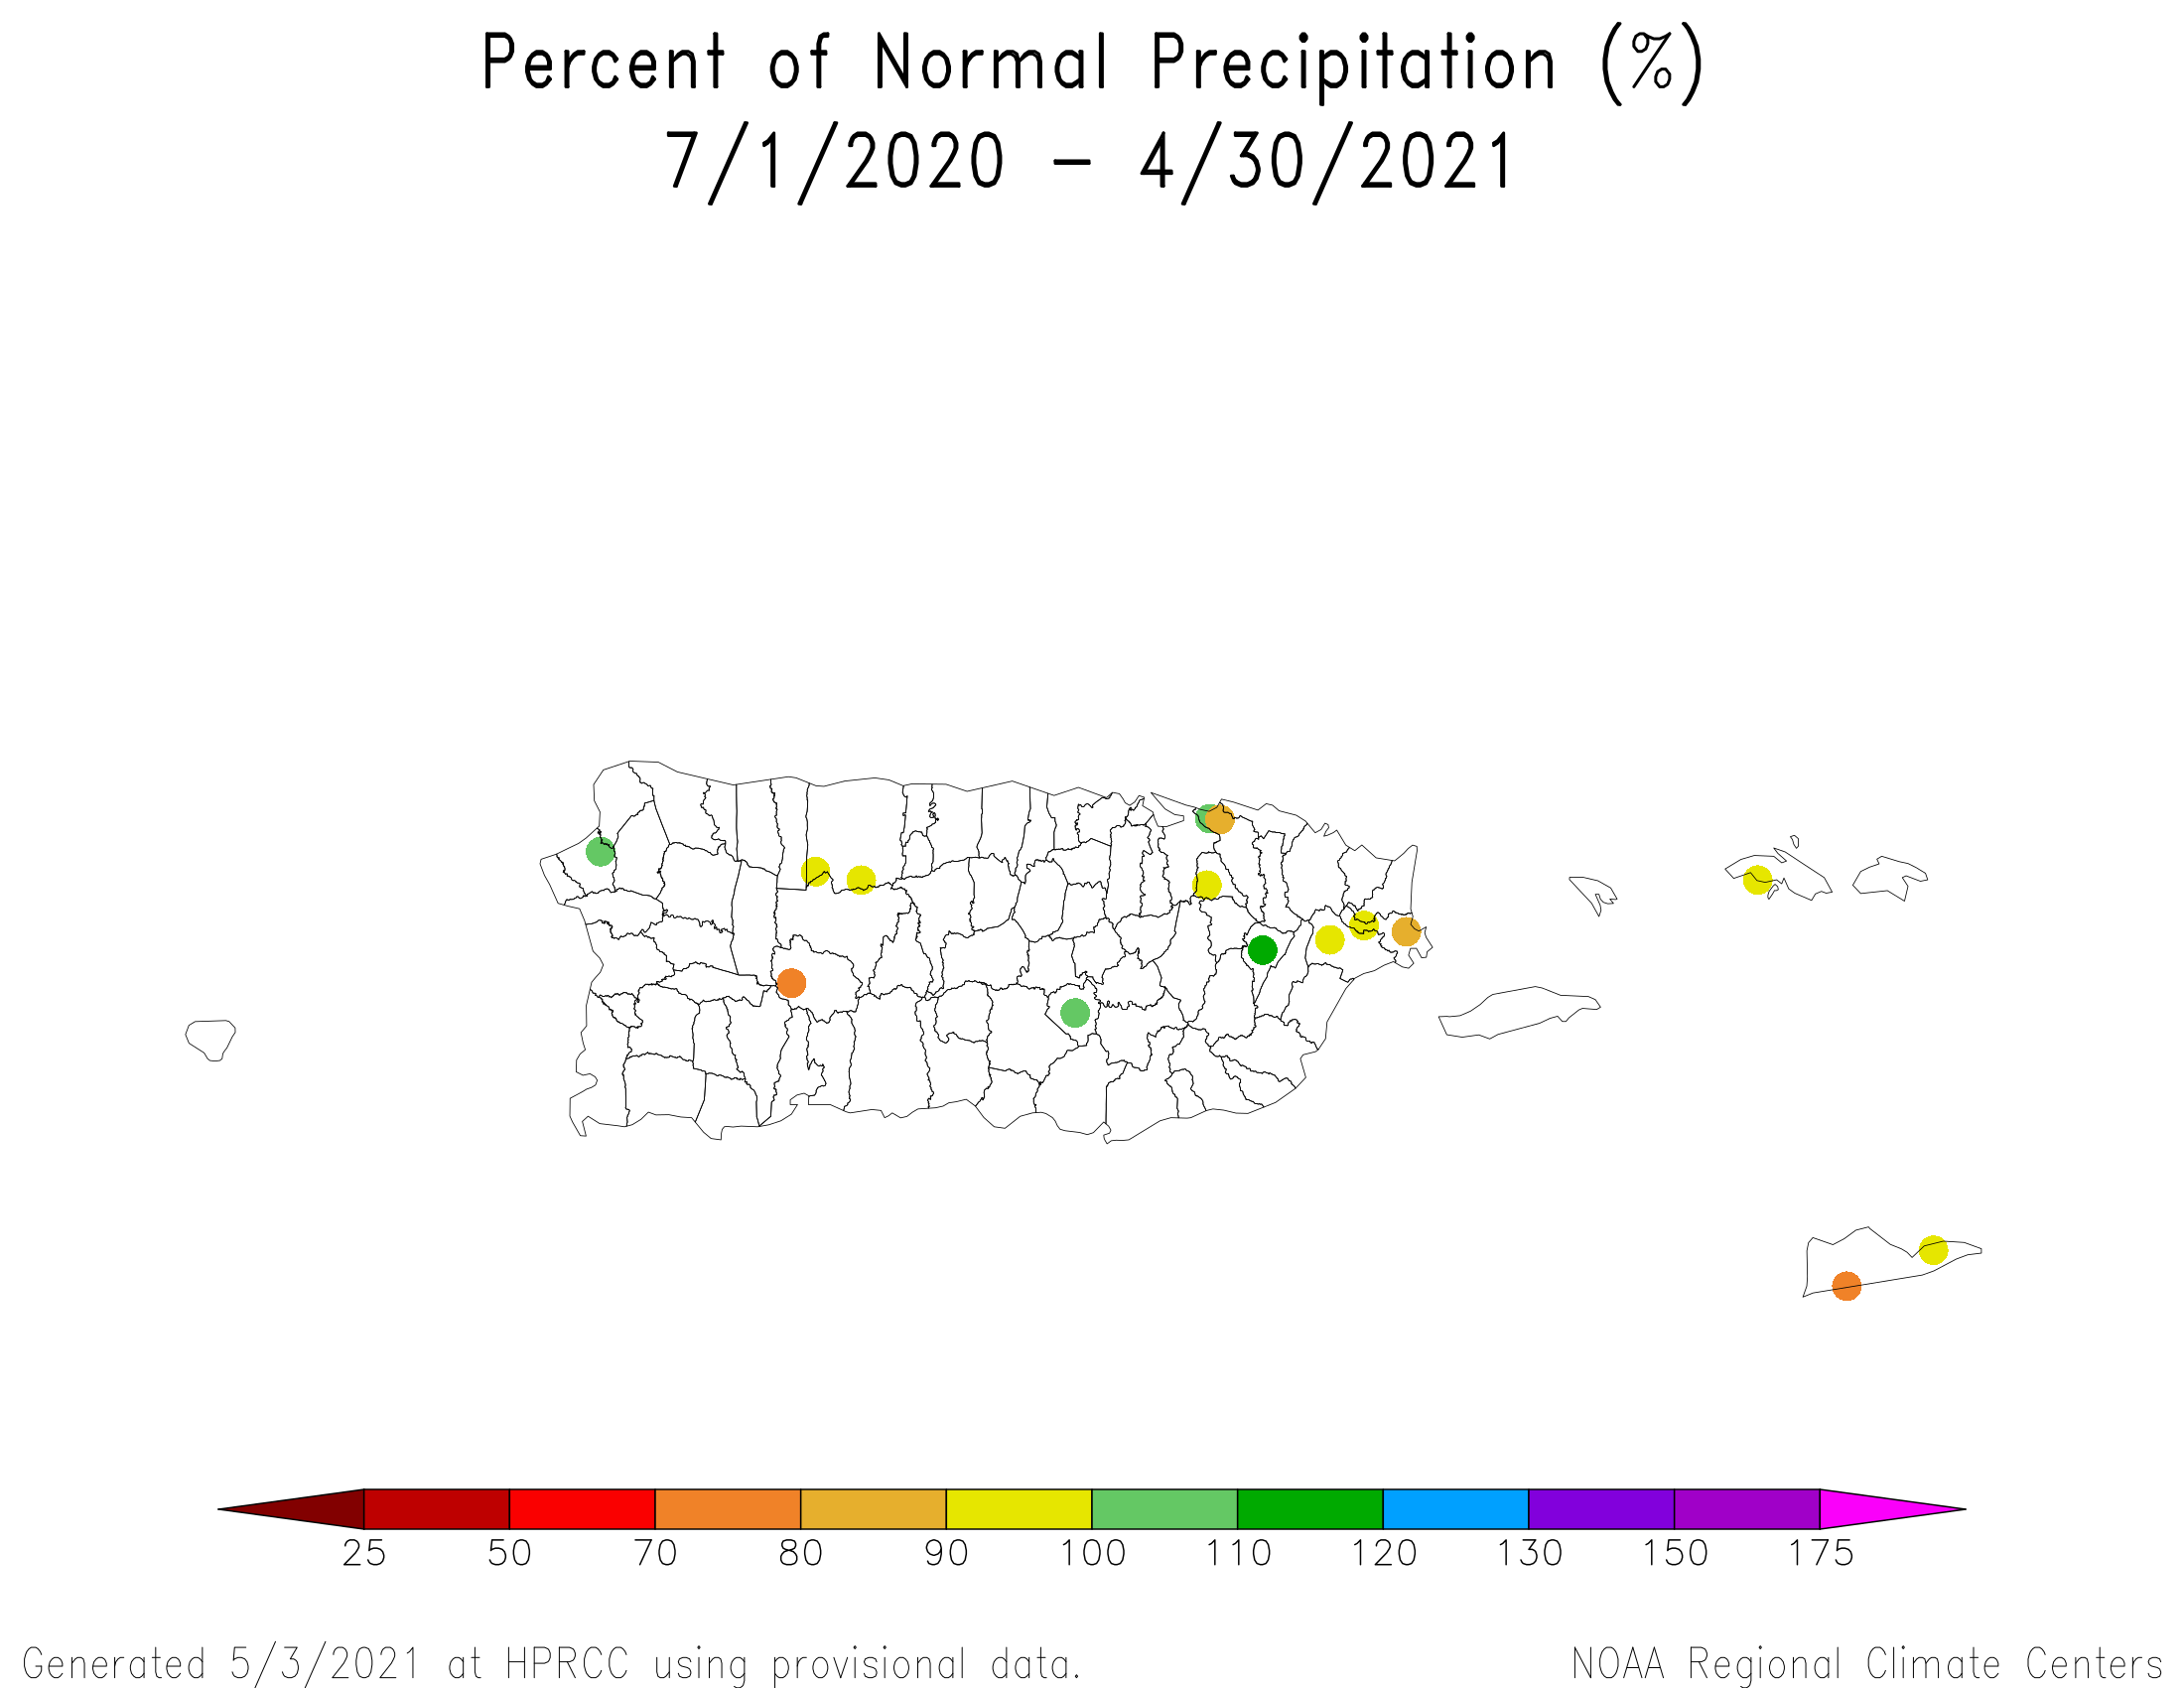
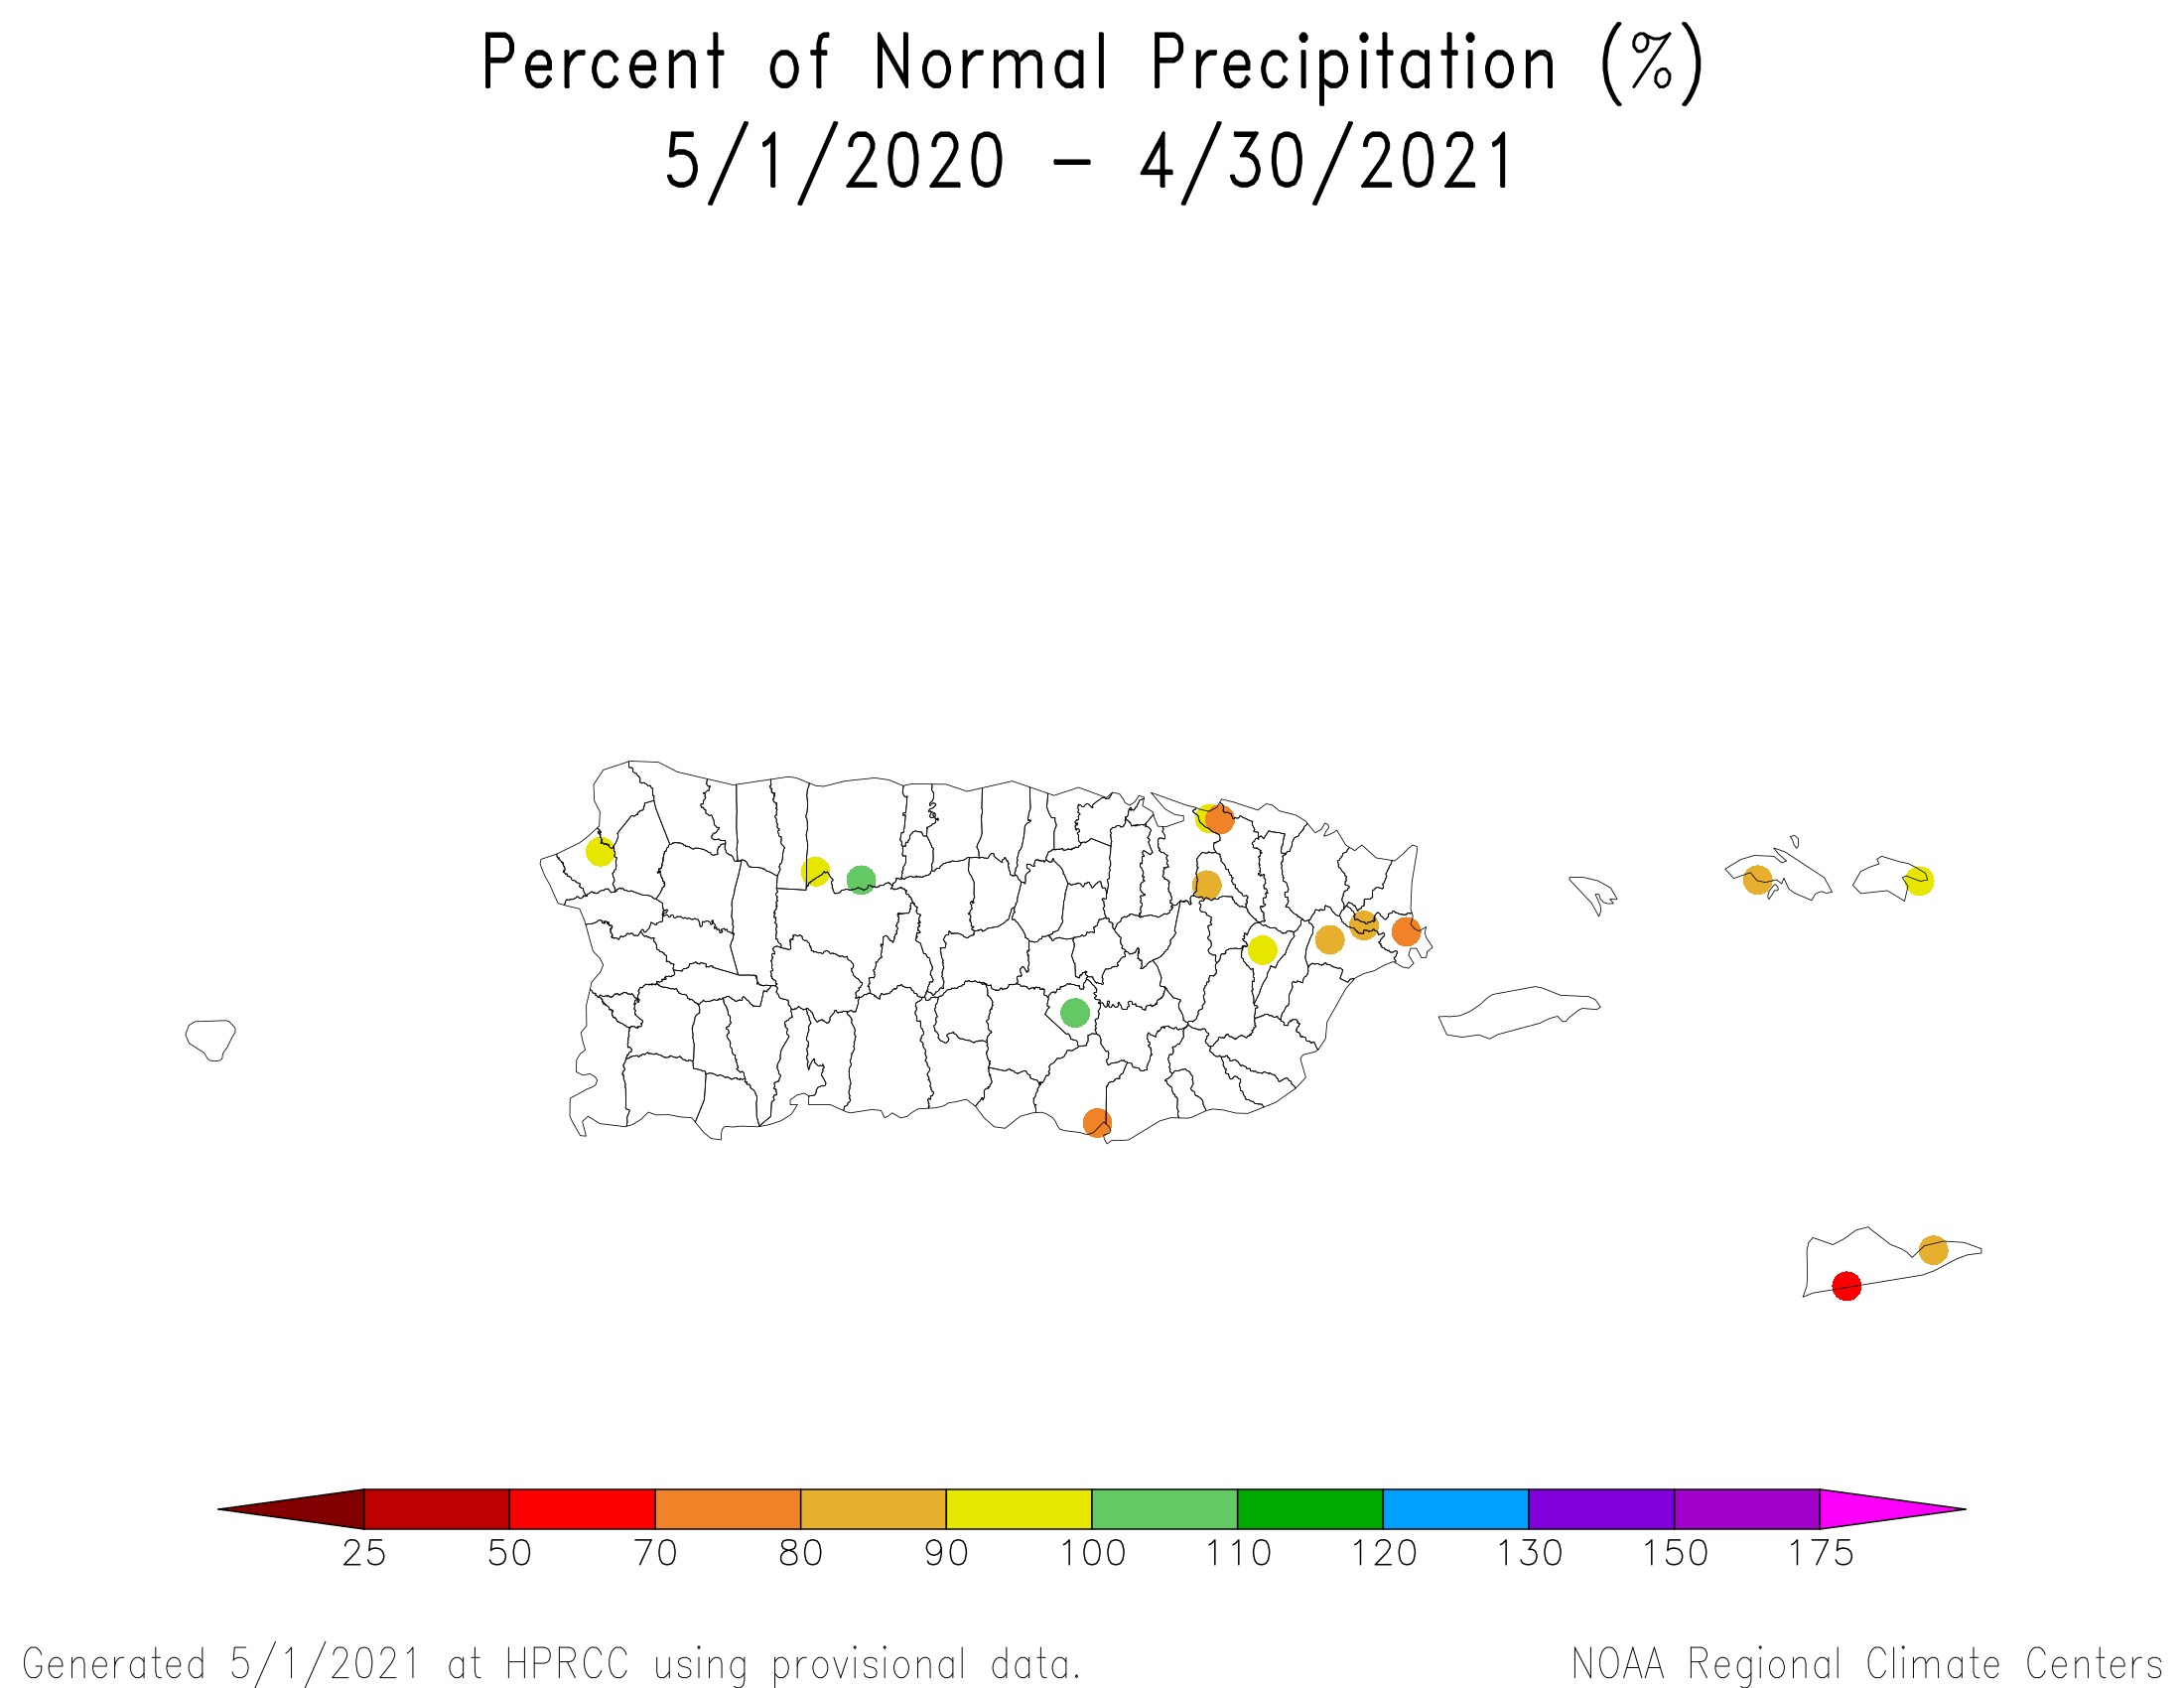
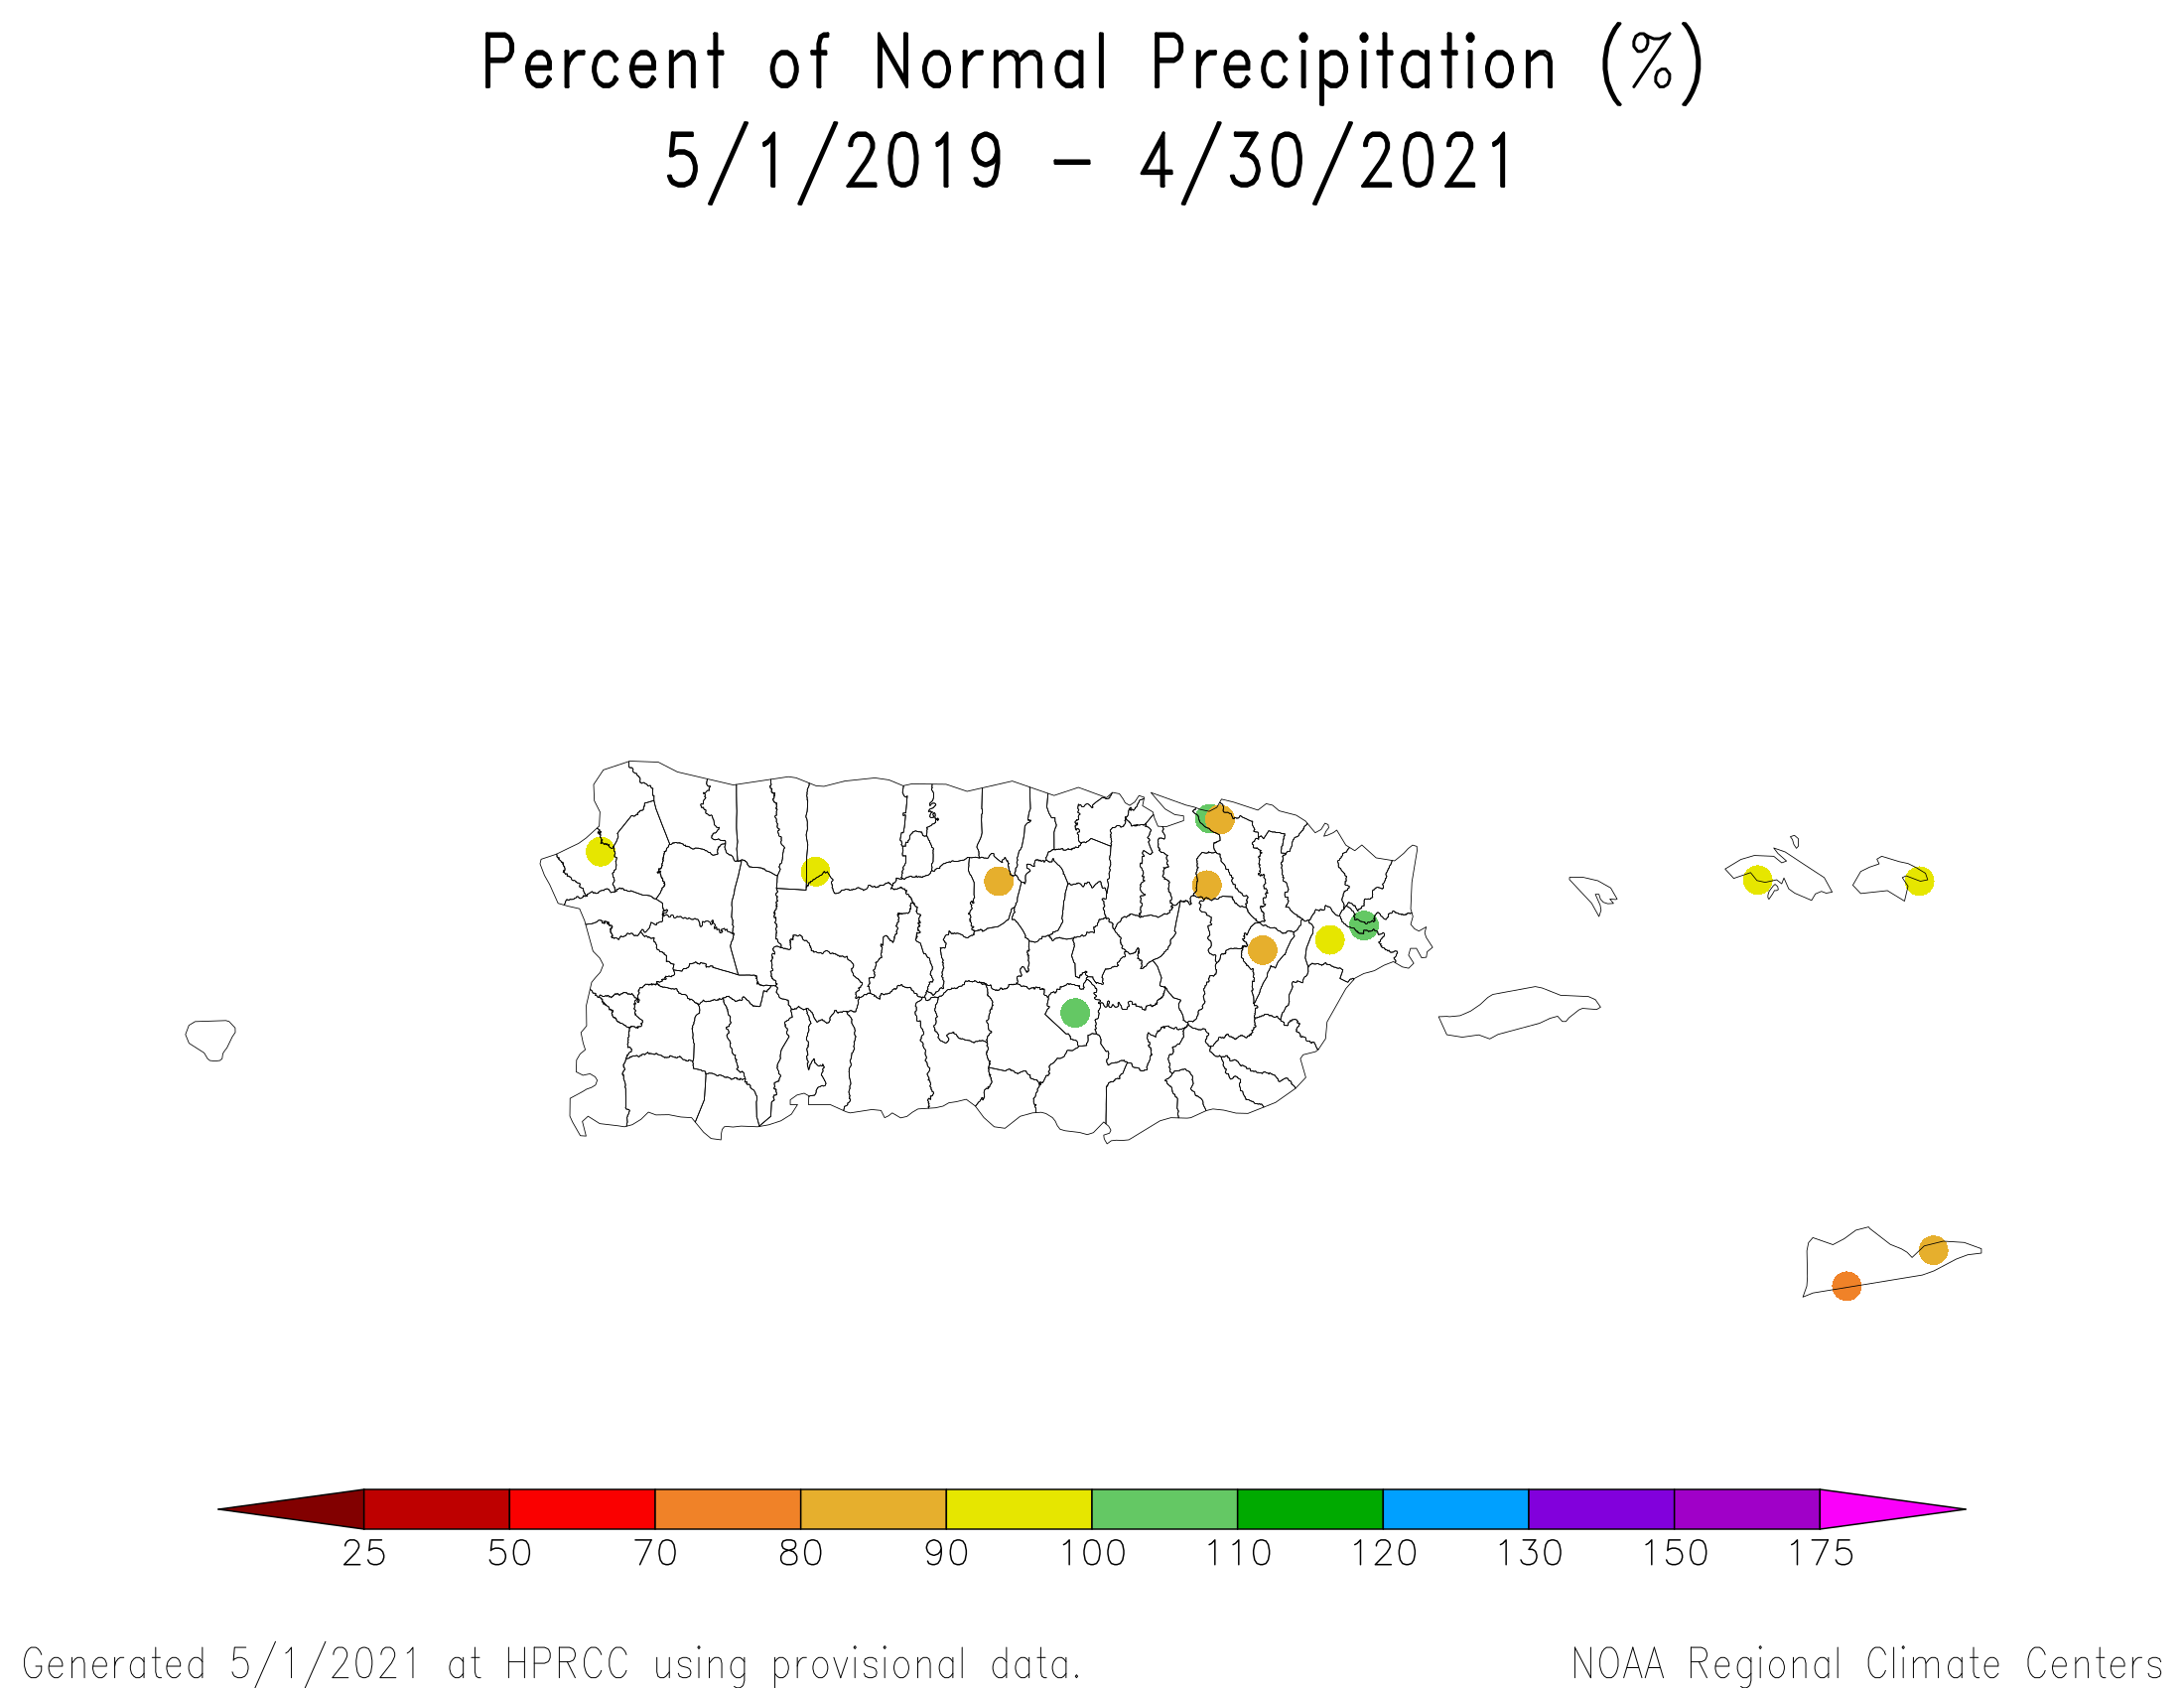
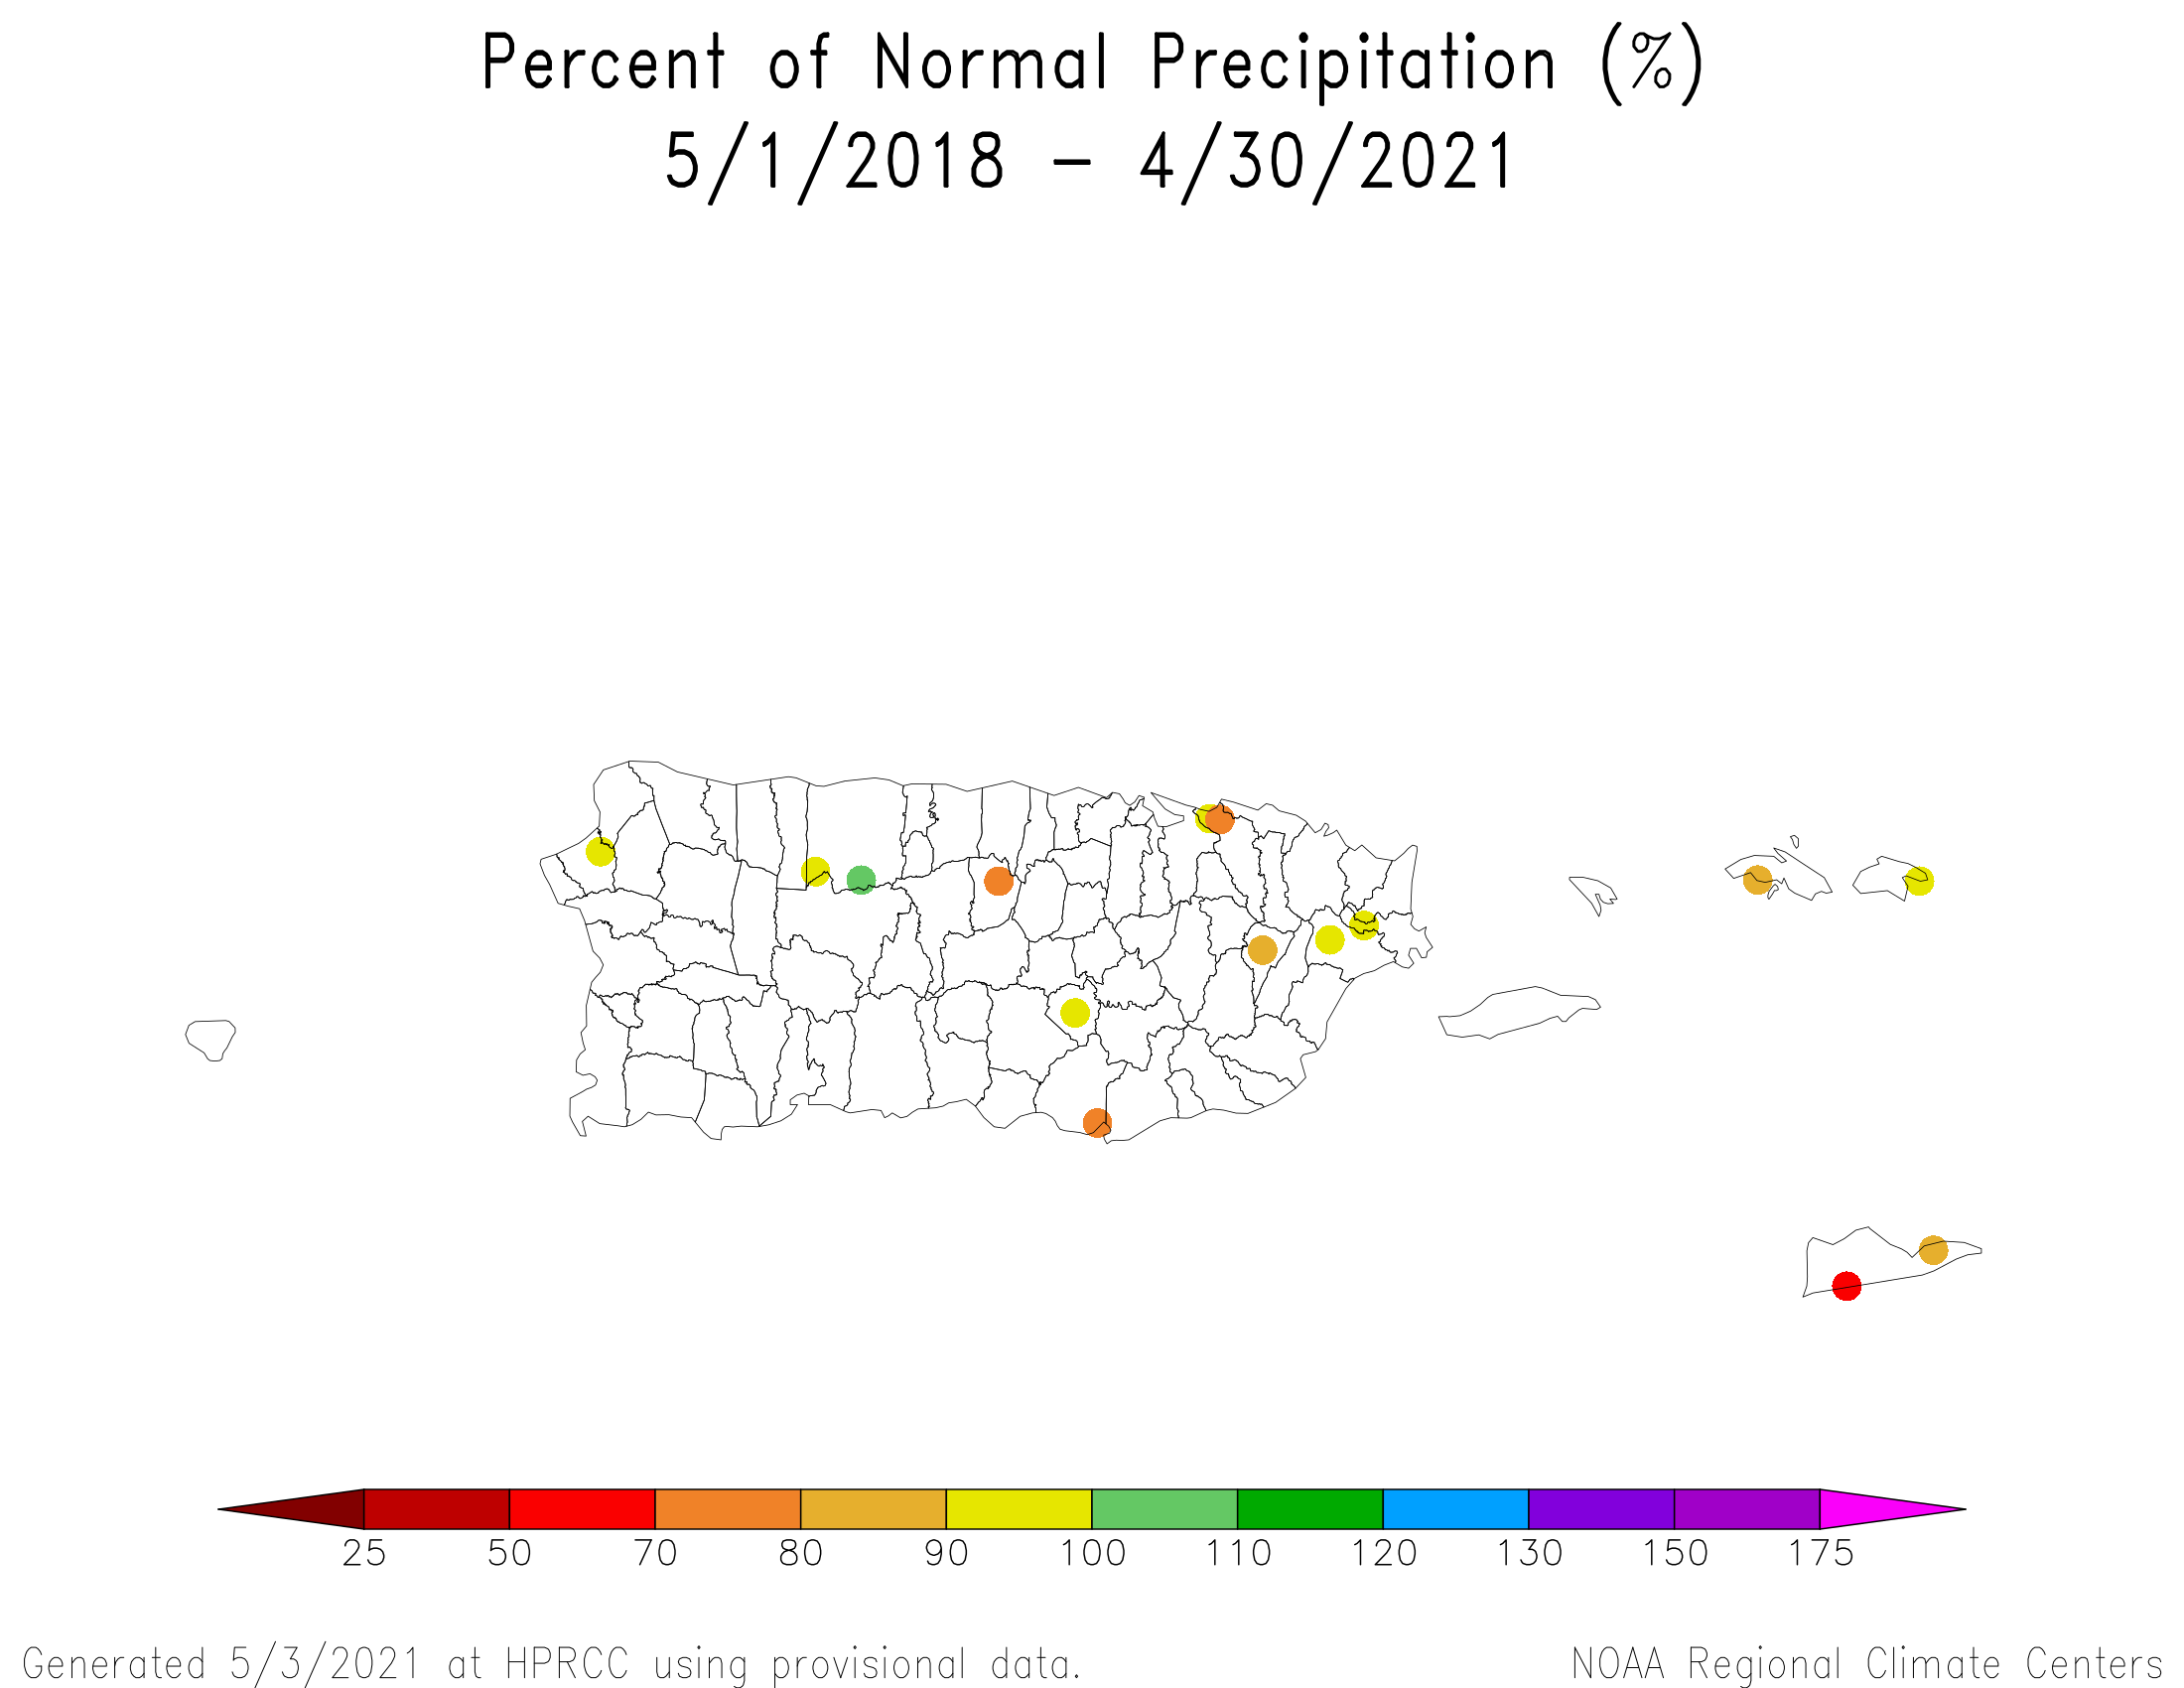
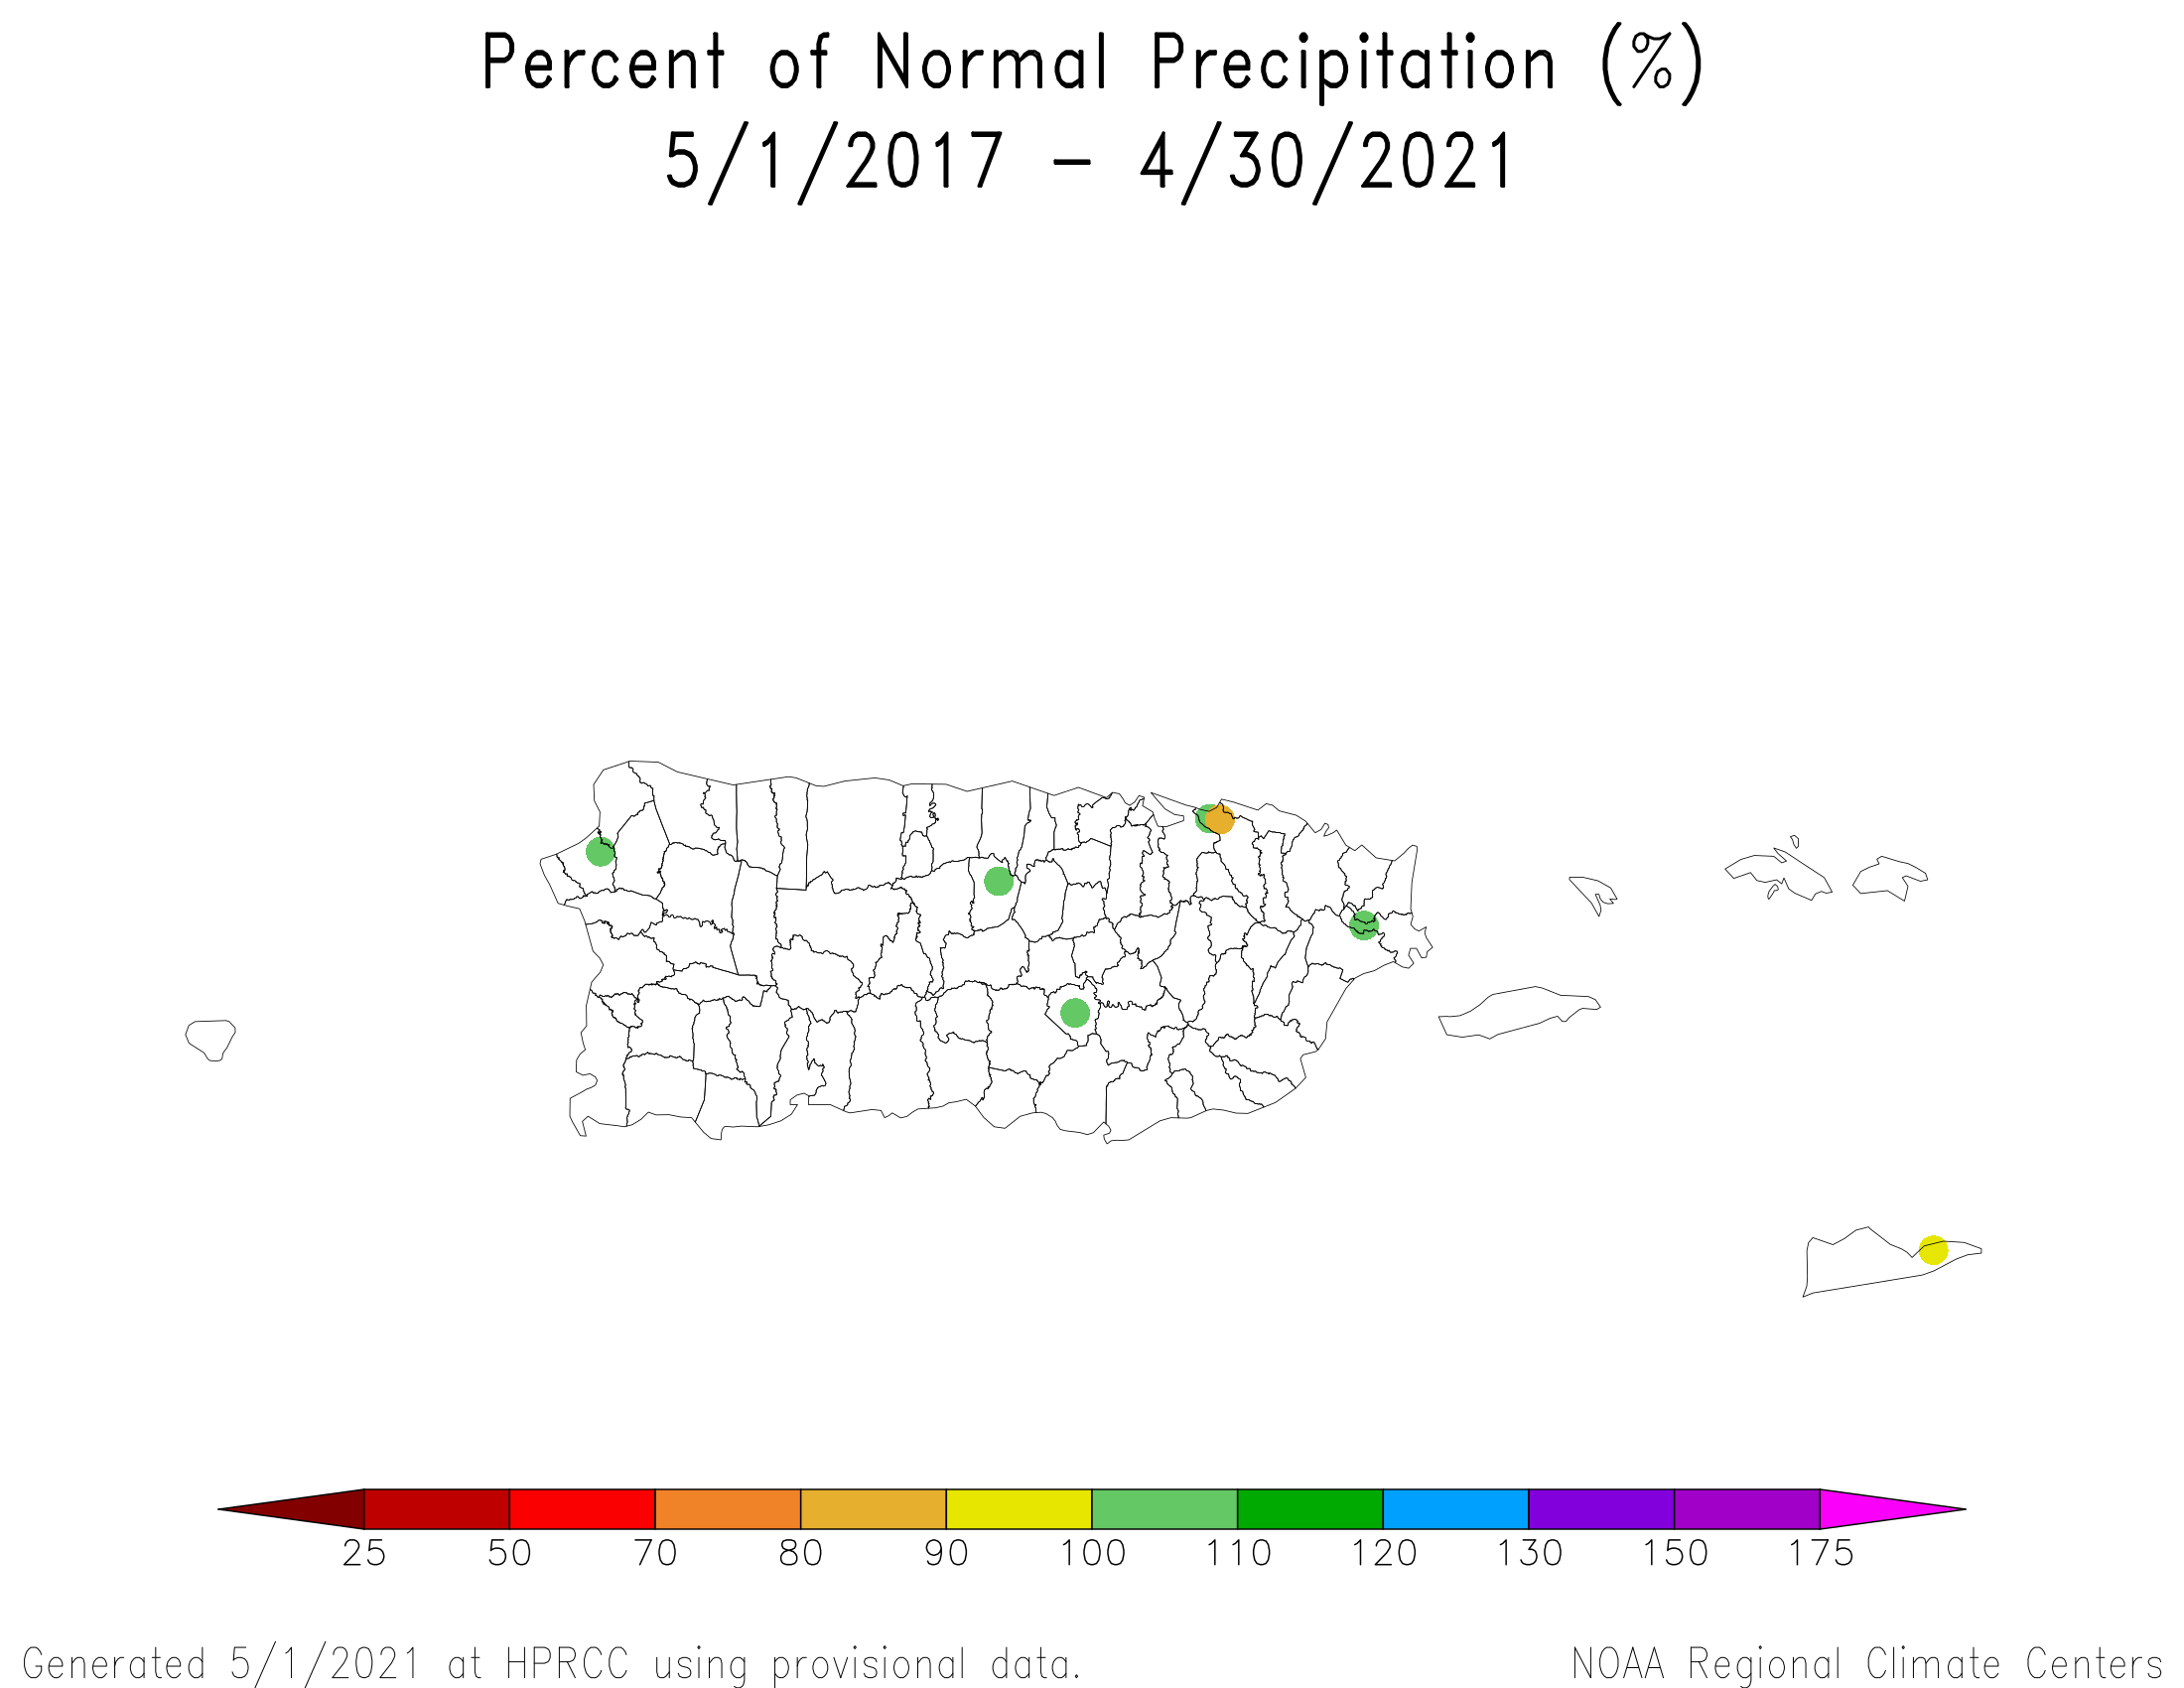
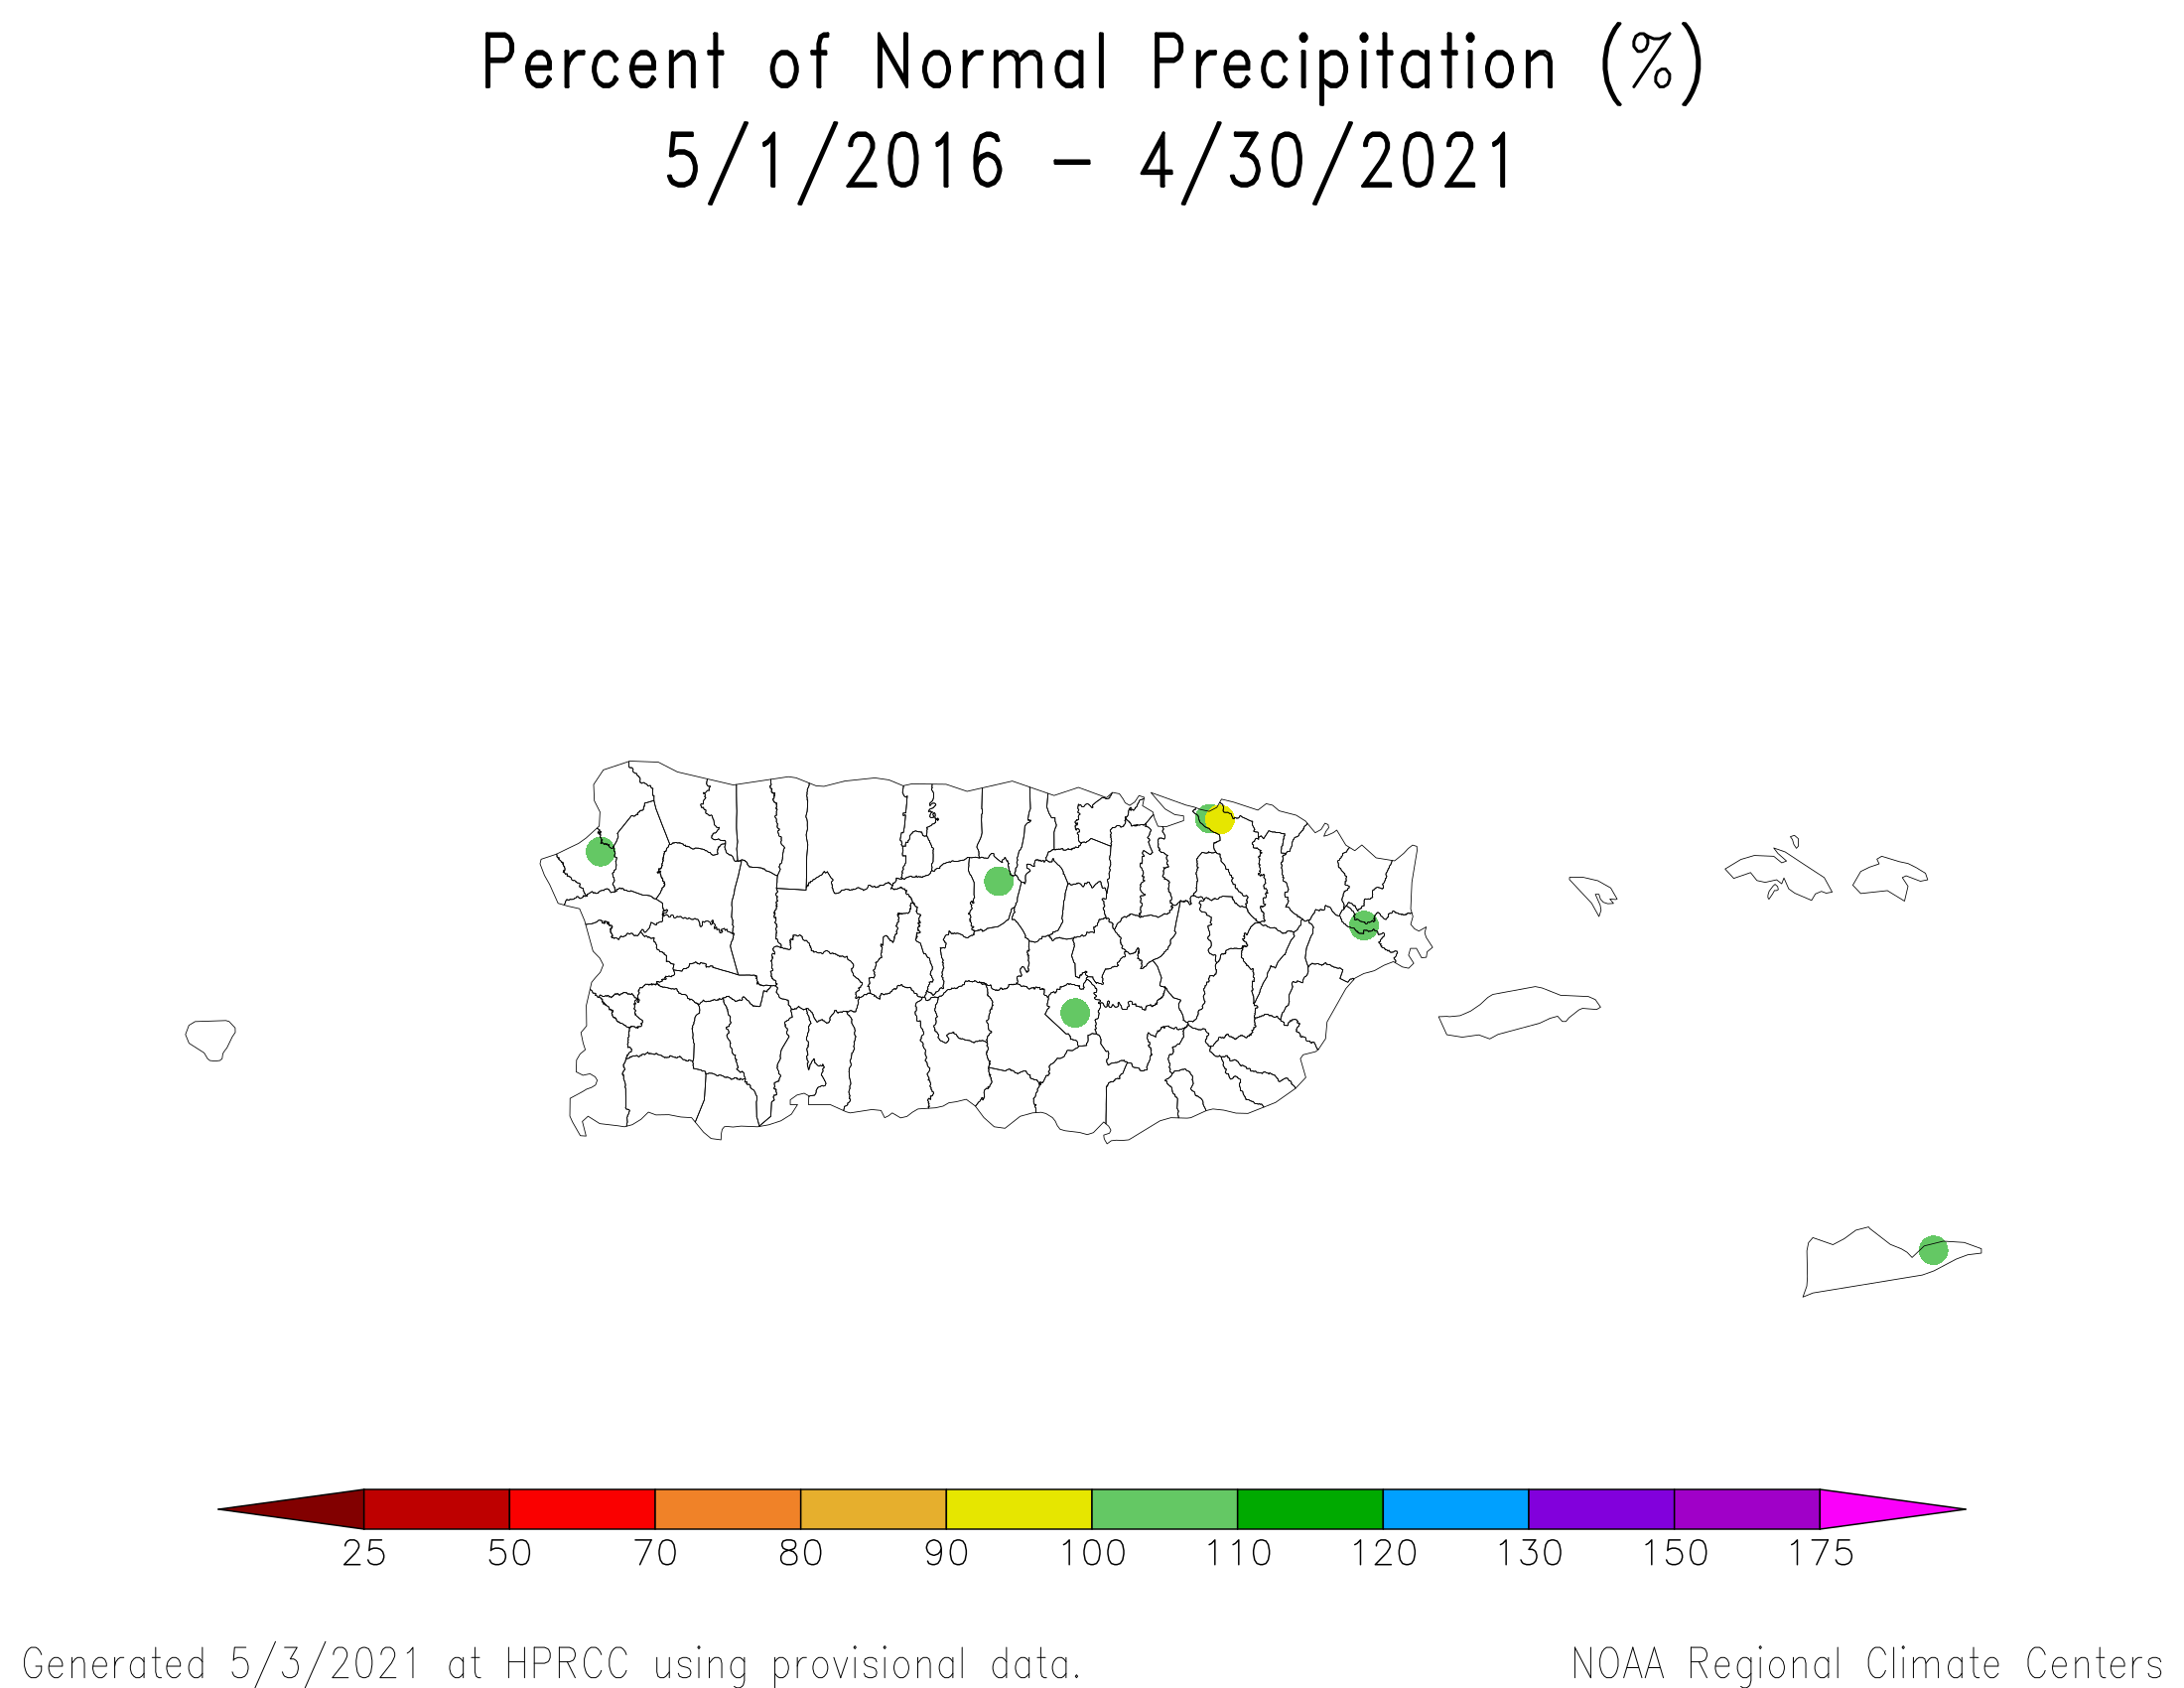
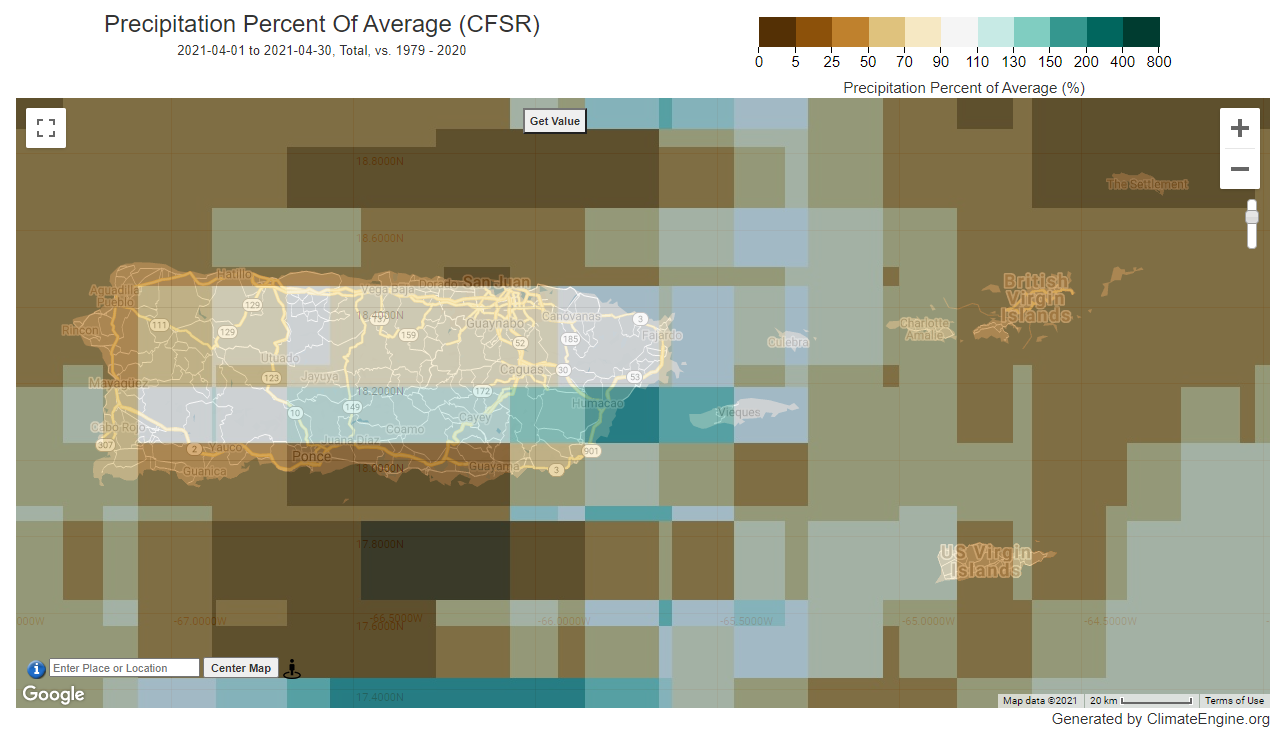
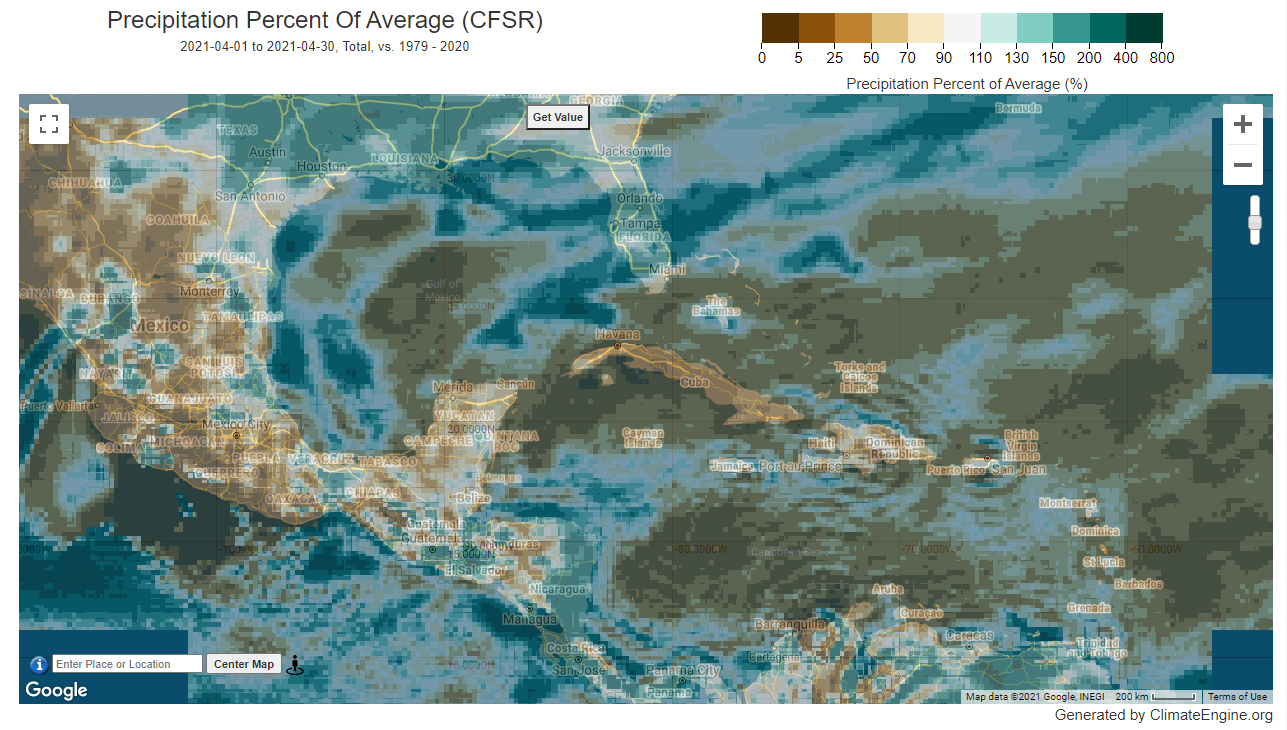
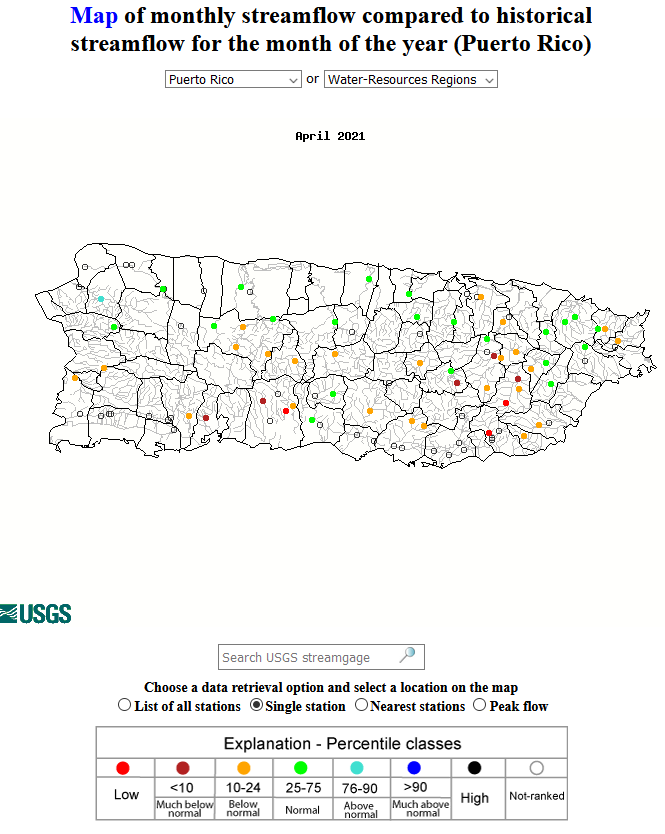
April 2021 was drier than normal across much of Puerto Rico (PR) and the U.S. Virgin Islands (USVI). Drier-than-normal conditions dominated the region, except in western PR, for much of the last 2-36 months, except in western and southern PR. Wetter-than-normal conditions dominated at longer time scales (radar-based precipitation anomaly estimates for the last 1, 2, 3, 4, 6, 7, 12 months) (low elevation station precipitation maps for the last 1, 2, 3, 4, 6, 7, 9, 10, 12, 24, 36, 48, 60 months) (climate engine model percent of normal precipitation map for the last month: PR and USVI, Caribbean and Gulf of Mexico region).
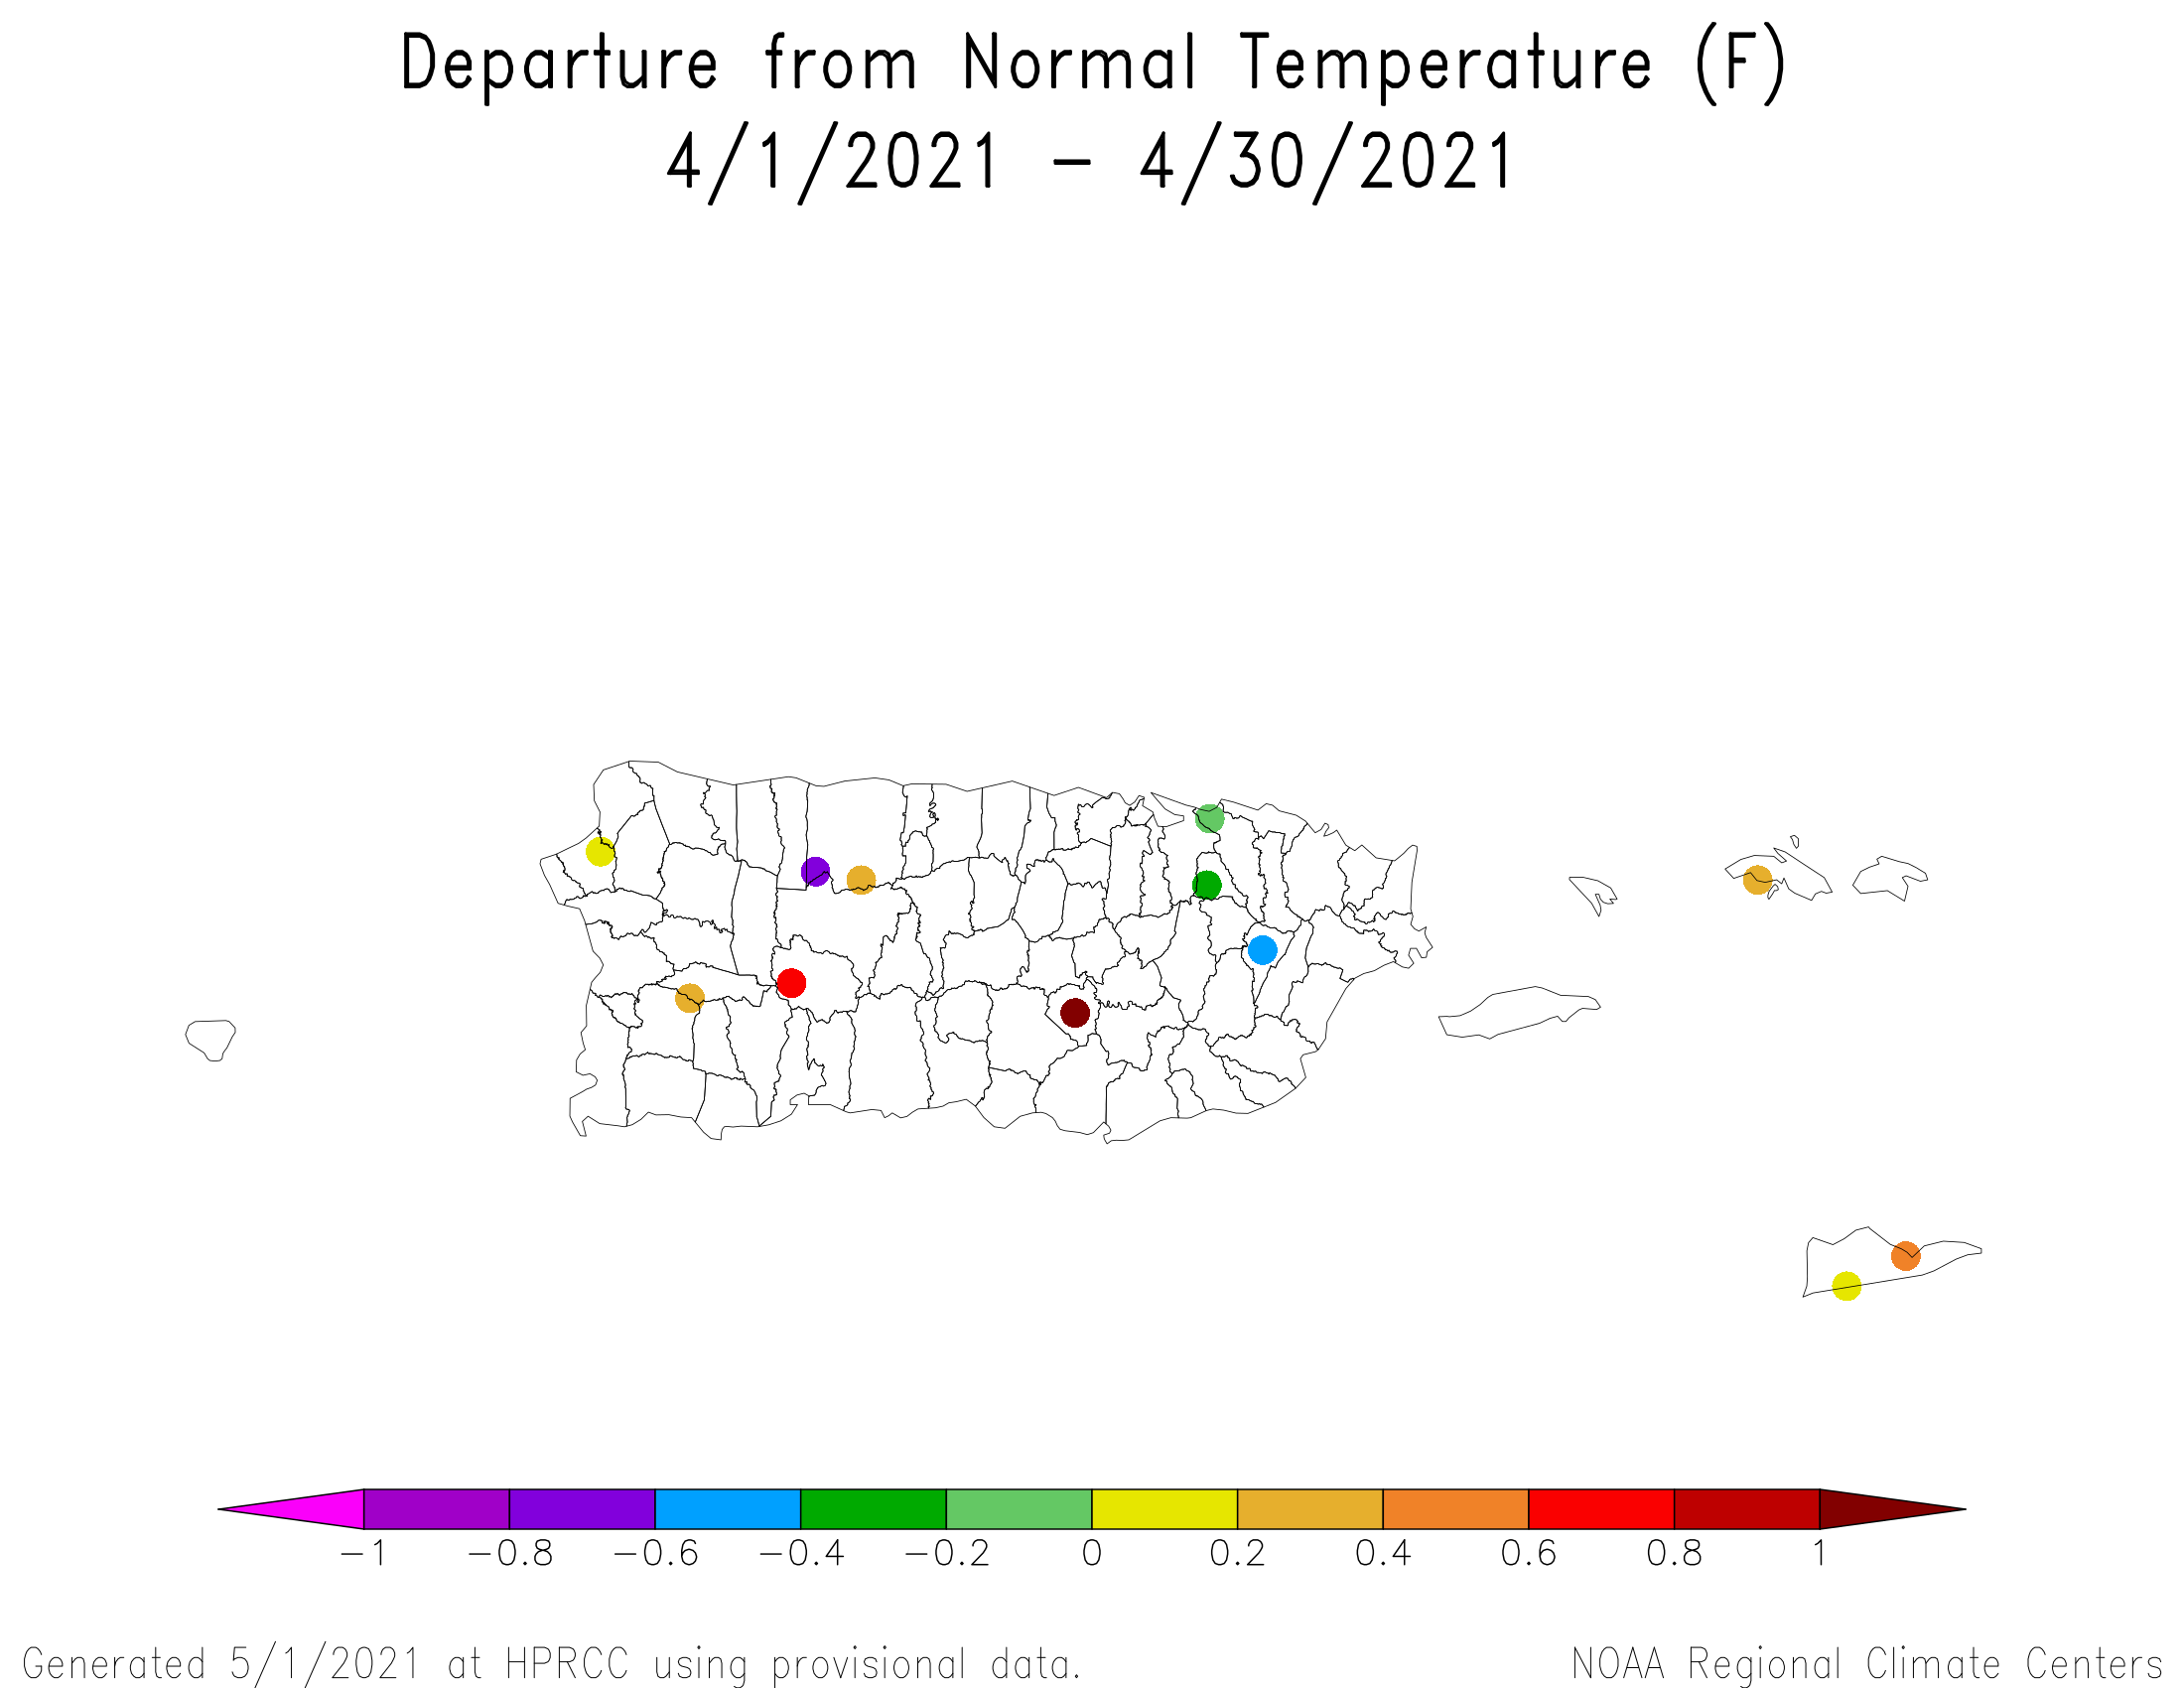
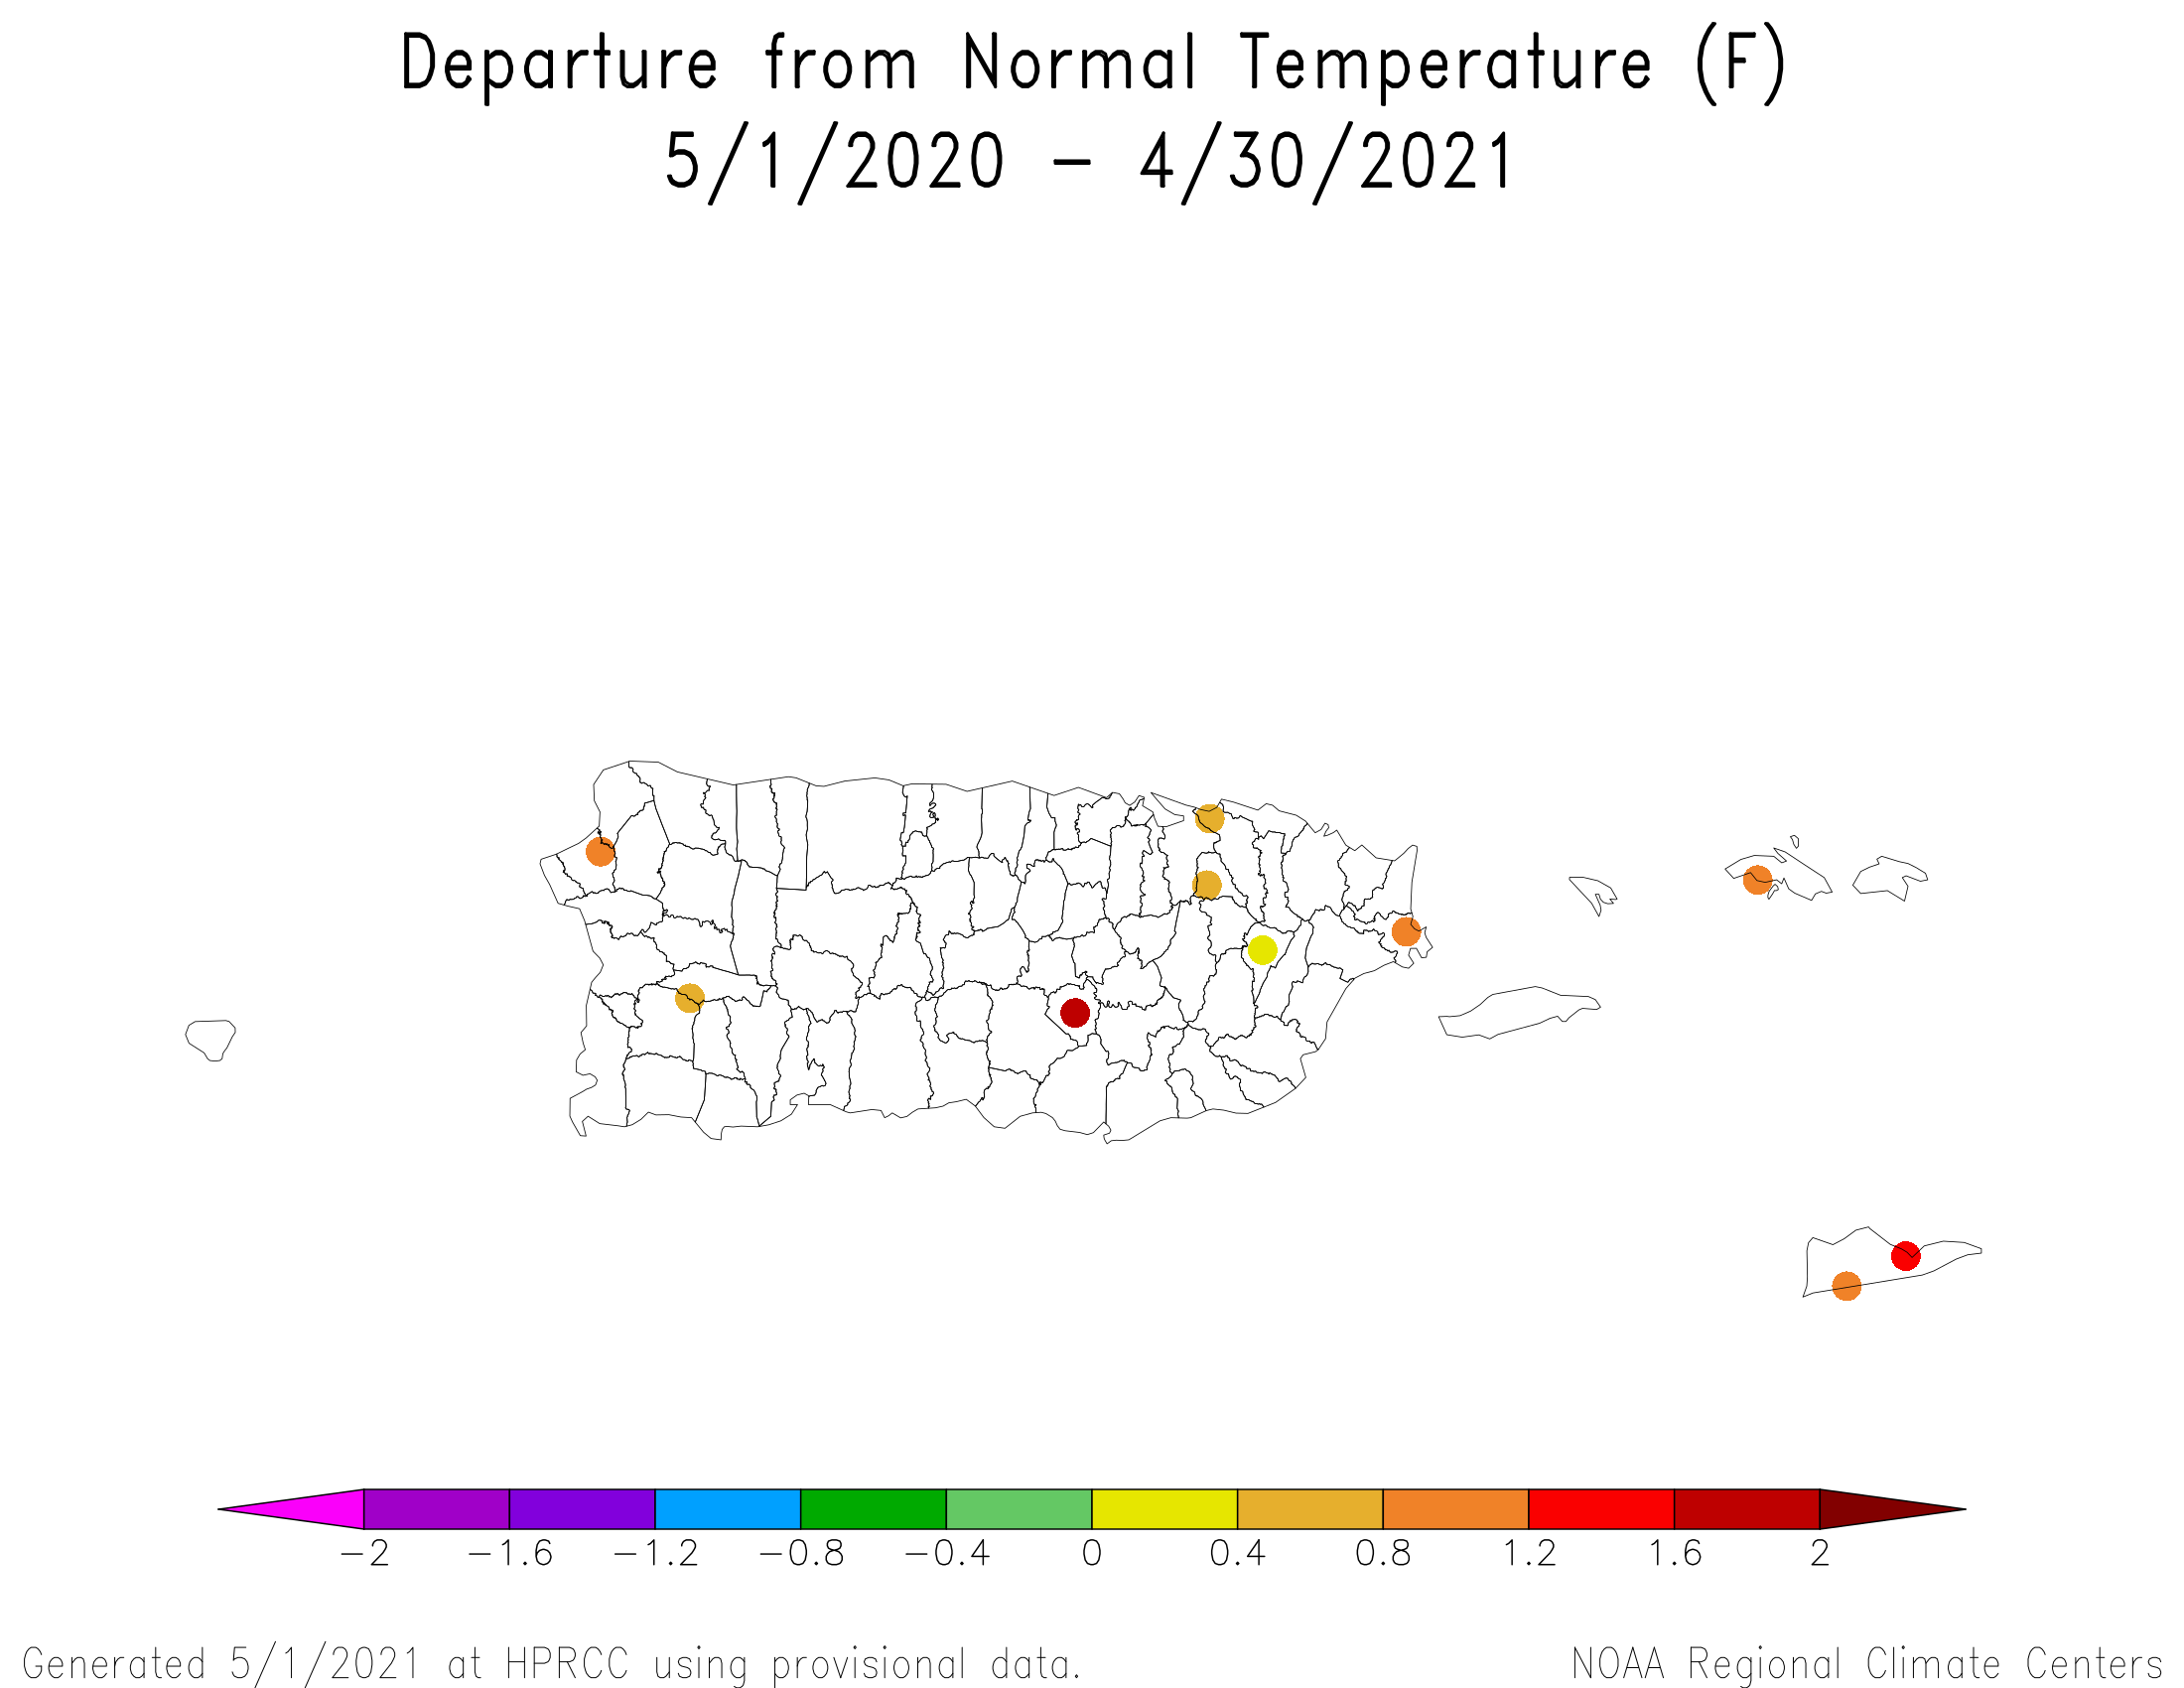
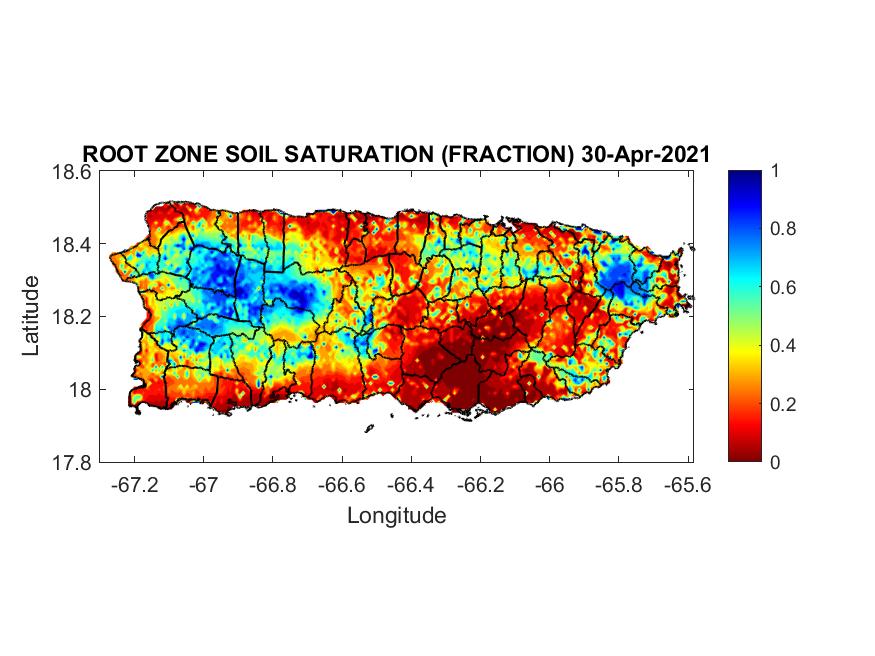
Temperatures across the USVI have been warmer than normal for the last 1 to 12 months. Puerto Rico has had a mixed temperature anomaly pattern for the 1- to 3-month time periods, with most stations warmer than normal at 12 months (low elevation station temperature anomaly maps for the last 1, 3, 12 months). Root zone analyses indicated that soil conditions were dry along the immediate southern coast, in the east-central region, and parts of the northern coast in PR. Monthly streamflow was below to much below normal across southern and eastern PR. In early May, reports were received of soil cracking on St. Thomas and St. Croix, with vegetation showing distress across all of the USVI and precautions such as ordering hay and water deliveries being taken to get through the dry season; a USDA Secretarial Drought Disaster Declaration was triggered for St. John and St. Thomas on May 6th, 2021; and some impact to crops and pastures has occurred, voluntary water-use restrictions had been requested, and some water restrictions were imposed in some areas on PR. Moderate drought grew to about 14.3 percent of PR, with abnormal dryness and drought expanding to about 77.0 percent of the territory, on the April 27th USDM map, while severe drought spread across the U.S. Virgin Islands.
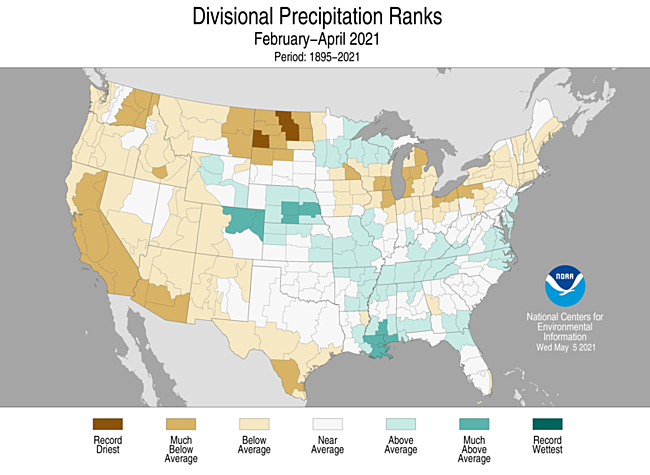
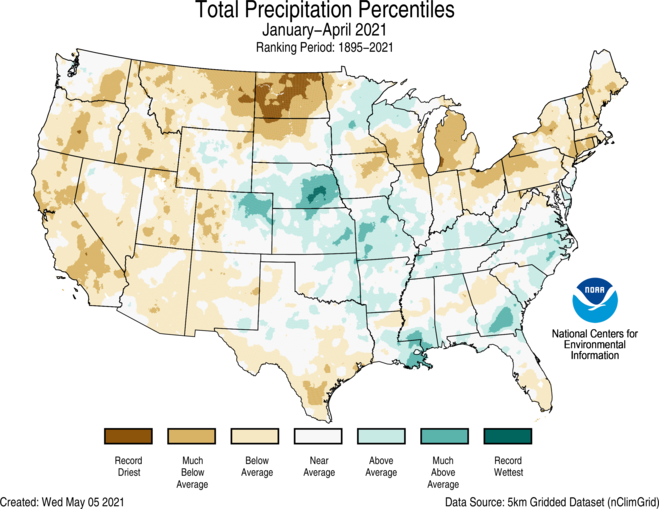
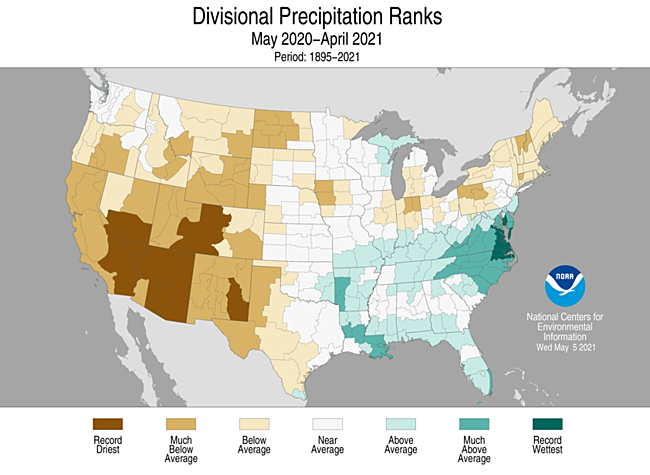
CONUS State Precipitation Ranks
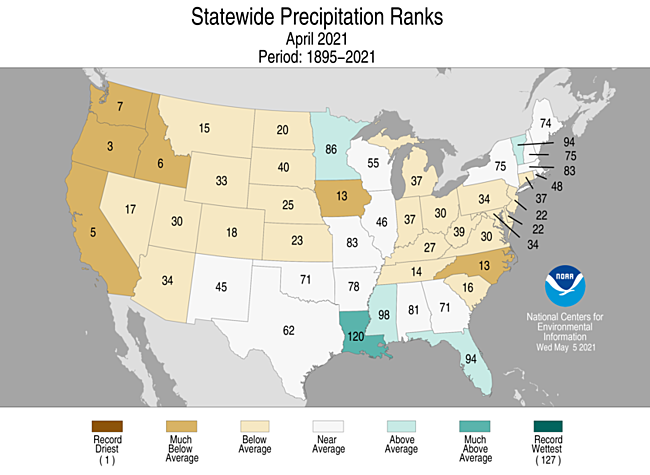
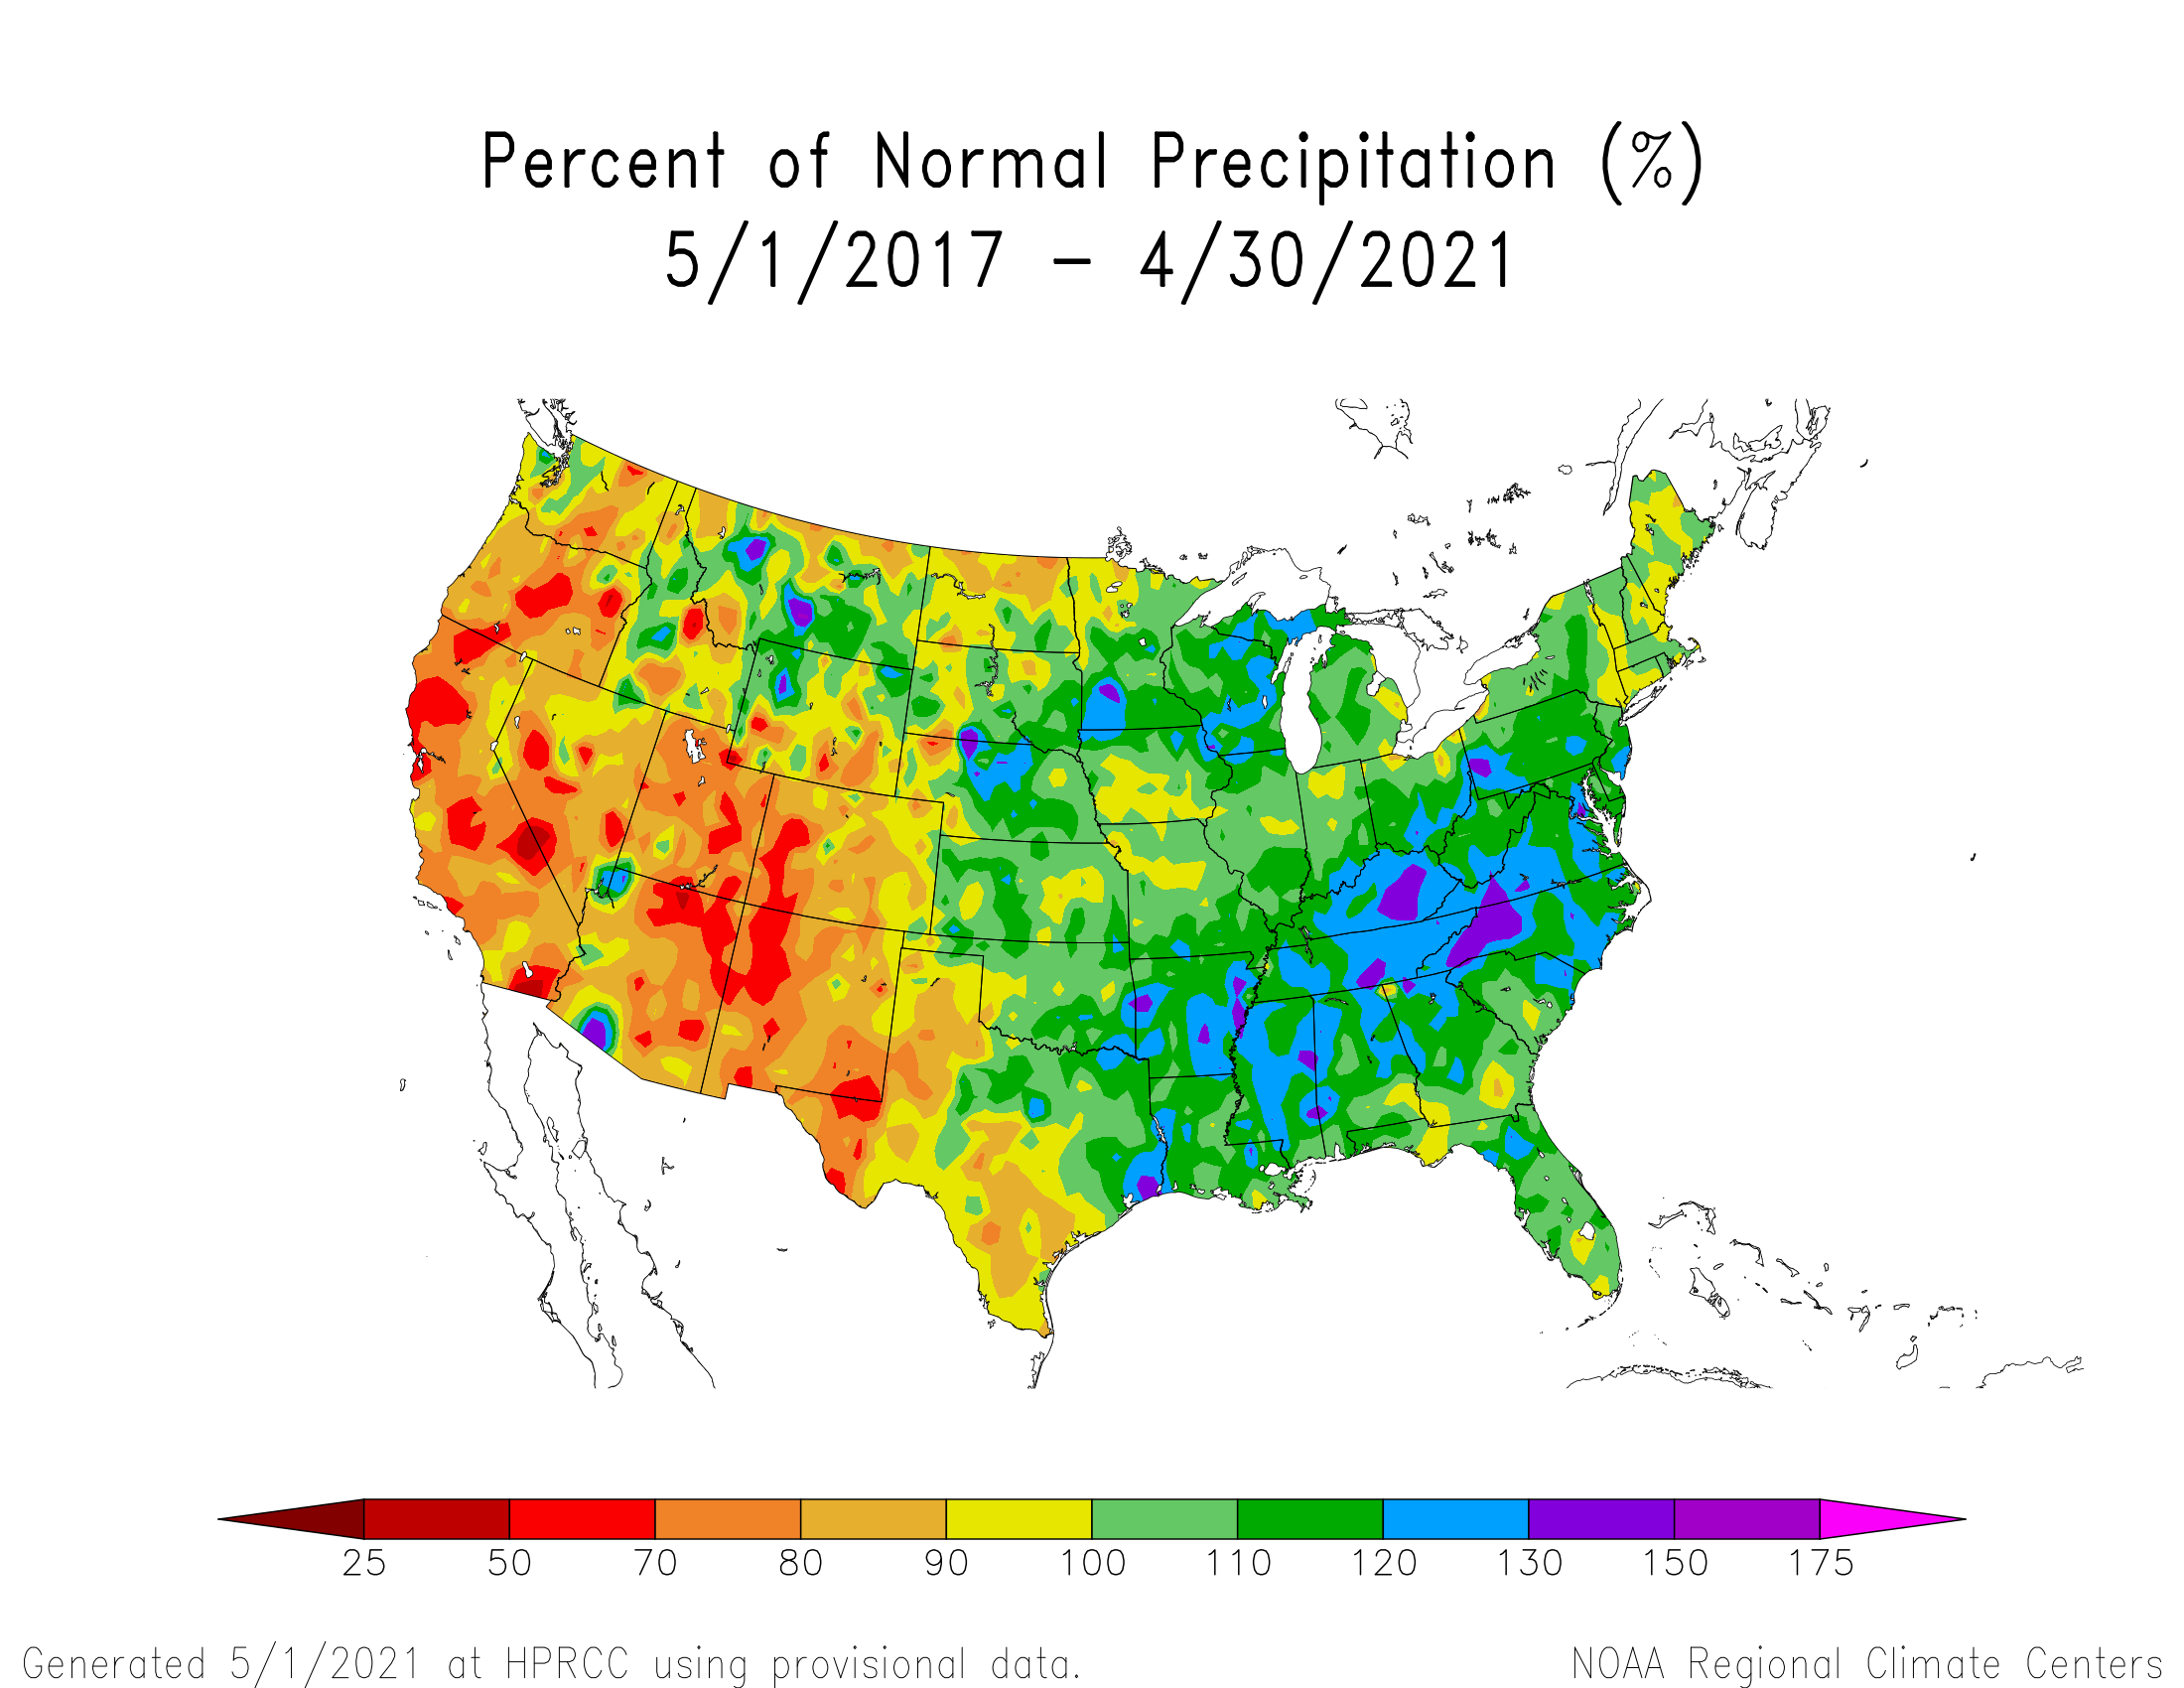
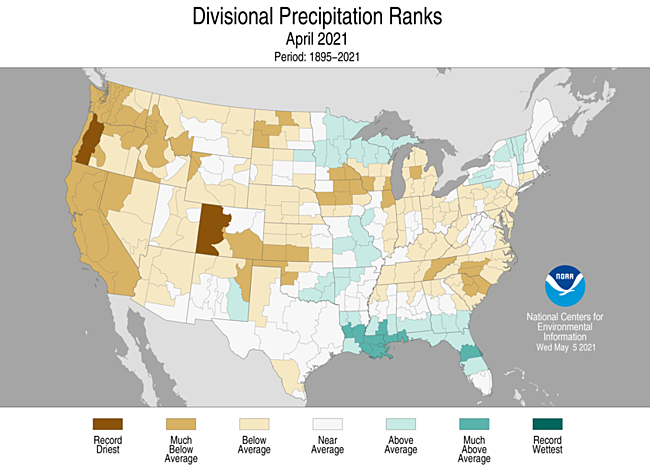
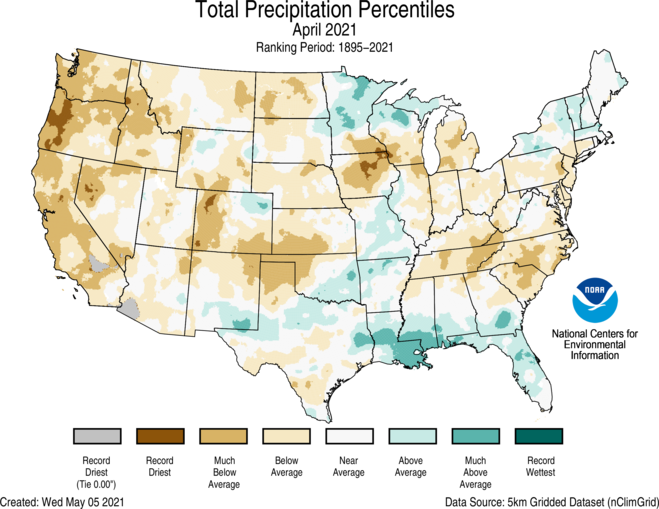
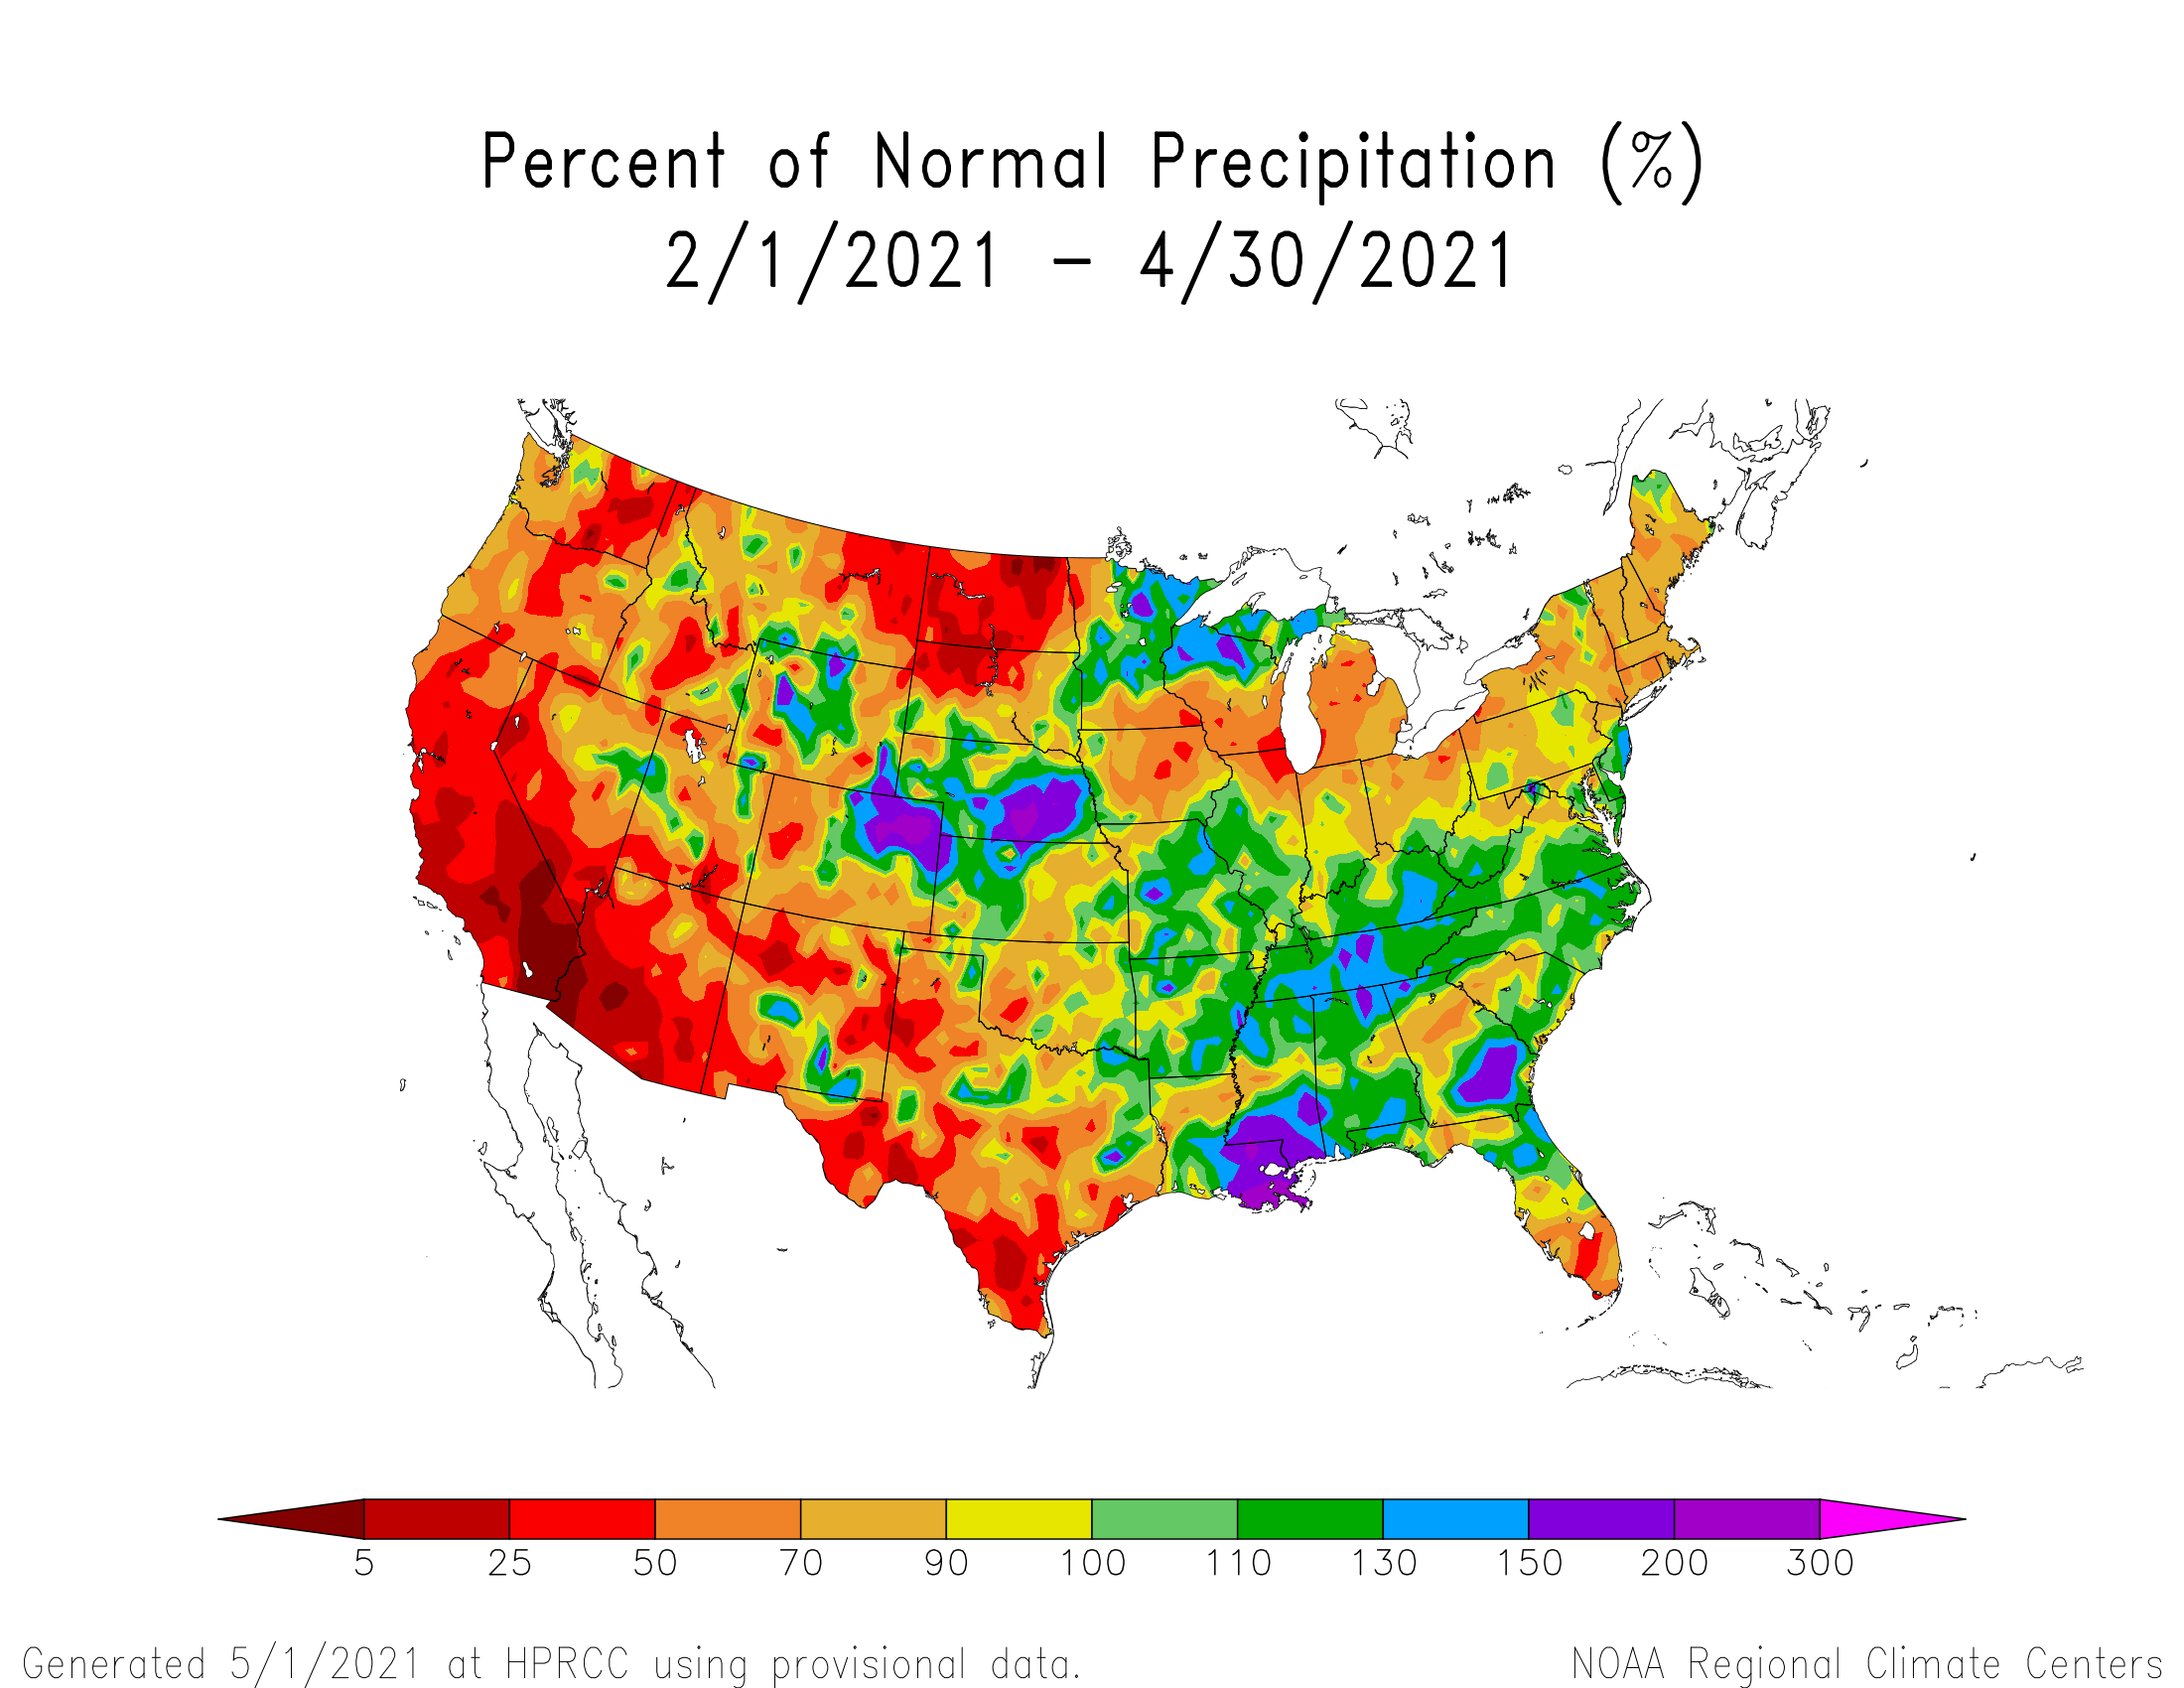
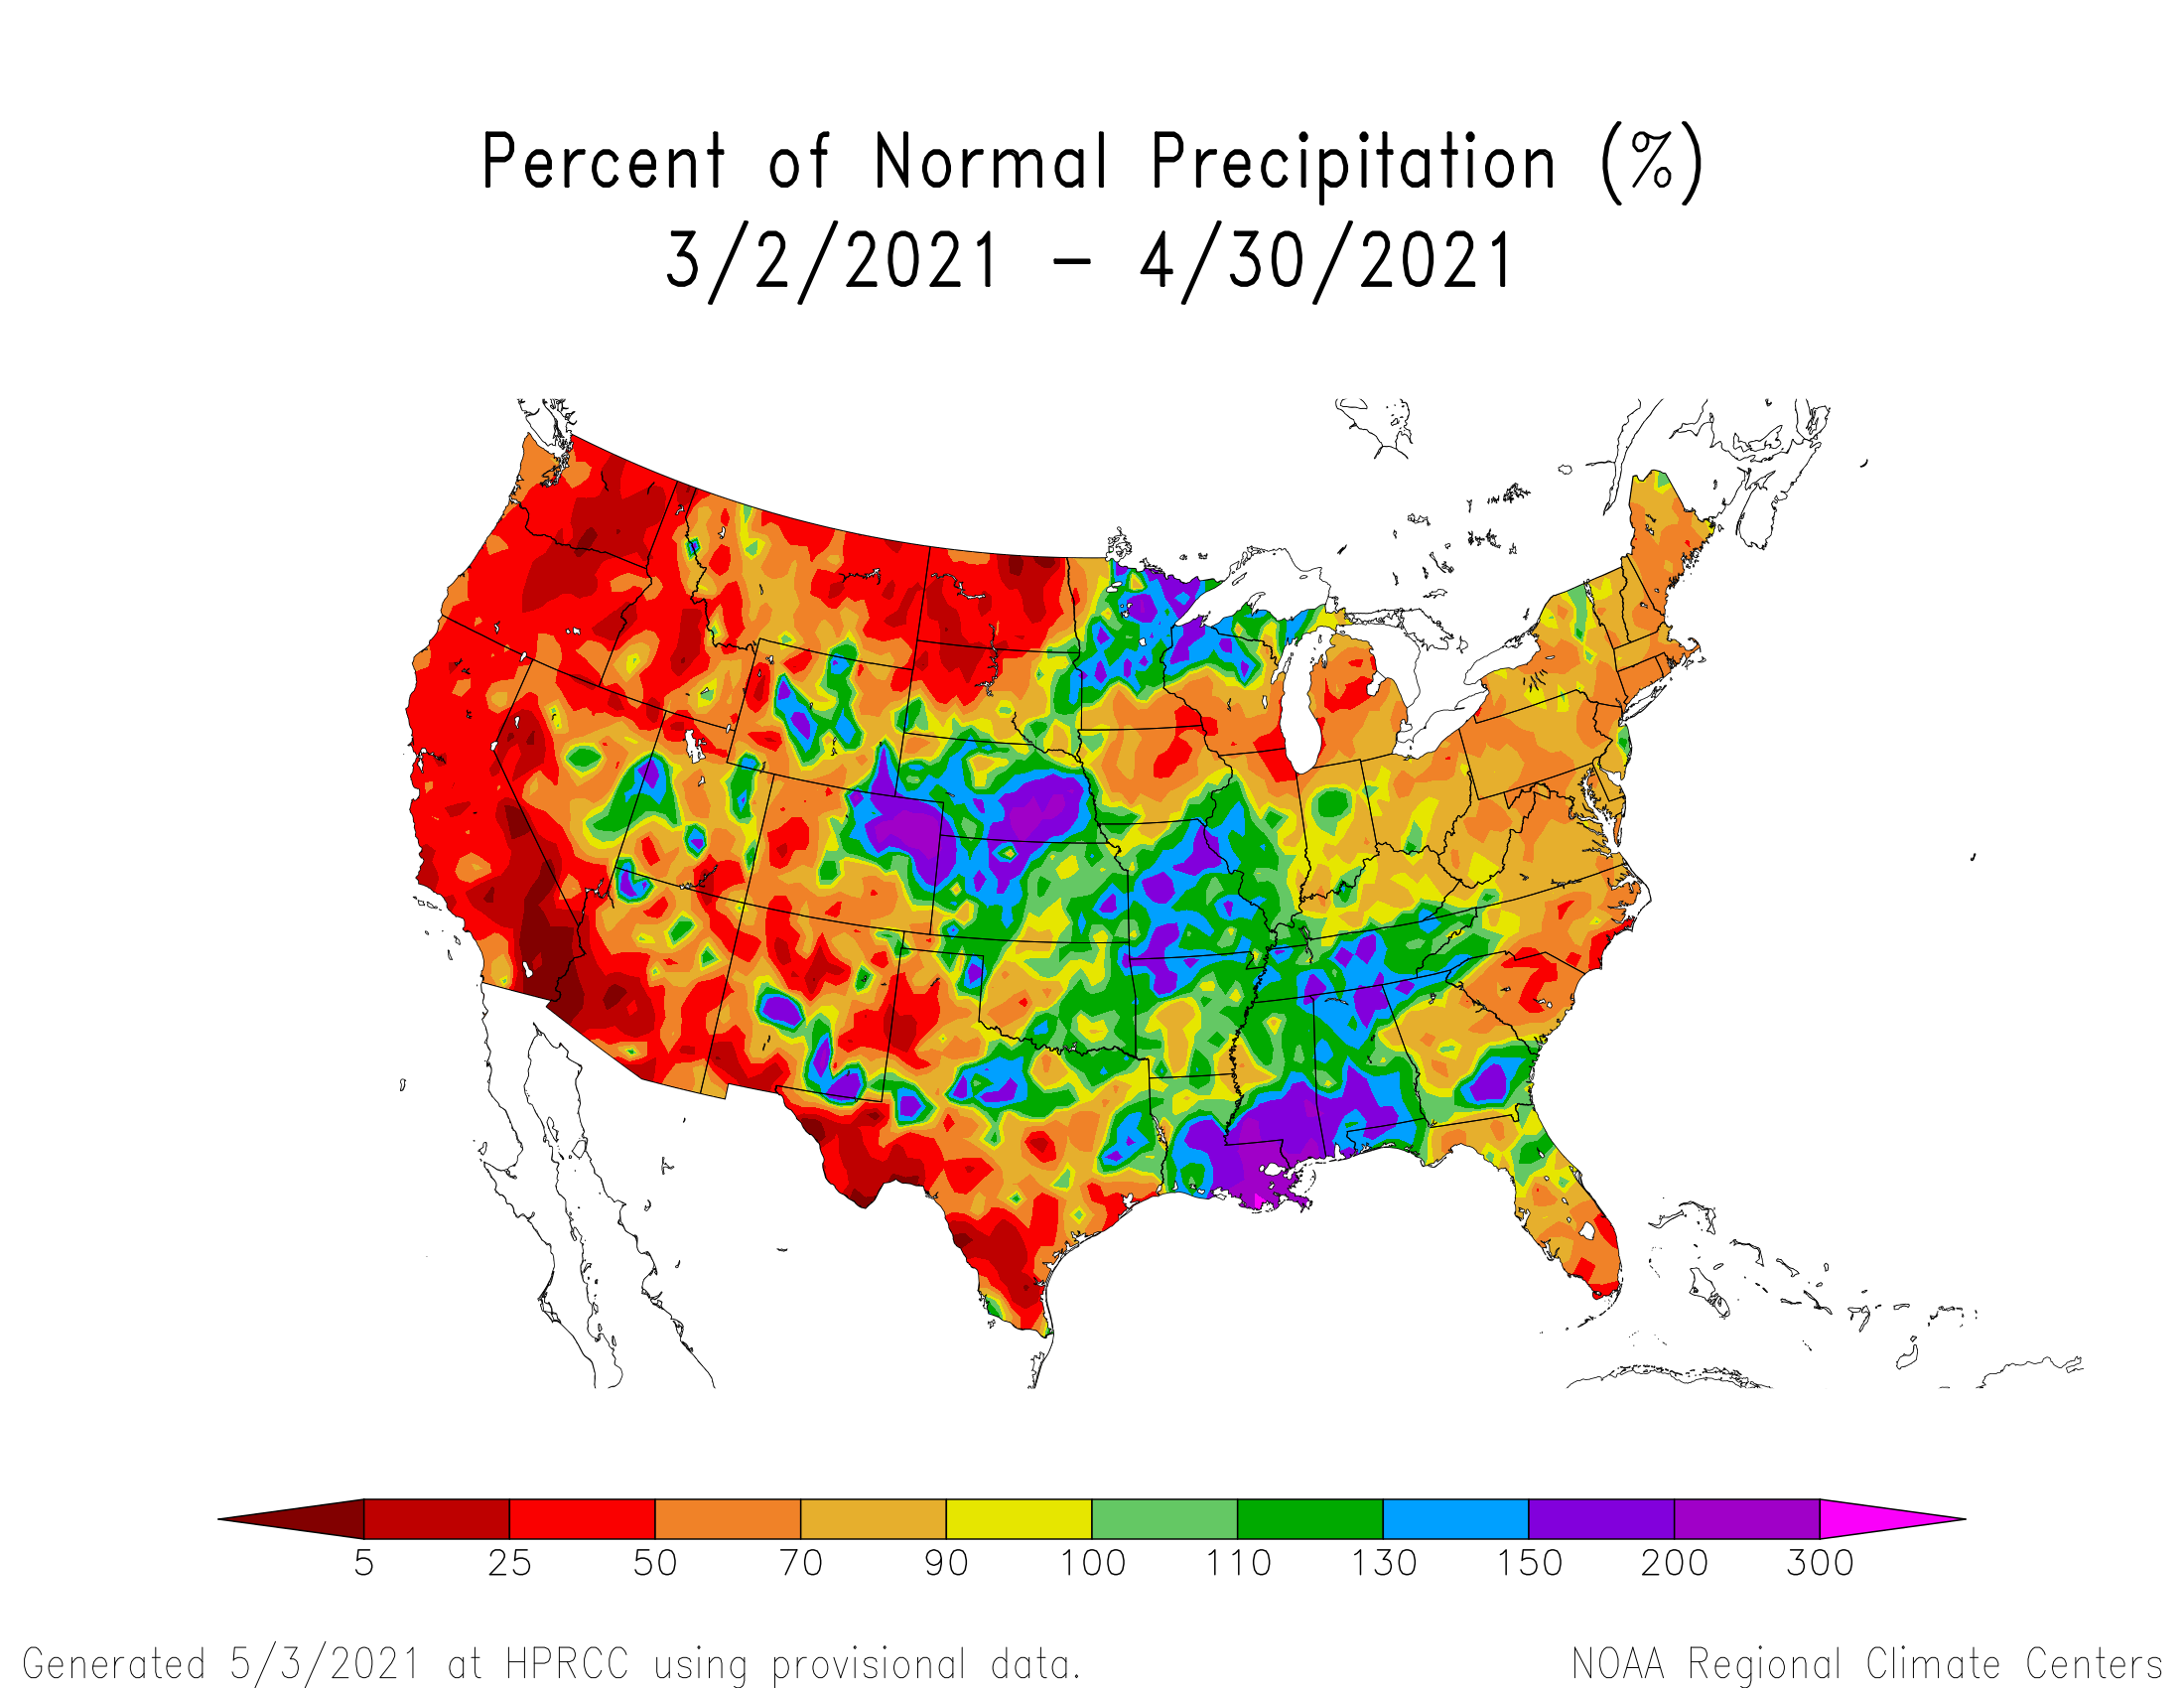
April was drier than normal across most of the West, Great Plains, Great Lakes to southern New England, and the Ohio and Tennessee Valleys to coastal Carolinas, with record dryness occurring in parts of the West and Midwest. Twenty-nine states in these regions had a precipitation rank in the driest third of the 127-year historical record for April, including four that ranked in the top ten driest category — Oregon (third driest), California (fifth driest), Idaho (sixth driest), and Washington (seventh driest).
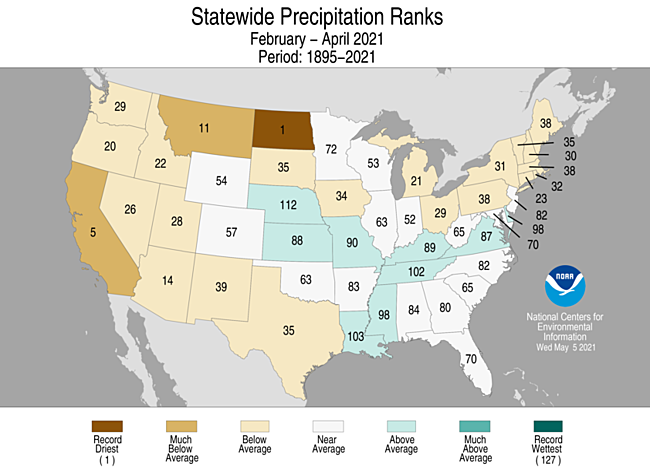
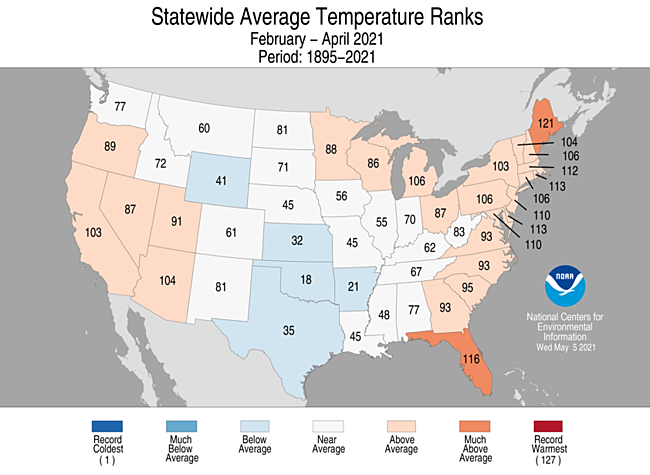
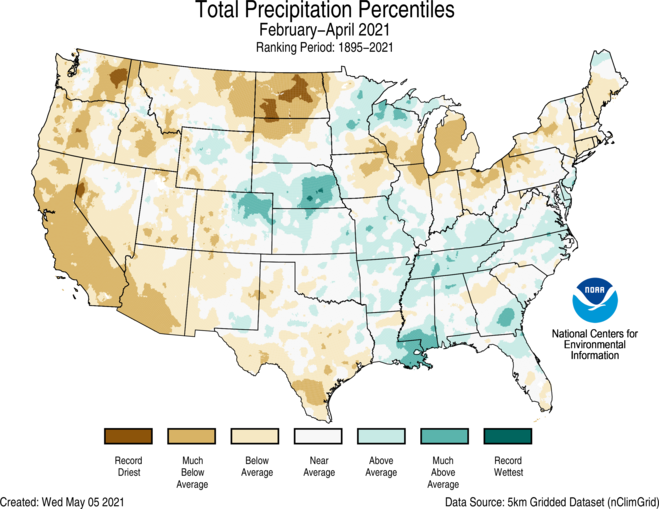
February-April was drier than normal across most of the West, Great Plains, and Great Lakes to Northeast, with record dryness occurring in parts of the West and northern Plains. Twenty-three states in these regions had a precipitation rank in the driest third of the historical record for February-April, including North Dakota, which had the driest February-April on record, and California (fifth driest).
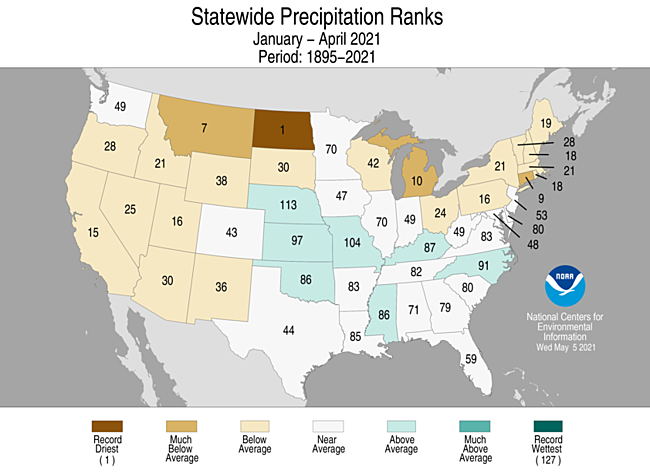
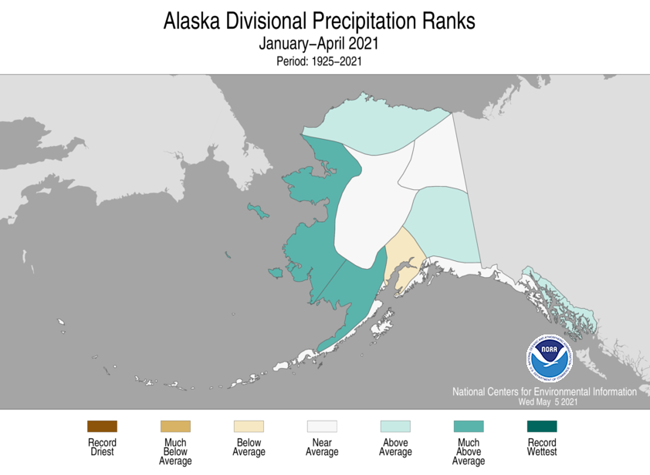
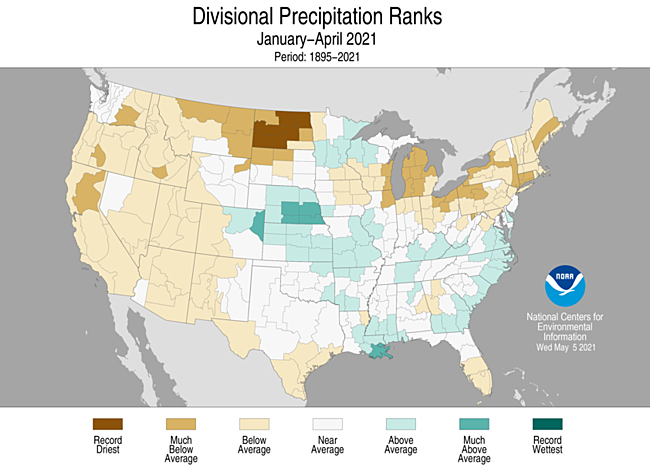
For the year to date (January-April), essentially the same areas were drier than normal as for February-April — most of the West, the northern and southern Great Plains, and the Great Lakes to Northeast, as well as Iowa and southern Florida. Record dryness occurred in parts of the northern Plains, especially North Dakota. Twenty-two states in these regions had a precipitation rank in the driest third of the historical record for January-April, including North Dakota, which had the driest January-April on record, Montana (seventh driest), Conecticut (ninth driest), and Michigan (tenth driest).
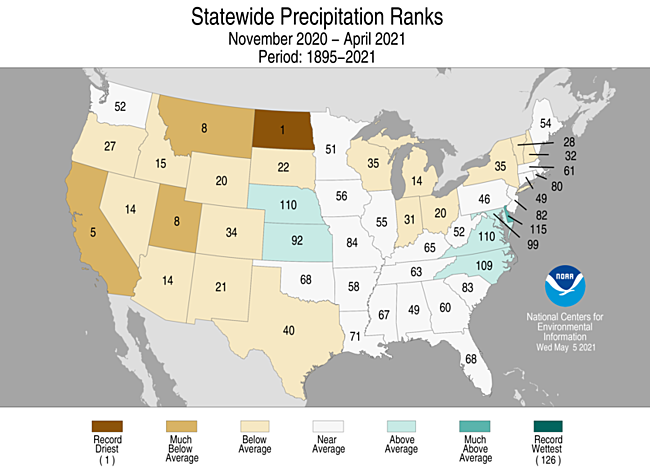
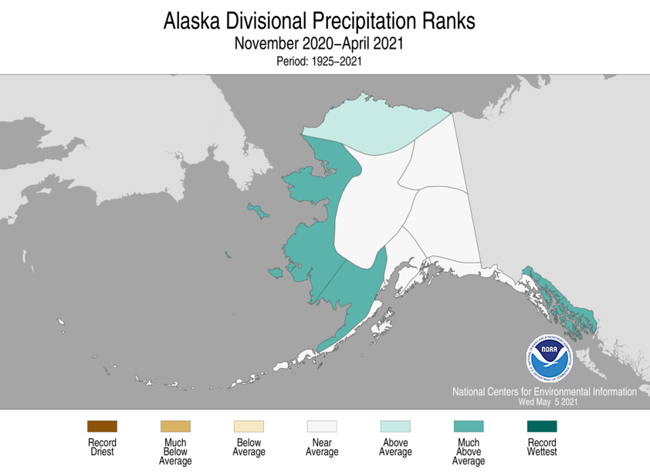
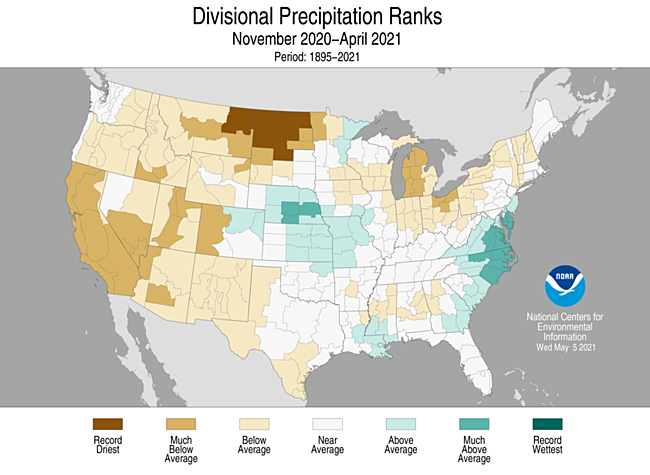
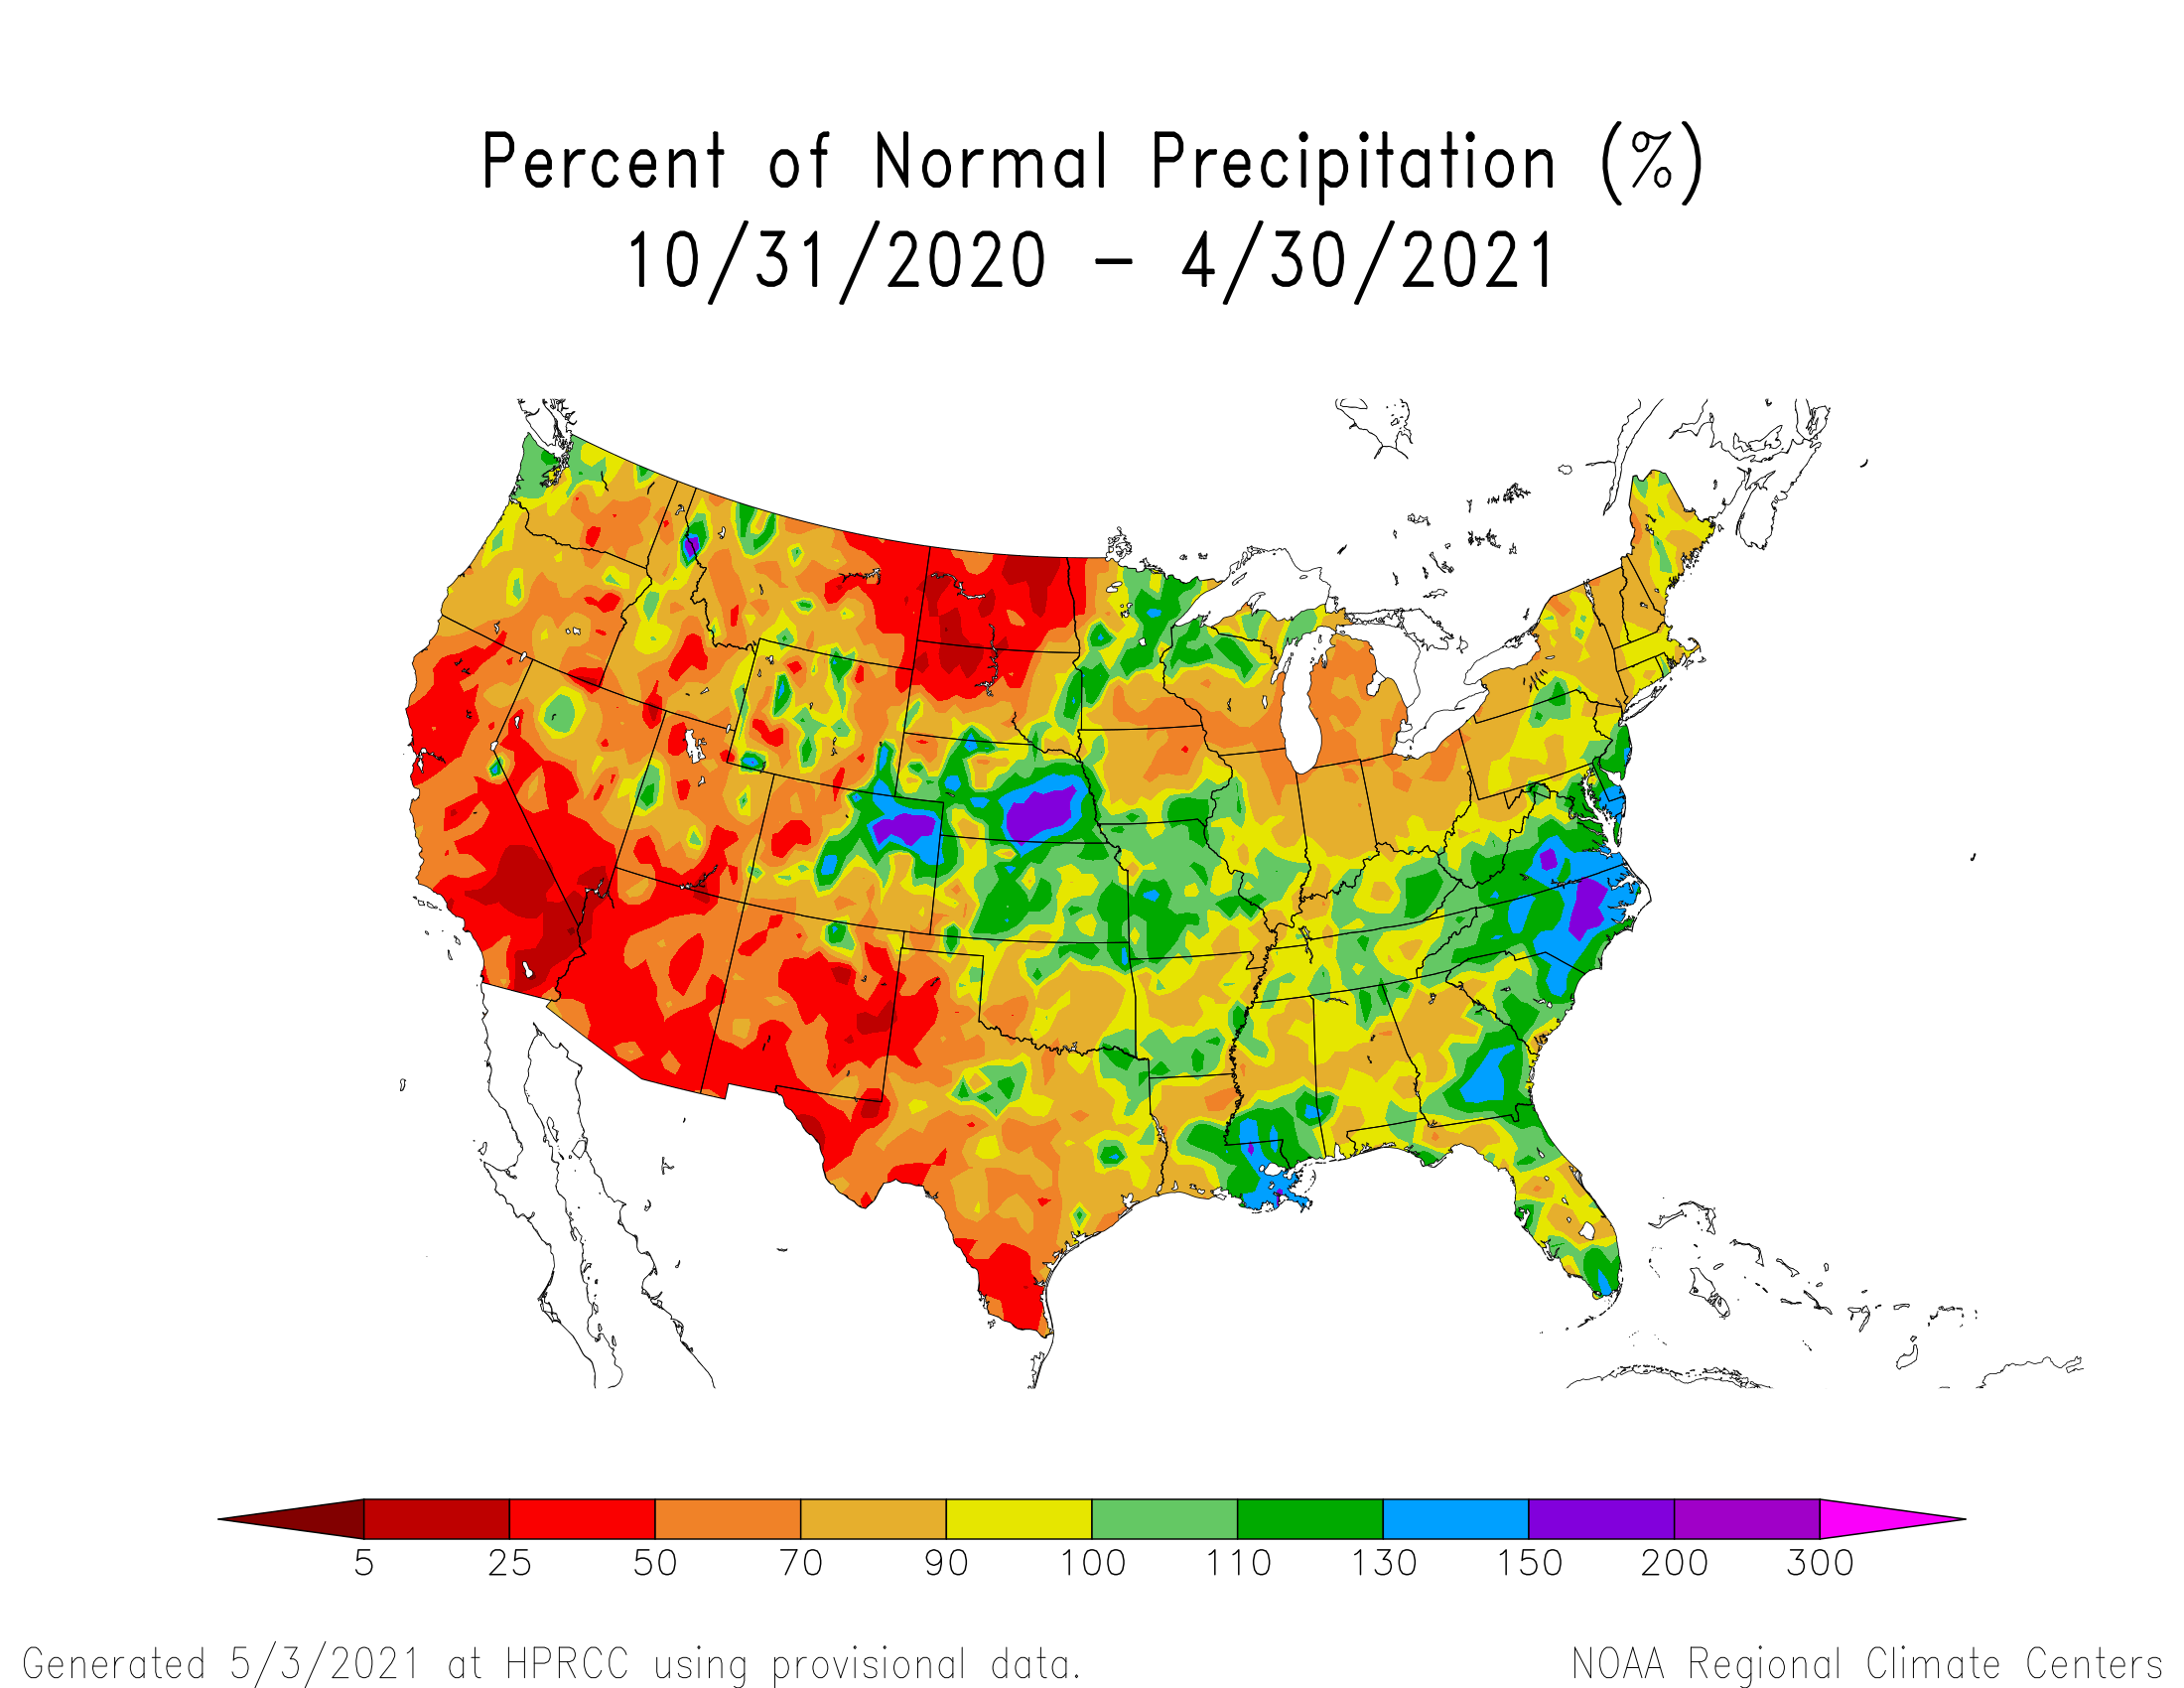
For the last six months (November 2020-April 2021), the same core areas were drier than normal — most of the West, the northern and southern Great Plains, and Iowa and the Great Lakes to Northeast, but there were also strips of dryness in the Southeast. Record dryness was evident in the northern Plains, again notably in North Dakota. Twenty states in these regions had a precipitation rank in the driest third of the historical record for November-April, including four in the top ten driest category — North Dakota, which had the driest November-April on record, California (fifth driest), Montana (eighth driest), and Utah (also eighth driest).
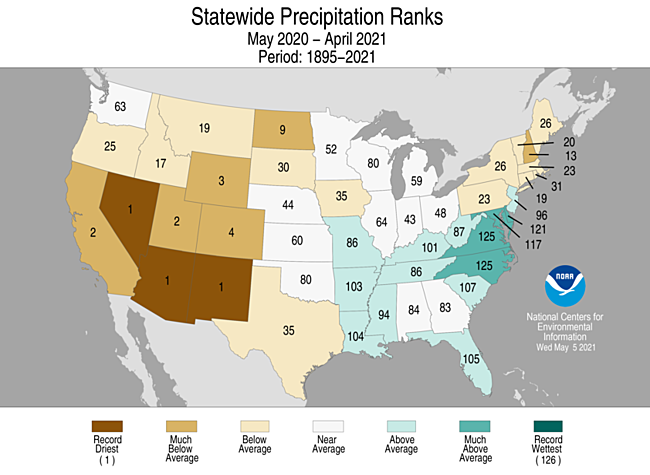
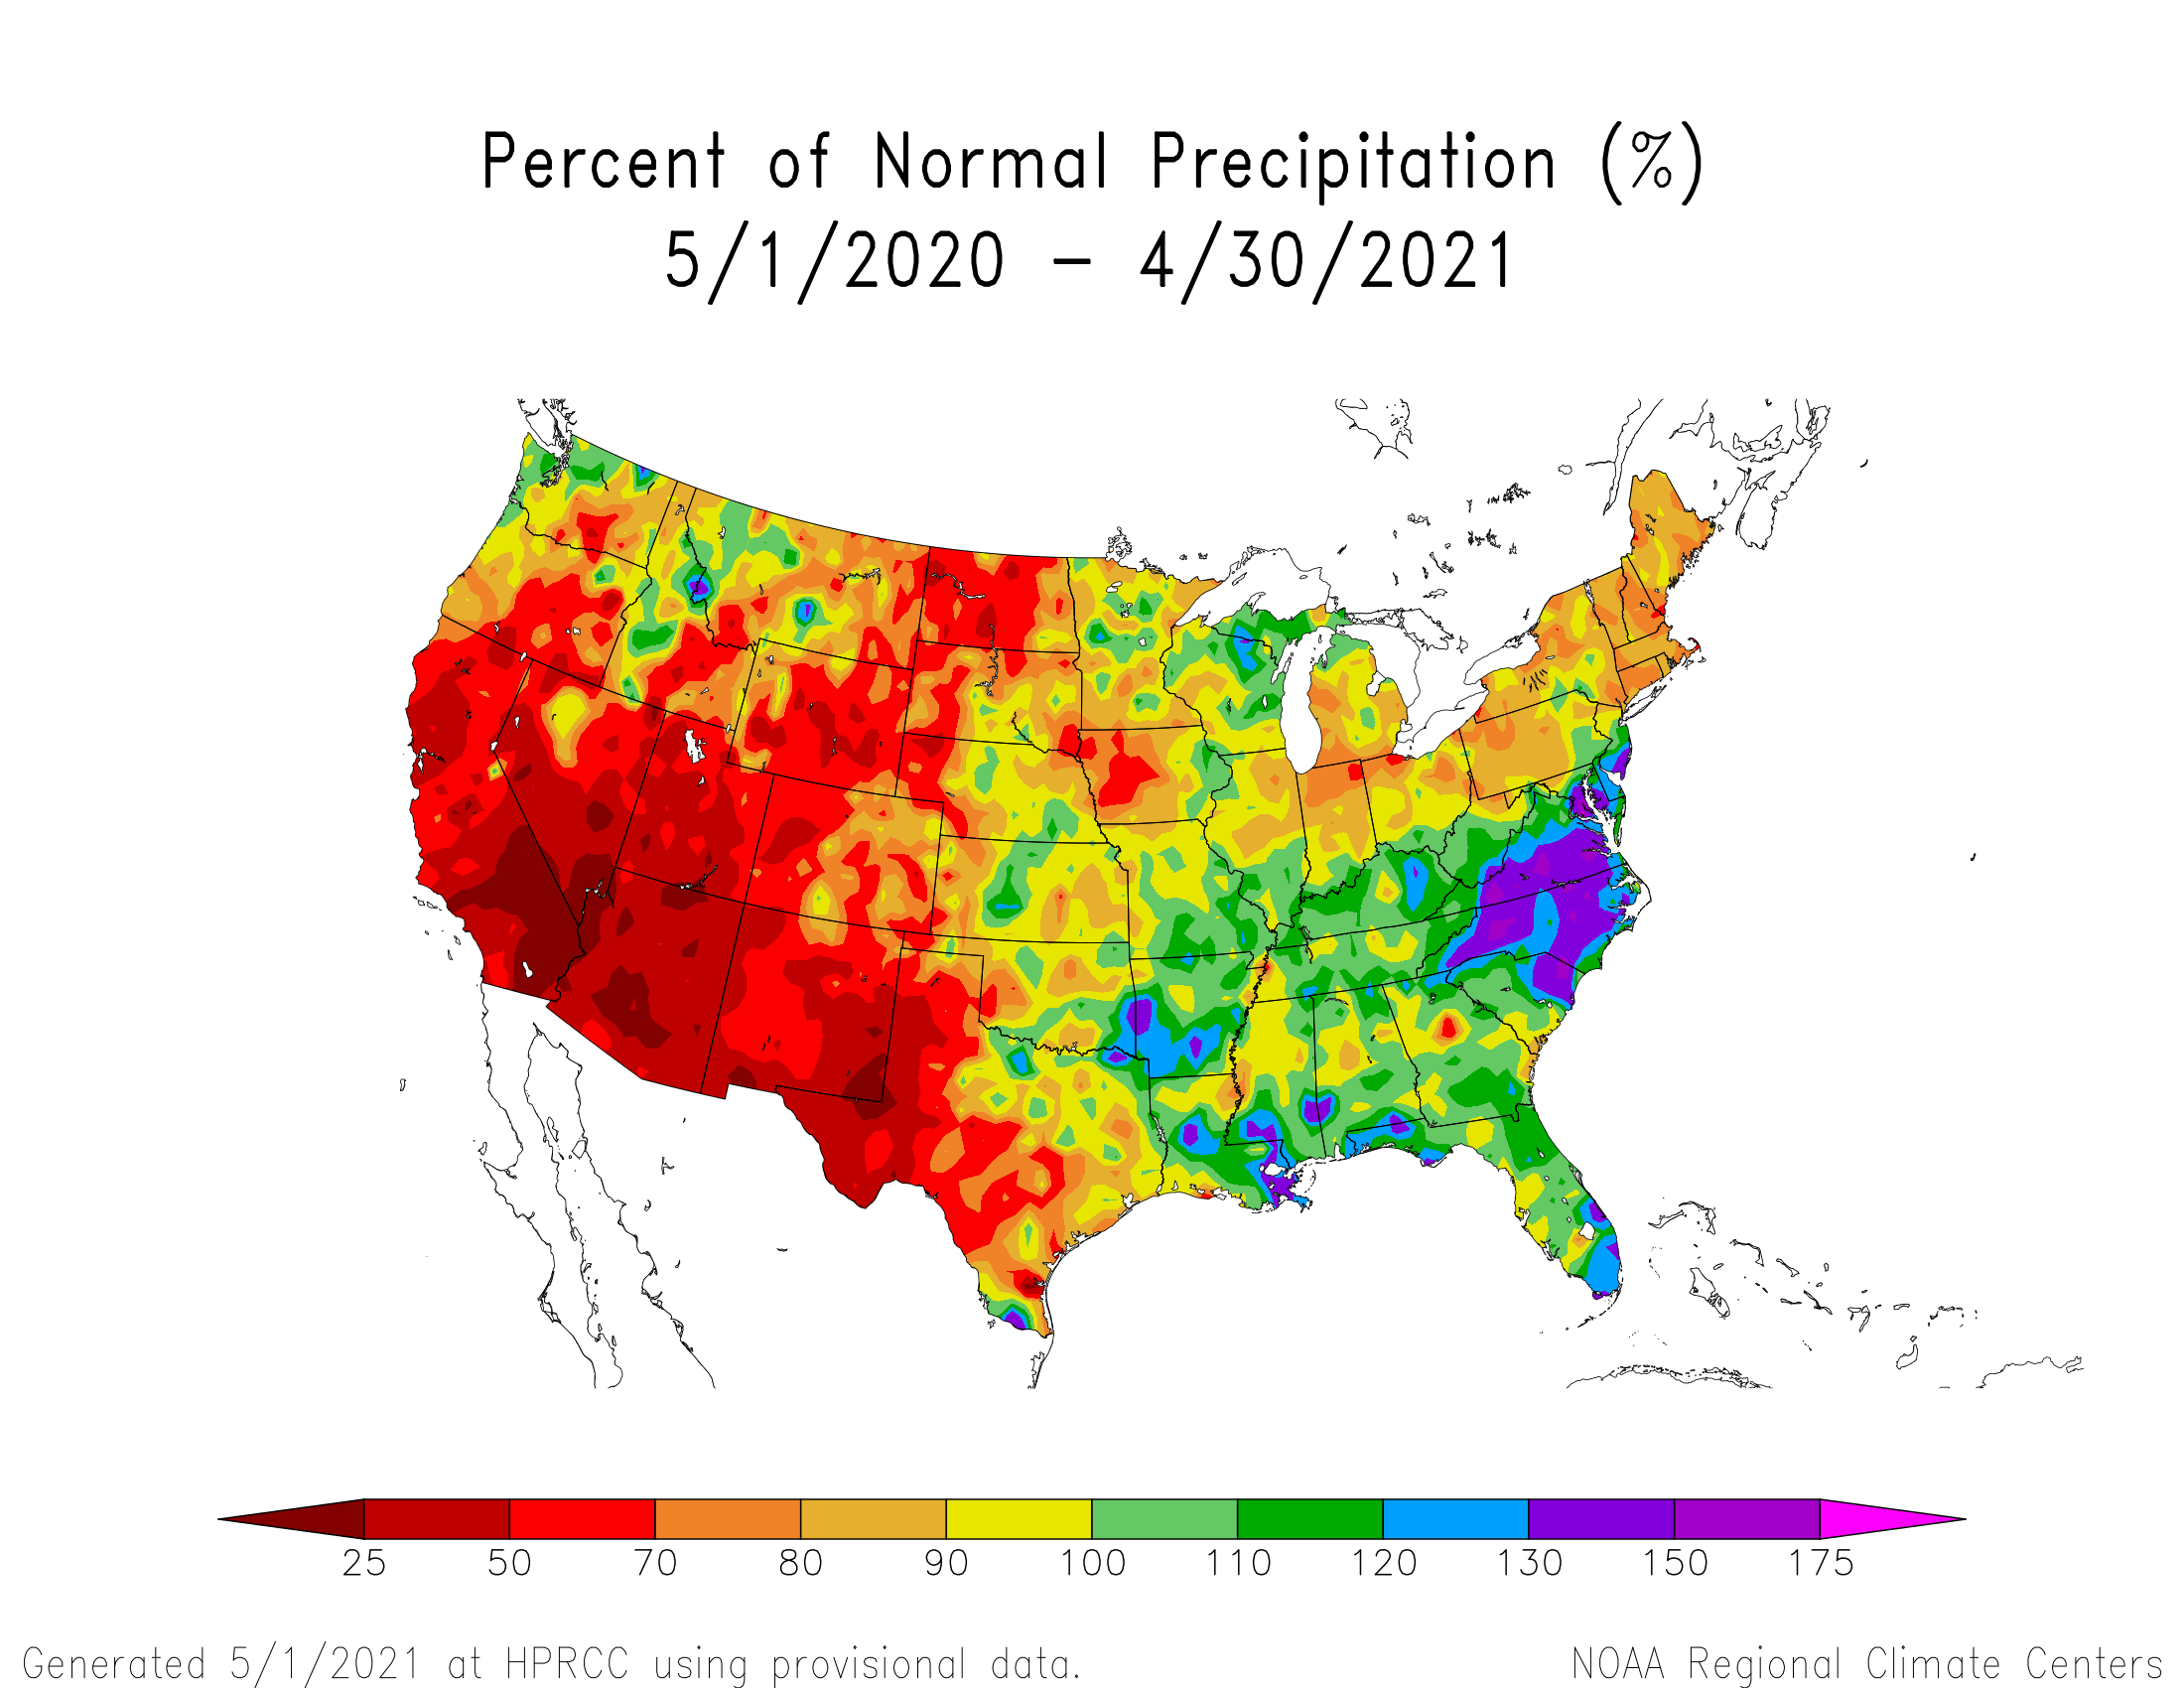
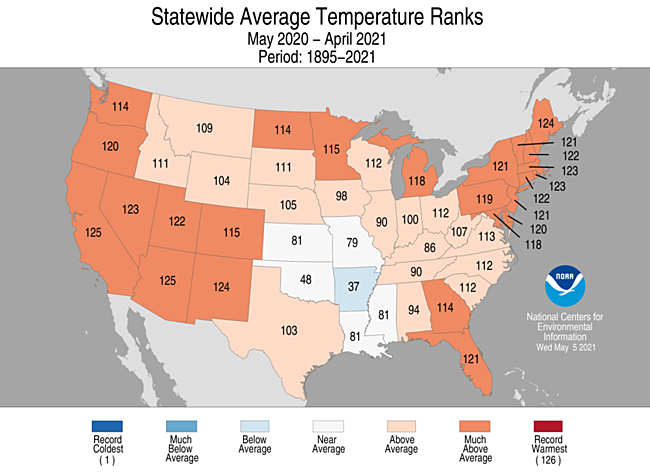
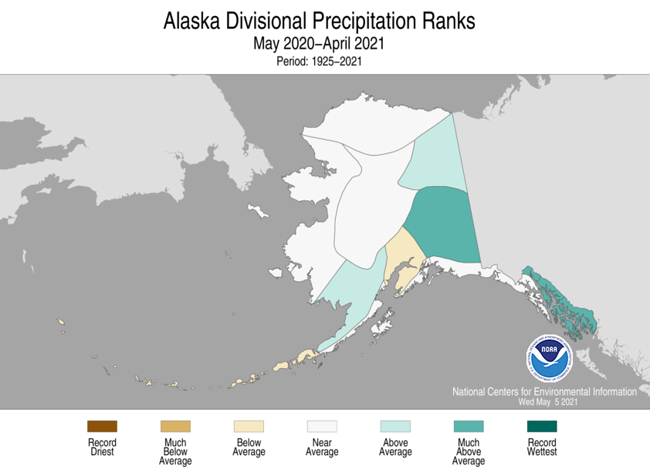
Similarly, for the last 12 months (May 2020-April 2021), most of the West, northern and southern Great Plains, and Northeast, as well as Iowa and parts of the Great Lakes, were drier than normal. For this time period, record dryness was widespread across the Southwest. Twenty-two states in these regions had a precipitation rank in the driest third of the historical record for May-April, including eight in the top ten driest category — Arizona, Nevada, and New Mexico, each of which ranked driest on record; California and Utah (each second driest); Wyoming (third driest); Colorado (fourth driest); and North Dakota (ninth driest).
Agricultural Belts
During April 2021, the Primary Hard Red Winter Wheat agricultural belt was mostly drier and near to colder than normal. The month ranked as the 23rd driest and 38th coldest April, regionwide, in the 1895-2021 record.
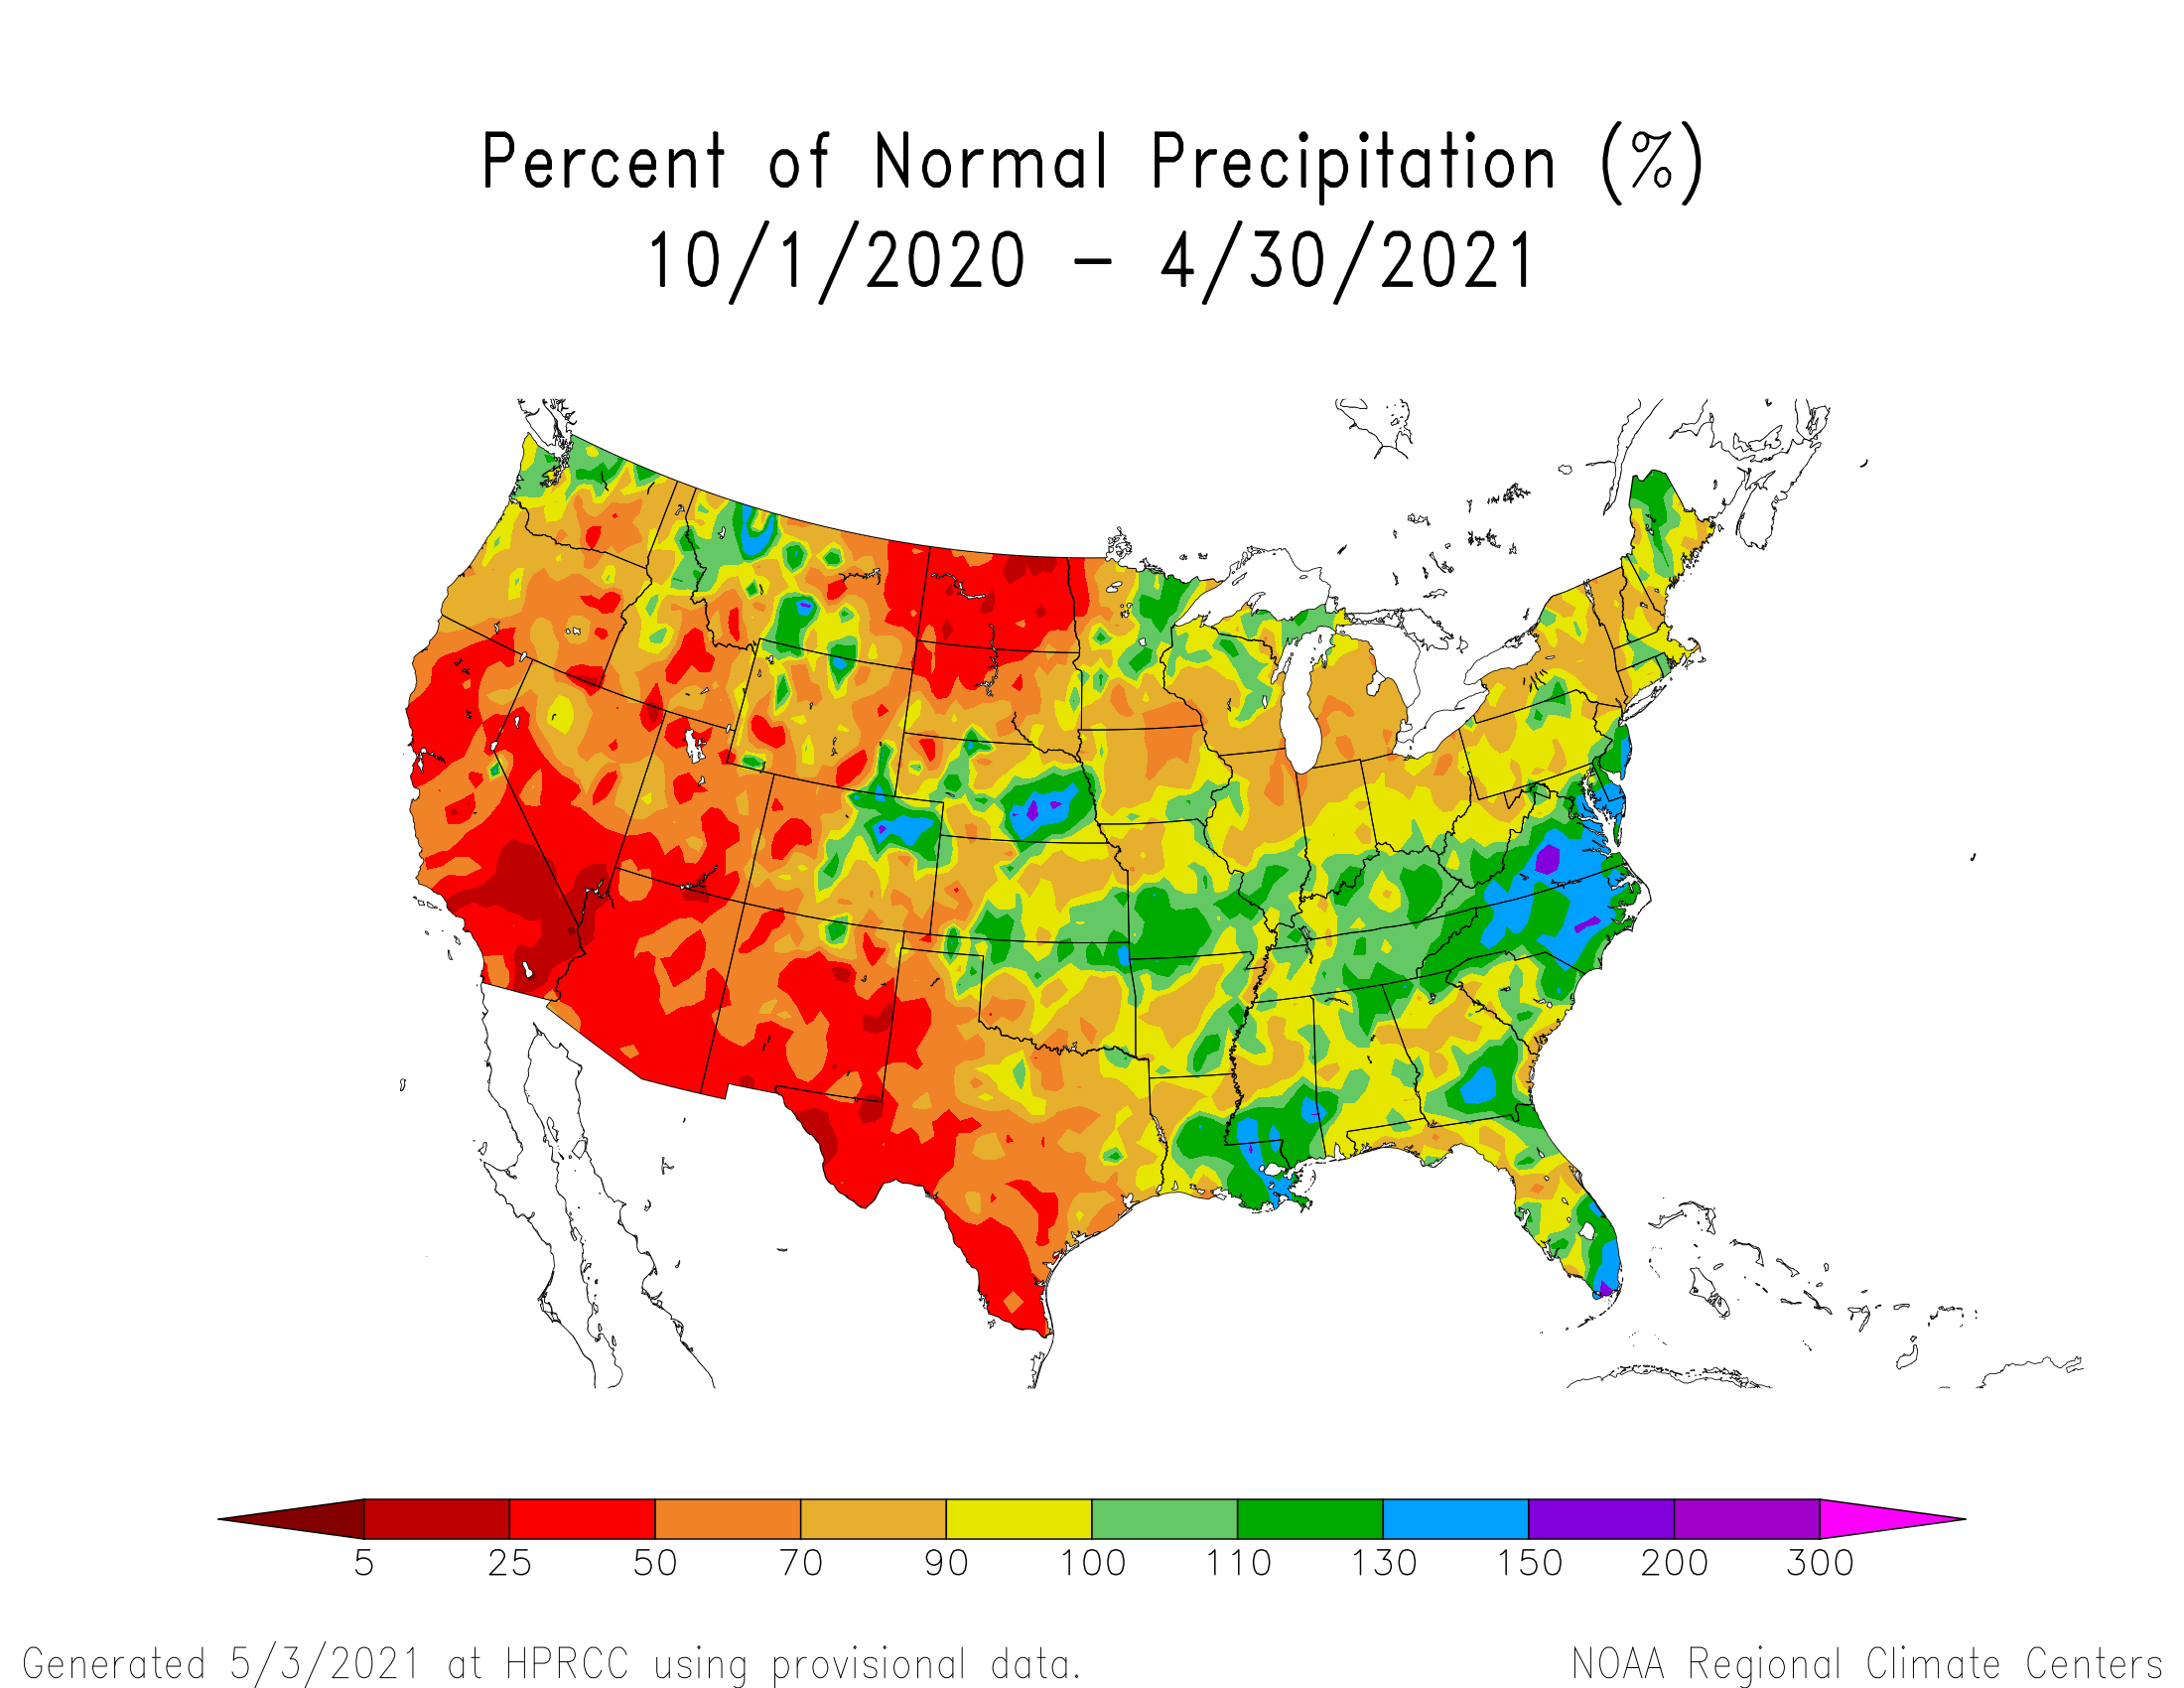
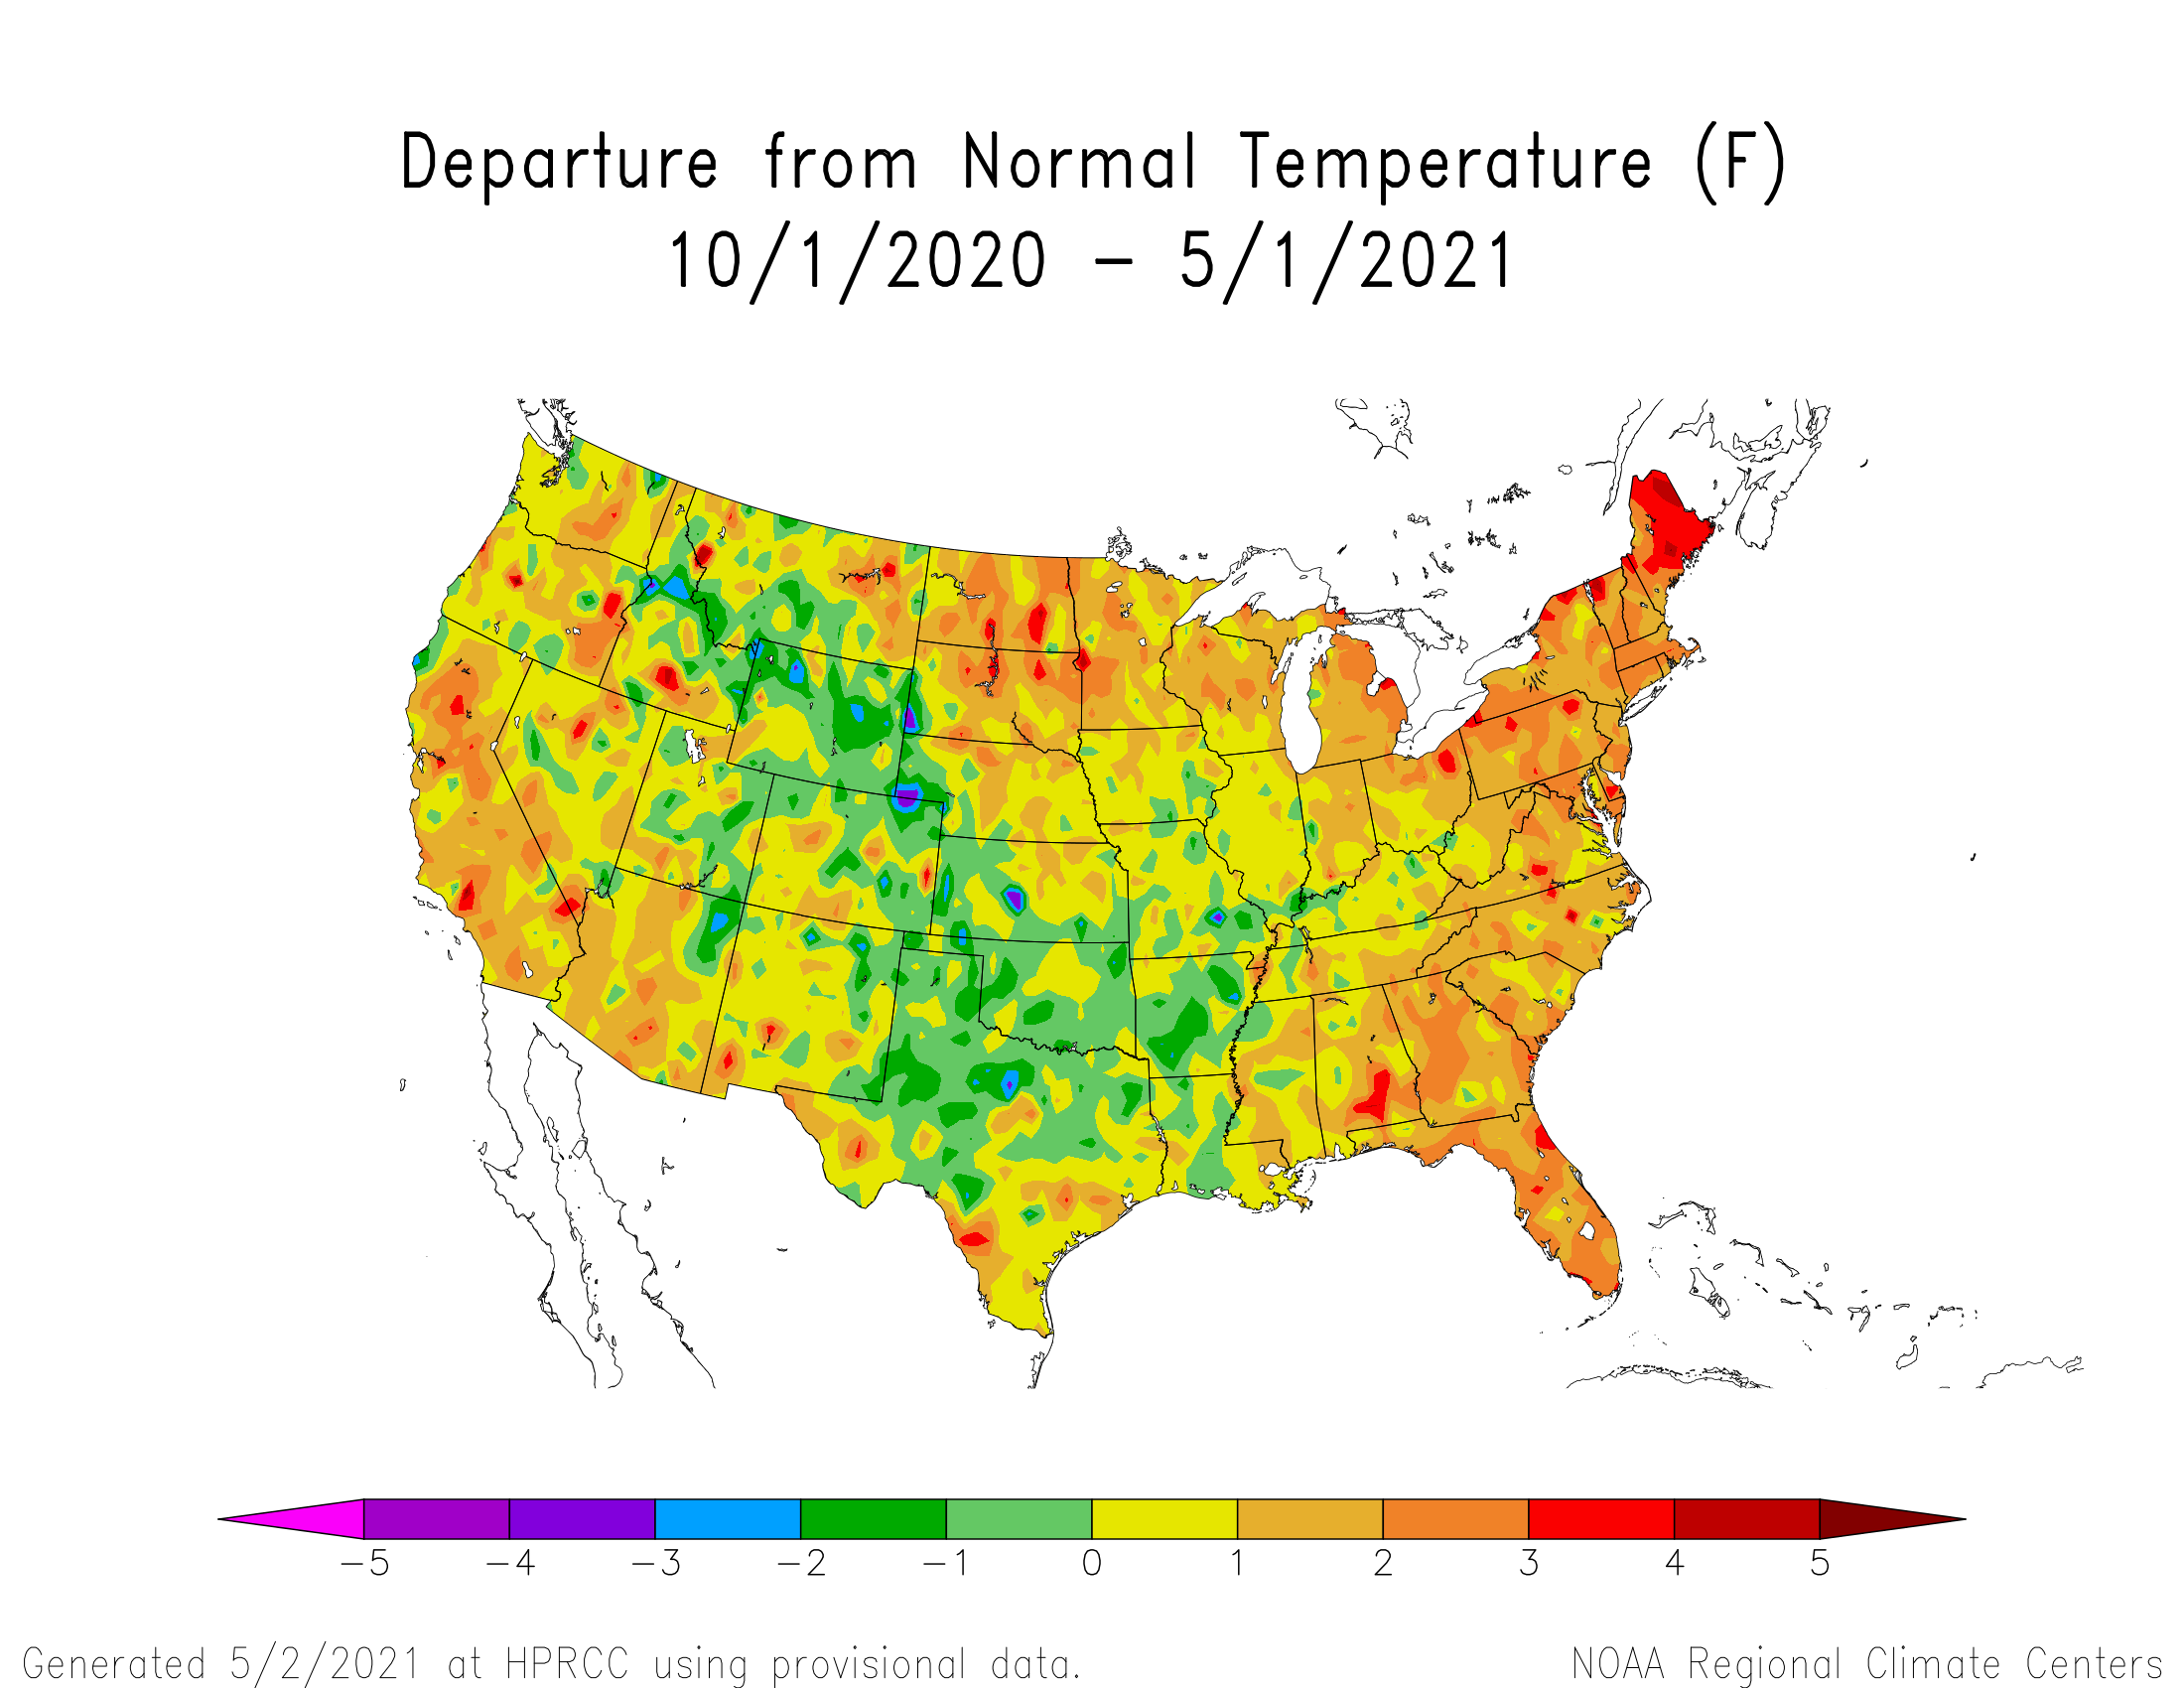
October marks the beginning of the growing season for the Primary Hard Red Winter Wheat belt. October 2020-April 2021 was mostly drier and cooler than normal. The period ranked as the 58th driest and 47th warmest October-April, regionwide, in the 1895-2021 record. (It should be noted that percent of normal is compared to a 30-year base, while the ranks are compared to the full 127-year period of record.)
During April, the Primary Corn and Soybean agricultural belt was mostly drier than normal while eastern parts were warmer than normal and western and southern parts cooler than normal. The month ranked as the 28th driest and 58th warmest April, regionwide, in the 1895-2021 record.
March marks the beginning of the growing season for the Primary Corn and Soybean agricultural belt. March-April 2021 was mostly warmer than normal with precipitation having a mixed anomaly pattern. The period ranked as the 47th wettest and 14th warmest March-April, regionwide, in the 1895-2021 record.
As of April 27, drought affected approximately 82 percent of spring wheat production, 63 percent of the sheep inventory, 59 percent of barley production, 54 percent of the milk cow inventory, 42 percent of sorghum production, 39 percent of winter wheat production, 39 percent of the cattle inventory, 37 percent of cotton production, 36 percent of hay acreage, 22 percent of corn production, 22 percent of rice production, 19 percent of soybean production, and 10 percent of peanut production.
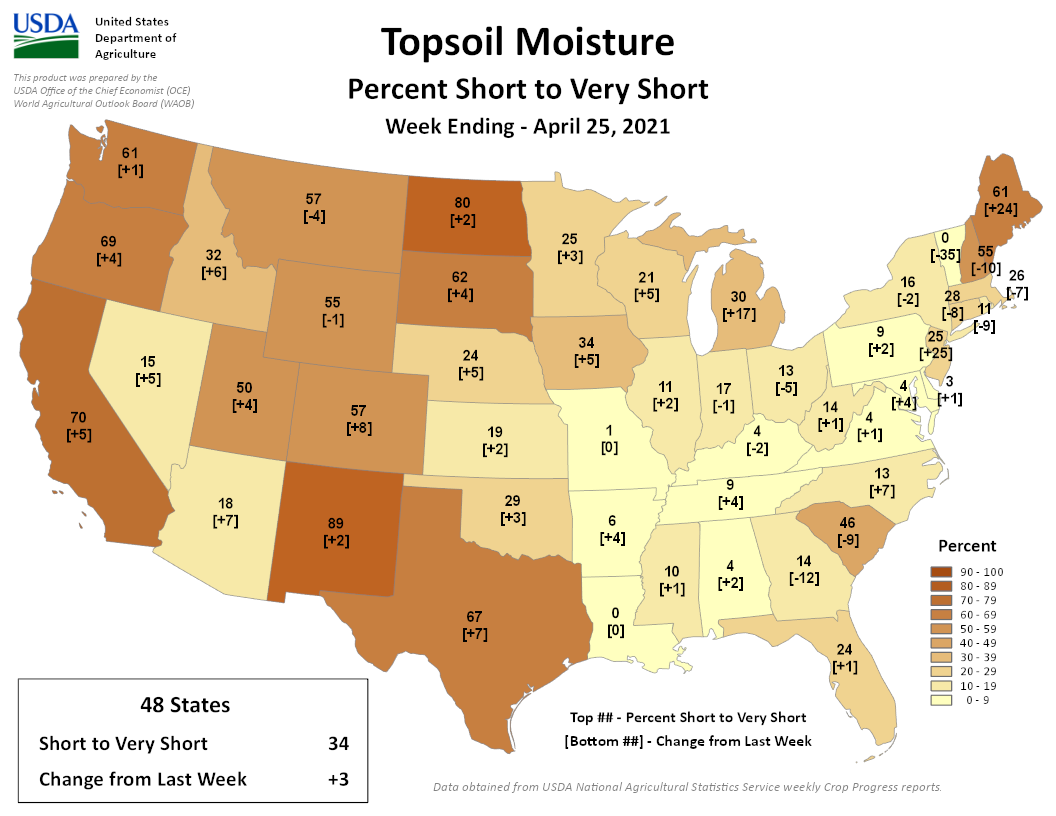
April 26 USDA reports indicated that topsoil moisture was short or very short (dry or very dry) across 70 percent of California, 57 percent of Colorado, 32 percent of Idaho, 34 percent of Iowa, 61 percent of Maine, 30 percent of Michigan, 57 percent of Montana, 55 percent of New Hampshire, 89 percent of New Mexico, 80 percent of North Dakota, 69 percent of Oregon, 46 percent of South Carolina, 62 percent of South Dakota, 67 percent of Texas, 50 percent of Utah, 61 percent of Washington, and 55 percent of Wyoming. Subsoil moisture was short or very short across 70 percent of California, 73 percent of Colorado, 30 percent of Idaho, 45 percent of Iowa, 55 percent of Maine, 30 percent of Michigan, 57 percent of Montana, 36 percent of Nebraska, 68 percent of New Hampshire, 92 percent of New Mexico, 78 percent of North Dakota, 68 percent of Oregon, 36 percent of South Carolina, 73 percent of South Dakota, 65 percent of Texas, 57 percent of Utah, 41 percent of Washington, and 63 percent of Wyoming. On a national scale, 34 percent of the topsoil moisture and 37 percent of the subsoil moisture were short or very short. These values are slightly higher than they were a week ago. Nationwide, 19 percent of the winter wheat was in poor to very poor condition. On a state by state basis, this value was 32 percent for Colorado and 43 percent for Texas; values were less than 30 percent for other states.
U.S.-Affiliated Pacific Islands
The NOAA National Weather Service (NWS) offices, the Pacific ENSO Applications Climate Center (PEAC), and partners provided reports on conditions across the Pacific Islands.
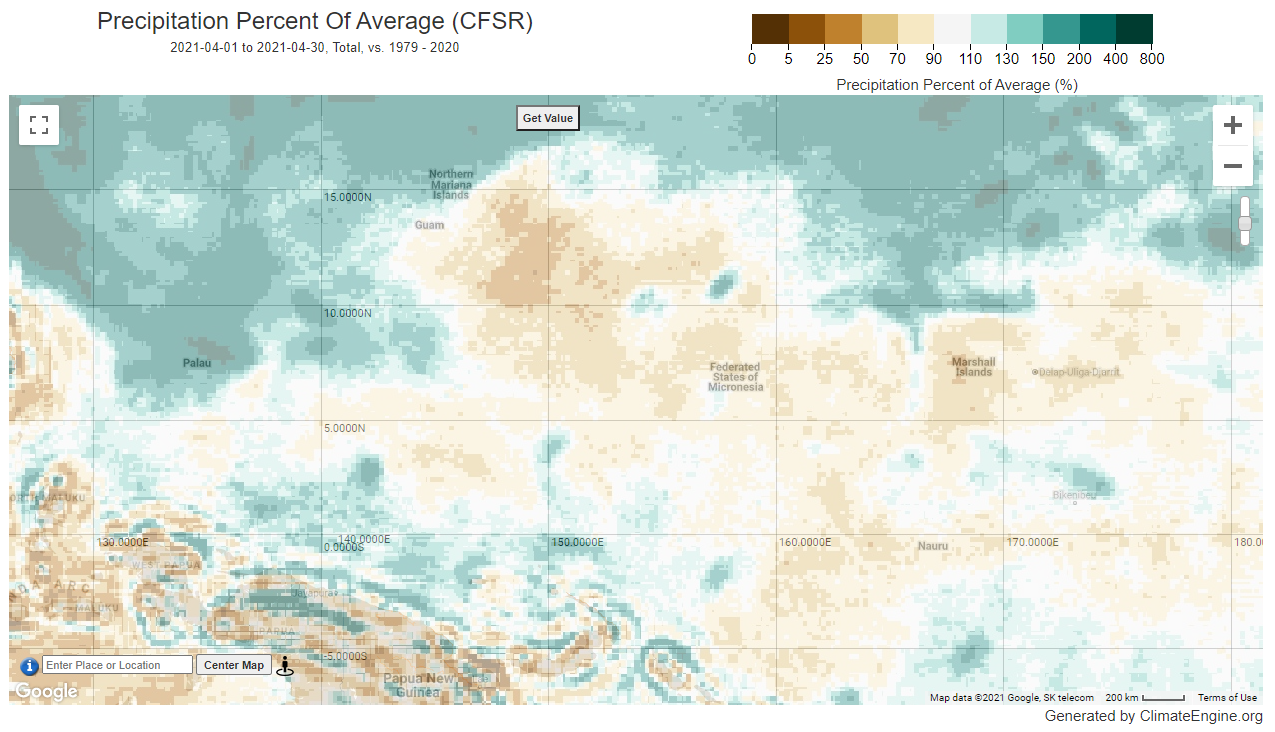
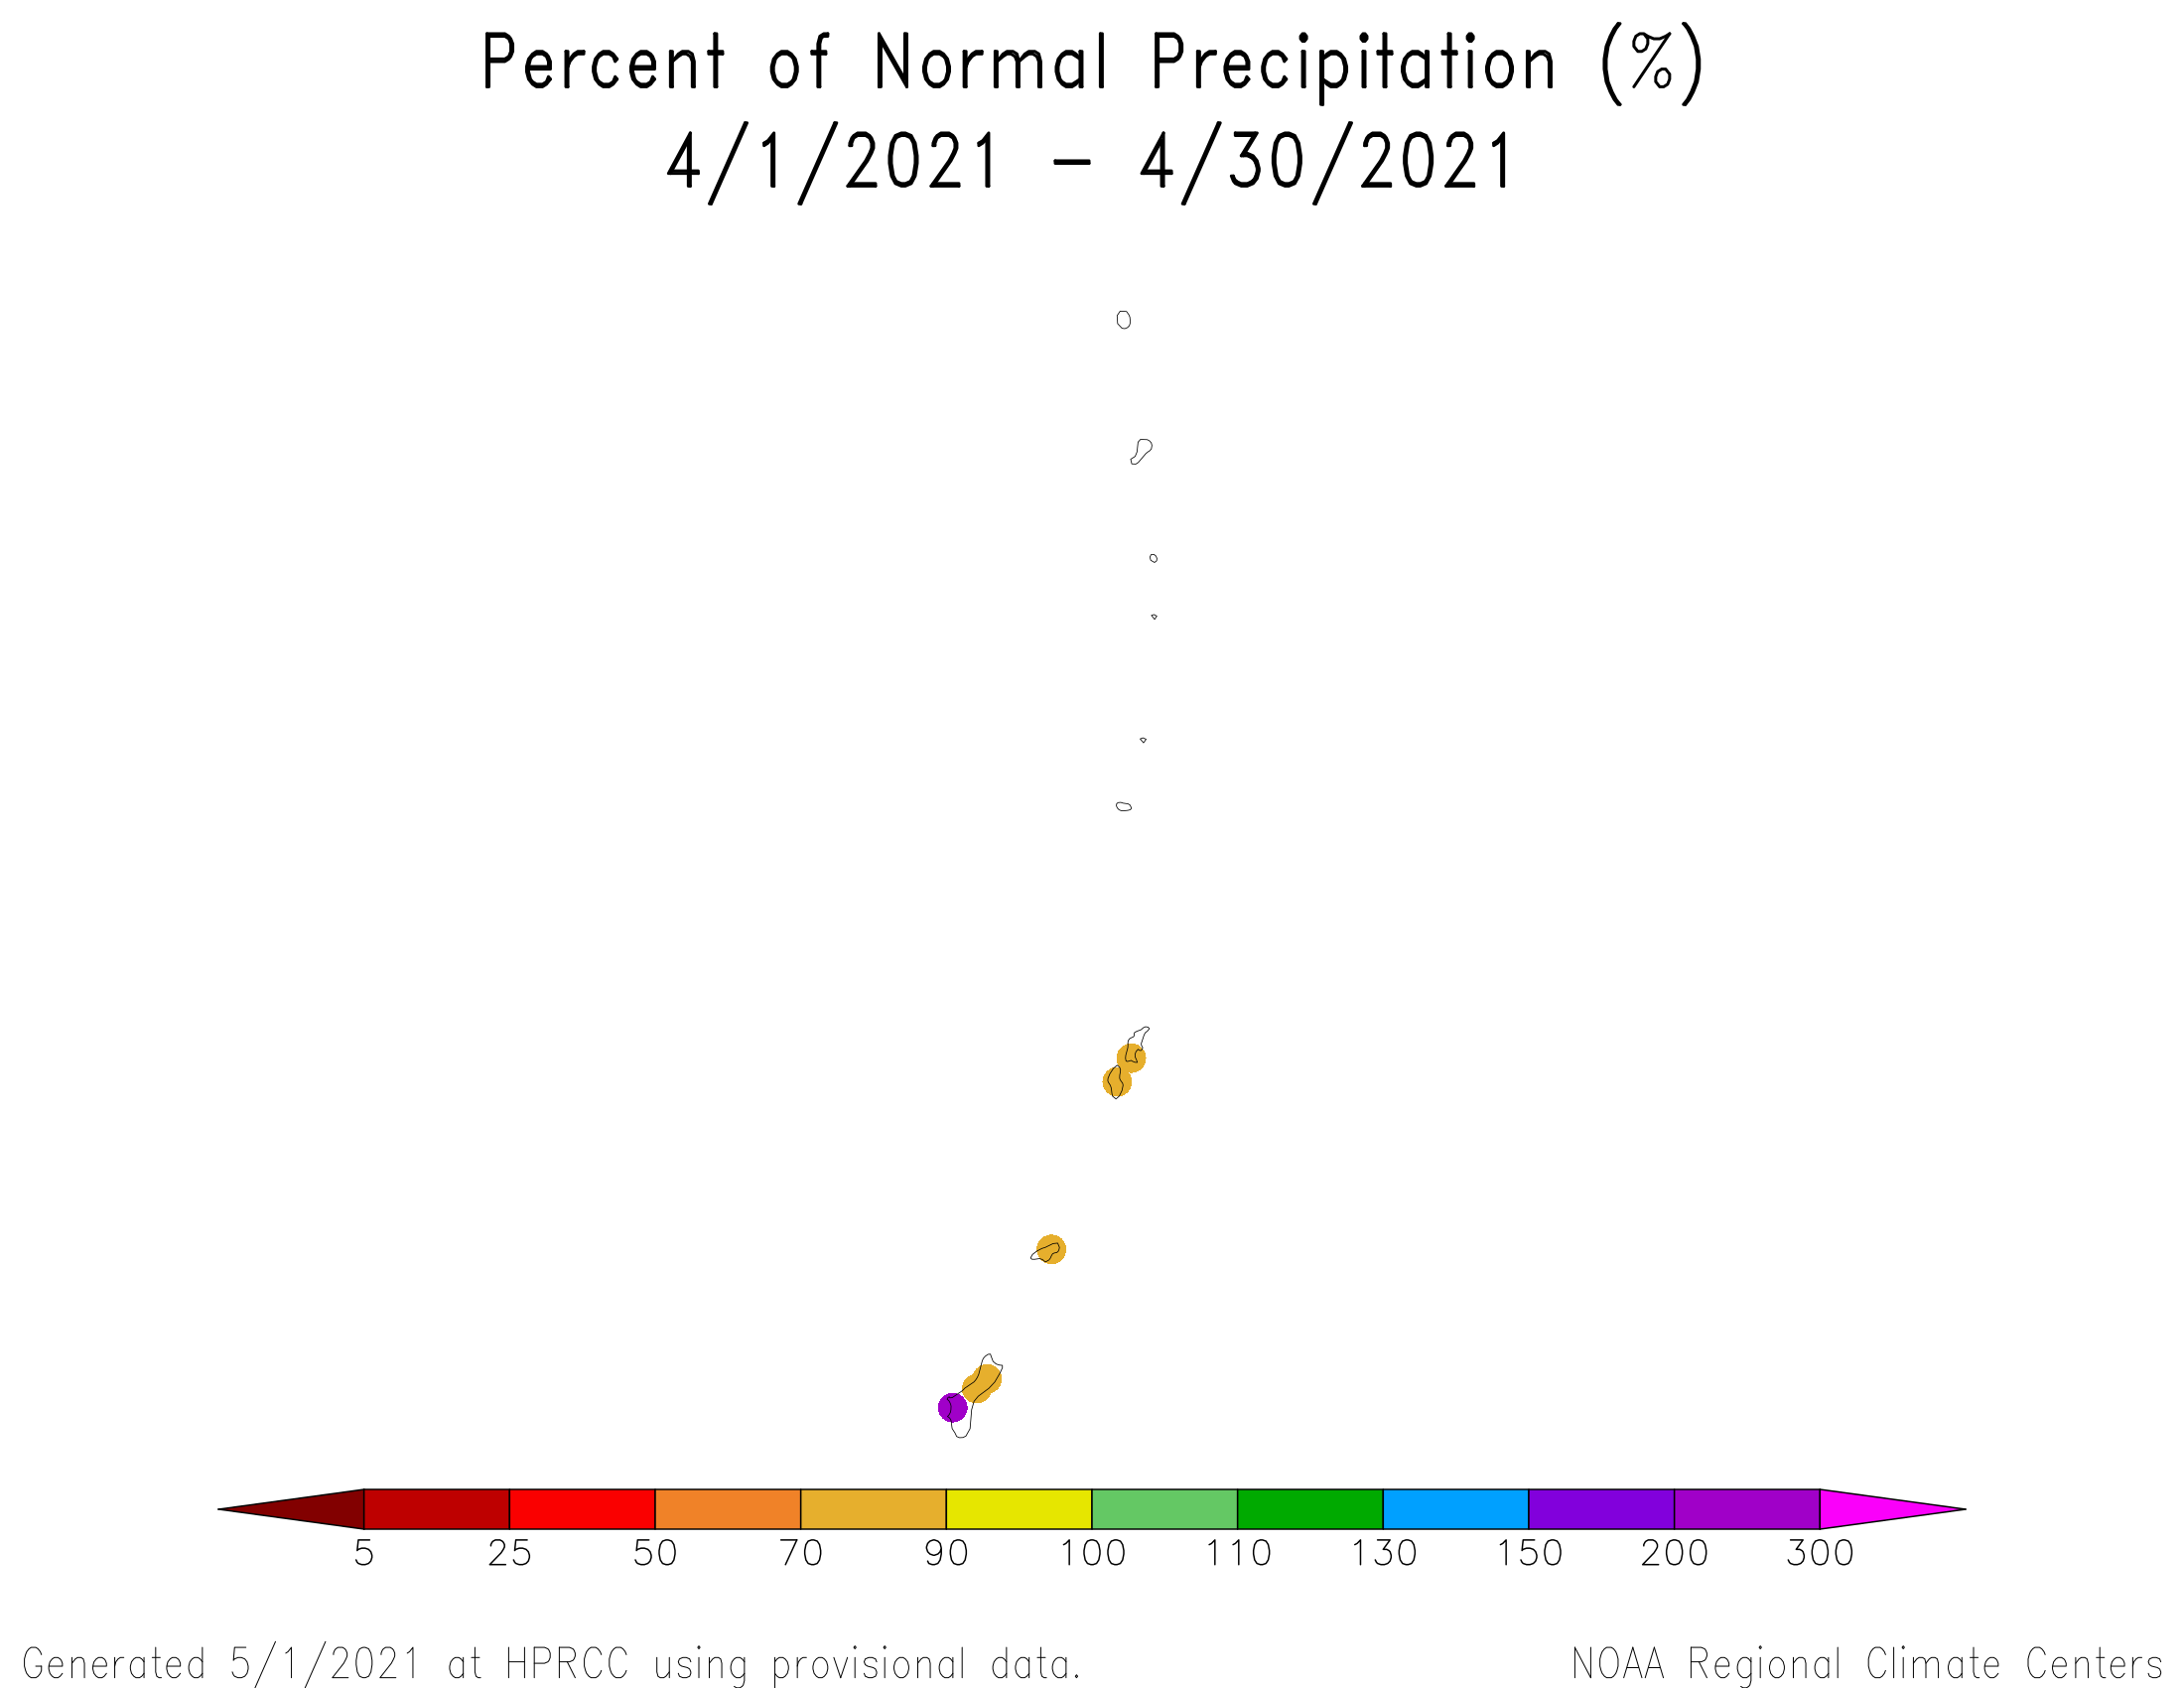
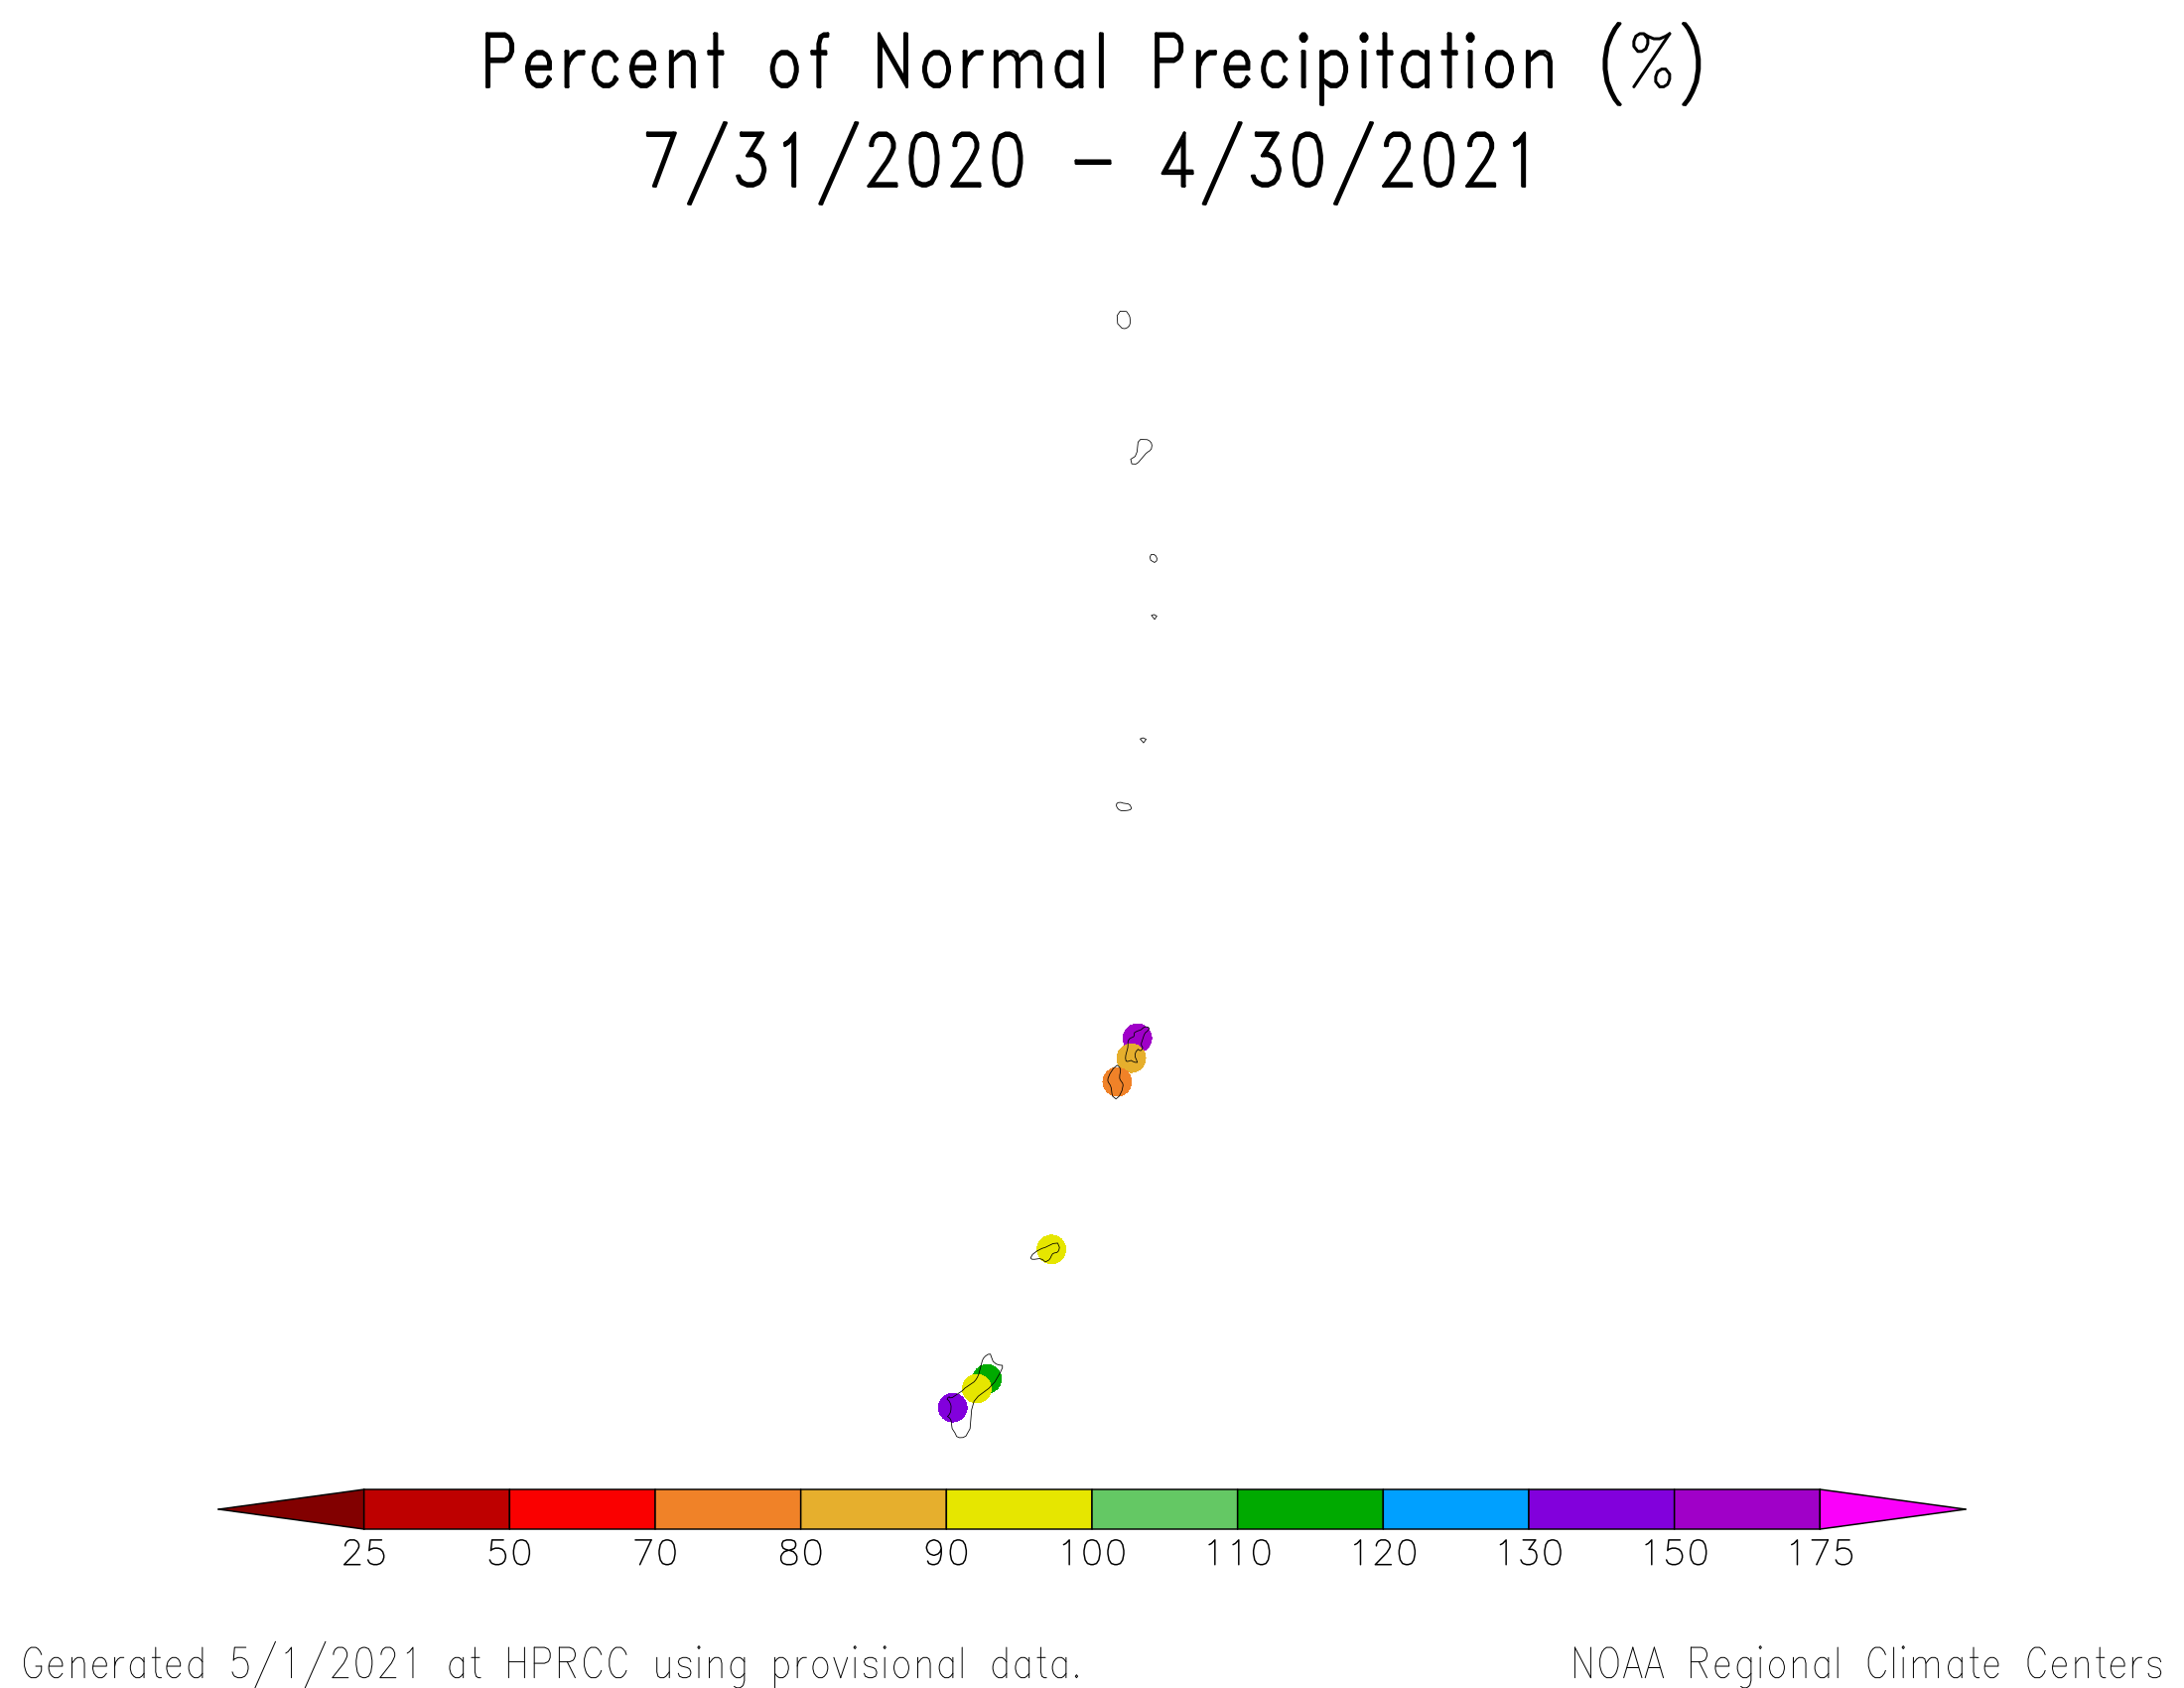
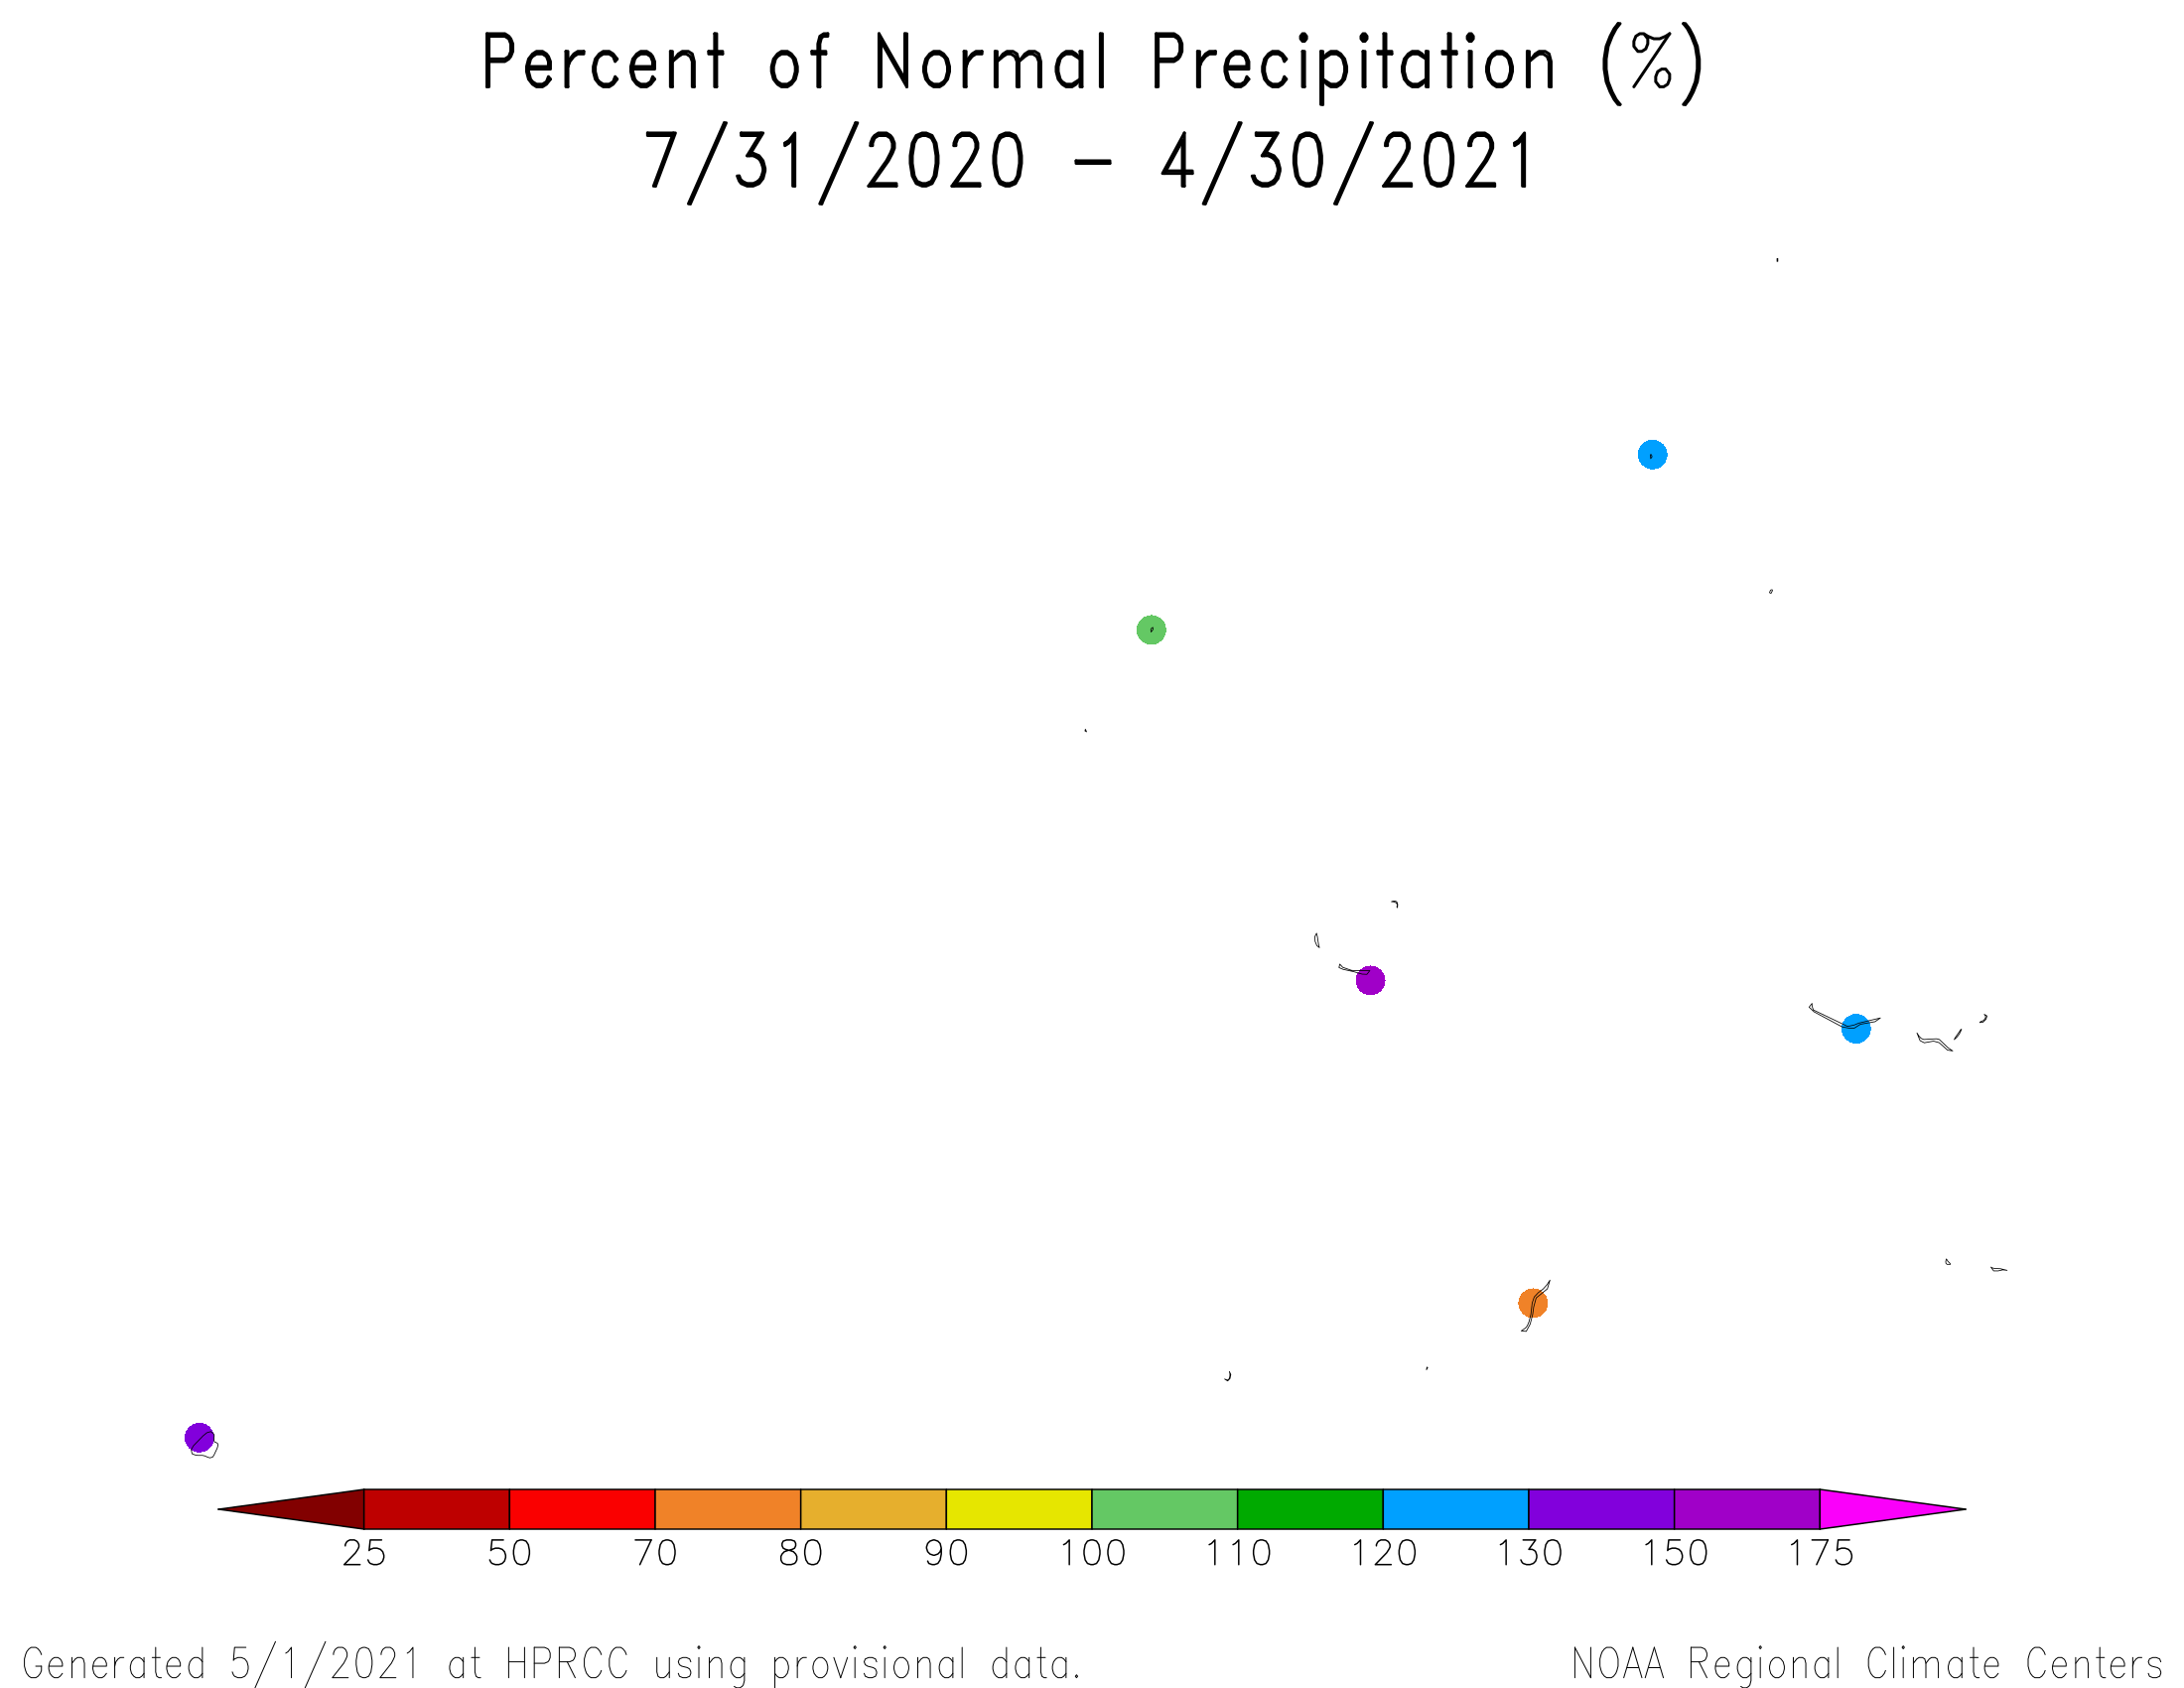
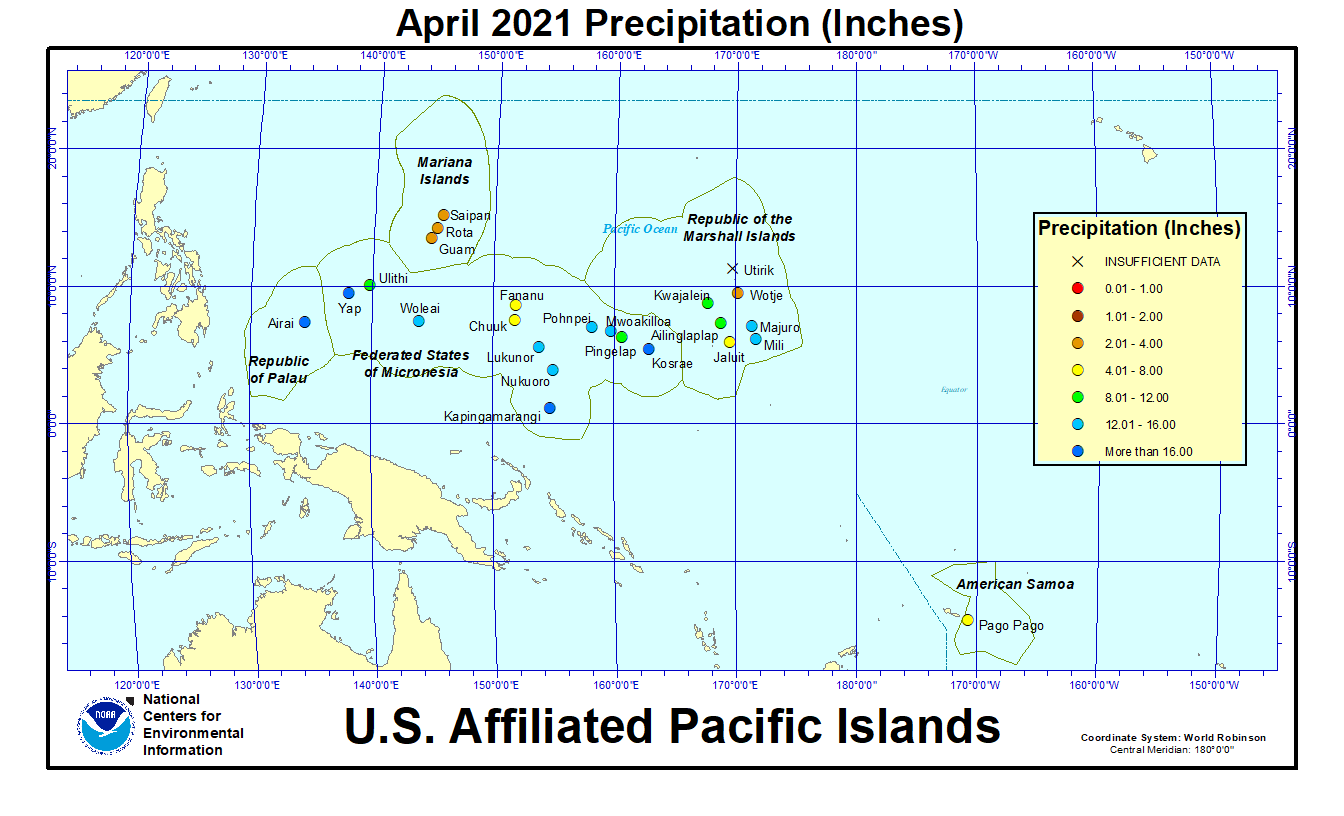
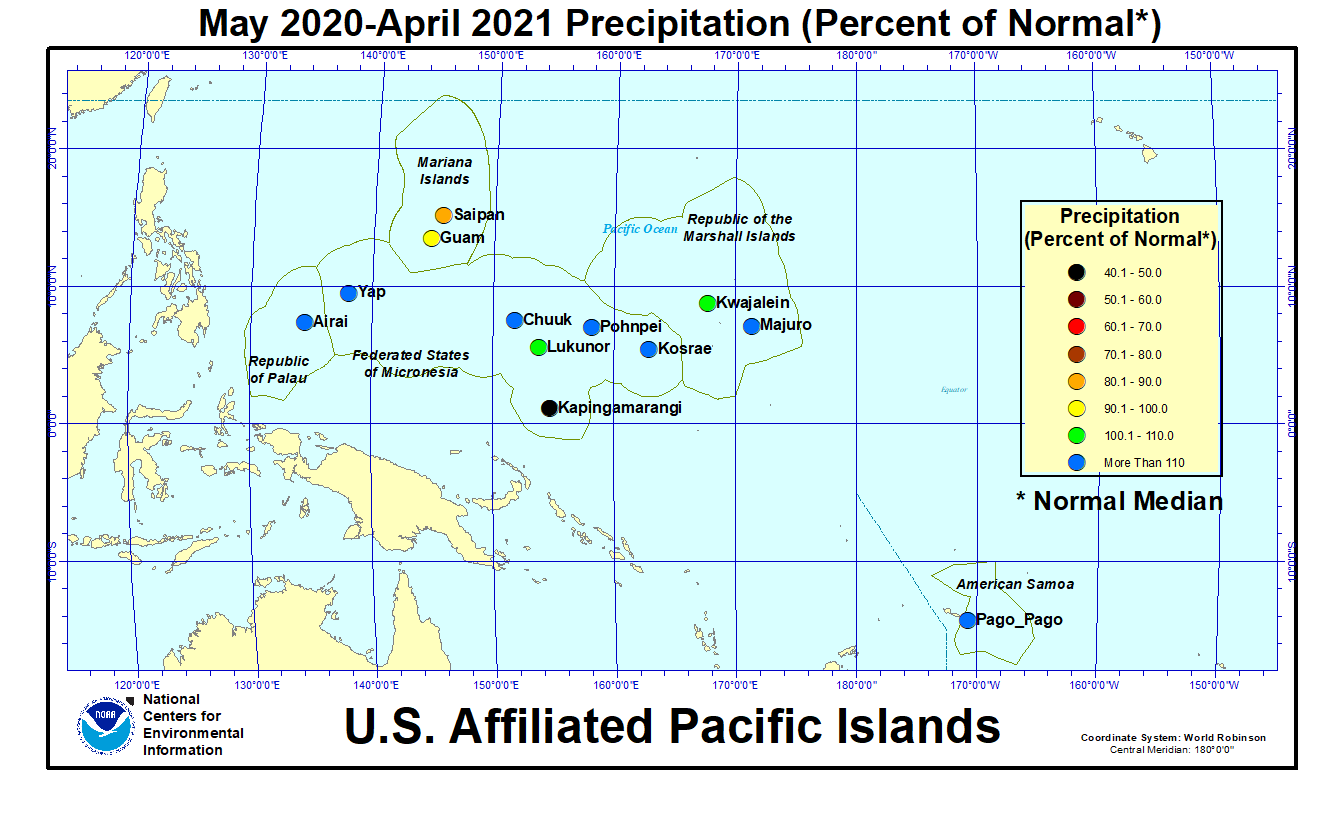
In the U.S. Affiliated Pacific Islands (USAPI) (maps — Federated States of Micronesia [FSM], Northern Mariana Islands, Marshall Islands [RMI], Republic of Palau, American Samoa, basinwide), April 2021 was drier-than-normal in parts of the Marianas (Saipan) and southern FSM (Chuuk and Pohnpei), and American Samoa. It was near to wetter than normal at Guam, in the Republic of Palau, in the southern RMI, and in the rest of the FSM.
Monthly precipitation amounts were below the monthly minimum needed to meet most water needs (4 inches in the Marianas and Pago Pago, and 8 inches elsewhere) across the Marianas and northern RMI, at Chuuk and Fananu (in the FSM), and Pago Pago (American Samoa). April precipitation was above the monthly minimums at the rest of the USAPI stations in the FSM and RMI, and in Palau. The 4- and 8-inch thresholds are important because, if monthly precipitation falls below the threshold, then water shortages or drought become a concern.
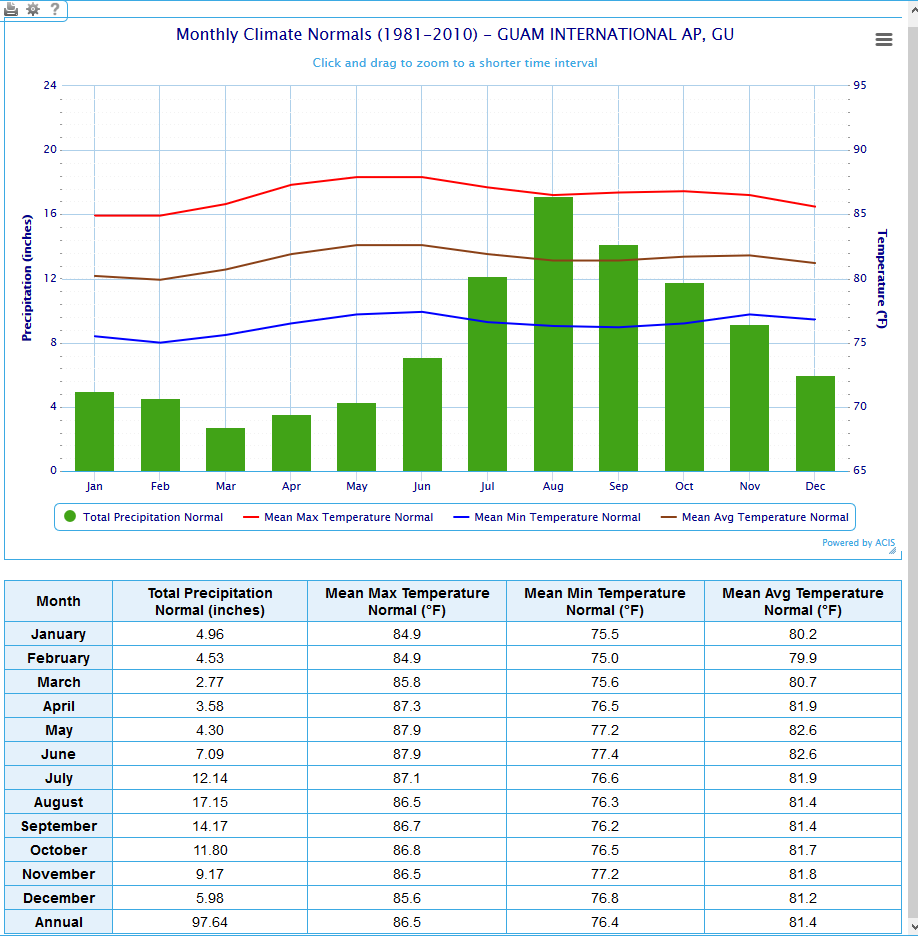
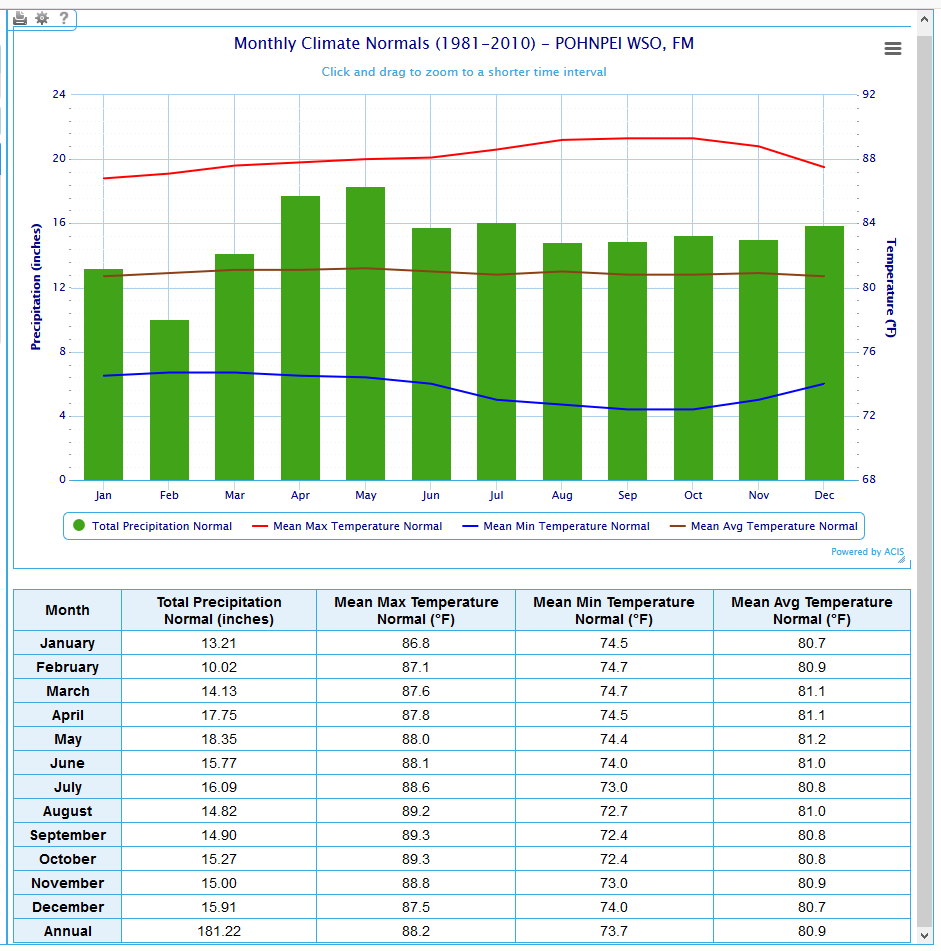
The tropical Pacific climatology can experience extremes in precipitation, from very low precipitation during the dry season to very high precipitation during the wet season. This can result in monthly normal precipitation values that are different from the monthly minimum needed to meet most water needs, and this can lead to percent of normal values that seem odd. This was the case during April 2021. For Guam, the monthly precipitation was below the monthly minimum, but was above normal (1981-2010 normal) because the normals are so low (April 2021 precipitation 3.02 inches, April monthly normal mean 3.58 inches and median 2.53 inches). The opposite was true for Pohnpei. There, the monthly precipitation was above the monthly minimum, but was below normal because the normals are so high (April 2021 precipitation 14.18 inches, April monthly normal mean 17.75 inches and median 18.41 inches).
The dryness of April compounded recent and longer-term dryness at some stations in the Marianas, while the recent wet conditions were not enough to make up for the long-term dryness at Kapingamarangi.
| Station Name | May 2020 | Jun 2020 | Jul 2020 | Aug 2020 | Sep 2020 | Oct 2020 | Nov 2020 | Dec 2020 | Jan 2021 | Feb 2021 | Mar 2021 | Apr 2021 | May- Apr |
|---|---|---|---|---|---|---|---|---|---|---|---|---|---|
| Chuuk | 116% | 98% | 65% | 95% | 167% | 92% | 127% | 182% | 114% | 156% | 223% | 55% | 115% |
| Guam NAS | 240% | 55% | 81% | 86% | 87% | 146% | 140% | 157% | 102% | 33% | 130% | 119% | 90% |
| Kapingamarangi | 33% | 43% | 40% | 36% | 9% | 15% | 31% | 38% | 65% | 63% | 78% | 150% | 47% |
| Koror | 205% | 81% | 55% | 164% | 62% | 170% | 88% | 142% | 102% | 166% | 119% | 287% | 117% |
| Kosrae | 164% | 161% | 96% | 87% | 114% | 149% | 177% | 185% | 188% | 141% | 194% | 106% | 124% |
| Kwajalein | 92% | 88% | 89% | 54% | 144% | 140% | 115% | 60% | 74% | 75% | 264% | 174% | 104% |
| Lukonor | 107% | 97% | 83% | 81% | 134% | 105% | 102% | 219% | 146% | 180% | 84% | 134% | 105% |
| Majuro | 156% | 117% | 115% | 85% | 101% | 176% | 112% | 147% | 150% | 57% | 228% | 135% | 128% |
| Pago Pago | 72% | 389% | 201% | 179% | 228% | 201% | 160% | 113% | 132% | 141% | 91% | 76% | 131% |
| Pohnpei | 125% | 79% | 62% | 98% | 120% | 121% | 169% | 168% | 147% | 65% | 216% | 77% | 117% |
| Saipan | 46% | 54% | 57% | 68% | 74% | 104% | 88% | 193% | 91% | 122% | 46% | 77% | 80% |
| Yap | 105% | 154% | 51% | 72% | 81% | 104% | 196% | 200% | 201% | 139% | 189% | 316% | 124% |
| Station Name | May 2020 | Jun 2020 | Jul 2020 | Aug 2020 | Sep 2020 | Oct 2020 | Nov 2020 | Dec 2020 | Jan 2021 | Feb 2021 | Mar 2021 | Apr 2021 | May- Apr |
|---|---|---|---|---|---|---|---|---|---|---|---|---|---|
| Chuuk | 13.09" | 11.45" | 7.77" | 12.20" | 19.61" | 10.57" | 13.45" | 20.47" | 11.56" | 11.29" | 18.55" | 6.86" | 156.87" |
| Guam NAS | 8.16" | 3.40" | 8.26" | 12.68" | 10.96" | 16.75" | 10.33" | 8.02" | 4.11" | 1.01" | 2.70" | 3.02" | 89.4" |
| Kapingamarangi | 3.93" | 5.87" | 5.59" | 2.94" | 0.86" | 1.19" | 2.83" | 3.77" | 5.92" | 5.86" | 8.91" | 20.44" | 68.11" |
| Koror | 24.24" | 14.21" | 10.13" | 22.13" | 7.28" | 20.11" | 9.97" | 15.82" | 10.42" | 14.23" | 8.84" | 21.03" | 178.41" |
| Kosrae | 29.07" | 23.64" | 14.26" | 12.41" | 16.16" | 16.25" | 24.52" | 29.87" | 31.36" | 18.28" | 31.20" | 18.63" | 265.65" |
| Kwajalein | 6.15" | 6.09" | 8.82" | 5.24" | 15.51" | 15.64" | 12.95" | 4.02" | 2.34" | 1.97" | 6.21" | 9.17" | 94.11" |
| Lukonor | 12.52" | 11.34" | 13.18" | 11.35" | 13.63" | 11.83" | 9.23" | 24.71" | 12.29" | 16.11" | 7.81" | 15.21" | 159.21" |
| Majuro | 15.78" | 12.83" | 12.85" | 9.97" | 11.25" | 22.35" | 14.99" | 16.71" | 11.58" | 3.89" | 15.00" | 12.71" | 159.91" |
| Pago Pago | 6.96" | 20.76" | 11.17" | 9.63" | 14.90" | 18.63" | 16.25" | 14.55" | 17.62" | 16.86" | 9.68" | 7.14" | 164.15" |
| Pohnpei | 24.91" | 11.70" | 9.53" | 13.99" | 15.02" | 18.49" | 25.13" | 26.95" | 19.38" | 6.24" | 28.50" | 14.18" | 214.02" |
| Saipan | 1.10" | 1.96" | 5.11" | 8.88" | 7.46" | 11.08" | 4.95" | 7.43" | 2.30" | 3.15" | 0.86" | 2.02" | 56.3" |
| Yap | 8.22" | 18.56" | 7.71" | 10.61" | 10.98" | 12.71" | 17.27" | 16.99" | 12.85" | 7.24" | 8.63" | 17.78" | 149.55" |
| Station Name | May 2020 | Jun 2020 | Jul 2020 | Aug 2020 | Sep 2020 | Oct 2020 | Nov 2020 | Dec 2020 | Jan 2021 | Feb 2021 | Mar 2021 | Apr 2021 | May- Apr |
|---|---|---|---|---|---|---|---|---|---|---|---|---|---|
| Chuuk | 11.30" | 11.66" | 11.98" | 12.86" | 11.71" | 11.51" | 10.61" | 11.25" | 10.10" | 7.25" | 8.32" | 12.47" | 136.77" |
| Guam NAS | 3.40" | 6.18" | 10.14" | 14.74" | 12.66" | 11.44" | 7.38" | 5.11" | 4.01" | 3.03" | 2.07" | 2.53" | 99.09" |
| Kapingamarangi | 12.08" | 13.78" | 14.15" | 8.13" | 9.93" | 8.19" | 9.27" | 9.84" | 9.15" | 9.27" | 11.43" | 13.64" | 145.85" |
| Koror | 11.83" | 17.48" | 18.53" | 13.50" | 11.77" | 11.84" | 11.39" | 11.16" | 10.18" | 8.56" | 7.44" | 7.32" | 152.90" |
| Kosrae | 17.75" | 14.64" | 14.91" | 14.22" | 14.22" | 10.94" | 13.83" | 16.11" | 16.67" | 12.93" | 16.06" | 17.51" | 213.87" |
| Kwajalein | 6.72" | 6.93" | 9.87" | 9.74" | 10.74" | 11.18" | 11.28" | 6.66" | 3.16" | 2.64" | 2.35" | 5.26" | 90.41" |
| Lukonor | 11.69" | 11.65" | 15.93" | 14.04" | 10.15" | 11.32" | 9.08" | 11.27" | 8.41" | 8.93" | 9.26" | 11.31" | 151.36" |
| Majuro | 10.11" | 11.01" | 11.17" | 11.69" | 11.17" | 12.73" | 13.44" | 11.39" | 7.74" | 6.88" | 6.58" | 9.42" | 125.25" |
| Pago Pago | 9.66" | 5.33" | 5.55" | 5.38" | 6.53" | 9.26" | 10.14" | 12.84" | 13.34" | 12.00" | 10.68" | 9.39" | 125.57" |
| Pohnpei | 19.96" | 14.81" | 15.43" | 14.26" | 12.55" | 15.27" | 14.83" | 16.08" | 13.18" | 9.55" | 13.17" | 18.41" | 182.36" |
| Saipan | 2.38" | 3.62" | 8.91" | 13.13" | 10.09" | 10.62" | 5.61" | 3.85" | 2.53" | 2.59" | 1.89" | 2.63" | 70.25" |
| Yap | 7.85" | 12.04" | 15.08" | 14.82" | 13.50" | 12.18" | 8.83" | 8.51" | 6.39" | 5.19" | 4.56" | 5.63" | 120.31" |
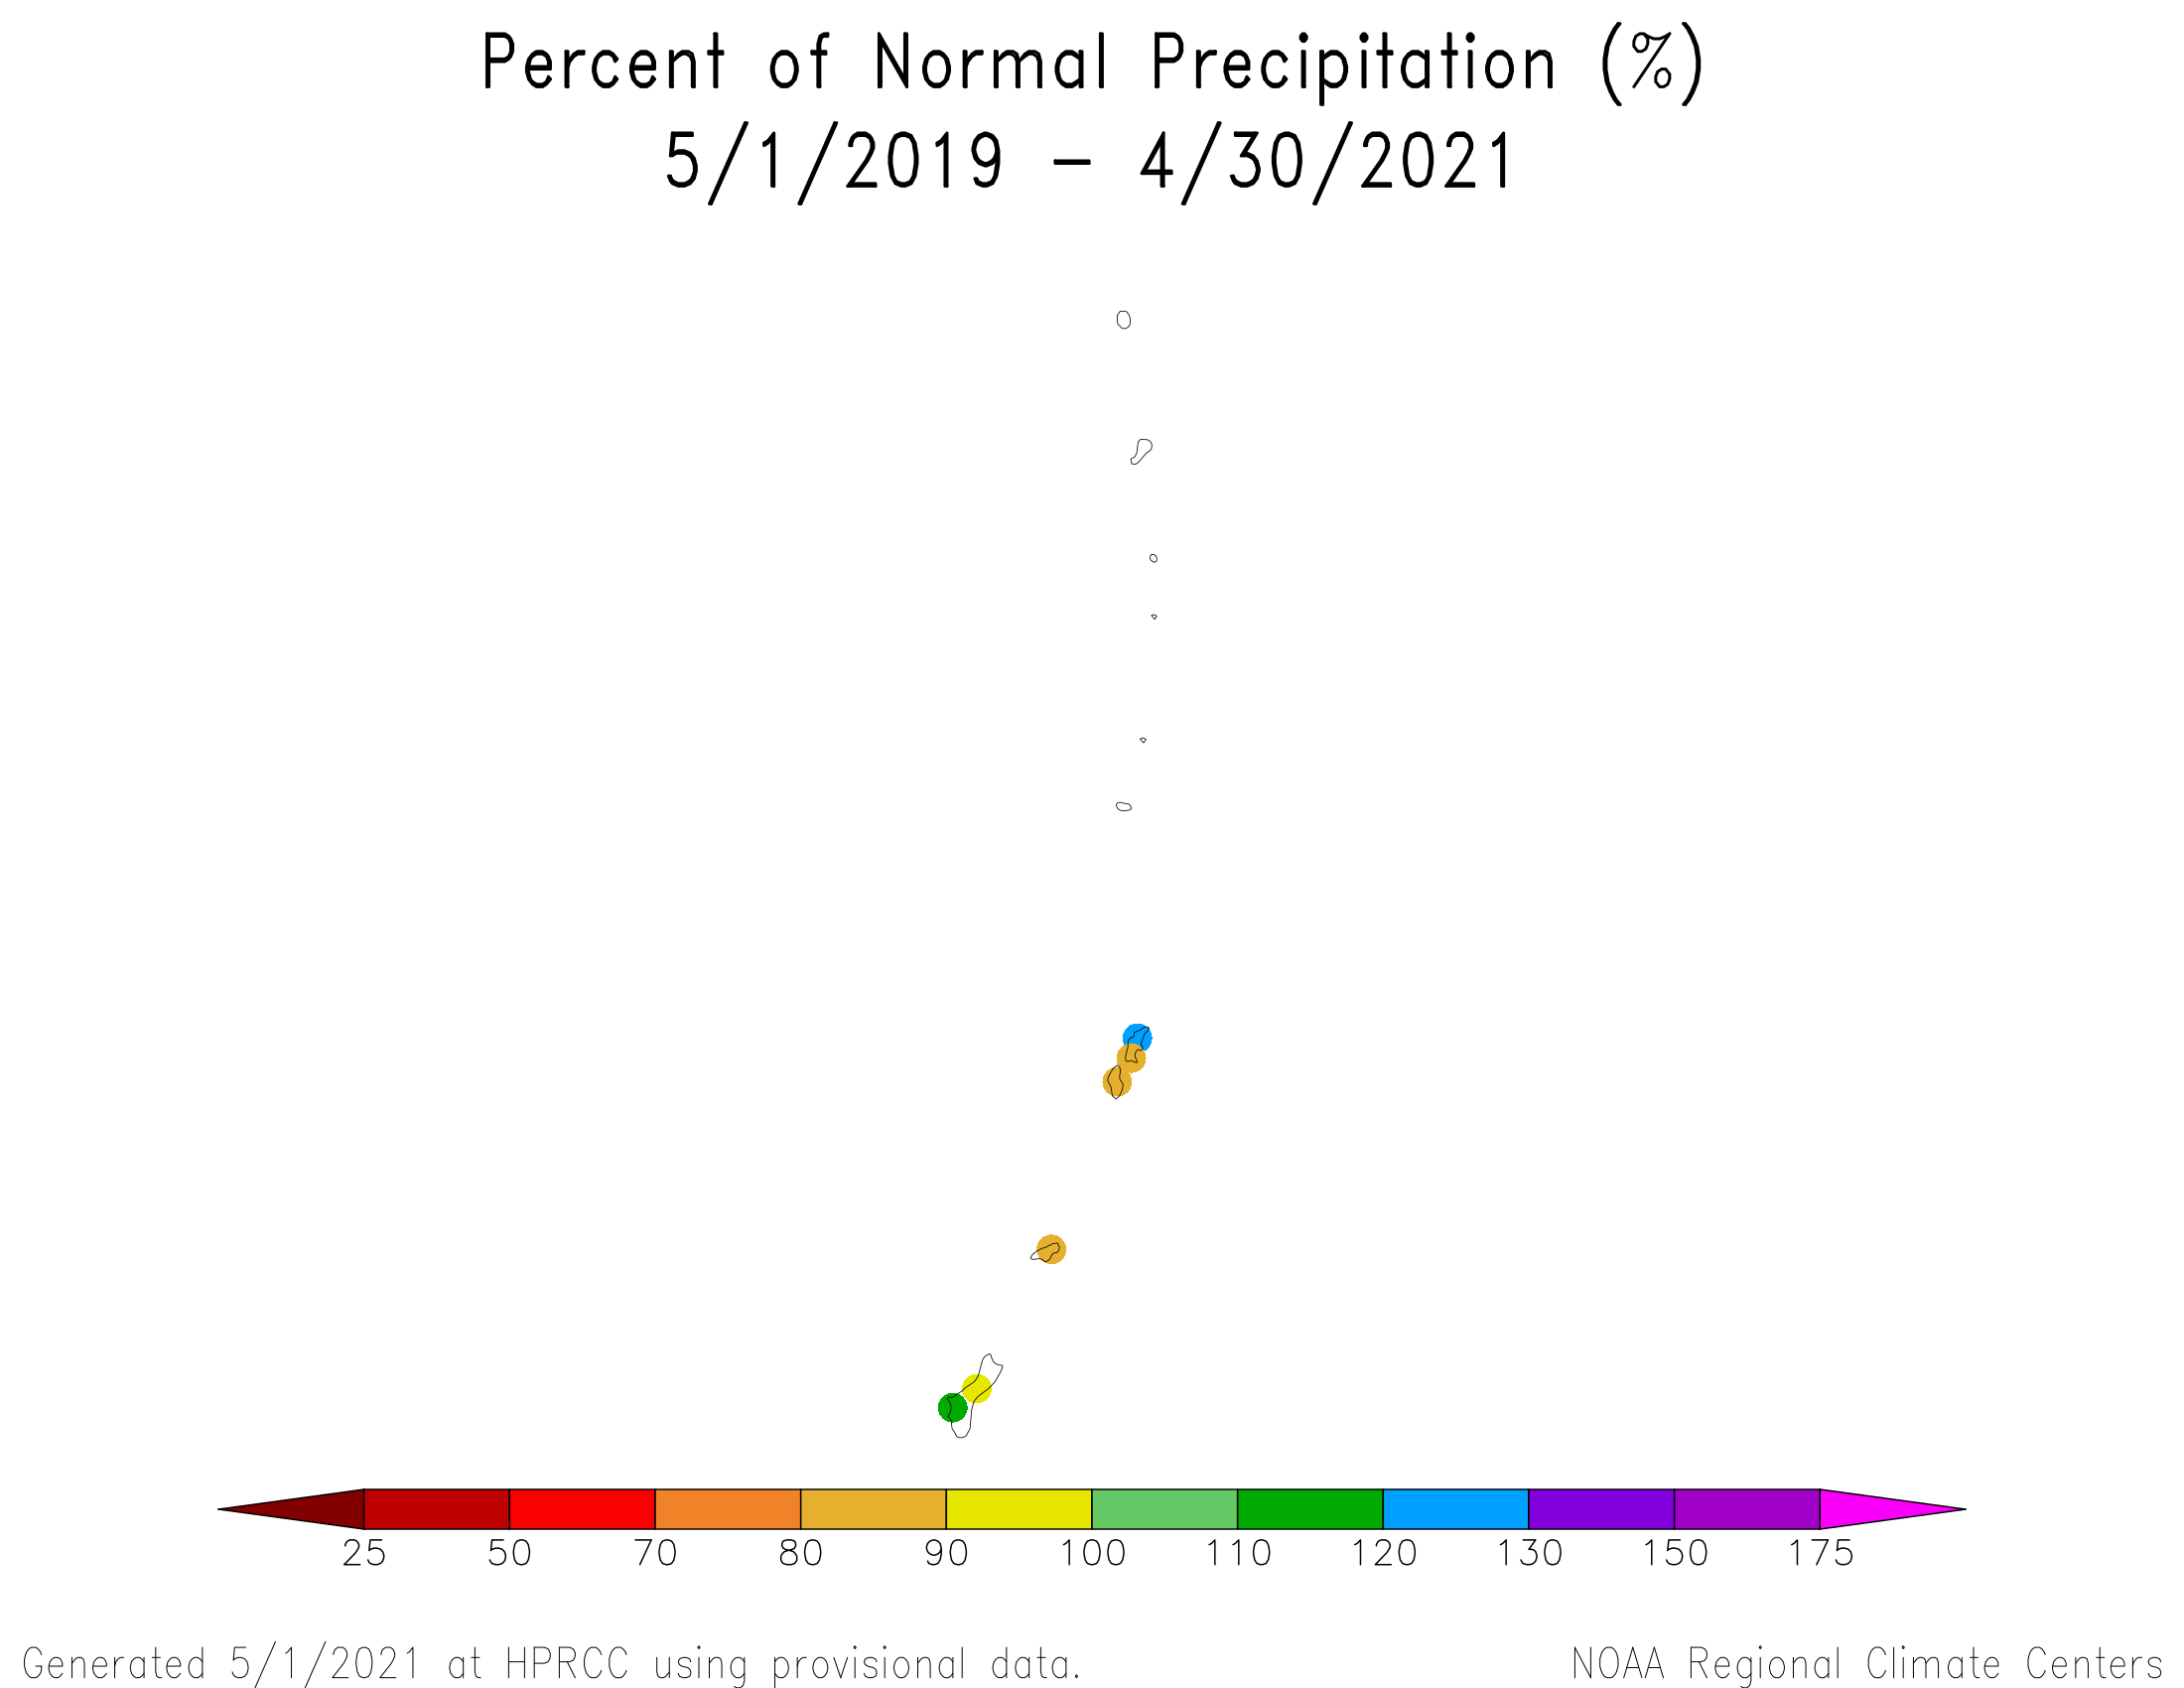
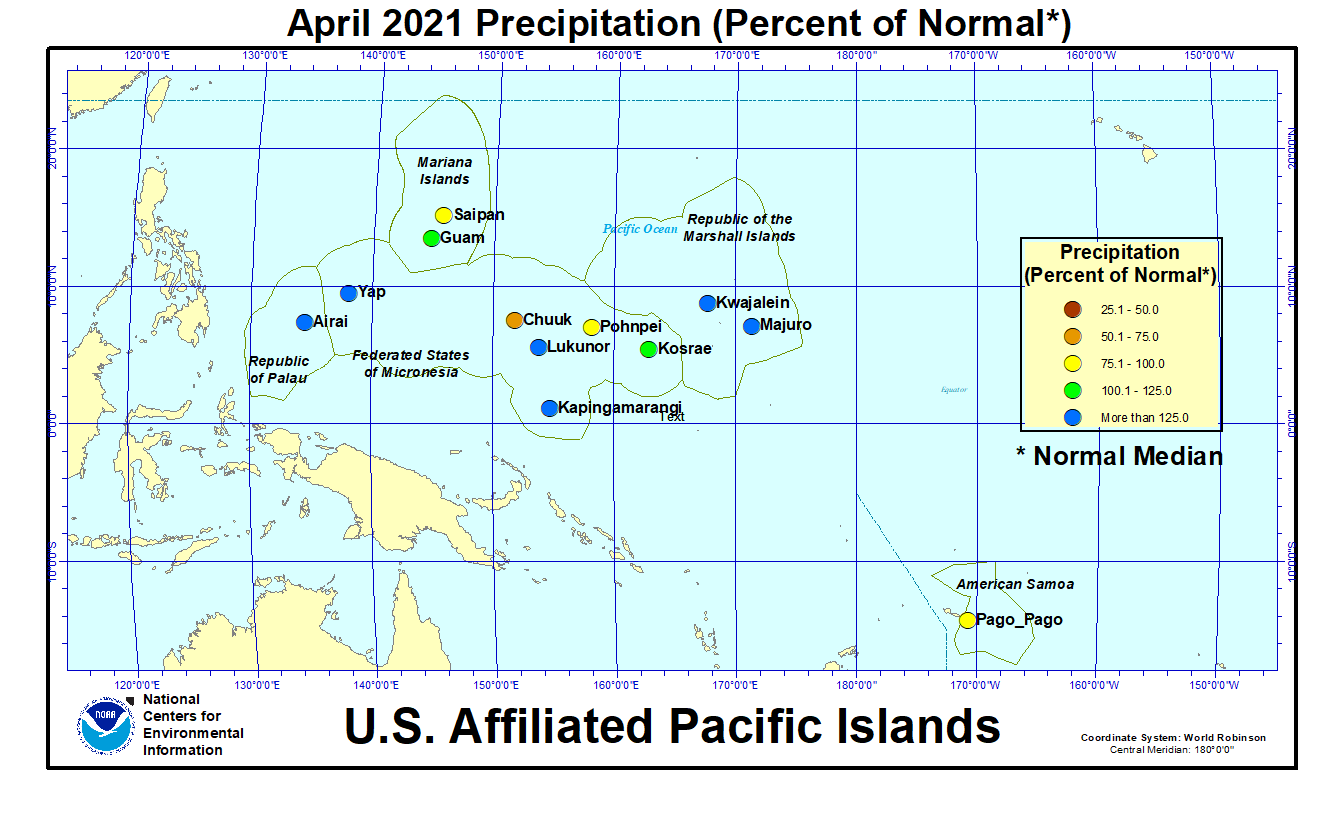
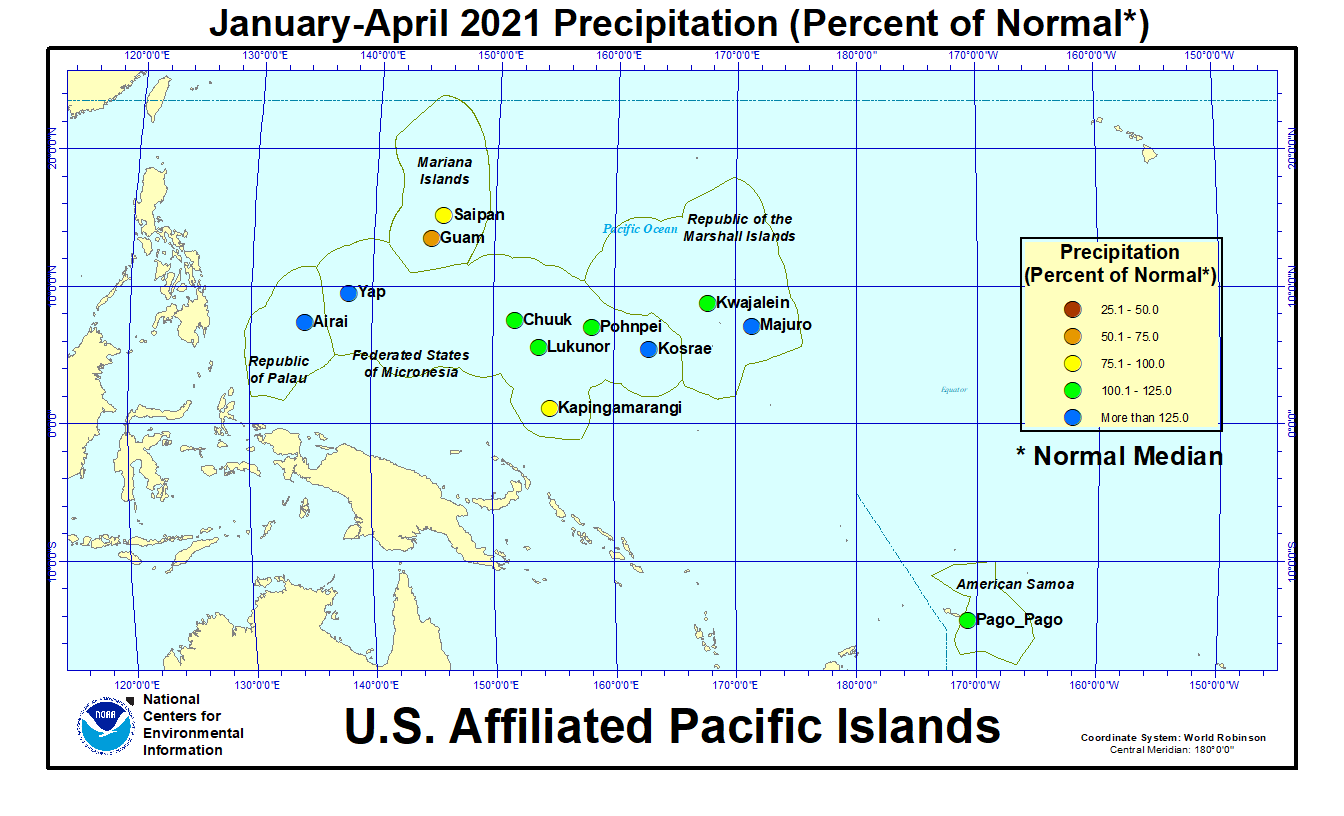
As measured by percent of normal precipitation, Saipan was drier than normal in the short term (April, the last 3 months [February-April 2021], and the year-to-date [January-April]) and long term (last 12 months [ May 2020-April 2021]). Guam and Kapingamarangi were wetter than normal in April but drier than normal for the other 3 time periods. Pago Pago was drier than normal for April and the last 3 months, but near to wetter than normal at the longer time periods. Chuuk and Pohnpei were drier than normal in April but wetter than normal for the other 3 time periods. Airai (Palau International Airport), Kosrae, Kwajalein, Lukunor, Majuro, and Yap were near to wetter than normal at all 4 time scales.
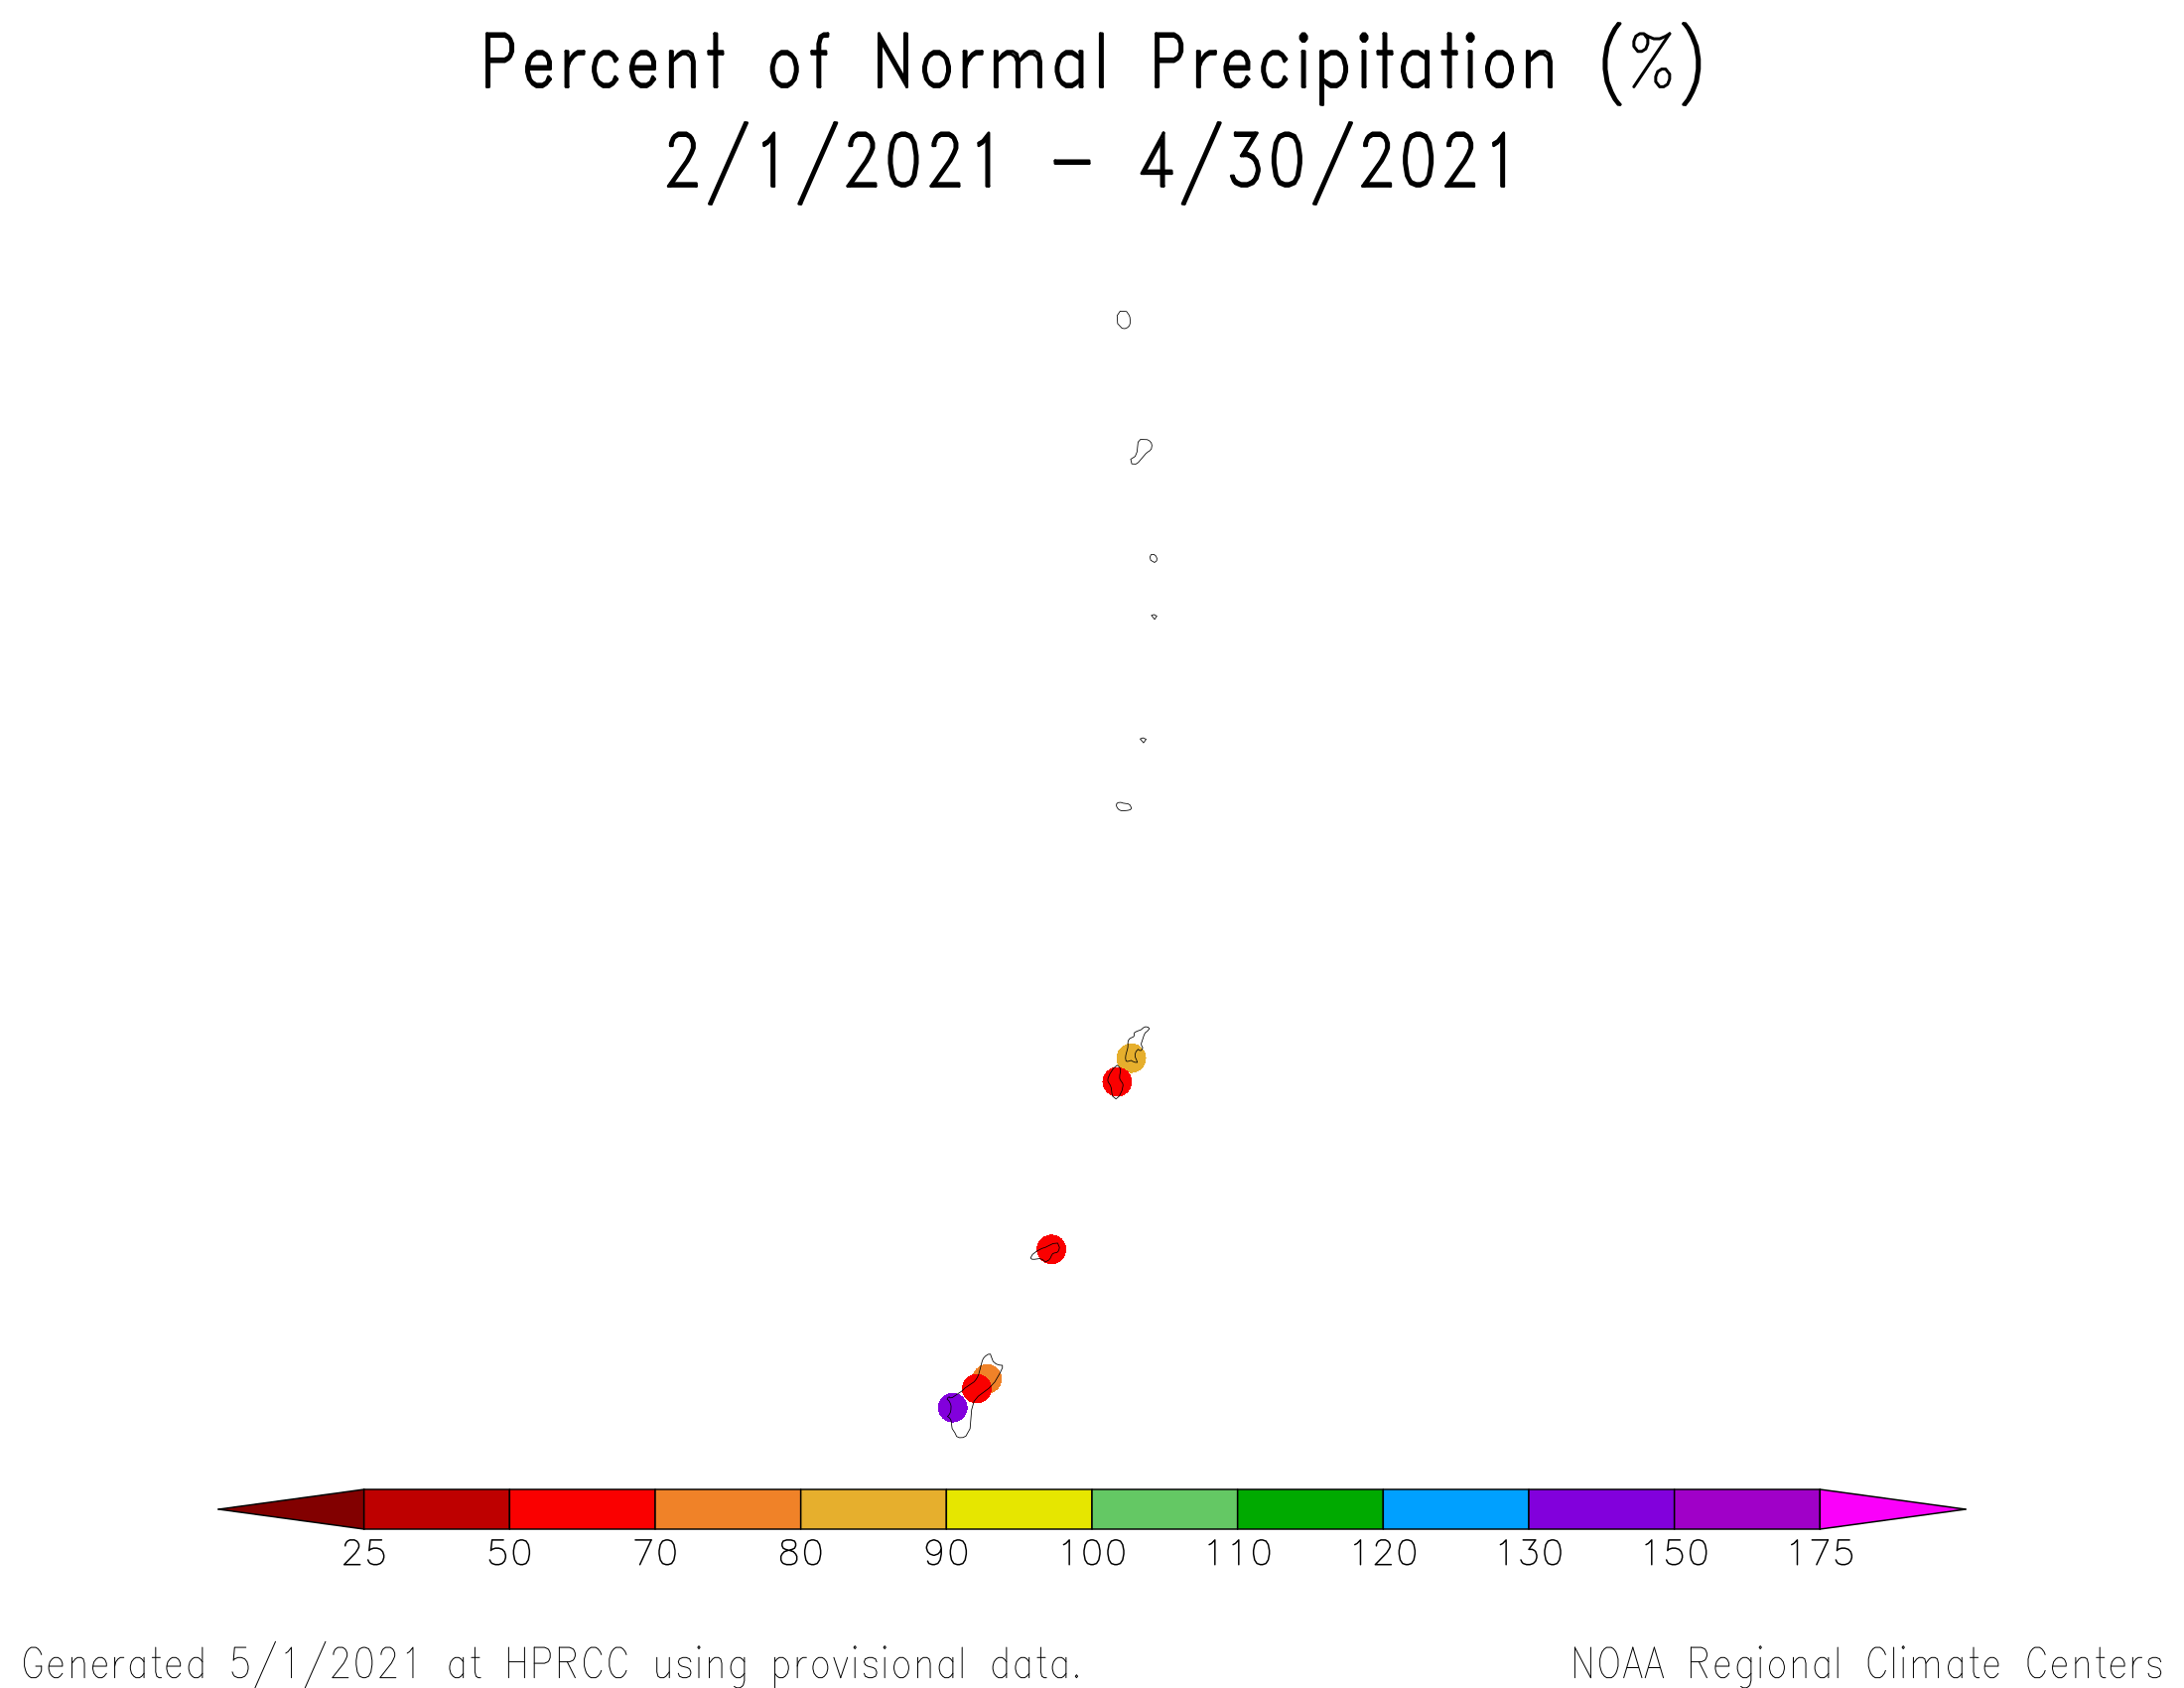

Based on percent of normal average (instead of normal median values), in the Marianas Islands, precipitation during April and the last 3 months was generally below normal across the islands. A mixed anomaly pattern was evident at the 9- to 12-month time scales, with drier conditions dominating at longer time scales (percent of normal precipitation maps for the last 1, 3, 9, 12, 24, 48 months).
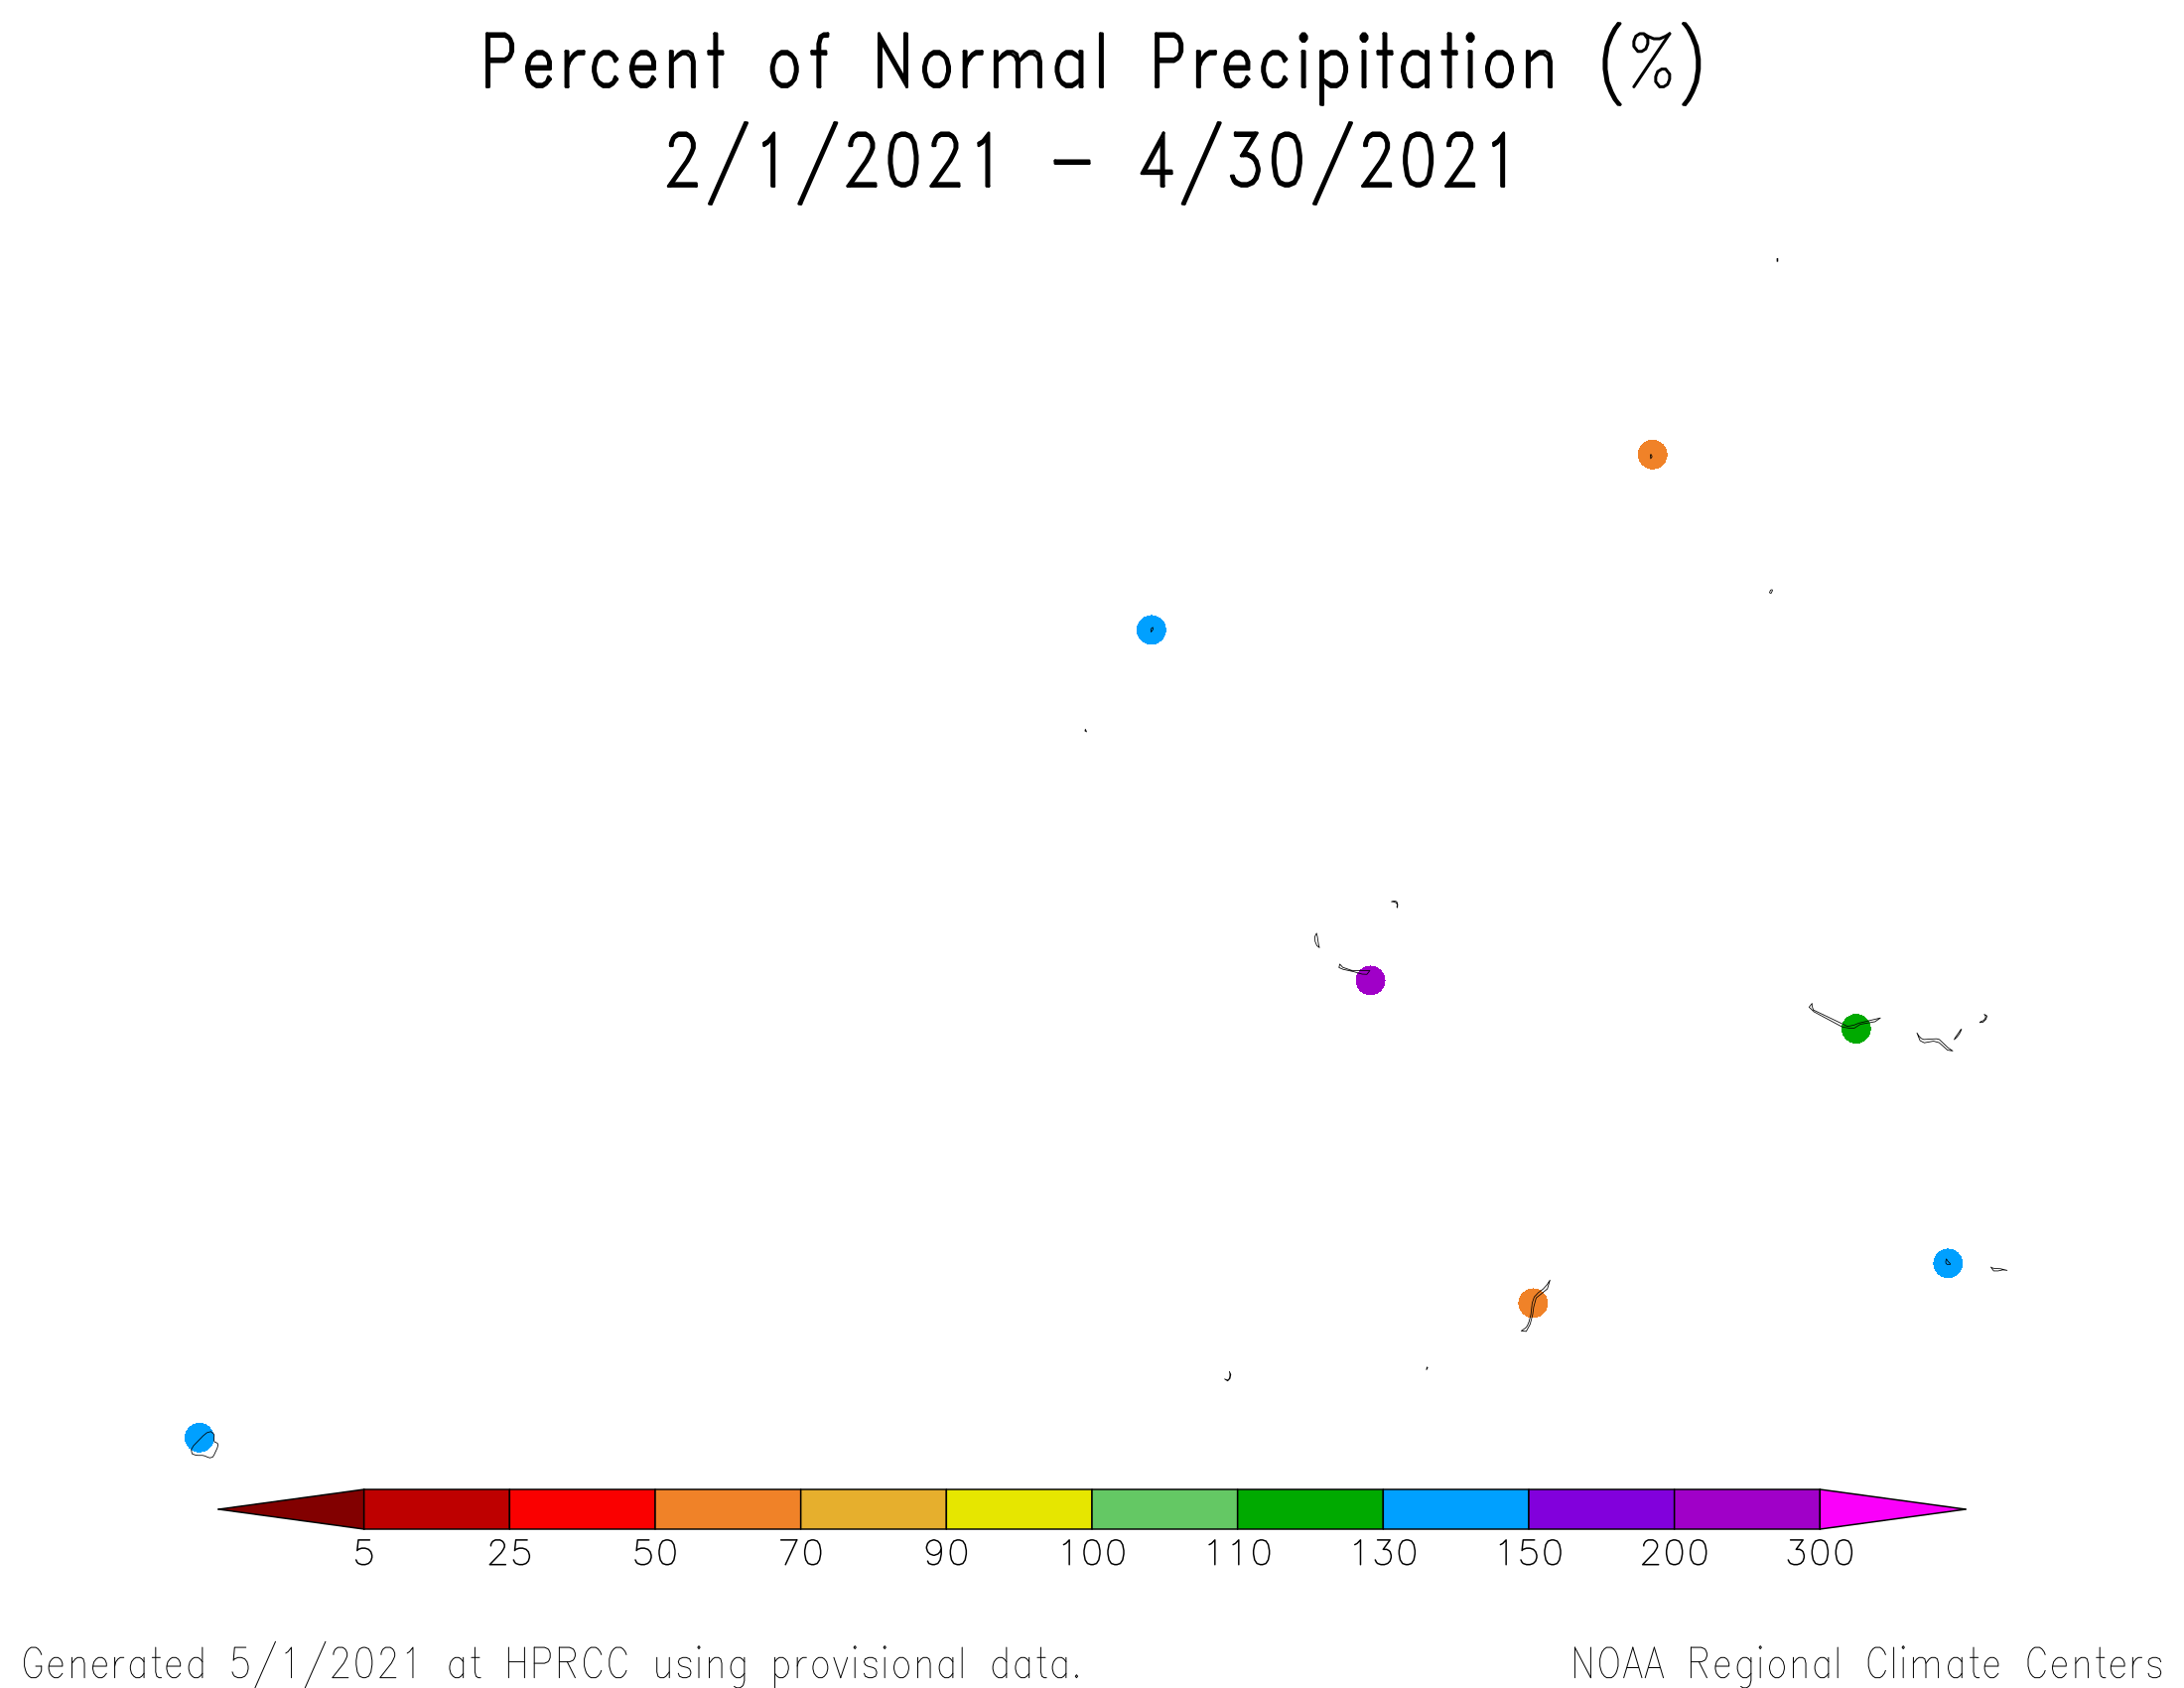

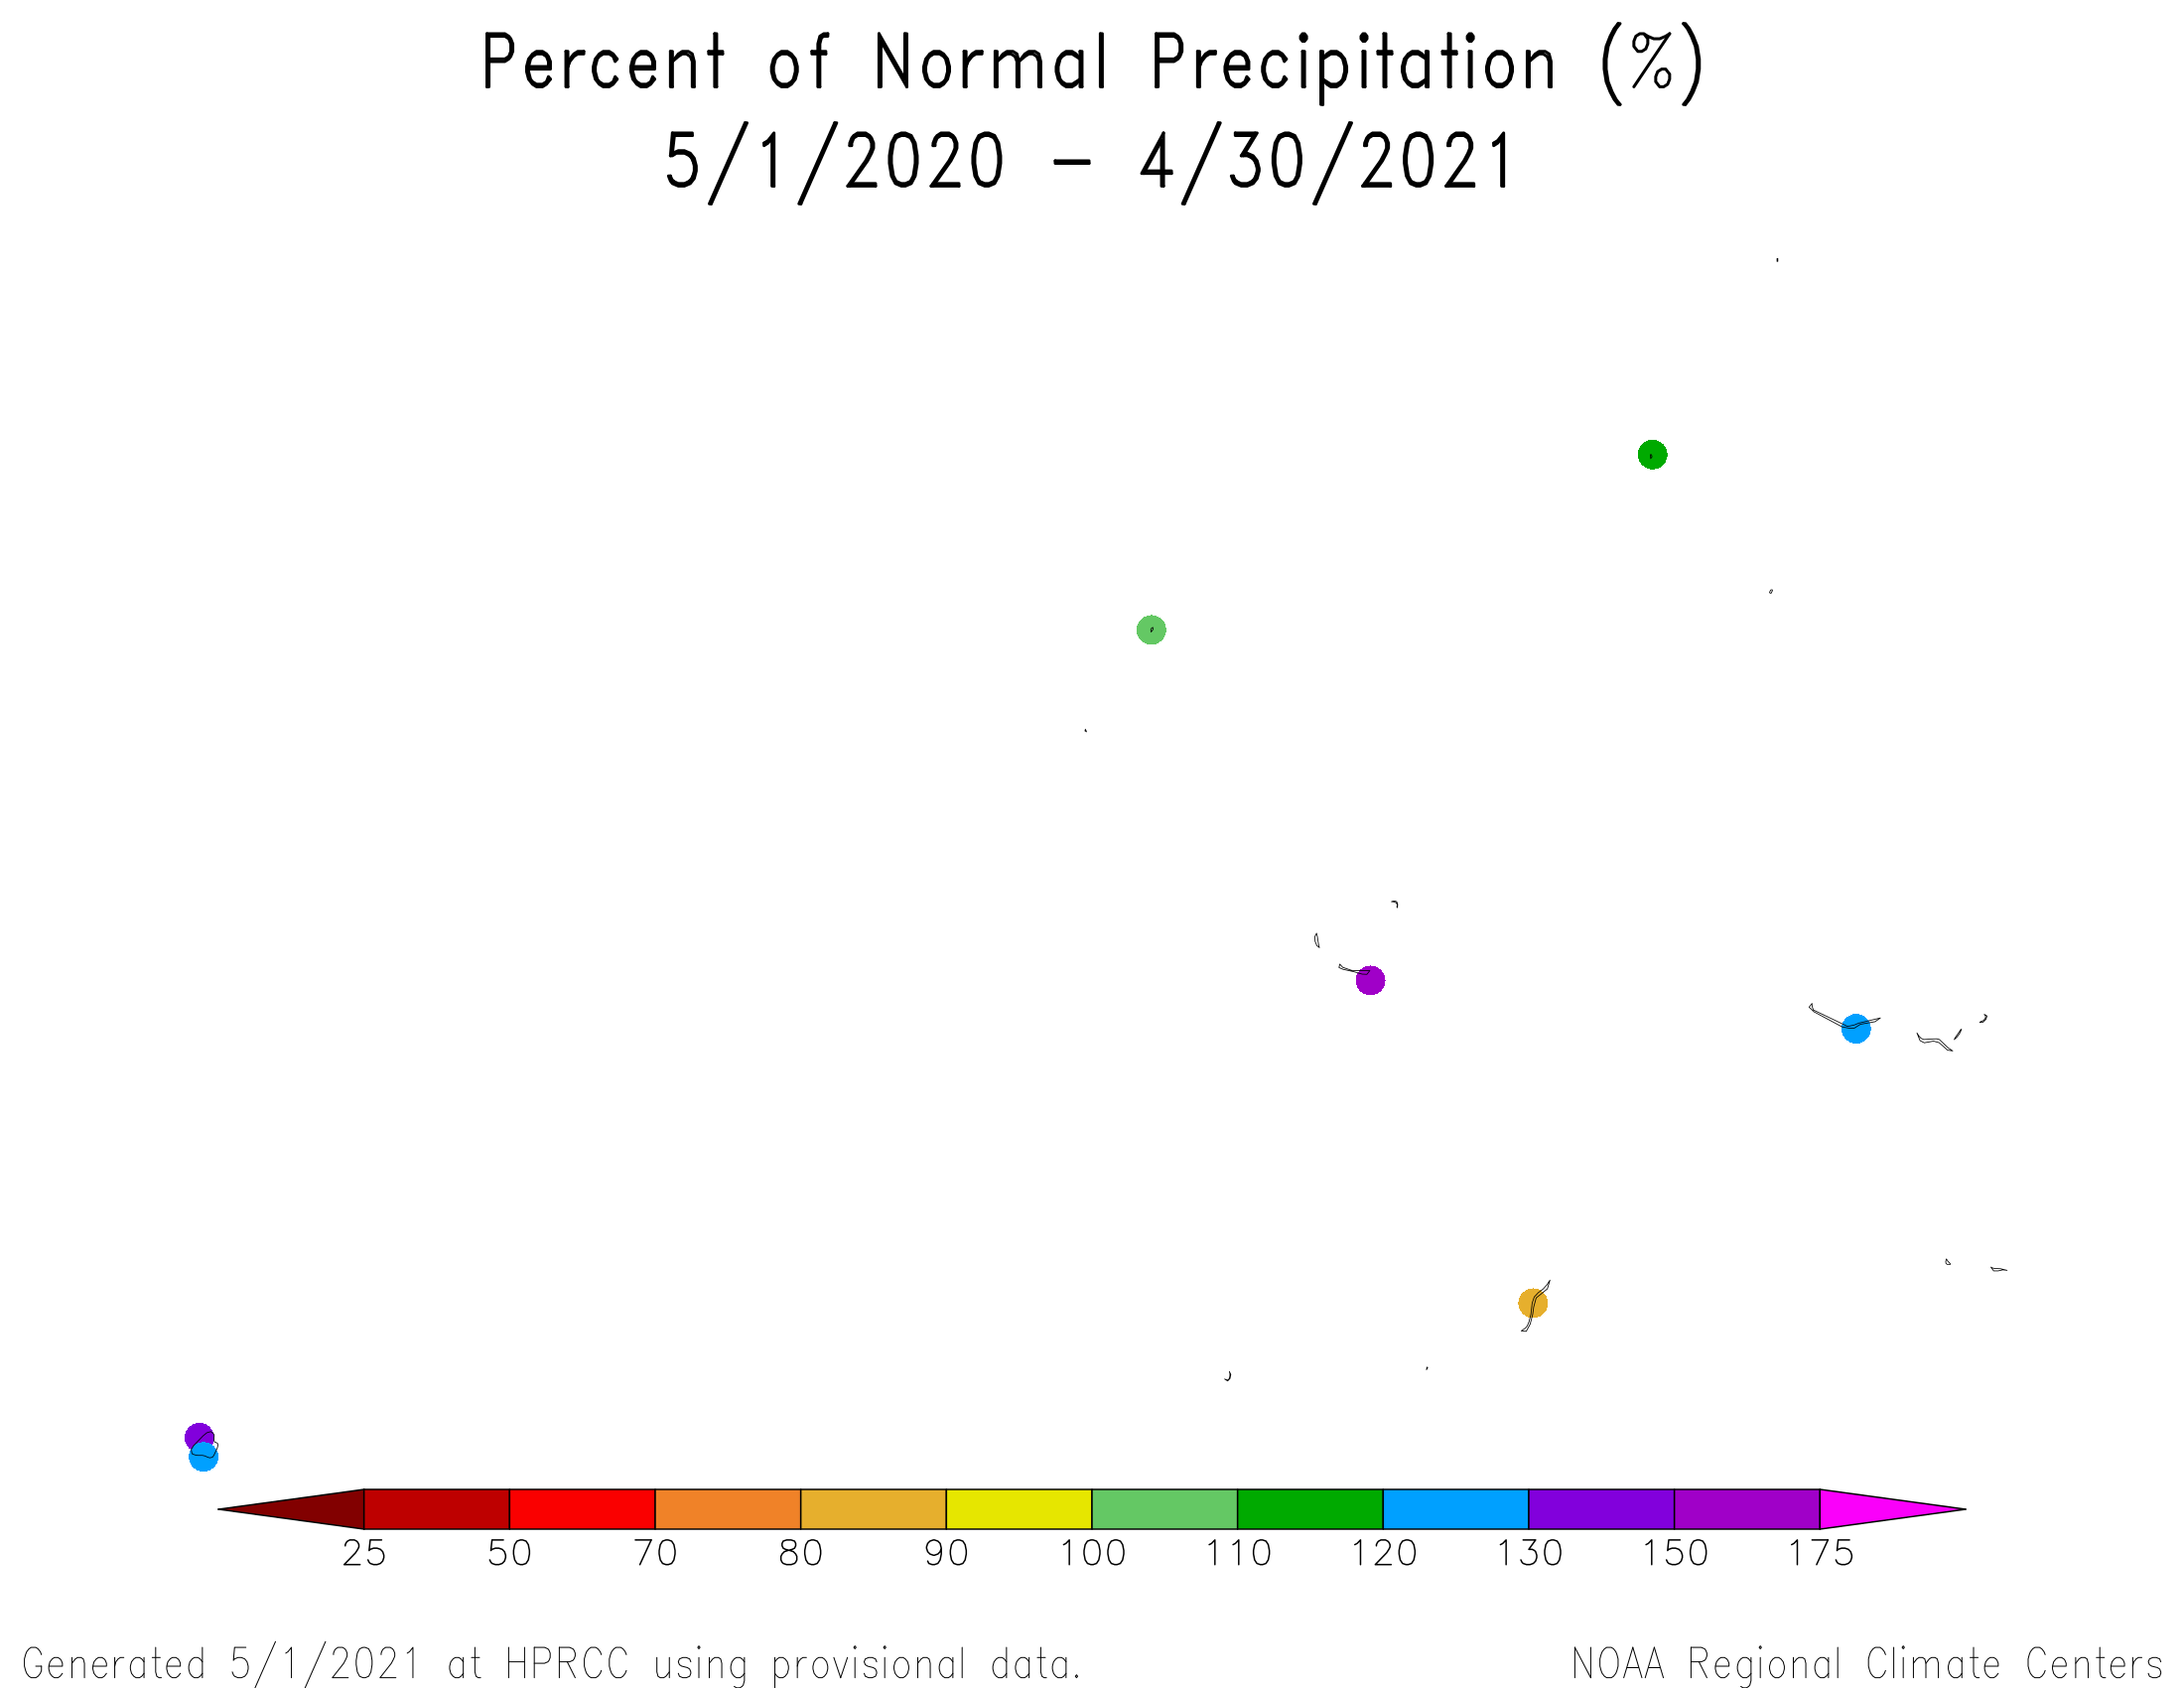
In the Marshall Islands, April was mostly wetter than normal. Most of the islands were wetter than normal for the last 3 months, except for some dryness in the far northern and southern islands. Wetter-than-normal conditions dominated at the 9-12 month time scales, with a mixed anomaly pattern at longer time scales (percent of normal precipitation maps for the last 1, 3, 9, 12, 24, 48 months).
![0-10 cm [0-4 inches] depth](/monitoring-content/sotc/drought/2021/04/sport.vsm0-10percent_20210430_00z_conus.gif)
![0-40 cm [0-16 inches] depth](/monitoring-content/sotc/drought/2021/04/sport.vsm0-40percent_20210430_00z_conus.gif)
![0-100 cm [0-39 inches] depth](/monitoring-content/sotc/drought/2021/04/sport.vsm0-100percent_20210430_00z_conus.gif)
![0-200 cm [0-79 inches] depth](/monitoring-content/sotc/drought/2021/04/sport.vsm0-200percent_20210430_00z_conus.gif)
According to the April 30th USDM produced for the USAPI, moderate drought (D1) spread across the Marianas (Guam, Rota, Saipan); extreme drought (D3) continued at Wotje in the northern RMI and moderate drought continued at Kwajalein; and conditions improved to moderate drought in the southern FSM at Kapingamarangi. The rest of the stations in Micronesia, and Tutuila in American Samoa, were free of drought and abnormal dryness. Storage in the Majuro reservoir generally declined for much of the month, but rose at the end of the month to 28.4 million gallons, which is 79 percent of maximum and near the 28.8 million gallon threshold for concern. The National Weather Service office in Guam issued three Drought Information Statements for the drought in April (on April 2, 16, and 30) discussing the conditions in the USAPI. Waning La Niña conditions allowed rains to return to Kapingamarangi, refilling water catchment tanks. But crops and vegetation are recovering slowly from the long-term effects of the drought. Quality of well water is unknown. Water conservation measures were in place across the far northern Marshall Islands. The most impacted islands have strict drinking water conservation measures in place while reserving well water for other needs. Residents from the remote islets of Mejatto and Ebadon were collecting water from RO (Reverse Osmosis) units on Kwajalein. Some crops were yellowing.
Rain during the last couple months has improved precipitation ranks at most islands in Micronesia (based on monthly and seasonal precipitation ranks), but long-term dryness still continues at Kapingamarangi, Saipan, and Jaluit. May 2020-April 2021 is still the driest such 12-month period in 16 years of data for Kapingamarangi, although June-April through August-April have improved in rank to second driest. April ended up ranking third wettest in 29 years of data. At Saipan, May-April and June-April both ranked third driest in a 32-year record. Jaluit had the seventh driest May-April, June-April, and July-April out of 35 years of data.
The following analysis of historical data for the USAPI stations in the Global Historical Climatology Network-Daily (GHCN-D) dataset, augmented with fill-in data from the 1981-2010 Normals, helps put the current data into historical perspective by computing ranks based on the period of record. The table below lists the precipitation ranks for April 2021, November 2020-April 2021 (last 6 months), and May 2020-April 2021 (the last 12 months). Some stations have a long period of record and their dataset is fairly complete, while other stations have a shorter period of record and the dataset has some missing data.
| Station | April 2021 | Nov 2020-Apr 2021 | May 2020-Apr 2021 | Period of Record | |||
|---|---|---|---|---|---|---|---|
| Rank | Years | Rank | Years | Rank | Years | ||
| Ailinglapalap | 31 | 38 | 35 | 36 | 35 | 35 | 1981-2021 |
| Chuuk | 15 | 70 | 66 | 70 | 58 | 69 | 1951-2021 |
| Fananu | 4 | 6 | 5 | 6 | -- | 2 | 2003-2021 |
| Guam | 34 | 65 | 29 | 64 | 15 | 64 | 1957-2021 |
| Jaluit | 9 | 38 | 13 | 36 | 7 | 35 | 1981-2021 |
| Kapingamarangi | 27 | 29 | 4 | 24 | 1 | 16 | 1962-2021 |
| Koror | 69 | 70 | 64 | 70 | 65 | 68 | 1951-2021 |
| Kosrae | 24 | 51 | 40 | 41 | 31 | 34 | 1954-2021 |
| Kwajalein | 48 | 69 | 33 | 69 | 27 | 69 | 1952-2021 |
| Lukonor | 31 | 37 | 33 | 36 | 20 | 24 | 1981-2021 |
| Majuro | 45 | 67 | 56 | 67 | 63 | 66 | 1954-2021 |
| Mili | 24 | 37 | -- | 34 | -- | 32 | 1981-2021 |
| Nukuoro | 23 | 38 | 25 | 36 | 17 | 35 | 1981-2021 |
| Pago Pago | 14 | 56 | 34 | 55 | 51 | 55 | 1966-2021 |
| Pingelap | 18 | 37 | 30 | 34 | 25 | 32 | 1981-2021 |
| Pohnpei | 19 | 70 | 68 | 70 | 64 | 69 | 1951-2021 |
| Saipan | 20 | 41 | 18 | 32 | 3 | 32 | 1981-2021 |
| Ulithi | 35 | 39 | 34 | 35 | 31 | 35 | 1981-2021 |
| Utirik | -- | 19 | -- | 8 | -- | 4 | 1985-2020 |
| Woleai | 37 | 42 | 31 | 32 | 19 | 24 | 1968-2021 |
| Wotje | 24 | 38 | 23 | 35 | 25 | 34 | 1981-2021 |
| Yap | 69 | 70 | 70 | 70 | 66 | 69 | 1951-2021 |

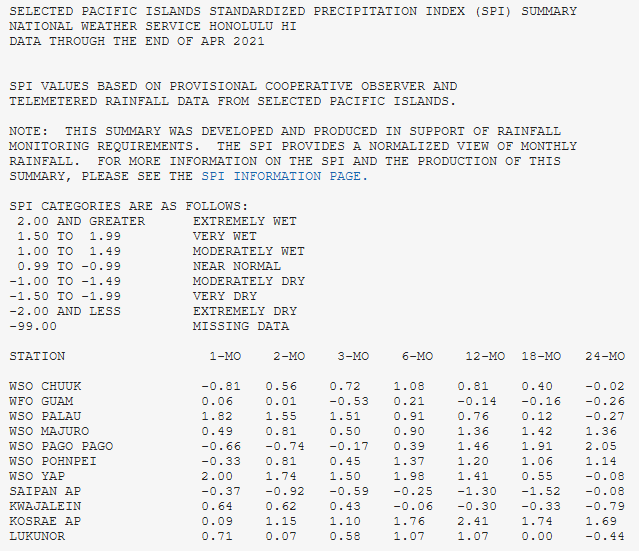
SPI values for seven time periods for Pacific Islands, computed by the Honolulu NWS office.
NOAA Regional Climate Centers
More information, provided by the NOAA Regional Climate Centers and others, can be found below.
Southeast
As noted by the Southeast Regional Climate Center, temperatures were near average across much of the Southeast and Puerto Rico for the month of April, while precipitation varied across the region. The driest locations were found across South Carolina, North Carolina, southern Virginia, and eastern Puerto Rico, where precipitation totals were 70 to less than 25 percent of normal. Florence, SC (1948-2021) received only 0.15 inch (3.81 mm) of precipitation for the month, making this the driest April on record. In contrast, the wettest locations were found across southern Alabama, southern Georgia, Florida, and western Puerto Rico, where precipitation totals were 150 to more than 300 percent of normal.
Below normal amounts of precipitation for the month of April increased abnormally dry conditions (D0) across North Carolina and South Carolina. The area of moderate drought (D1) is gone, but a few pockets of abnormally dry conditions (D0) still remain. Moderate precipitation slightly improved drought conditions across Florida, with a small pocket of moderate drought (D1) ringed by abnormally dry conditions (D0) in the southern peninsula. Drought conditions increased in Puerto Rico, with a general area of abnormally dry conditions (D0) and embedded pockets of moderate drought (D1) across the island. In the southern part of the Florida peninsula, warm, dry weather increased the pest pressure, including whiteflies on vegetables, and wilting was noted in pastures. Dry conditions in northern Georgia counties required the employment of irrigation for the first time this year. However, in the southern counties, heavy rainfall from storms caused a surplus of soil moisture and flood damage to fields. In South Carolina, the continued lack of rainfall has farmers choosing which fields to plant based on soil moisture; in addition, the planting/transplanting of tobacco has stopped because of the soil moisture deficit. Similarly, in North Carolina, soils are getting dry slowing down planting and pasture growth.
South
As explained by the Southern Regional Climate Center, temperatures for the month of April were below normal across much of the Southern region, while precipitation values varied spatially across the region. Parts of eastern, central, and western Tennessee; northern Mississippi; western Oklahoma; and northern, western, southern, and southeastern Texas received 50 percent or less of normal precipitation. Parts western Oklahoma as well as northern, western, and southern Texas received 25 percent or less of normal precipitation, while parts of far western Oklahoma as well as northern, western and southern Texas received 5 percent or less of normal precipitation.
At the end of April, drought conditions both improved and deteriorated across the Southern region. Exceptional drought conditions persisted or expanded across northwestern, western, and southern Texas. Extreme drought conditions persisted or even expanded across parts of western and southern Texas, while new areas developed across parts of north-central and central Texas. Severe drought classifications persisted across western Oklahoma as well as northwestern, western, northeastern, central, and southern Texas, while new areas developed across parts of eastern Texas and southern Oklahoma. Moderate drought classifications expanded or developed across parts of central Texas and southern Oklahoma. However, the moderate drought conditions in northern Louisiana and parts of eastern Texas were eliminated. There was a decrease in the total area experiencing abnormally dry conditions, as abnormally dry conditions were eliminated across parts of central Mississippi, northern Louisiana, and eastern Texas. However, abnormally dry conditions developed across parts of west-central Texas as well as western and southwestern Oklahoma.
Midwest
As described by the Midwest Regional Climate Center, April saw both extremes of temperature but averaged out to near-normal values for the month. Regionwide precipitation for April in the Midwest was 2.70 inches (69 mm), which was 0.97 inches (25 mm) below normal. Precipitation totals ranged widely across the Midwest with most of the region below normal and two areas had above-normal precipitation. A large part of Iowa, and tiny portions of Minnesota and Wisconsin had less than 25 percent of normal. Other areas in Iowa, Minnesota, Wisconsin, Illinois, Michigan, and Kentucky had less than half of their normal precipitation for the month. Iowa ranked as the 13th driest in its history back to 1895. Decorah, Iowa (120 years of data) set a new monthly precipitation record with just 0.56 inch (14 mm) breaking the 1959 record value of 0.68 inch (17 mm). Waterloo, Iowa (127 years) ranked 2nd driest, Mason City, Iowa (120 years) ranked 4th driest, and Chicago, Illinois (151 years) ranked 6th driest in their respective histories.
Drier than normal conditions in April led to an expansion of drought in the Upper Midwest. The month began with about 11 percent of the region in moderate drought, just over 1 percent in severe drought and about a quarter of a percent in extreme drought. By the end of the month the moderate drought had expanded to about 20 percent of the region, with severe drought holding relatively steady at 1 percent and the extreme drought in northwestern Iowa gone. A large part of the increase in moderate drought was in Michigan where nearly all of Lower Michigan was included.
Northeast
As explained by the Northeast Regional Climate Center, the Northeast had its 20th warmest April since 1895 with an average temperature of 47.6 degrees F (8.7 degrees C), which was 1.5 degrees F (0.8 degrees C) above normal. April wrapped up on the dry side of normal for the Northeast with 3.20 inches (81.28 mm) of precipitation, which was 85 percent of normal. Nine of the twelve Northeast states received below-normal precipitation, with New Jersey having its 20th driest April in 127 years of recordkeeping. Overall, precipitation ranged
The USDM released on April 1 showed 9 percent of the Northeast in a moderate drought and 28 percent as abnormally dry. During the month, moderate drought and abnormal dryness expanded in the region due to below-normal precipitation, low soil moisture, and reduced streamflow and groundwater levels. By month's end, areas of moderate drought were found in northwestern Pennsylvania, western and northern New York, much of Vermont, southwestern New Hampshire, and north-central Massachusetts. Meanwhile, areas of abnormal dryness were found in parts of every Northeast state except New Jersey and Delaware. The USDM released on April 29 showed 14 percent of the Northeast in a moderate drought and 41 percent as abnormally dry. Low groundwater levels continued to concern officials in New England, with a few states asking residents to conserve water. Ipswich, Massachusetts, enacted voluntary water restrictions earlier than usual due to below-normal precipitation and low flow on the Ipswich River. Water restrictions were also implemented in Falmouth, Massachusetts, due to drought concerns. The aquifers that provide drinking water to Dover, New Hampshire, were around two feet (0.6 m) below normal. In Vermont, reduced streamflow affected recreational activities and Lake Champlain's water level was below normal. Extra water was removed from Lake Ontario in January and February due to spring flooding concerns but below-normal precipitation and reduced snowpack over the past few months resulted in even lower water levels. Because of this, outflows on Lake Ontario were reduced, with the goal of allowing water levels to increase. Fire danger continued to be high in some locations due to dry conditions, causing some fire wardens in Vermont to not issue burn permits. Dry conditions in Vermont have already led some farmers to purchase feed for their livestock. In addition, maple syrup production in the state was expected to be reduced by 30 to 40 percent.
High Plains
As summarized by the High Plains Regional Climate Center, after an extremely warm March, temperatures moderated during the month of April with most locations having temperature departures near or just below normal. Overall, April was a dry month for the High Plains region. Large areas received less than 50 percent of normal precipitation, including much of North Dakota, western South Dakota, northern Nebraska, western and central Kansas, western and southern Colorado, and pockets of Wyoming. This caused some locations to rank among the top 10 driest Aprils on record. For example, Dodge City, KS had its 10th driest April with only 0.33 inch (8 mm), which was 18 percent of normal (period of record 1874-present). Dodge City's driest April occurred in 1909 with 0.02 inch (1 mm). Looking back before April, mounting precipitation deficits have contributed to an expansion and intensification of drought conditions across much of North Dakota, northern South Dakota, and eastern Montana. Year-to-date deficits in these areas were generally in the range of 1.50-3.00 inches (38-76 mm), with water year-to-date deficits approaching 4.00-6.00 inches (102-152 mm) in some areas. This is a considerable deficit given that much of this area receives, on average, less than 20.00 inches (508 mm) of precipitation per year. As an example, year-to-date precipitation in Bismarck, ND was 1.15 inches (29 mm) at the end of April. This paltry amount was enough to rank as the 3rd driest January-April precipitation total on record (period of record 1874-present). The driest January-April time period occurred in 1926 with 1.00 inch (25 mm).
Drought continued to impact over half the region this month, with relatively cool and dry conditions overall. In the west, there were slight improvements in Colorado, but drought conditions expanded by nearly 14 percent in Wyoming. Several Colorado communities were asked to voluntarily reduce their water use in anticipation of the spring and summer. Interestingly, Fort Collins had voluntary restrictions due to concerns over potential water quality issues from runoff in areas that burned in the Cameron Peak Fire last year. The winter wheat crop in Colorado also continued to be impacted, with 31 percent in poor to very poor condition at the beginning of May, according to the USDA National Agricultural Statistics Service. Several impacts have also been reported across Wyoming, particularly for ranchers who were dealing with poor pasture and range conditions. Hunting activities may also be impacted, as the Wyoming Game and Fish Department proposed to reduce pronghorn licenses this year due to a combination of the ongoing drought and spring blizzard. Meanwhile, drought intensified across the Northern Plains, with extreme drought (D3) expanding by about 11 percent in South Dakota and 36 percent in North Dakota. This intensification was due to a combination of mounting precipitation deficits, depleted soil moisture reserves, and below-normal streamflows. Spotty rain and snow showers merely helped to stave off additional degradations. Many impacts have been reported this month, including dry stock ponds and creeks, low feed supplies, the culling of herds, and an increase in fire danger. The Drought Hotline and hay map were reactivated in North Dakota, giving ranchers an outlet to buy/sell hay or offer help, while a series of drought webinars were planned in South Dakota in order to provide additional information for people there. Fire emergencies were also declared in both states at the start of April, as warm, dry conditions prevailed early in the month. Thousands of acres burned, including portions of the Theodore Roosevelt National Park in North Dakota.
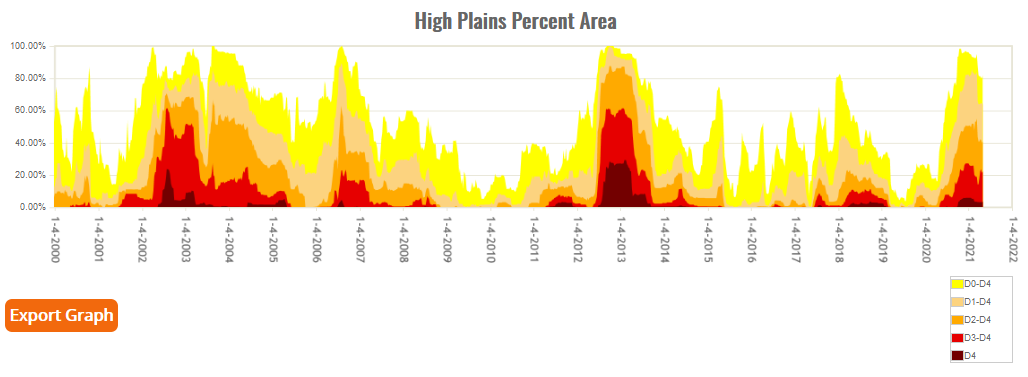
Overall, the area experiencing drought (D1-D4) in the High Plains region remained at about 64 percent this month, according to the USDM. Although the total area was unchanged, there were several areas that had improvements or degradations over the course of the month. The largest reduction in drought conditions occurred in South Dakota, with a decrease of about 14 percent. These improvements were generally confined to eastern and southwestern areas of the state, which received above-normal precipitation. Drought intensified across the northwest, however, with an 11 percent increase in extreme drought (D3). In Wyoming, nearly the opposite occurred. Precipitation helped to improve drought conditions, particularly in the central part of the state, where D3 was reduced by about 12 percent. However, the statewide areal coverage of drought increased by nearly 14 percent due to ongoing dry conditions. North Dakota also had large changes in drought intensity, with a 36 percent increase in D3 over the course of the month. By the end of April, approximately 83 percent of the state was in D3, which was the highest amount since the USDM began. Prior to 2021, the record was about 46 percent during the 2017 Northern Plains drought (July 25, 2017). Elsewhere in the region, only minor adjustments to drought conditions were made. Abnormally dry conditions did expand across southern Kansas due to recent dryness.
West
As described by the Western Regional Climate Center, dry conditions persisted throughout the western U.S. during April as a result of a weak but persistent ridge located offshore of North America. This ridge favored slightly above normal temperatures in the western half of the region, whereas the eastern portion of the region experienced slightly below normal temperatures. A few locations, notably southern New Mexico observed above normal precipitation, such as Cavern City, NM, which with records starting in 1930, observed 1.87 in. (47.5 mm) of precipitation for its fourth wettest April at 415% of normal. Dry records were much more abundant. Portland, OR received 0.39 in. (10 mm) of precipitation (14% of normal), making April 2021 its driest April since records began in 1938. With a total of 0.05 in. (1 mm; 3% of normal), Lewiston, ID also had its driest April since record keeping began in 1948. Further south along the coast, Half Moon Bay, CA recorded its second driest April since 1938 with 0.04 in. (1 mm) of precipitation (2% of normal).
The lack of April precipitation did not improve widespread snow drought conditions throughout much of the West. While snowpack in the Pacific Northwest, the northern Front Range of the Colorado Rockies, and the Bighorn Mountains of Wyoming ended April still well above average, well below to near record low snowpack plagued the majority of the West. The lack of snowpack accumulation throughout water year 2021, as well as the generally below normal water year accumulated precipitation, resulted in many regions undergoing degradation of USDM categories by one to two categories, particularly along the coastal ranges, the northern west slope of the Sierra Nevada, and the San Joaquin Valley of CA, western MT and WY, central MT, coastal OR and WA, eastern WA, and the ID Panhandle. There were some areas of improvement, with northwestern CO and northcentral WY improving by one to two drought classes. As of this writing, approximately 95% of the western U.S. is in drought, with nearly half (47%) experiencing extreme to exceptional drought.
Chaparral ecosystems are found throughout California. Climatologically, April is when these fire-prone shrublands indicate their highest live fuel moistures. However, following back-to-back dry winters (2020 and 2021) and a 2020 warm season characterized by multiple heat waves and extreme vapor pressure deficits, live fuel moisture samples from the chamise plant were found to be at record low levels with no new growth observed. The conditions of these indicator species highlight not only a critically stressed ecosystem, but also the extreme fire hazard that will characterize the dry season of 2021 in the lower elevations. At middle-to-upper elevations, not just in California but West-wide, the well-below average snowpack is already undergoing rapid melt. This will lead to earlier drying of soils and fuels, promoting conditions favorable for wildfire ignition and spread, with standing dead fuels favoring higher intensity wildfire.
Sea surface temperatures (SST) north of the Hawaiian Islands remained 1.5-3 F (0.8-1.7 C) above normal, though colder SST anomalies associated with stronger-than-normal anticyclonic flow around the strengthening Pacific High enhanced equatorial upwelling were observed southeast of the islands. Temperatures on the Hawaiian Islands were near-normal, with many long-record stations observing mean temperatures near the long-term median. The Big Island observed hot but near normal precipitation. With a mean temperature of 74.4 F (23.6 C) Hilo, HI recorded its fourth hottest April (1.9 F (1 C) above normal; a three-way tie) since 1950. Precipitation-wise, April was near normal with 8.5 in. (217 mm) of precipitation (95% of normal).