Issued 13 April 2021


Please note that the values presented in this report are based on preliminary data. They will change when the final data are processed, but will not be replaced on these pages.
National Drought Highlights
- Based on the Palmer Drought Index, severe to extreme drought affected about 27% of the contiguous United States as of the end of March 2021, about the same as last month. About 5% of the contiguous U.S. fell in the severely to extremely wet categories.
- About 39% of the contiguous U.S. fell in the moderate to extreme drought categories (based on the Palmer Drought Index) at the end of March.
- On a broad scale, the 1980s and 1990s were characterized by unusual wetness with short periods of extensive droughts, the 1930s and 1950s were characterized by prolonged periods of extensive droughts with little wetness, and the first two decades of the 2000s saw extensive drought and extensive wetness (moderate to extreme drought graphic, severe to extreme drought graphic).
- A file containing the national monthly percent area severely dry and wet from 1900 to present is available for the severe to extreme and moderate to extreme categories.
- Historical temperature, precipitation, and Palmer drought data from 1895 to present for climate divisions, states, and regions in the contiguous U.S. are available at the Climate Division: Temperature-Precipitation-Drought Data page. These filenames begin with "climdiv".
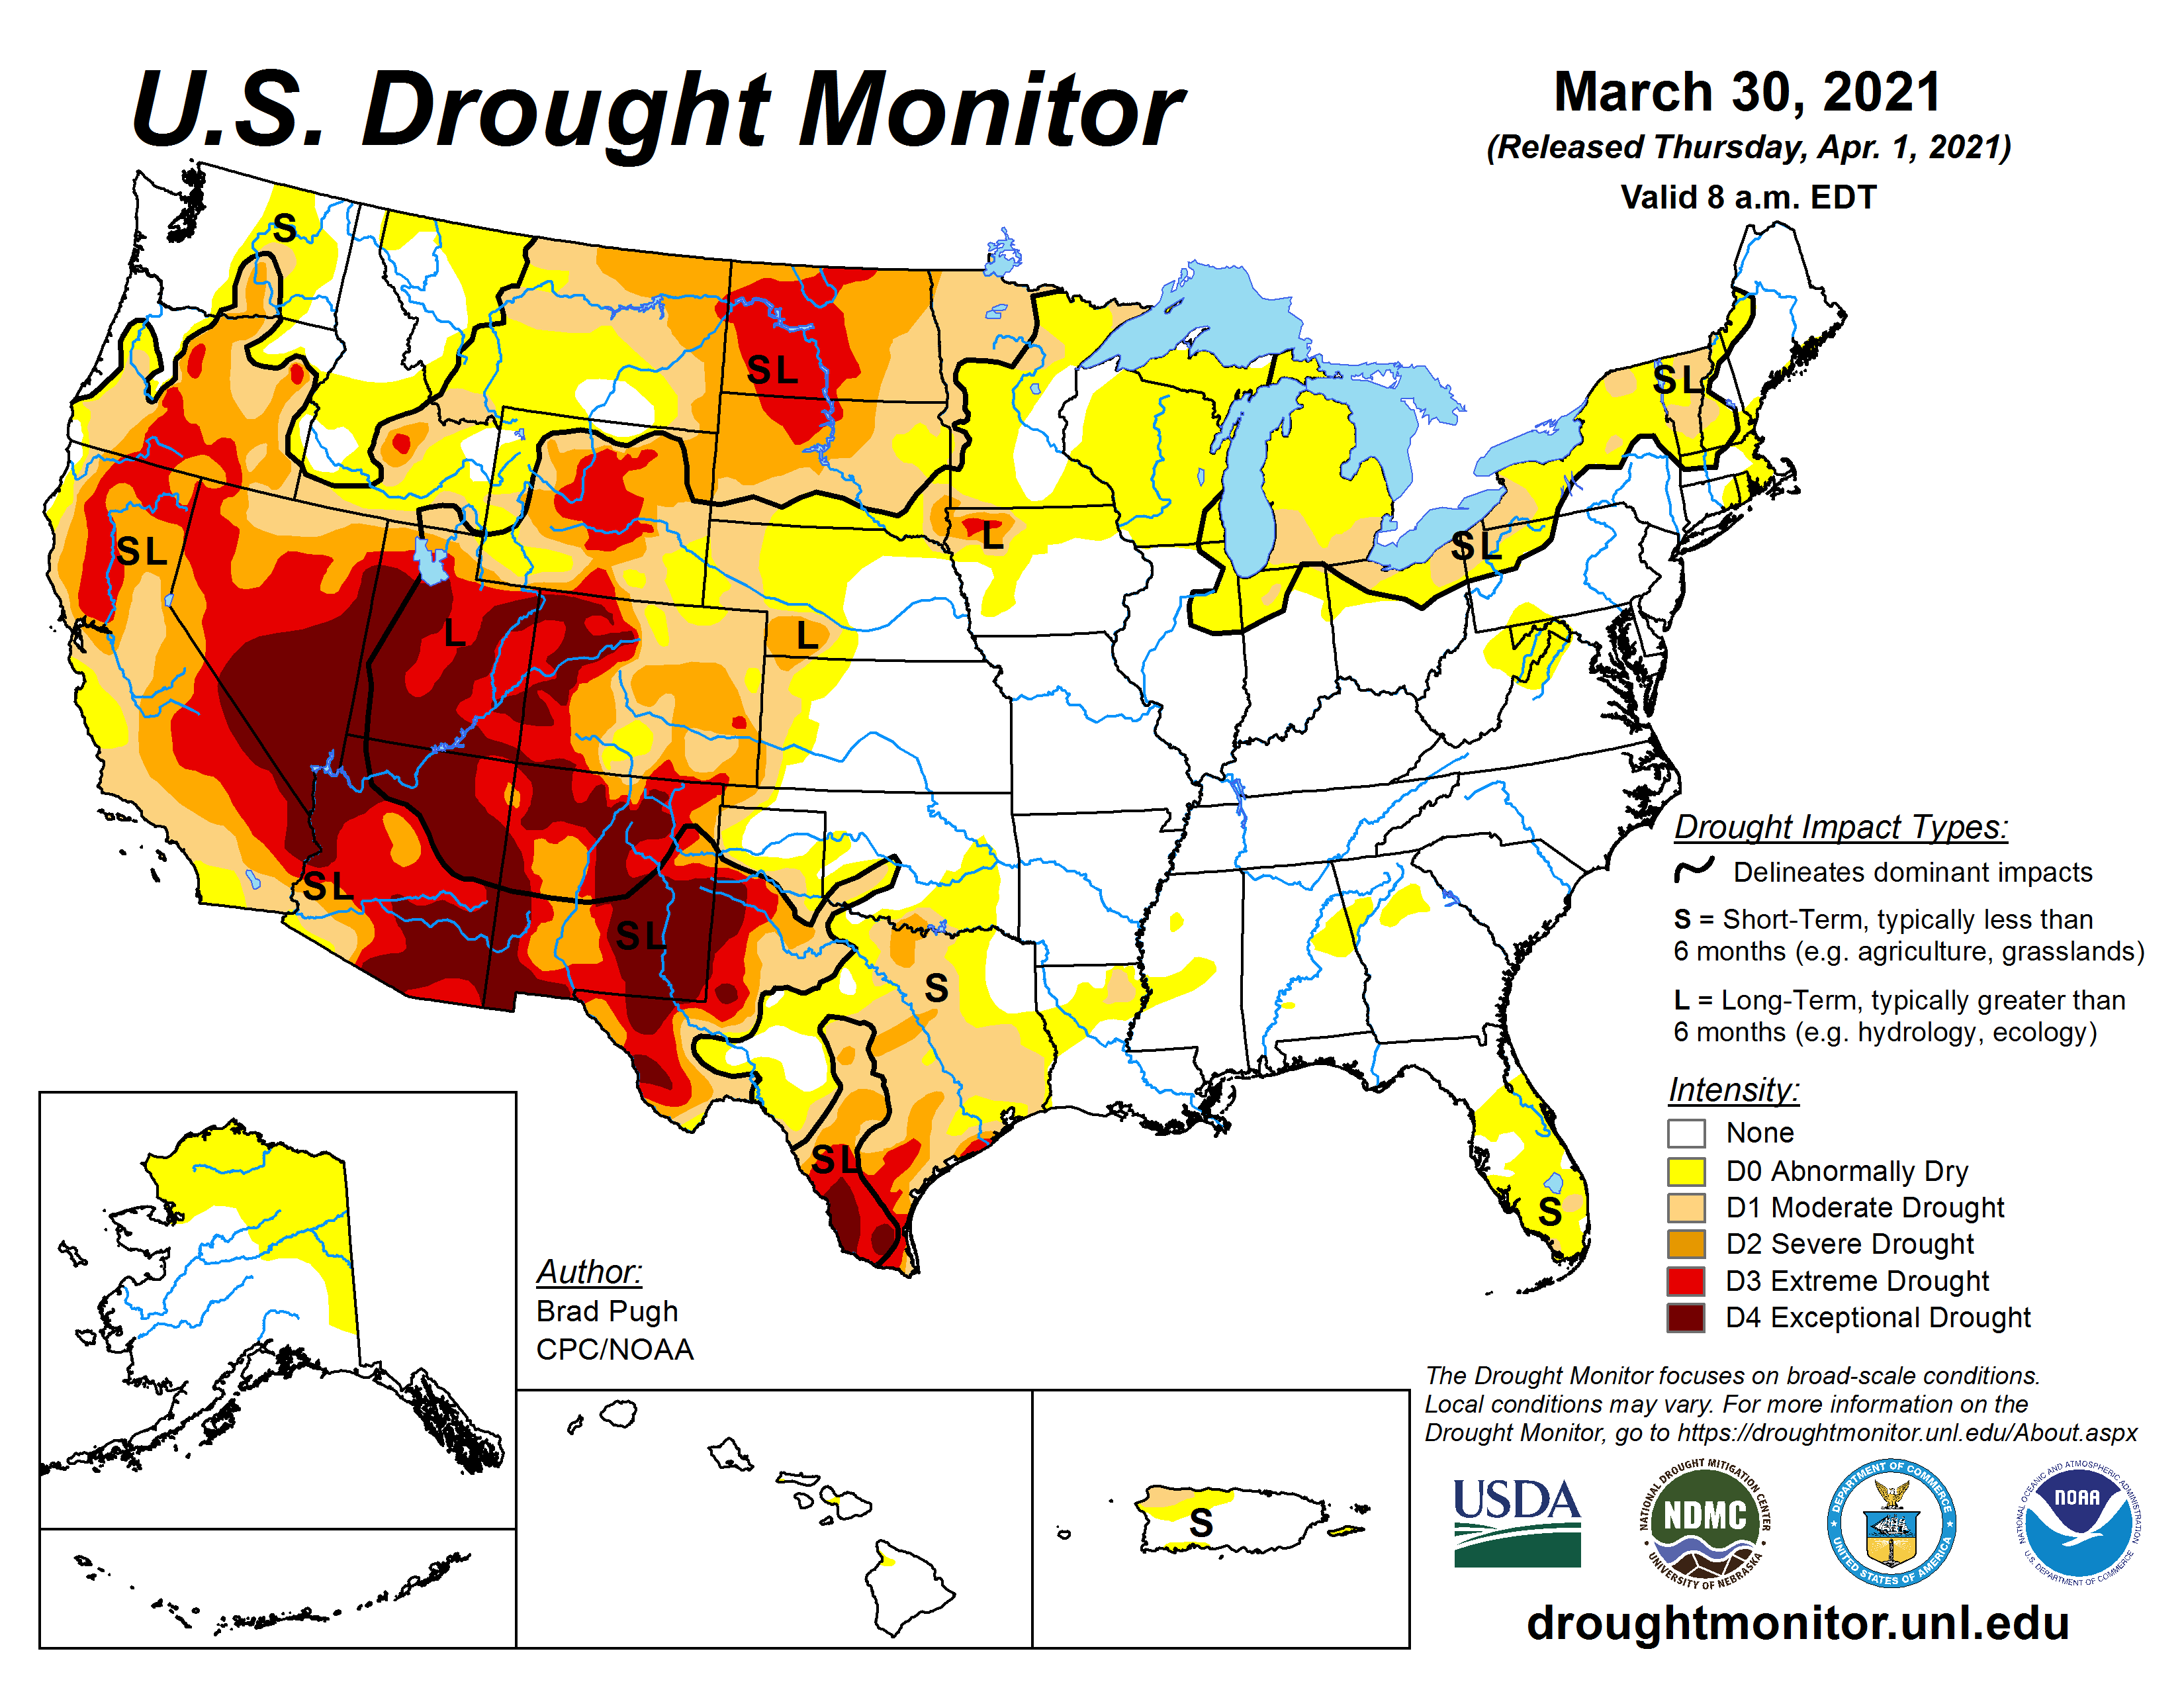
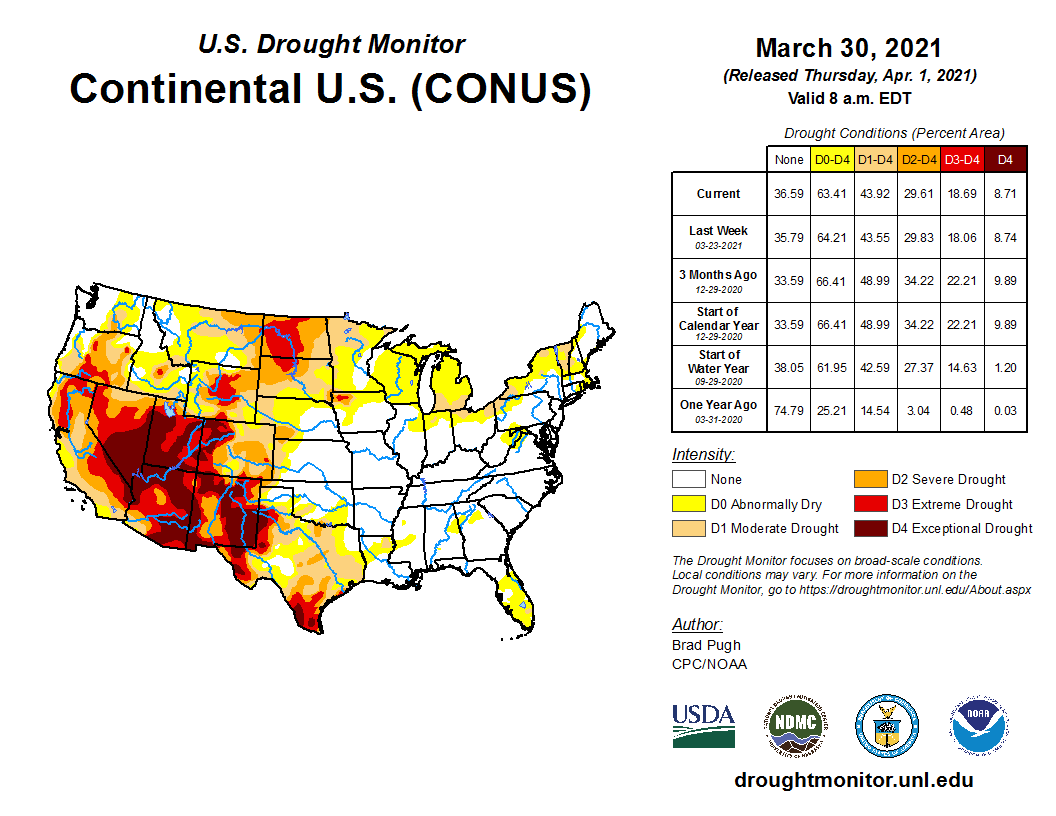
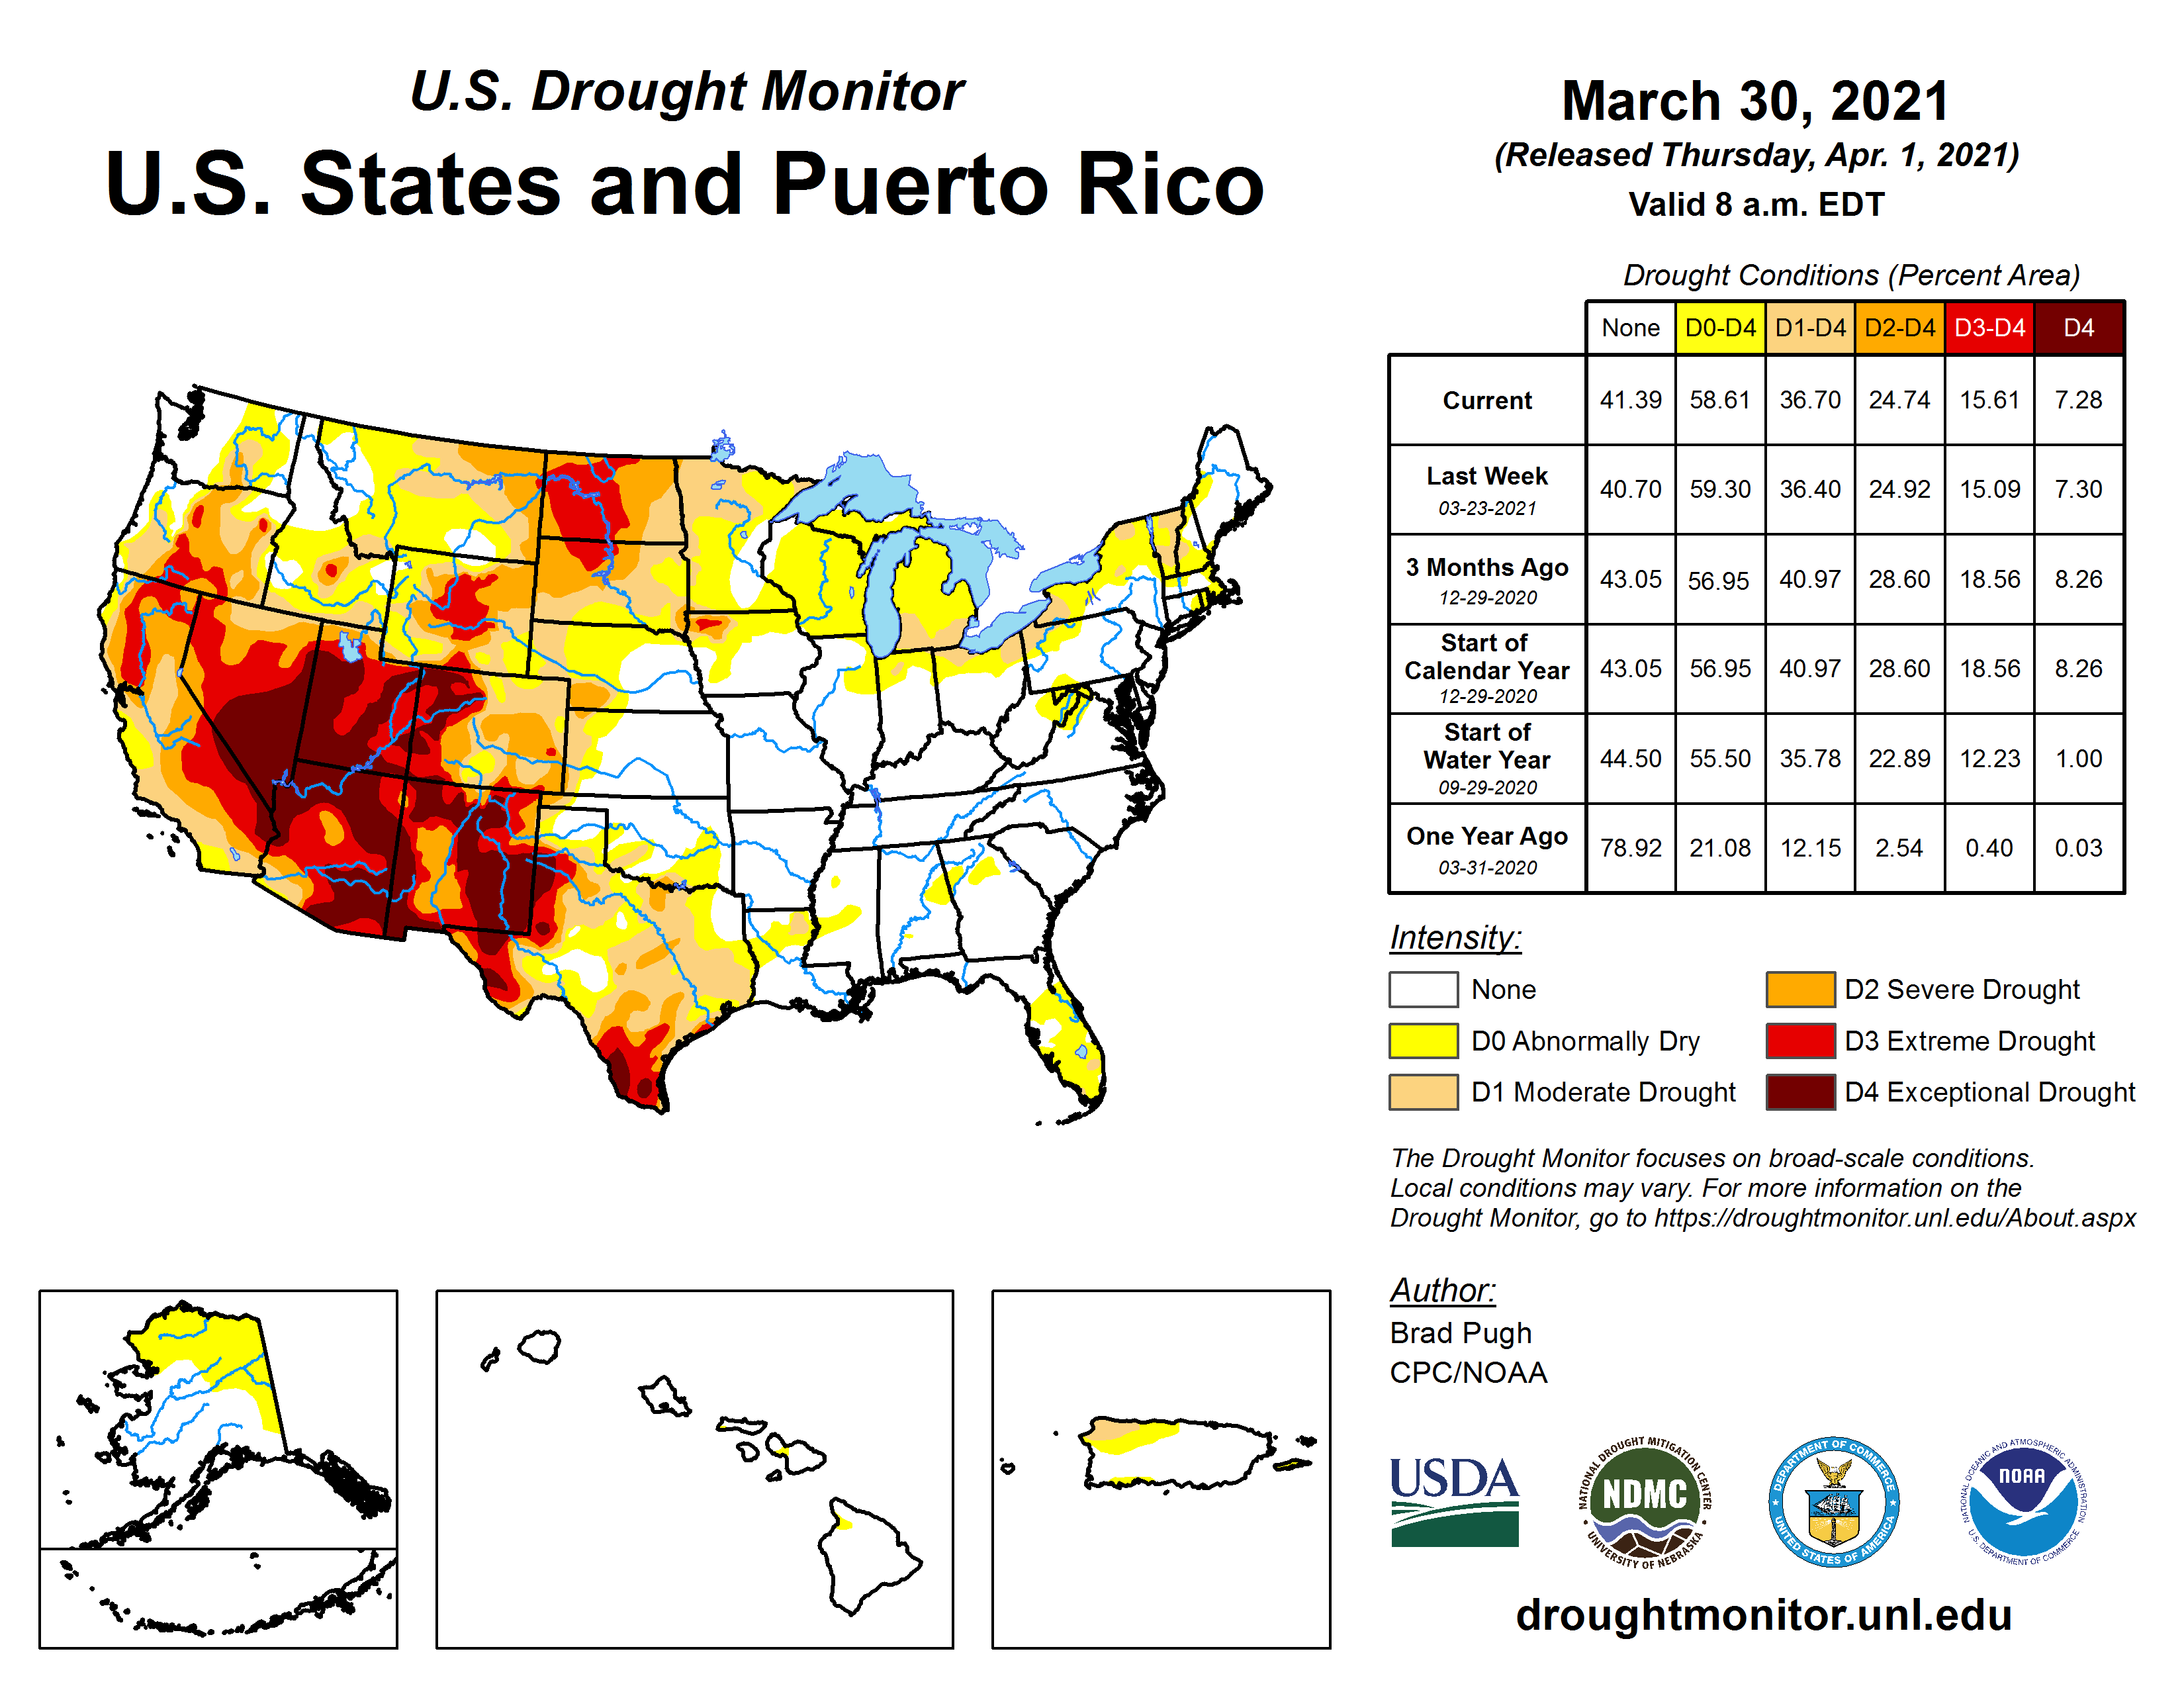
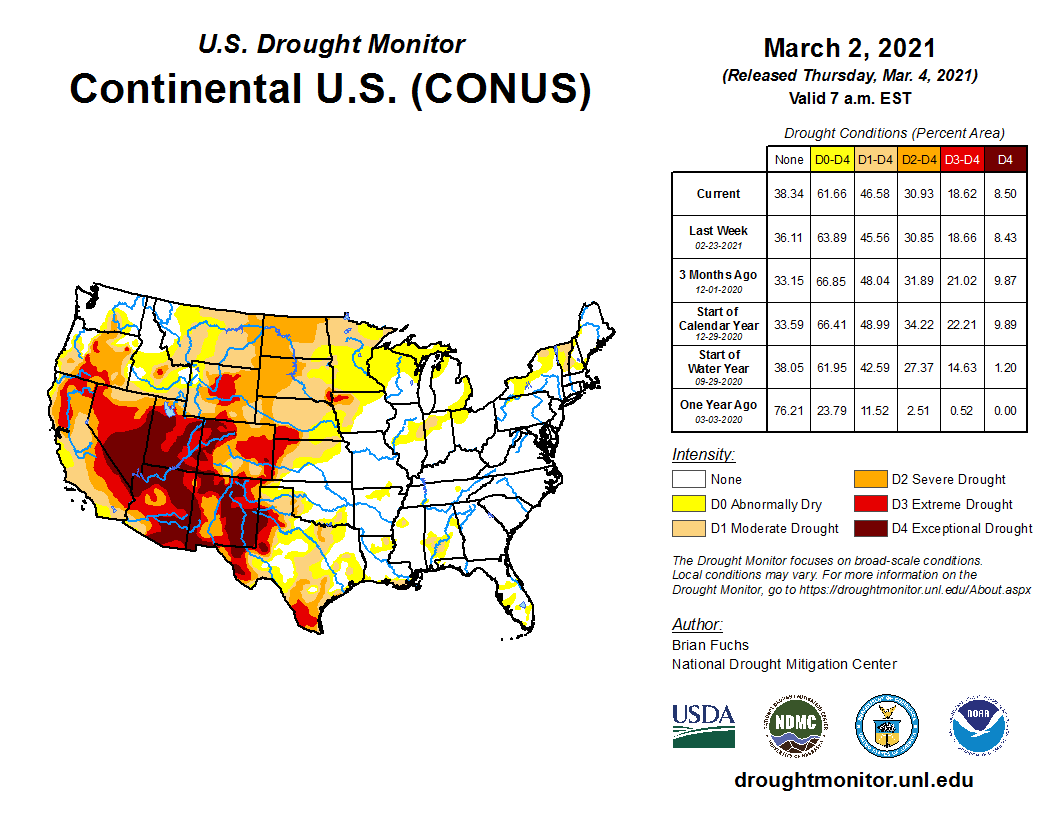
- According to the weekly U.S. Drought Monitor (USDM), as of March 30, 2021, 43.92% of the contiguous U.S. (CONUS) (36.7% of the U.S. including Alaska, Hawaii, and Puerto Rico) was classified as experiencing moderate to exceptional (D1-D4) drought.
Detailed Drought Overview
Longwave and shortwave troughs dominated the atmospheric circulation over North America during much of March 2021. The troughs tended to move through the Southwest on their trek across the CONUS in the vigorous westerly flow, while ridges dominated the northern Plains to East Coast for much of the month — this pattern was reflected in the mean monthly upper-level flow. It was also reflected in the monthly temperature anomalies, with colder-than-normal temperatures over the West (especially the Southwest) and warmer-than-normal temperatures east of the Rockies (especially in the northern Plains to Great Lakes). Pacific weather systems were directed eastward by the upper-level flow. They brought rain and snow to parts of the West, but precipitation amounts were generally below normal. Once they reached the Plains, the fronts and low pressure systems tapped Gulf of Mexico moisture to spread above-normal precipitation across the central Plains to Mississippi, Ohio, and Tennessee River Valleys, as well as parts of Alabama and Mississippi. But below-normal precipitation dominated the rest of the country, especially in the northern and southern Plains, Northeast, and Florida, in addition to parts of the West.
The combination of warmer- and drier-than-normal conditions contributed to enhanced evapotranspiration in the northern Plains to Northeast and parts of the western Texas and Florida, while the colder-than-normal weather resulted in reduced evapotranspiration in parts of the West. Streamflow and groundwater continued below normal across much of the West and parts of the Great Lakes, Northeast, Texas, and North Dakota. Soils were drier than normal across much of these same areas (SMOS satellite observations; SPoRT satellite-based observations for 0-10 cm [0-4 inches] depth, 0-40 cm [0-16 inches] depth, 0-100 cm [0-39 inches] depth, 0-200 cm [0-79 inches] depth; GRACE satellite-based observations for surface and root zone soil moisture; the USDA Crop Condition and Soil Moisture Analytics [CASMA] soil moisture anomaly and categorical products and field observations of topsoil moisture; the VegDRI and QuickDRI products; and CPC, Leaky Bucket, NLDAS, and VIC models). Large wildfires burned throughout the month in parts of the Plains, especially in the southern Plains (wildfire maps for March 1, 15, 20, and 31; KBDI and Fire Danger maps for the end of the month), with total acreage burned for the year to date of about 227 thousand acres, which is below average.
Reports received through the Condition Monitoring Observer Reports (CMOR) system included drought impacts to ranching operations in the West and farming and ranching operations, as well as fire concerns, in the northern Plains. Low stock pond water, poor quality water, and hay shortages are concerns for cattle producers. Little to no soil moisture worries farmers and ranchers in North Dakota and Kansas. Blowing dust is covering roads and fields in North Dakota. Other reports relayed from the National Drought Mitigation Center included low reservoirs and expectation of reduced water deliveries in California. Utah Governor Spencer Cox signed an emergency order March 17 declaring a state of emergency due to drought conditions. South Dakota Governor Kristi Noem signed an executive order, due to severe drought and numerous wildfires in the state, with the state of emergency extending through June 1. North Dakota Governor Doug Burgum declared a statewide fire emergency on April 1, due to drought. Declining groundwater levels are a concern for crop producers in Texas. New Hampshire officials warned the public that water shortages may be in the offing as stream flows and precipitation remained low and never recovered to normal levels after drought in 2020, and more wells may fail in 2021 if dry conditions persist.
As a result of these conditions, drought or abnormal dryness contracted in the central Plains and parts of the Pacific Northwest, northern to central Rockies, Midwest, and Southeast. Drought or abnormal dryness expanded or intensified in other parts of the Northwest; parts of the Southwest, Southeast, and Northeast; and much of the northern and southern Plains and Great Lakes. Drought contraction exceeded expansion with the USDM-based national moderate-to-exceptional drought footprint across the CONUS falling from 46.6 percent at the end of February to 43.9 percent at the end of March (from 39.0 percent to 36.7 percent for the 50 States and Puerto Rico). According to the Palmer Drought Index, which goes back to the beginning of the 20th century, about 39.4 percent of the CONUS was in moderate to extreme drought at the end of March, an increase compared to the end of February. The percent area of the CONUS in moderate to extreme drought has hovered between 35 and 40 percent for the last seven months (since September 2020).

Drought conditions at the end of March, as depicted on the March 30, 2021 USDM map, included the following core drought and abnormally dry areas:

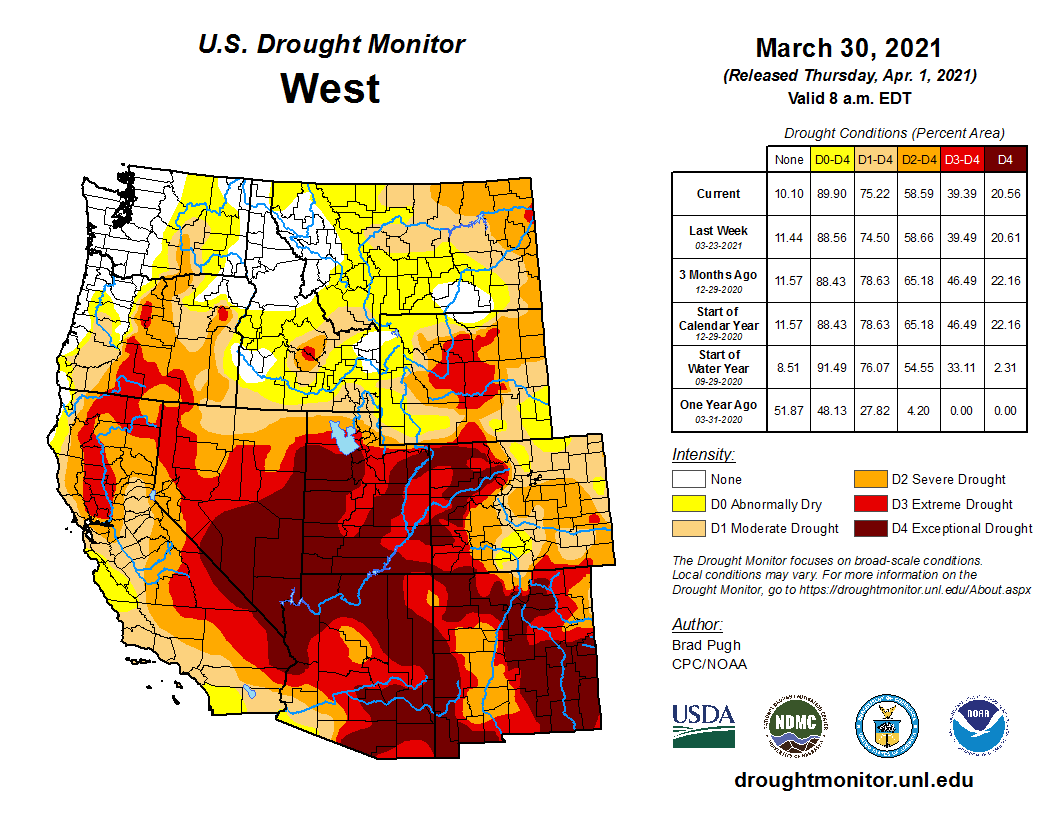
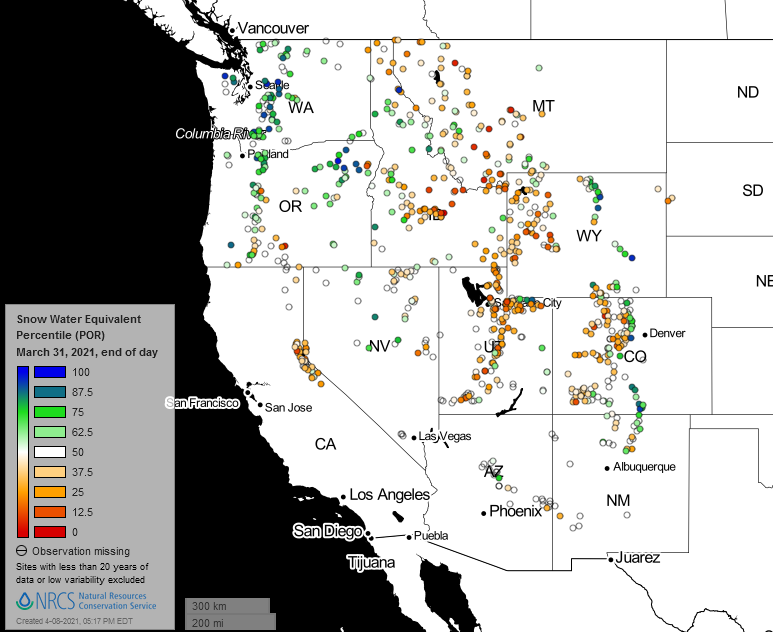
- Moderate (D1) to extreme (D3) drought extended from the West Coast to Rocky Mountains and into the adjacent High Plains, with a large area of exceptional (D4) drought across the Southwest to southern High Plains. The percent area of the West experiencing moderate to exceptional drought, according to USDM statistics, decreased slightly from 79.9 percent at the end of February to 75.2 percent at the end of March. The percent area of the West (from the Rockies to the West Coast) in moderate to extreme drought (based on the Palmer Drought Index) increased slightly to about 83.6 percent. March was near to wetter than normal in parts of the central Rockies to intermountain basin, and drier than normal almost everywhere else in the West. This is evident in low elevation station precipitation data as well as high elevation (SNOTEL) precipitation data. Western snow cover was below average for the month, but mountain snow water equivalent (SWE) was above normal in the Pacific Northwest and some Rocky Mountain locations, and below normal in most southern locations to the northern Rockies. For the water year-to-date (October 1, 2020-March 31, 2021), most areas were drier than normal with some wetter-than-normal areas in the north.
- Drought expanded or intensified in the northern Plains, contracted in the central Plains, and mostly expanded in the southern Plains. Moderate to exceptional drought covered more than half of the central to northern Plains at the end of March, shrinking to 63.8 percent of the region, while moderate to exceptional drought expanded overall in the southern Plains to Lower Mississippi Valley to about 36.7 percent of the region.
- In the Midwest, drought and abnormal dryness expanded in the Great Lakes. Moderate to extreme drought continued in northwestern Iowa, with areas of moderate drought in Minnesota and the southern Great Lakes.
- Abnormal dryness and moderate drought expanded in the Northeast.
- In the Southeast, abnormal dryness and moderate drought shrank in Alabama but expanded in Florida.
- In the U.S.-Affiliated Pacific Islands (USAPI), wetter-than-normal weather during March improved conditions in the southern Marshall Islands and parts of the Federated States of Micronesia, but drier-than-normal conditions continued in the Marianas and northern Marshalls. Drought conditions worsened at Saipan (to moderate drought) and Wotje (to extreme drought), but improved at Guam and Rota (to abnormally dry conditions), Kwajalein (to moderate drought), Kapingamarangi (to severe drought), and Majuro, Fananu and Jaluit (drought and abnormal dryness ending).
- Moderate drought shrank in northern parts of Puerto Rico, halving in size to 8.0 percent of the island, but intensified in the northern U.S. Virgin Islands (USVI) at Saint Thomas and Saint John (to severe drought), and continued in the south at Saint Croix (moderate drought).
- Abnormal dryness expanded to cover 34.7 percent of Alaska.
- Drought disappeared in Hawaii, with only a few areas abnormally dry.
Palmer Drought Index
The Palmer drought indices measure the balance between moisture demand (evapotranspiration driven by temperature) and moisture supply (precipitation). The Palmer Z Index depicts moisture conditions for the current month, while the Palmer Hydrological Drought Index (PHDI) and Palmer Drought Severity Index (PDSI) depict the current month's cumulative moisture conditions integrated over the last several months. While both the PDSI and PHDI indices show long-term moisture conditions, the PDSI depicts meteorological drought while the PHDI depicts hydrological drought. The PDSI map may show less severe and extensive drought (as well as wet spell conditions) in some parts of the country than the PHDI map because the meteorological conditions that produce drought and wet spell conditions are not as long-lasting as the hydrological impacts.
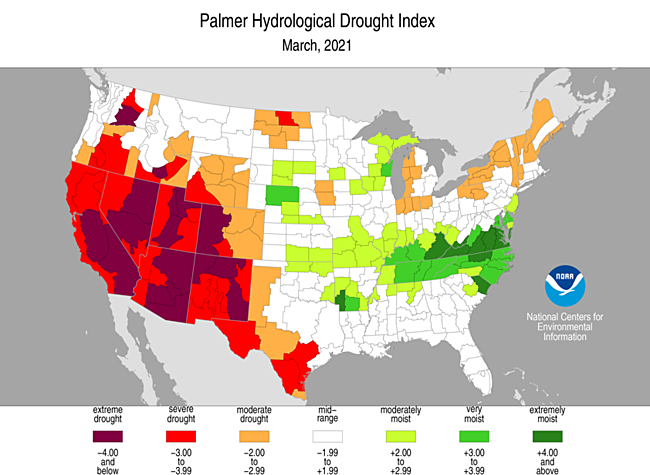
Used together, the Palmer Z Index and PHDI maps show that short-term drought occurred across the Pacific Northwest to northern Plains, eastern Great Lakes to Northeast, California, and along the U.S.-Mexican border, expanding and intensifying long-term dry conditions in these areas (PHDI maps for March compared to February). Short-term drought occurred along the Carolina coast, reducing the intensity of long-term wet conditions. Short-term wet conditions in the central Plains shrank or reduced the intensity of drought there, and in the Tennessee Valley expanded or intensified long-term wet conditions in that region.
Standardized Precipitation Index
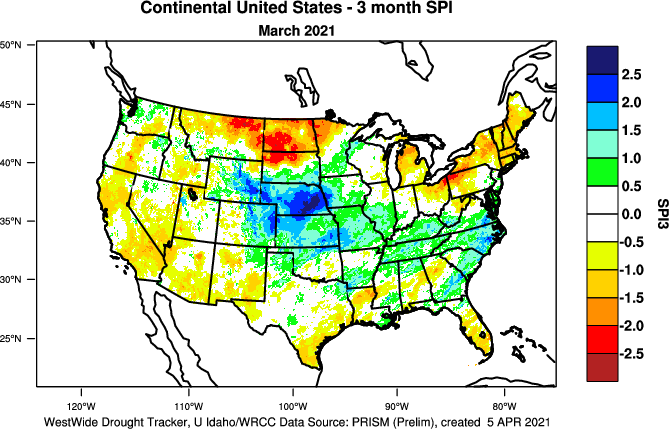
The Standardized Precipitation Index (SPI) measures moisture supply. The SPI maps here show the spatial extent of anomalously wet and dry areas at time scales ranging from 1 month to 24 months.


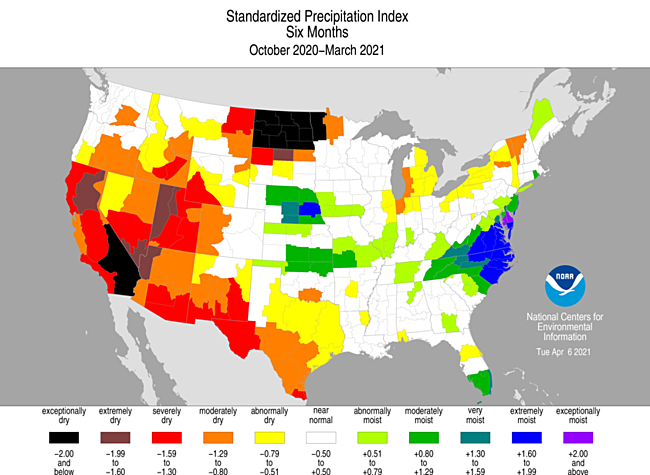
The SPI maps illustrate how moisture conditions have varied considerably through time and space over the last two years. Dry conditions dominate the northern Plains at the 1- to 12-month time scales, parts of the Great Lakes at the 1- to 9-month time scales, and much of Florida at 1 and 3 months. Most of the Northeast is dry at 1 to 3 months and parts are dry at 6 to 12 months. Most of the northern Rockies and Pacific Northwest is dry at 1 and 9 months, and parts of the region are dry at the other time scales. California and the states along the Mexican border are dry at all time scales, with dryness spreading across the intermountain basin and to the Rockies at the 6- to 24-month time scales. Dryness is evident in northwest Iowa at 9 to 12 months. Wet conditions dominate the central Plains to Tennessee Valley at the 1- to 3-month time scales, with some wetness evident at 6 to 9 months. Wet conditions dominate the Mid-Atlantic coast from 2 to 12 months, and the Southeast at 9 to 12 months, with wet conditions covering most of the CONUS east of the Rockies at 24 months.


Standardized Precipitation Evapotranspiration Index
The SPI measures water supply (precipitation), while the SPEI (Standardized Precipitation Evapotranspiration Index) measures the combination of water supply (precipitation) and water demand (evapotranspiration as computed from temperature). Warmer temperatures tend to increase evapotranspiration, which generally makes droughts more intense.


March is the first month of spring, which is the transition season from winter (when evapotranspiration is minimal) to summer (when evapotranspiration reaches its annual maximum). During March 2021, temperatures were unusually warmer than normal east of the Rockies, especially in the northern Plains. This resulted in more extreme SPEI values than SPI values, centered in North Dakota (SPEI vs. SPI maps for March) (SPEI vs. SPI maps for the last 3 months) (SPEI vs. SPI maps for the last 6 months).


Temperatures have been much warmer than normal in the Southwest for much of the last one to 6 years. The excessive evapotranspiration, especially during the warm season, has contributed to more extreme SPEI values than SPI values for much of this period (SPEI maps for the last 12, 24, 36, 48, 60, 72 months) (SPI maps for the last 12, 24, 36, 48, 60, 72 months).
Regional Discussion
Hawaii


March 2021 was wetter than normal across the Hawaiian Islands. Wetter-than-normal conditions were evident at most locations for the last 2 to 3 months, with the number of drier-than-normal locations increasing at the 4- to 6-month time scales. Drier-than-normal conditions were widespread at 9 to 24 months, but the precipitation anomaly pattern was basically mixed from 9 to 60 months (last 1, 2, 3, 4, 6, 9, 12, 24, 36, 48, 60 months) (climate engine model percent of normal precipitation map for the last month). Monthly streamflow was near to above normal at gauges across the islands. The wet month eliminated drought with only a few areas of abnormal dryness remaining in Hawaii on the March 30th USDM map.
Alaska

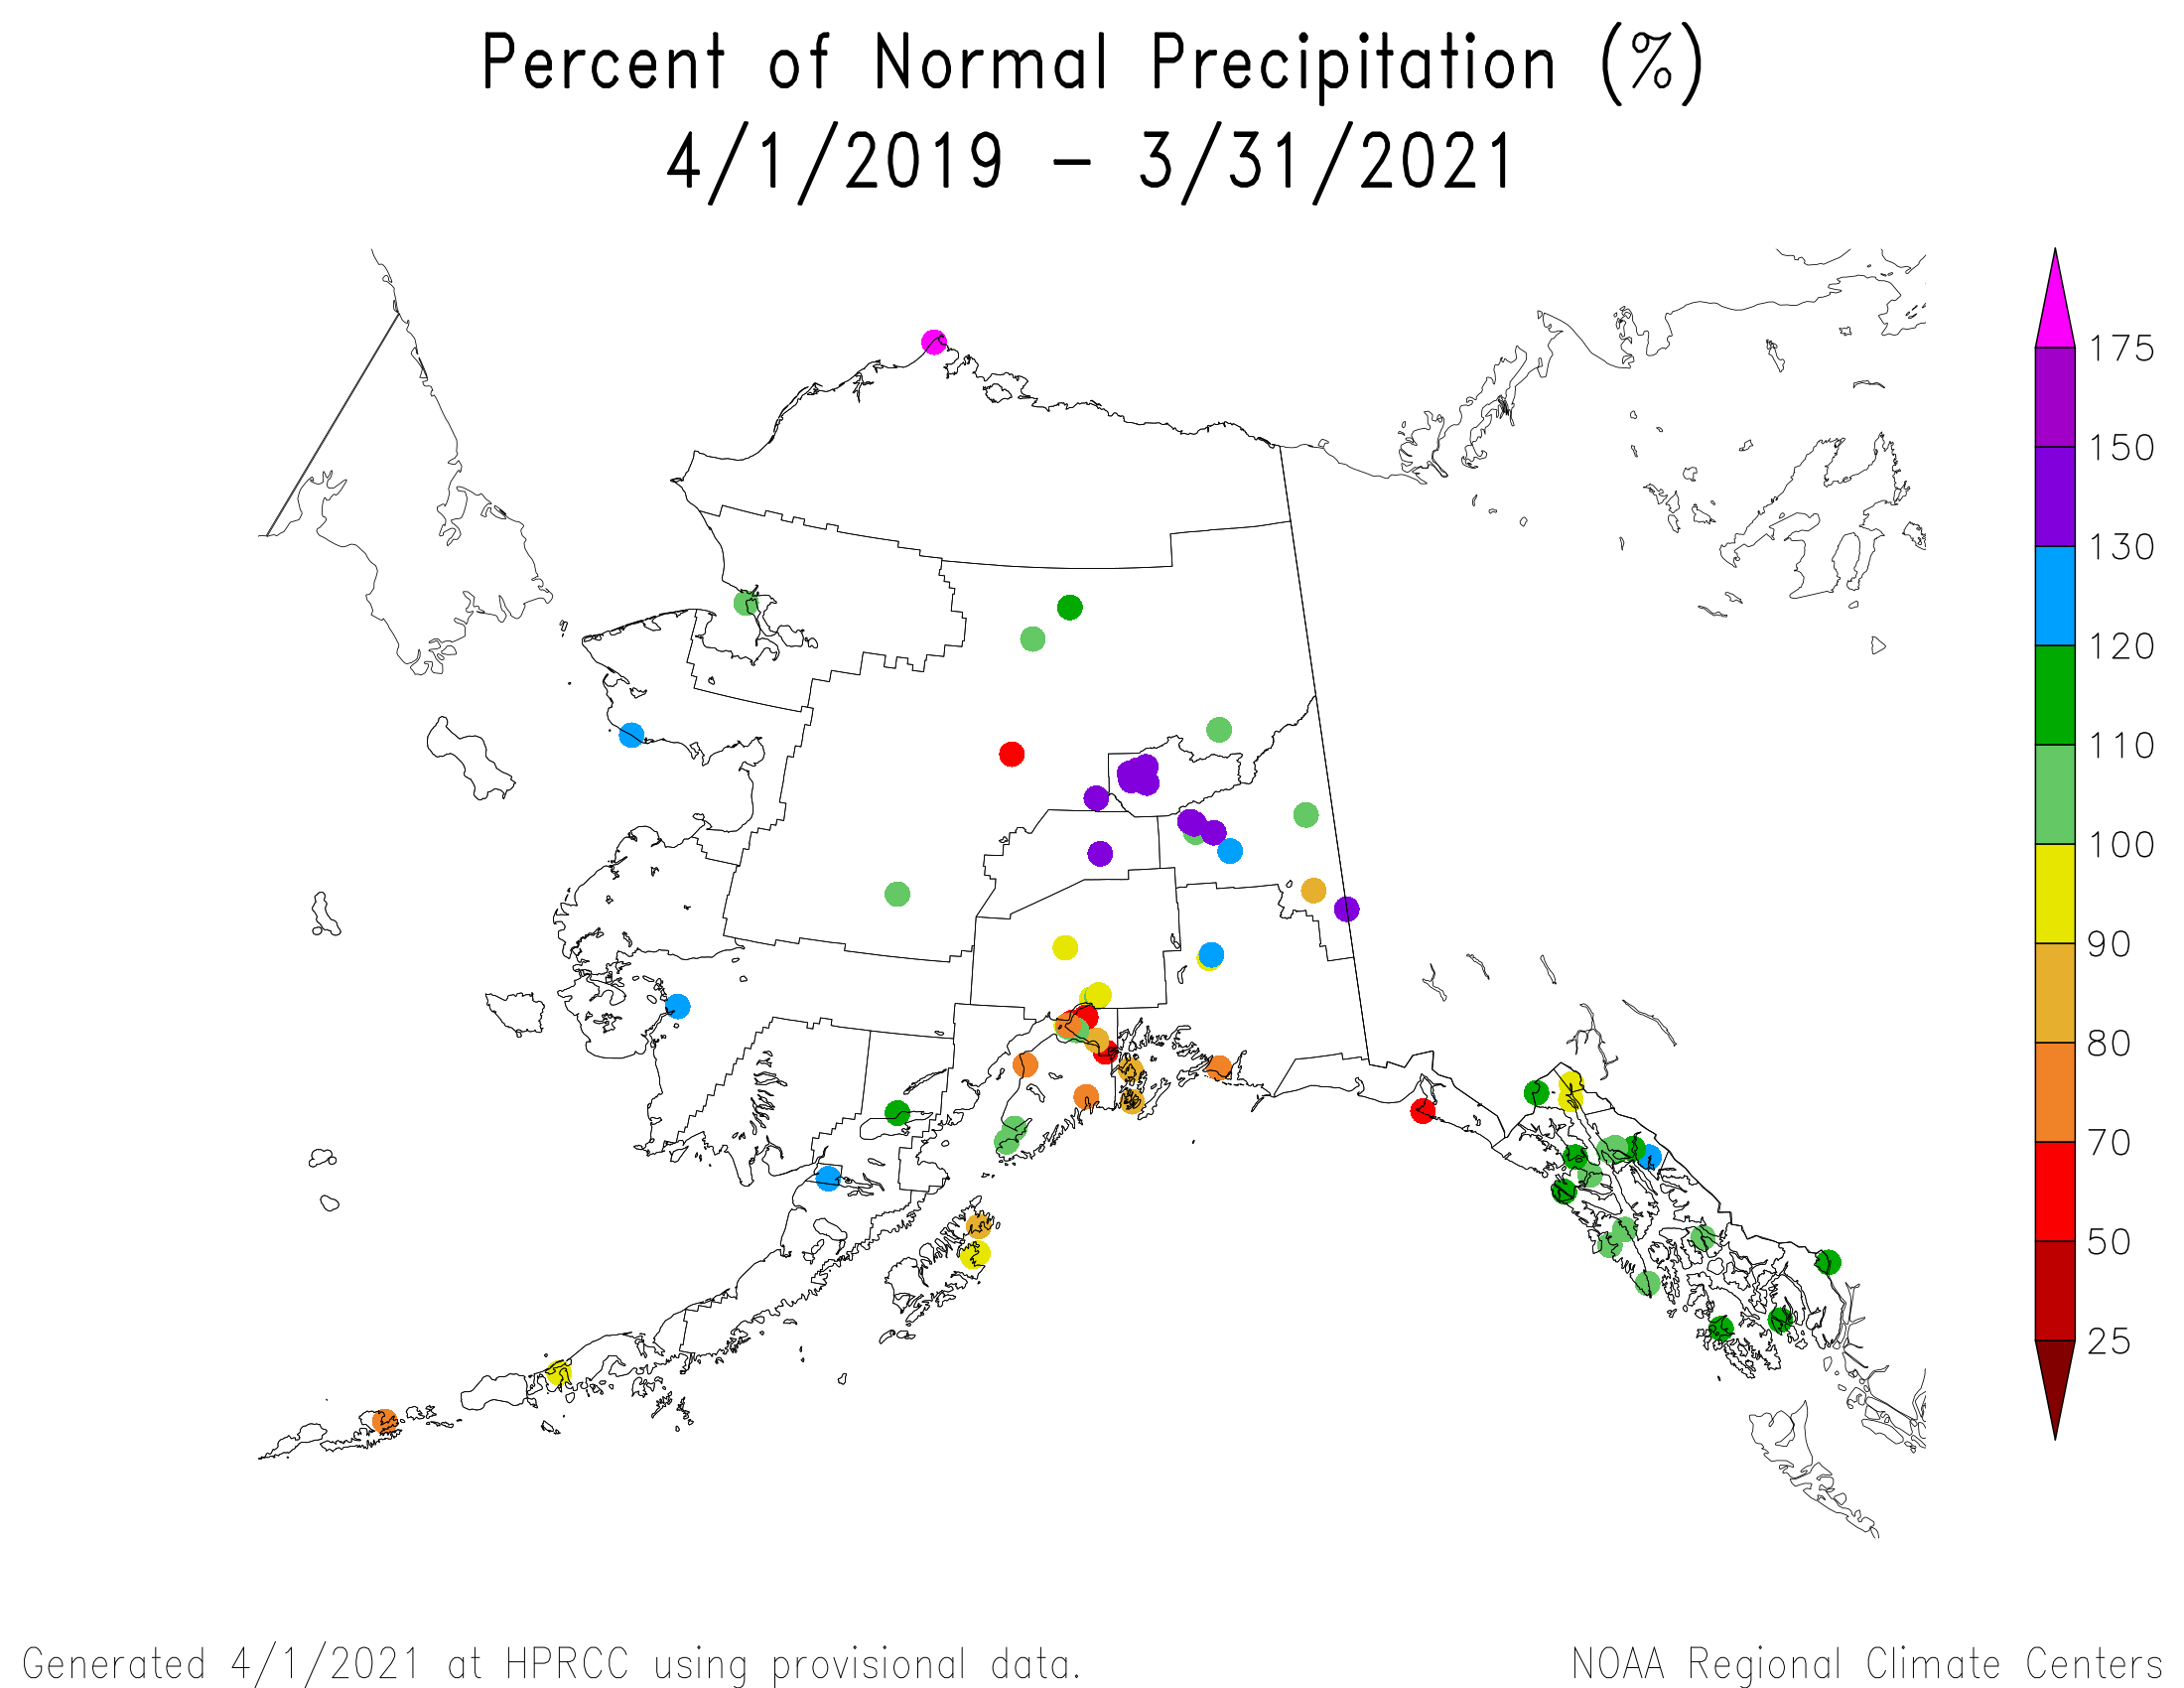
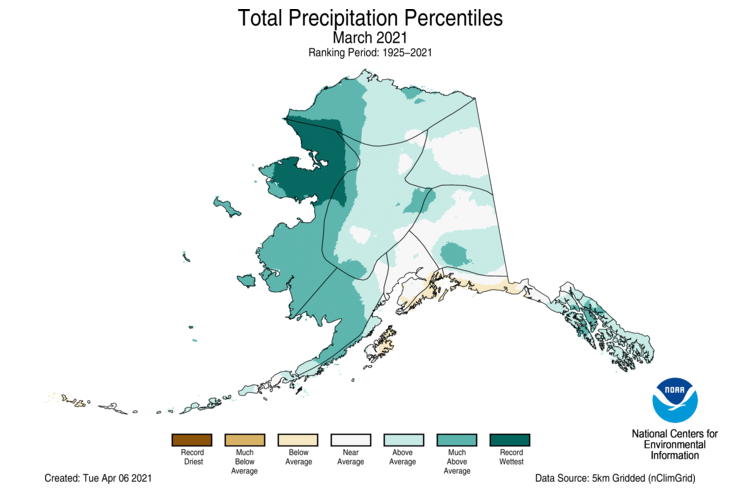
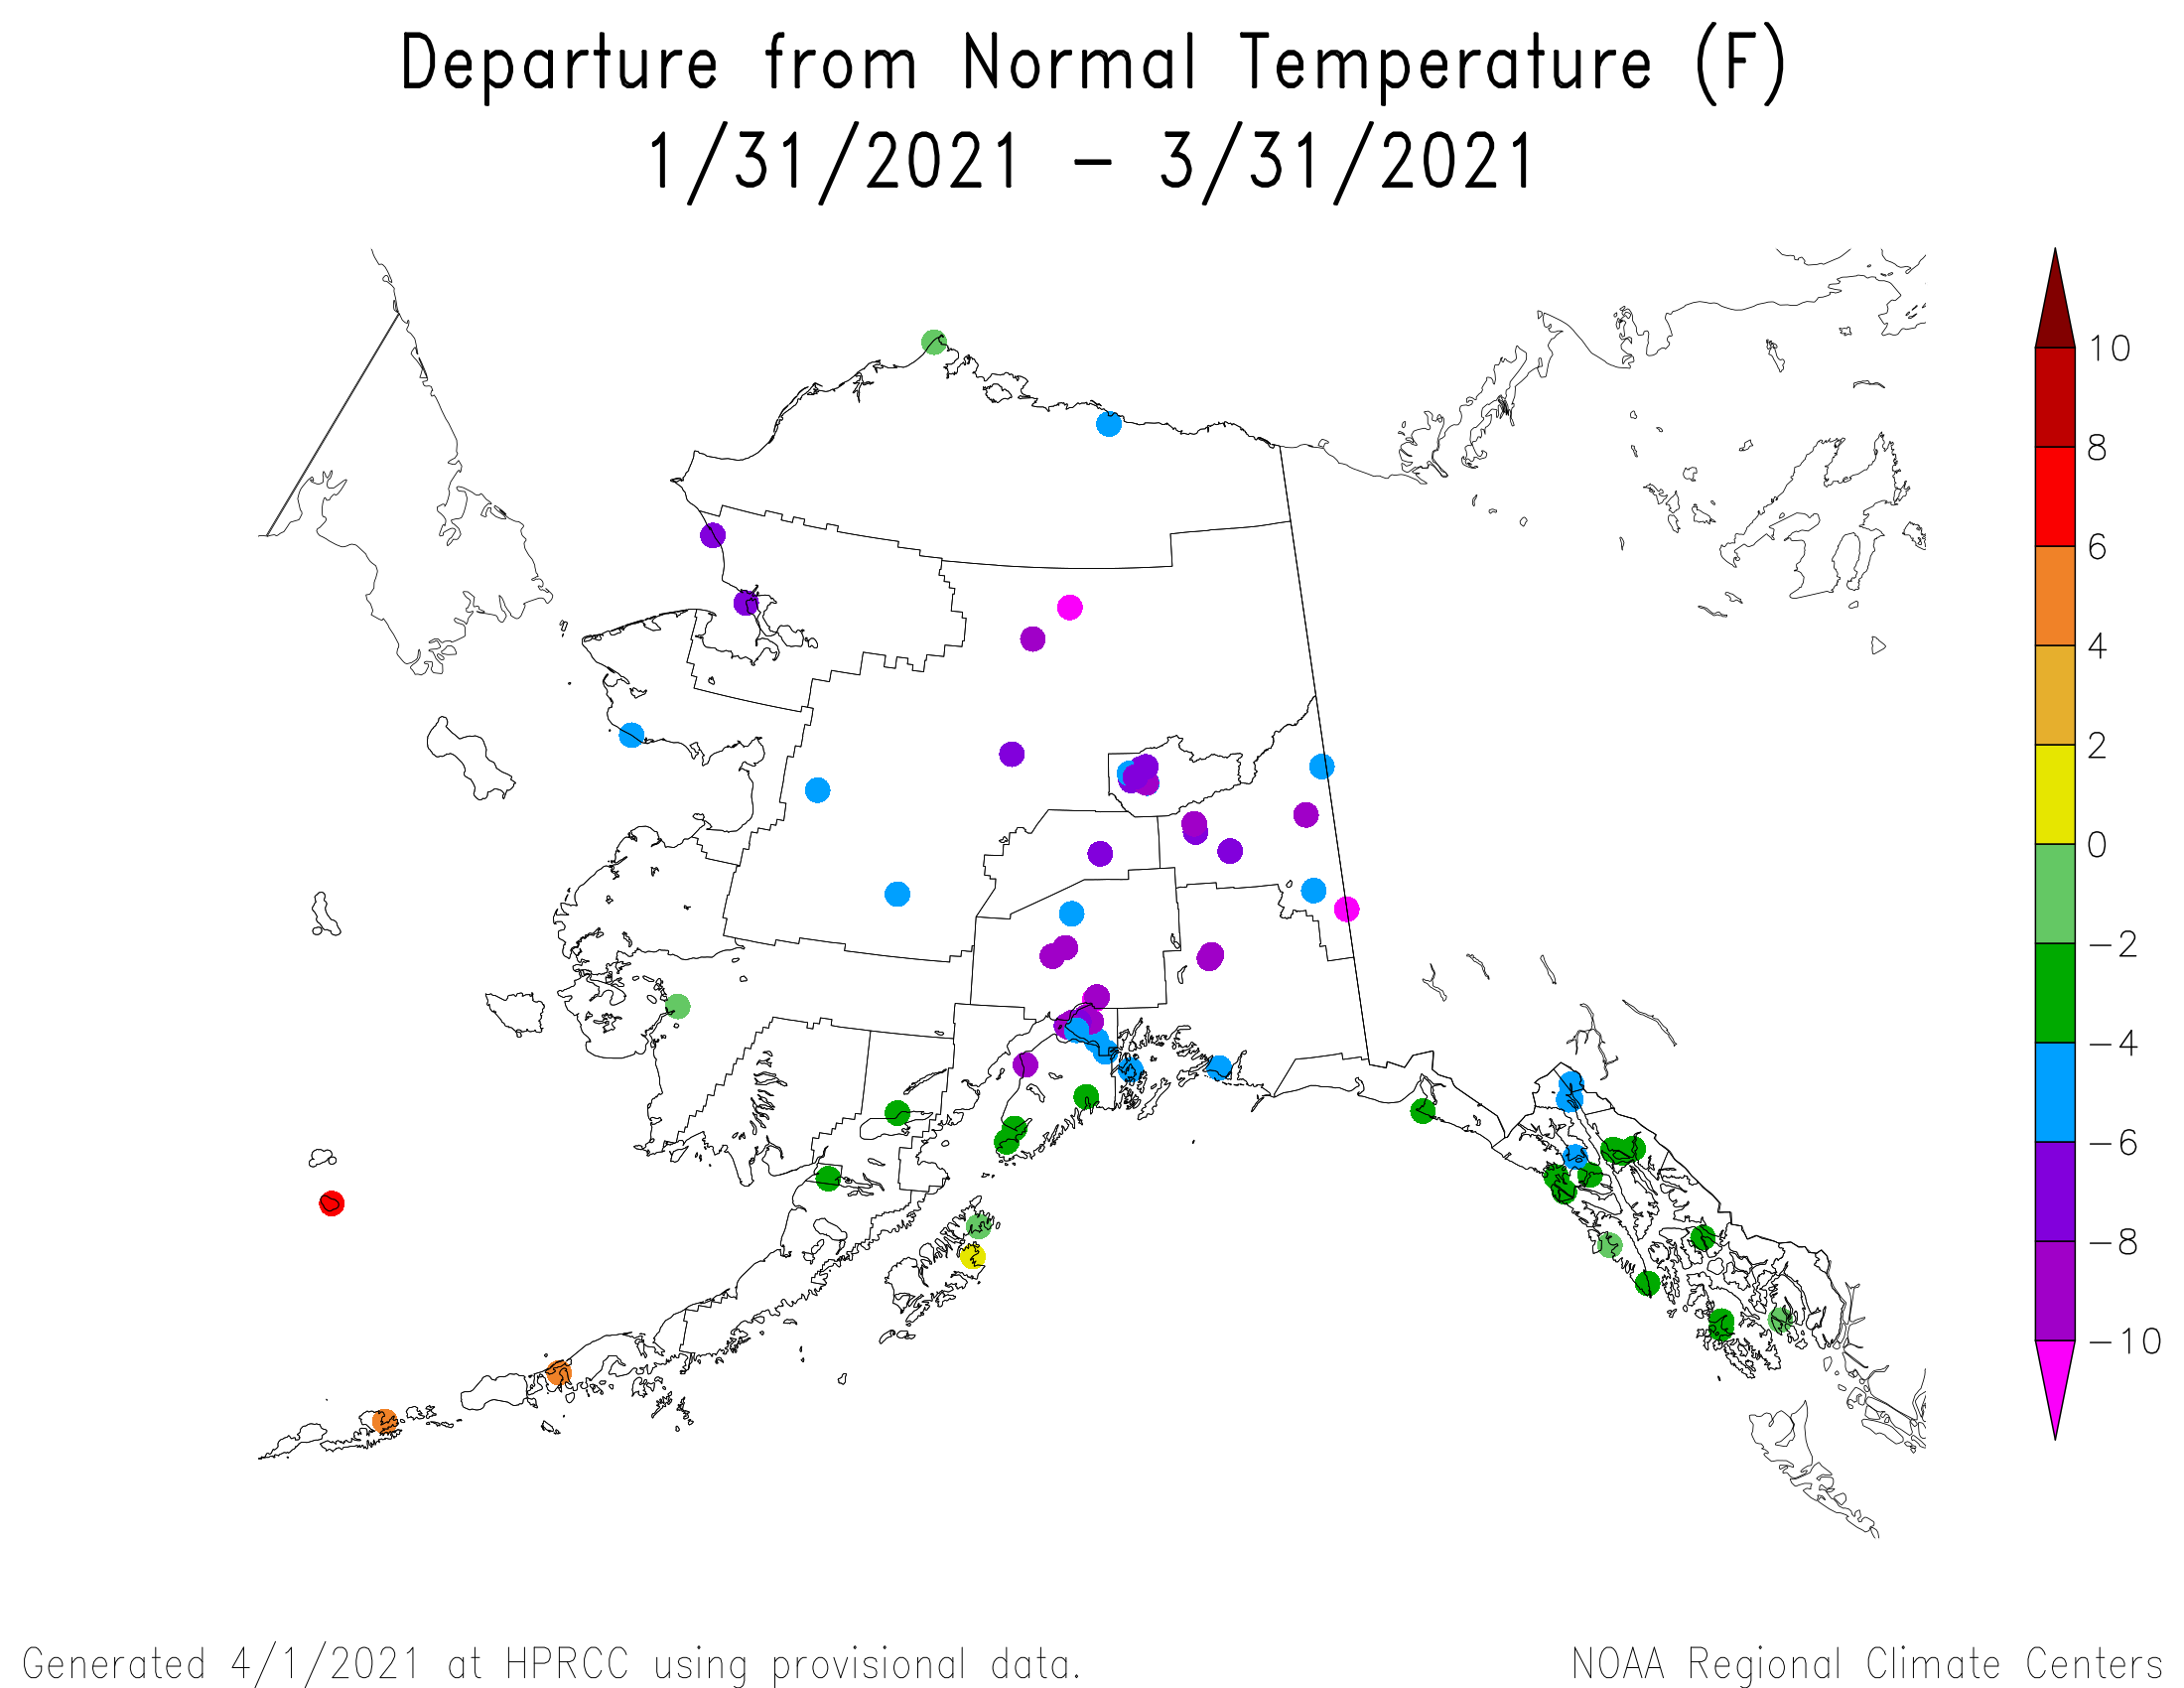
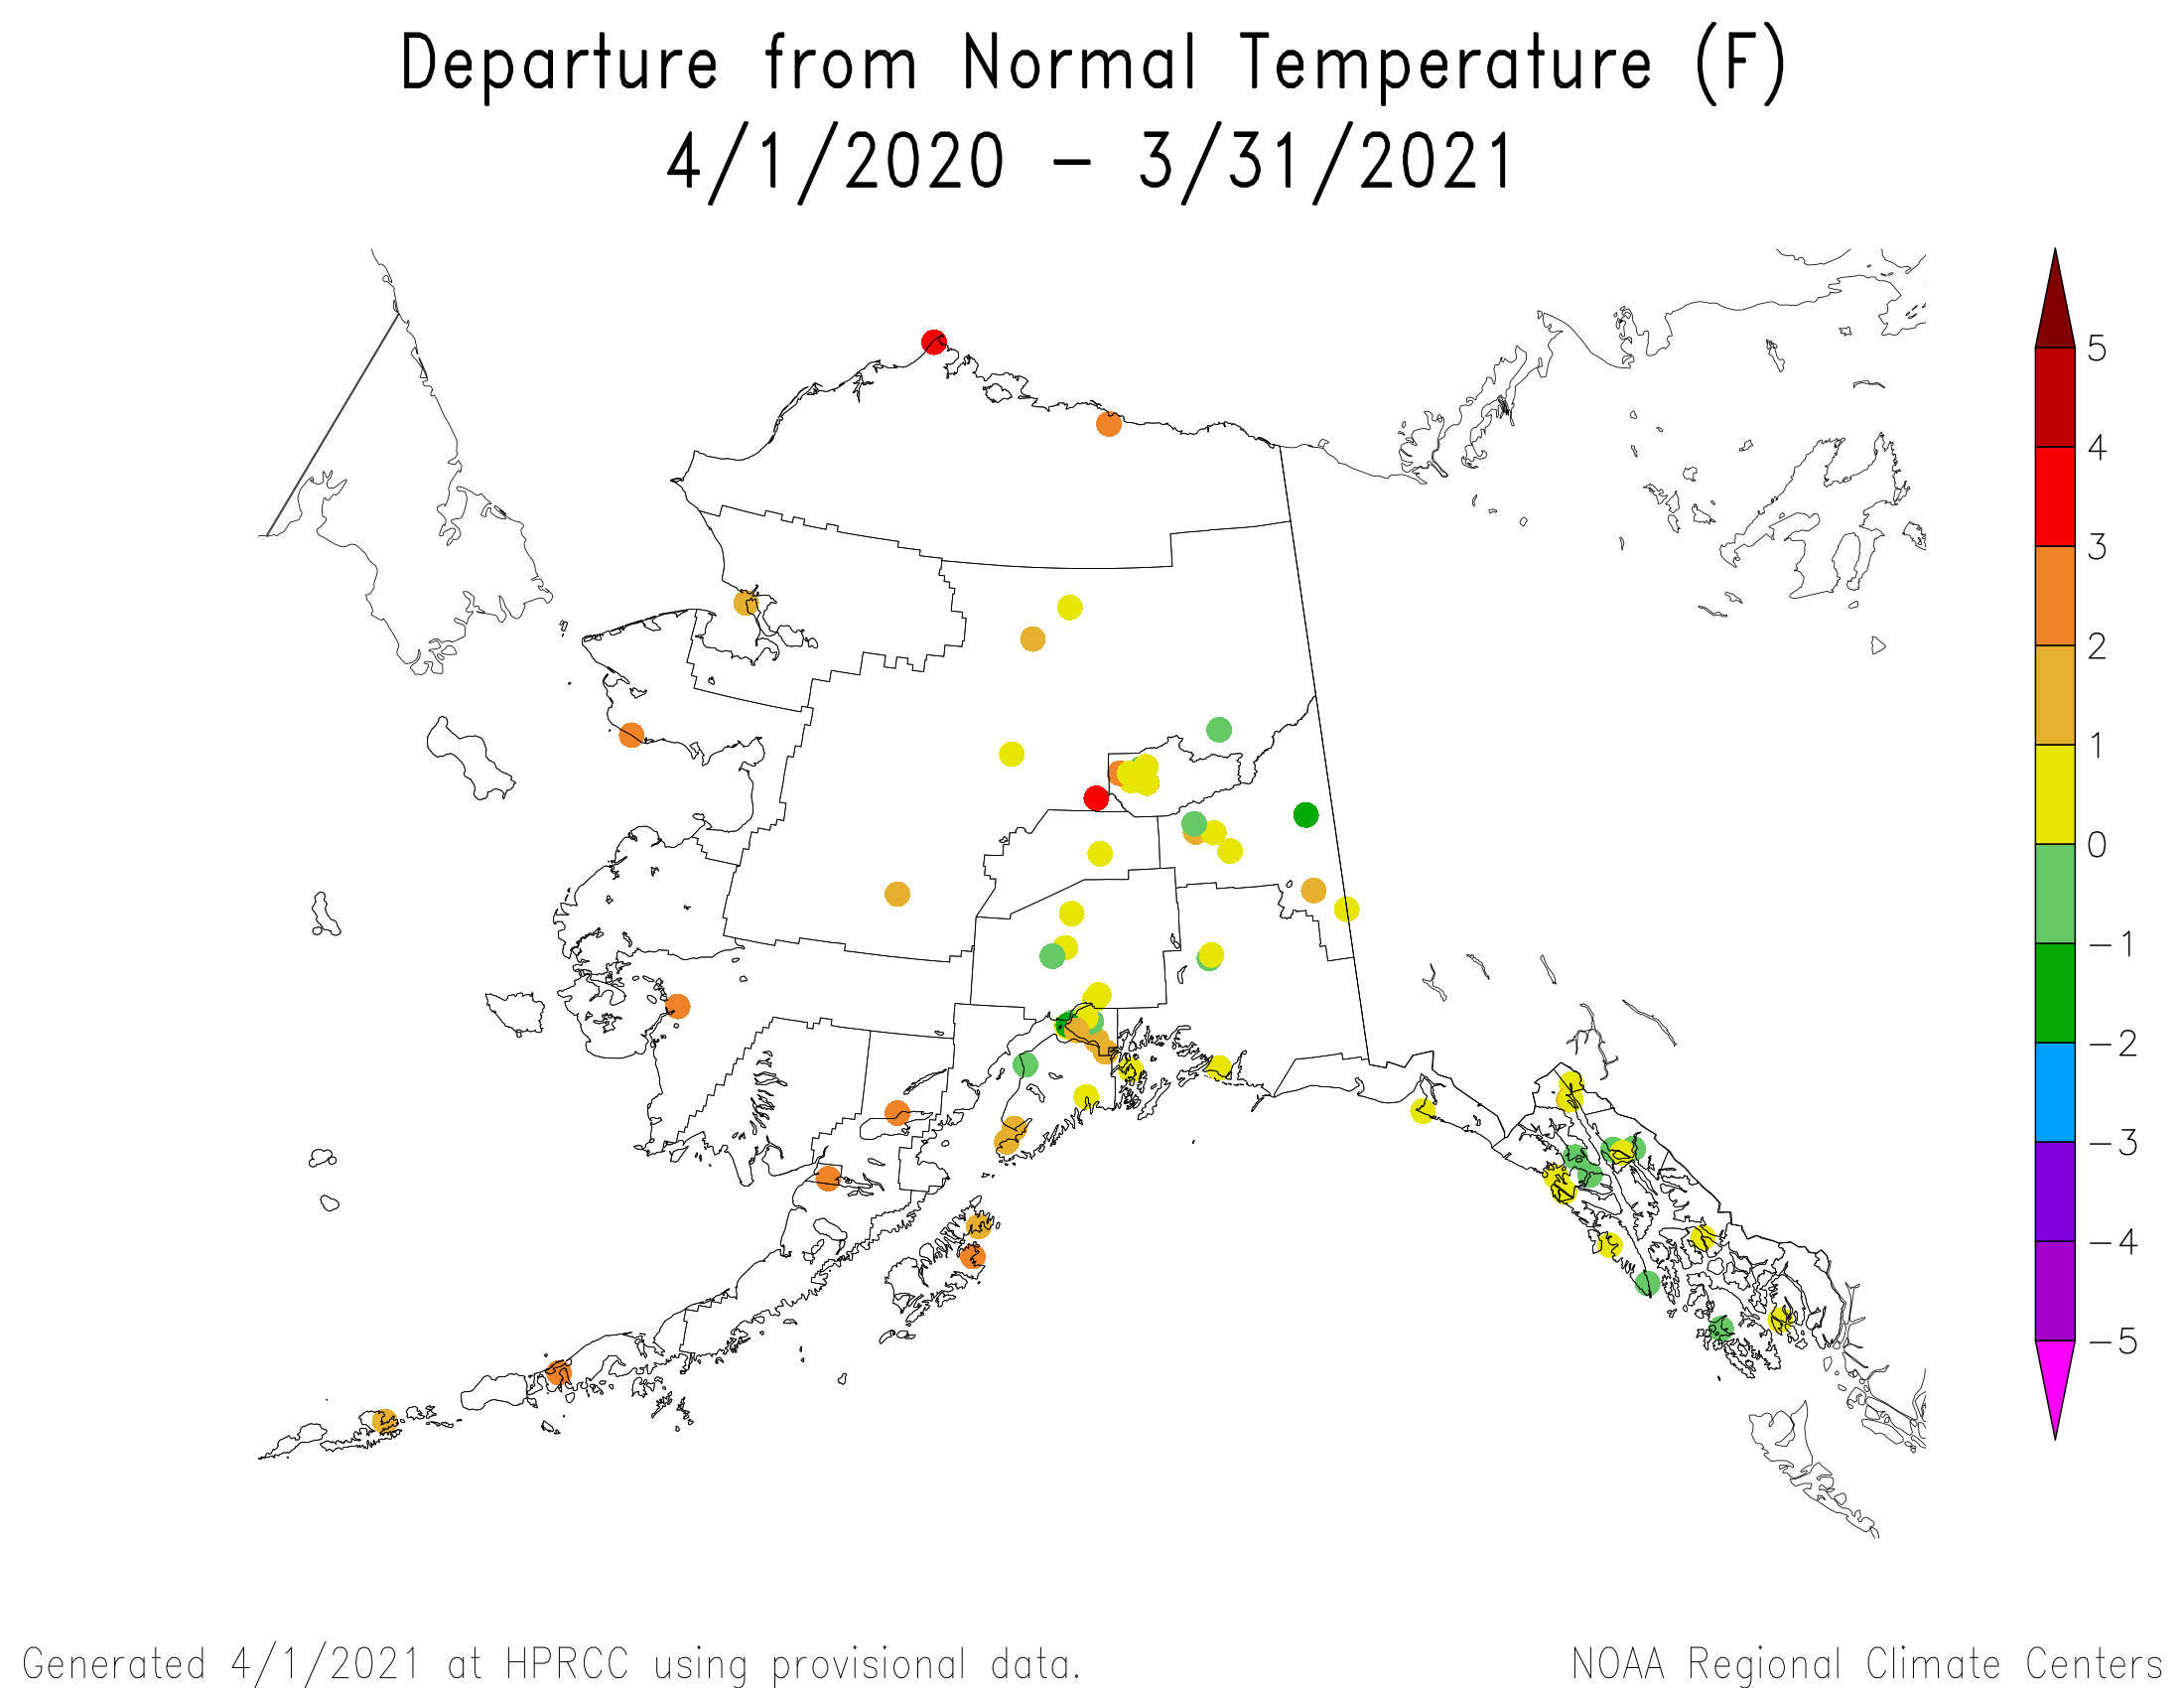
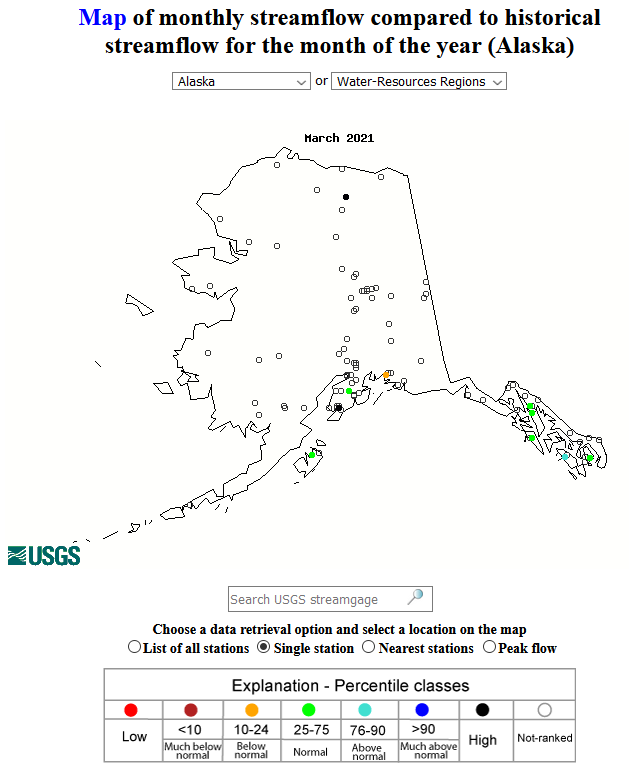
March was drier than normal in some northern and southern coastal sections of Alaska, and wetter than normal in areas in between those sections and in the west. Below-normal precipitation areas in the south persisted at 2 to 6 months with dry conditions evident in some station networks in the north at the 6-month time scale. The southern coastal and Aleutian areas were dry at the 9- to 12-month time scales, with southern coastal dryness continuing at longer time scales. Dryness was evident at some panhandle locations at the 36-month and longer time scales (low elevation station precipitation anomaly maps for the last 1, 2, 3, 4, 6, 9, 12, 24, 36, 48, 60 months) (high elevation SNOTEL station precipitation percentile maps for the last 1 and 6 months) (high elevation SNOTEL station precipitation anomaly maps for the last 1 and 6 months) (SNOTEL basin precipitation anomaly maps for the last 1 month and 5 months [map a, map b]) (gridded precipitation percentile maps for the last 1 and 3 months) (climate division precipitation rank maps for the last 1, 3, 6, and 12 months) (Leaky Bucket model precipitation percentile map). March was predominantly cooler than normal except for some stations along the Aleutian chain and the north shore. Below-normal temperatures dominated the state at the 2-month time scale, but warmer-than-normal conditions were evident in the southwest at 3 months and became more widespread by 6 months. By the 12-month time scale, above-normal temperatures dominated the state (low elevation station temperature anomaly maps for the last 1, 2, 3, 4, 6, 12 months) (gridded temperature percentile maps for the last 1 and 3 months) (climate division temperature rank maps for the last 1, 3, 6, 12 months) (Leaky Bucket model temperature percentile map). End-of-March snow pack was below normal in some northern and interior areas and above normal in the southern regions. Monthly streamflow (for those streams that were not frozen) was mostly near to above normal. Abnormal dryness continued in the northwest, northern, and eastern interior sections, growing to 34.7 percent of the state on the March 30th USDM map.
Puerto Rico and U.S. Virgin Islands


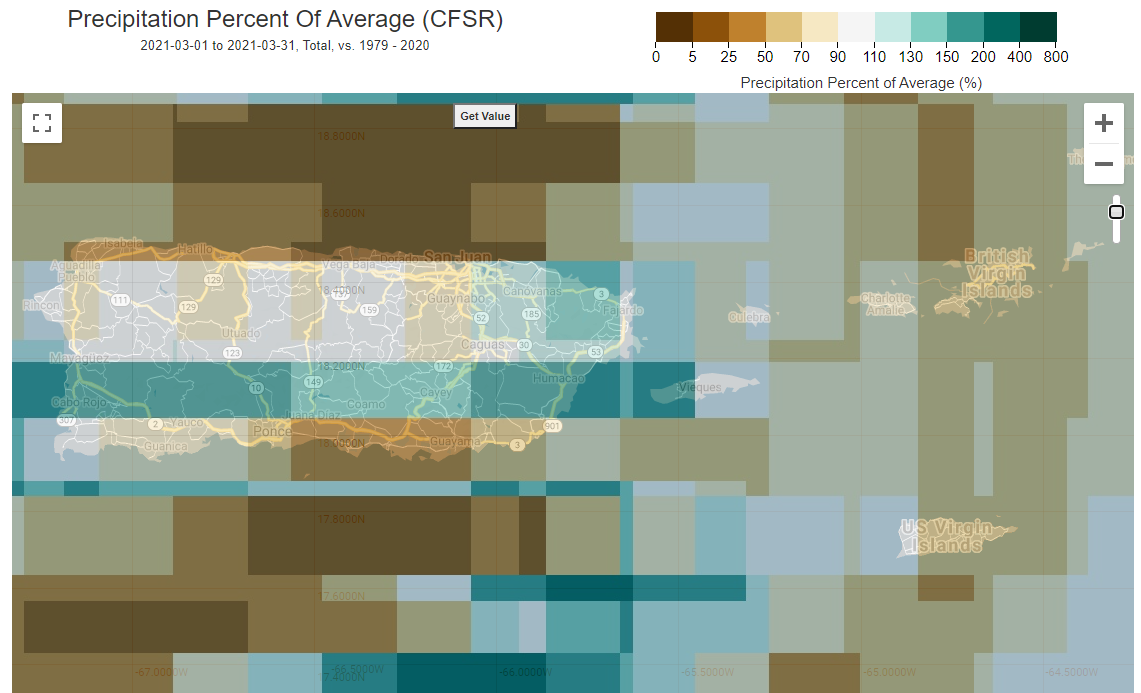
March 2021 was drier than normal across the U.S. Virgin Islands (USVI) and parts of Puerto Rico (PR). The dryness became widespread across all of the islands over the last 3 to 4 months. At the 6-month time scale, dryness was confined to northwestern PR and continued across the USVI. Much of PR was wetter than normal, and dryness was less acute across the USVI, at 9 months. Dryness was more widespread again at 12 to 36 months, with wetter-than-normal conditions dominating at longer time scales (low elevation station precipitation maps for the last 1, 2, 3, 4, 6, 9, 12, 24, 36, 48, 60 months) (climate engine model percent of normal precipitation map for the last month: PR and USVI, Caribbean region).
Temperatures across the USVI have been warmer than normal for the last 1 to 12 months. Puerto Rico has had a mixed temperature anomaly pattern for the 1- to 6-month time periods, with most stations warmer than normal at 12 months (low elevation station temperature anomaly maps for the last 1, 2, 3, 4, 6, 12 months). Root zone analyses indicated that soil conditions were dry along the immediate southern coast, in the east-central region, and across the northwest in PR. Monthly streamflow was mostly near to below normal across PR, with the below-normal gauges concentrated along the southern coast and in the east. Moderate drought was halved to about 8.0 percent of PR (in the northwest), with abnormal dryness and drought shrinking to about 26.8 percent of the territory, on the March 30th USDM map, while moderate drought continued on St. Croix and severe drought developed on St. Thomas and St. John in the U.S. Virgin Islands.
CONUS State Precipitation Ranks


March 2021 was drier than normal across much of the West, northern and southern Plains, Great Lakes to Northeast, Florida, and parts of the Mid-Atlantic coast, with record dryness occurring in parts of the northern Plains and Pacific Northwest. Seventeen states in these regions had a precipitation rank in the driest third of the 127-year historical record for March, including Montana and North Dakota, both of which ranked second driest on record.

The year to date (January-March 2021) was drier than normal across the northern Plains, Great Lakes to Northeast, Florida, Southwest to southern Plains, and parts of the Pacific Northwest, with record dryness occurring in parts of eastern Montana, the Dakotas, and eastern Great Lakes. Twenty states in these regions had a precipitation rank in the driest third of the historical record for January-March, including five in the top ten driest category — North Dakota (record driest), New York (fifth driest), Vermont (eighth driest), New Hampshire (ninth driest), and Massachusetts (tenth driest).

The last six months (October 2020-March 2021) were drier than normal across most of the West and Great Plains, and parts of the Great Lakes, Northeast, and central Gulf of Mexico coast, with record dryness occurring in the northern Plains. Seventeen states in these regions had a precipitation rank in the driest third of the historical record for October-March. These included North Dakota, which ranked driest on record, and three other states in the top ten driest category — California (fourth driest), Utah (fifth driest), and Nevada (tenth driest).


The last 12 months (April 2020-March 2021) were drier than normal across most of the West, Great Plains, and Northeast, and parts of the Midwest, with record dryness occurring in much of the Southwest. Twenty-three states in these regions had a precipitation rank in the driest third of the historical record for April-March. These included New Mexico, Nevada, Arizona and Utah, all of which ranked driest on record, and four other states in the top ten driest category — California (third driest), Colorado and Wyoming (both fourth driest), and North Dakota (eighth driest).
Agricultural Belts


During March 2021, the Primary Hard Red Winter Wheat agricultural belt was mostly wetter and warmer than normal. The month ranked as the sixth wettest and 23rd warmest March, regionwide, in the 1895-2021 record.
October marks the beginning of the growing season for the Primary Hard Red Winter Wheat belt. October 2020-March 2021 was mostly wetter and near to warmer than normal. The period ranked as the 49th wettest and 41st warmest October-March, regionwide, in the 1895-2021 record.


March also marks the beginning of the growing season for the Primary Corn and Soybean agricultural belt. March 2021 was mostly wetter and warmer than normal. The month ranked as the 13th wettest and tenth warmest March, regionwide, in the 1895-2021 record.
As of March 30, drought affected approximately 78 percent of spring wheat production, 51 percent of the sheep inventory, 41 percent of sorghum production, 39 percent of barley production, 39 percent of the milk cow inventory, 39 percent of cotton production, 35 percent of the cattle inventory, 33 percent of hay acreage, 24 percent of rice production, 24 percent of winter wheat production, 19 percent of corn production, 17 percent of soybean production, and 10 percent of peanut production.
March 30 USDA reports indicated that topsoil moisture was short or very short (dry or very dry) across 87 percent of North Dakota, 84 percent of New Mexico, 76 percent of Montana, 66 percent of South Dakota, 59 percent of Florida, 55 percent of Texas, and 55 percent of Wyoming. For pasture and rangeland condition, 91 percent was in poor to very poor condition in Arizona, 62 percent in Wyoming, 60 percent in Montana, 53 percent in Colorado, and 53 percent in Texas. Winter wheat was in poor to very poor condition in 88 percent of New Mexico, 42 percent of North Dakota, 32 percent of Colorado, and 31 percent of Texas.
U.S.-Affiliated Pacific Islands
The NOAA National Weather Service (NWS) offices, the Pacific ENSO Applications Climate Center (PEAC), and partners provided reports on conditions across the Pacific Islands.
In the U.S. Affiliated Pacific Islands (USAPI) (maps — Federated States of Micronesia [FSM], Northern Mariana Islands, Marshall Islands [RMI], Republic of Palau, American Samoa, basinwide), March 2021 was drier-than-normal in parts of the Marianas (Saipan) and southern FSM (Kapingamarangi and Lukunor), and American Samoa. It was near to wetter than normal at Guam, in the Republic of Palau, in the southern RMI, and in the rest of the FSM.
Monthly precipitation amounts were below the monthly minimum needed to meet most water needs (4 inches in the Marianas and Pago Pago, and 8 inches elsewhere) across the Marianas and northern RMI, and at Lukunor (in the FSM). March precipitation was above the monthly minimums at the rest of the USAPI stations in the FSM and RMI, and in Palau and American Samoa. The 4- and 8-inch thresholds are important because, if monthly precipitation falls below the threshold, then water shortages or drought become a concern.
The tropical Pacific climatology can experience extremes in precipitation, from very low precipitation during the dry season to very high precipitation during the wet season. This can result in monthly normal precipitation values that are well above the monthly minimum needed to meet most water needs. This was the case during March 2021. The monthly precipitation was above the minimum, but still was below normal because the normals were so high. This happened at Kapingamarangi (March 2021 precipitation 8.91 inches, March monthly normal mean 11.53 inches and median 11.43 inches).
In some of the cases where the rainfall was below the monthly minimum threshold, it was above normal. This is because March is in the dry season and normals are low. This was the case for Guam (March 2021 precipitation 2.70 inches, March monthly normal mean 2.77 inches and median 2.07 inches) and Kwajalein (March 2021 precipitation 6.21 inches, March monthly normal mean 3.56 inches and median 2.35 inches).
The dryness of March compounded recent and longer-term dryness at some stations.
| Station Name | Apr 2020 | May 2020 | Jun 2020 | Jul 2020 | Aug 2020 | Sep 2020 | Oct 2020 | Nov 2020 | Dec 2020 | Jan 2021 | Feb 2021 | Mar 2021 | Apr- Mar |
|---|---|---|---|---|---|---|---|---|---|---|---|---|---|
| Chuuk | 65% | 116% | 98% | 65% | 95% | 167% | 92% | 127% | 182% | 114% | 156% | 223% | 116% |
| Guam NAS | 98% | 240% | 55% | 81% | 86% | 87% | 146% | 140% | 157% | 102% | 33% | 130% | 90% |
| Kapingamarangi | 125% | 33% | 43% | 40% | 36% | 9% | 15% | 31% | 38% | 65% | 63% | 78% | 44% |
| Koror | 146% | 205% | 81% | 55% | 164% | 62% | 170% | 88% | 142% | 102% | 166% | 119% | 110% |
| Kosrae | 171% | 164% | 161% | 96% | 87% | 114% | 149% | 177% | 185% | 188% | 141% | 194% | 129% |
| Kwajalein | 145% | 92% | 88% | 89% | 54% | 144% | 140% | 115% | 60% | 74% | 75% | 264% | 102% |
| Lukonor | 103% | 107% | 97% | 83% | 81% | 134% | 105% | 102% | 219% | 146% | 180% | 84% | 103% |
| Majuro | 148% | 156% | 117% | 115% | 85% | 101% | 176% | 112% | 147% | 150% | 57% | 228% | 129% |
| Pago Pago | 166% | 72% | 389% | 201% | 179% | 228% | 201% | 160% | 113% | 132% | 141% | 91% | 137% |
| Pohnpei | 125% | 125% | 79% | 62% | 98% | 120% | 121% | 169% | 168% | 147% | 65% | 216% | 122% |
| Saipan | 19% | 46% | 54% | 57% | 68% | 74% | 104% | 88% | 193% | 91% | 122% | 46% | 78% |
| Yap | 80% | 105% | 154% | 51% | 72% | 81% | 104% | 196% | 200% | 201% | 139% | 189% | 113% |
| Station Name | Apr 2020 | May 2020 | Jun 2020 | Jul 2020 | Aug 2020 | Sep 2020 | Oct 2020 | Nov 2020 | Dec 2020 | Jan 2021 | Feb 2021 | Mar 2021 | Apr- Mar |
|---|---|---|---|---|---|---|---|---|---|---|---|---|---|
| Chuuk | 8.13" | 13.09" | 11.45" | 7.77" | 12.20" | 19.61" | 10.57" | 13.45" | 20.47" | 11.56" | 11.29" | 18.55" | 158.14" |
| Guam NAS | 2.47" | 8.16" | 3.40" | 8.26" | 12.68" | 10.96" | 16.75" | 10.33" | 8.02" | 4.11" | 1.01" | 2.70" | 88.85" |
| Kapingamarangi | 17.06" | 3.93" | 5.87" | 5.59" | 2.94" | 0.86" | 1.19" | 2.83" | 3.77" | 5.92" | 5.86" | 8.91" | 64.73" |
| Koror | 10.70" | 24.24" | 14.21" | 10.13" | 22.13" | 7.28" | 20.11" | 9.97" | 15.82" | 10.42" | 14.23" | 8.84" | 168.08" |
| Kosrae | 29.87" | 29.07" | 23.64" | 14.26" | 12.41" | 16.16" | 16.25" | 24.52" | 29.87" | 31.36" | 18.28" | 31.20" | 276.89" |
| Kwajalein | 7.64" | 6.15" | 6.09" | 8.82" | 5.24" | 15.51" | 15.64" | 12.95" | 4.02" | 2.34" | 1.97" | 6.21" | 92.58" |
| Lukonor | 11.63" | 12.52" | 11.34" | 13.18" | 11.35" | 13.63" | 11.83" | 9.23" | 24.71" | 12.29" | 16.11" | 7.81" | 155.63" |
| Majuro | 13.95" | 15.78" | 12.83" | 12.85" | 9.97" | 11.25" | 22.35" | 14.99" | 16.71" | 11.58" | 3.89" | 15.00" | 161.15" |
| Pago Pago | 15.56" | 6.96" | 20.76" | 11.17" | 9.63" | 14.90" | 18.63" | 16.25" | 14.55" | 17.62" | 16.86" | 9.68" | 172.57" |
| Pohnpei | 23.03" | 24.91" | 11.70" | 9.53" | 13.99" | 15.02" | 18.49" | 25.13" | 26.95" | 19.38" | 6.24" | 28.50" | 222.87" |
| Saipan | 0.50" | 1.10" | 1.96" | 5.11" | 8.88" | 7.46" | 11.08" | 4.95" | 7.43" | 2.30" | 3.15" | 0.86" | 54.78" |
| Yap | 4.50" | 8.22" | 18.56" | 7.71" | 10.61" | 10.98" | 12.71" | 17.27" | 16.99" | 12.85" | 7.24" | 8.63" | 136.27" |
| Station Name | Apr 2020 | May 2020 | Jun 2020 | Jul 2020 | Aug 2020 | Sep 2020 | Oct 2020 | Nov 2020 | Dec 2020 | Jan 2021 | Feb 2021 | Mar 2021 | Apr- Mar |
|---|---|---|---|---|---|---|---|---|---|---|---|---|---|
| Chuuk | 12.47" | 11.30" | 11.66" | 11.98" | 12.86" | 11.71" | 11.51" | 10.61" | 11.25" | 10.10" | 7.25" | 8.32" | 136.77" |
| Guam NAS | 2.53" | 3.40" | 6.18" | 10.14" | 14.74" | 12.66" | 11.44" | 7.38" | 5.11" | 4.01" | 3.03" | 2.07" | 99.09" |
| Kapingamarangi | 13.64" | 12.08" | 13.78" | 14.15" | 8.13" | 9.93" | 8.19" | 9.27" | 9.84" | 9.15" | 9.27" | 11.43" | 145.85" |
| Koror | 7.32" | 11.83" | 17.48" | 18.53" | 13.50" | 11.77" | 11.84" | 11.39" | 11.16" | 10.18" | 8.56" | 7.44" | 152.90" |
| Kosrae | 17.51" | 17.75" | 14.64" | 14.91" | 14.22" | 14.22" | 10.94" | 13.83" | 16.11" | 16.67" | 12.93" | 16.06" | 213.87" |
| Kwajalein | 5.26" | 6.72" | 6.93" | 9.87" | 9.74" | 10.74" | 11.18" | 11.28" | 6.66" | 3.16" | 2.64" | 2.35" | 90.41" |
| Lukonor | 11.31" | 11.69" | 11.65" | 15.93" | 14.04" | 10.15" | 11.32" | 9.08" | 11.27" | 8.41" | 8.93" | 9.26" | 151.36" |
| Majuro | 9.42" | 10.11" | 11.01" | 11.17" | 11.69" | 11.17" | 12.73" | 13.44" | 11.39" | 7.74" | 6.88" | 6.58" | 125.25" |
| Pago Pago | 9.39" | 9.66" | 5.33" | 5.55" | 5.38" | 6.53" | 9.26" | 10.14" | 12.84" | 13.34" | 12.00" | 10.68" | 125.57" |
| Pohnpei | 18.41" | 19.96" | 14.81" | 15.43" | 14.26" | 12.55" | 15.27" | 14.83" | 16.08" | 13.18" | 9.55" | 13.17" | 182.36" |
| Saipan | 2.63" | 2.38" | 3.62" | 8.91" | 13.13" | 10.09" | 10.62" | 5.61" | 3.85" | 2.53" | 2.59" | 1.89" | 70.25" |
| Yap | 5.63" | 7.85" | 12.04" | 15.08" | 14.82" | 13.50" | 12.18" | 8.83" | 8.51" | 6.39" | 5.19" | 4.56" | 120.31" |
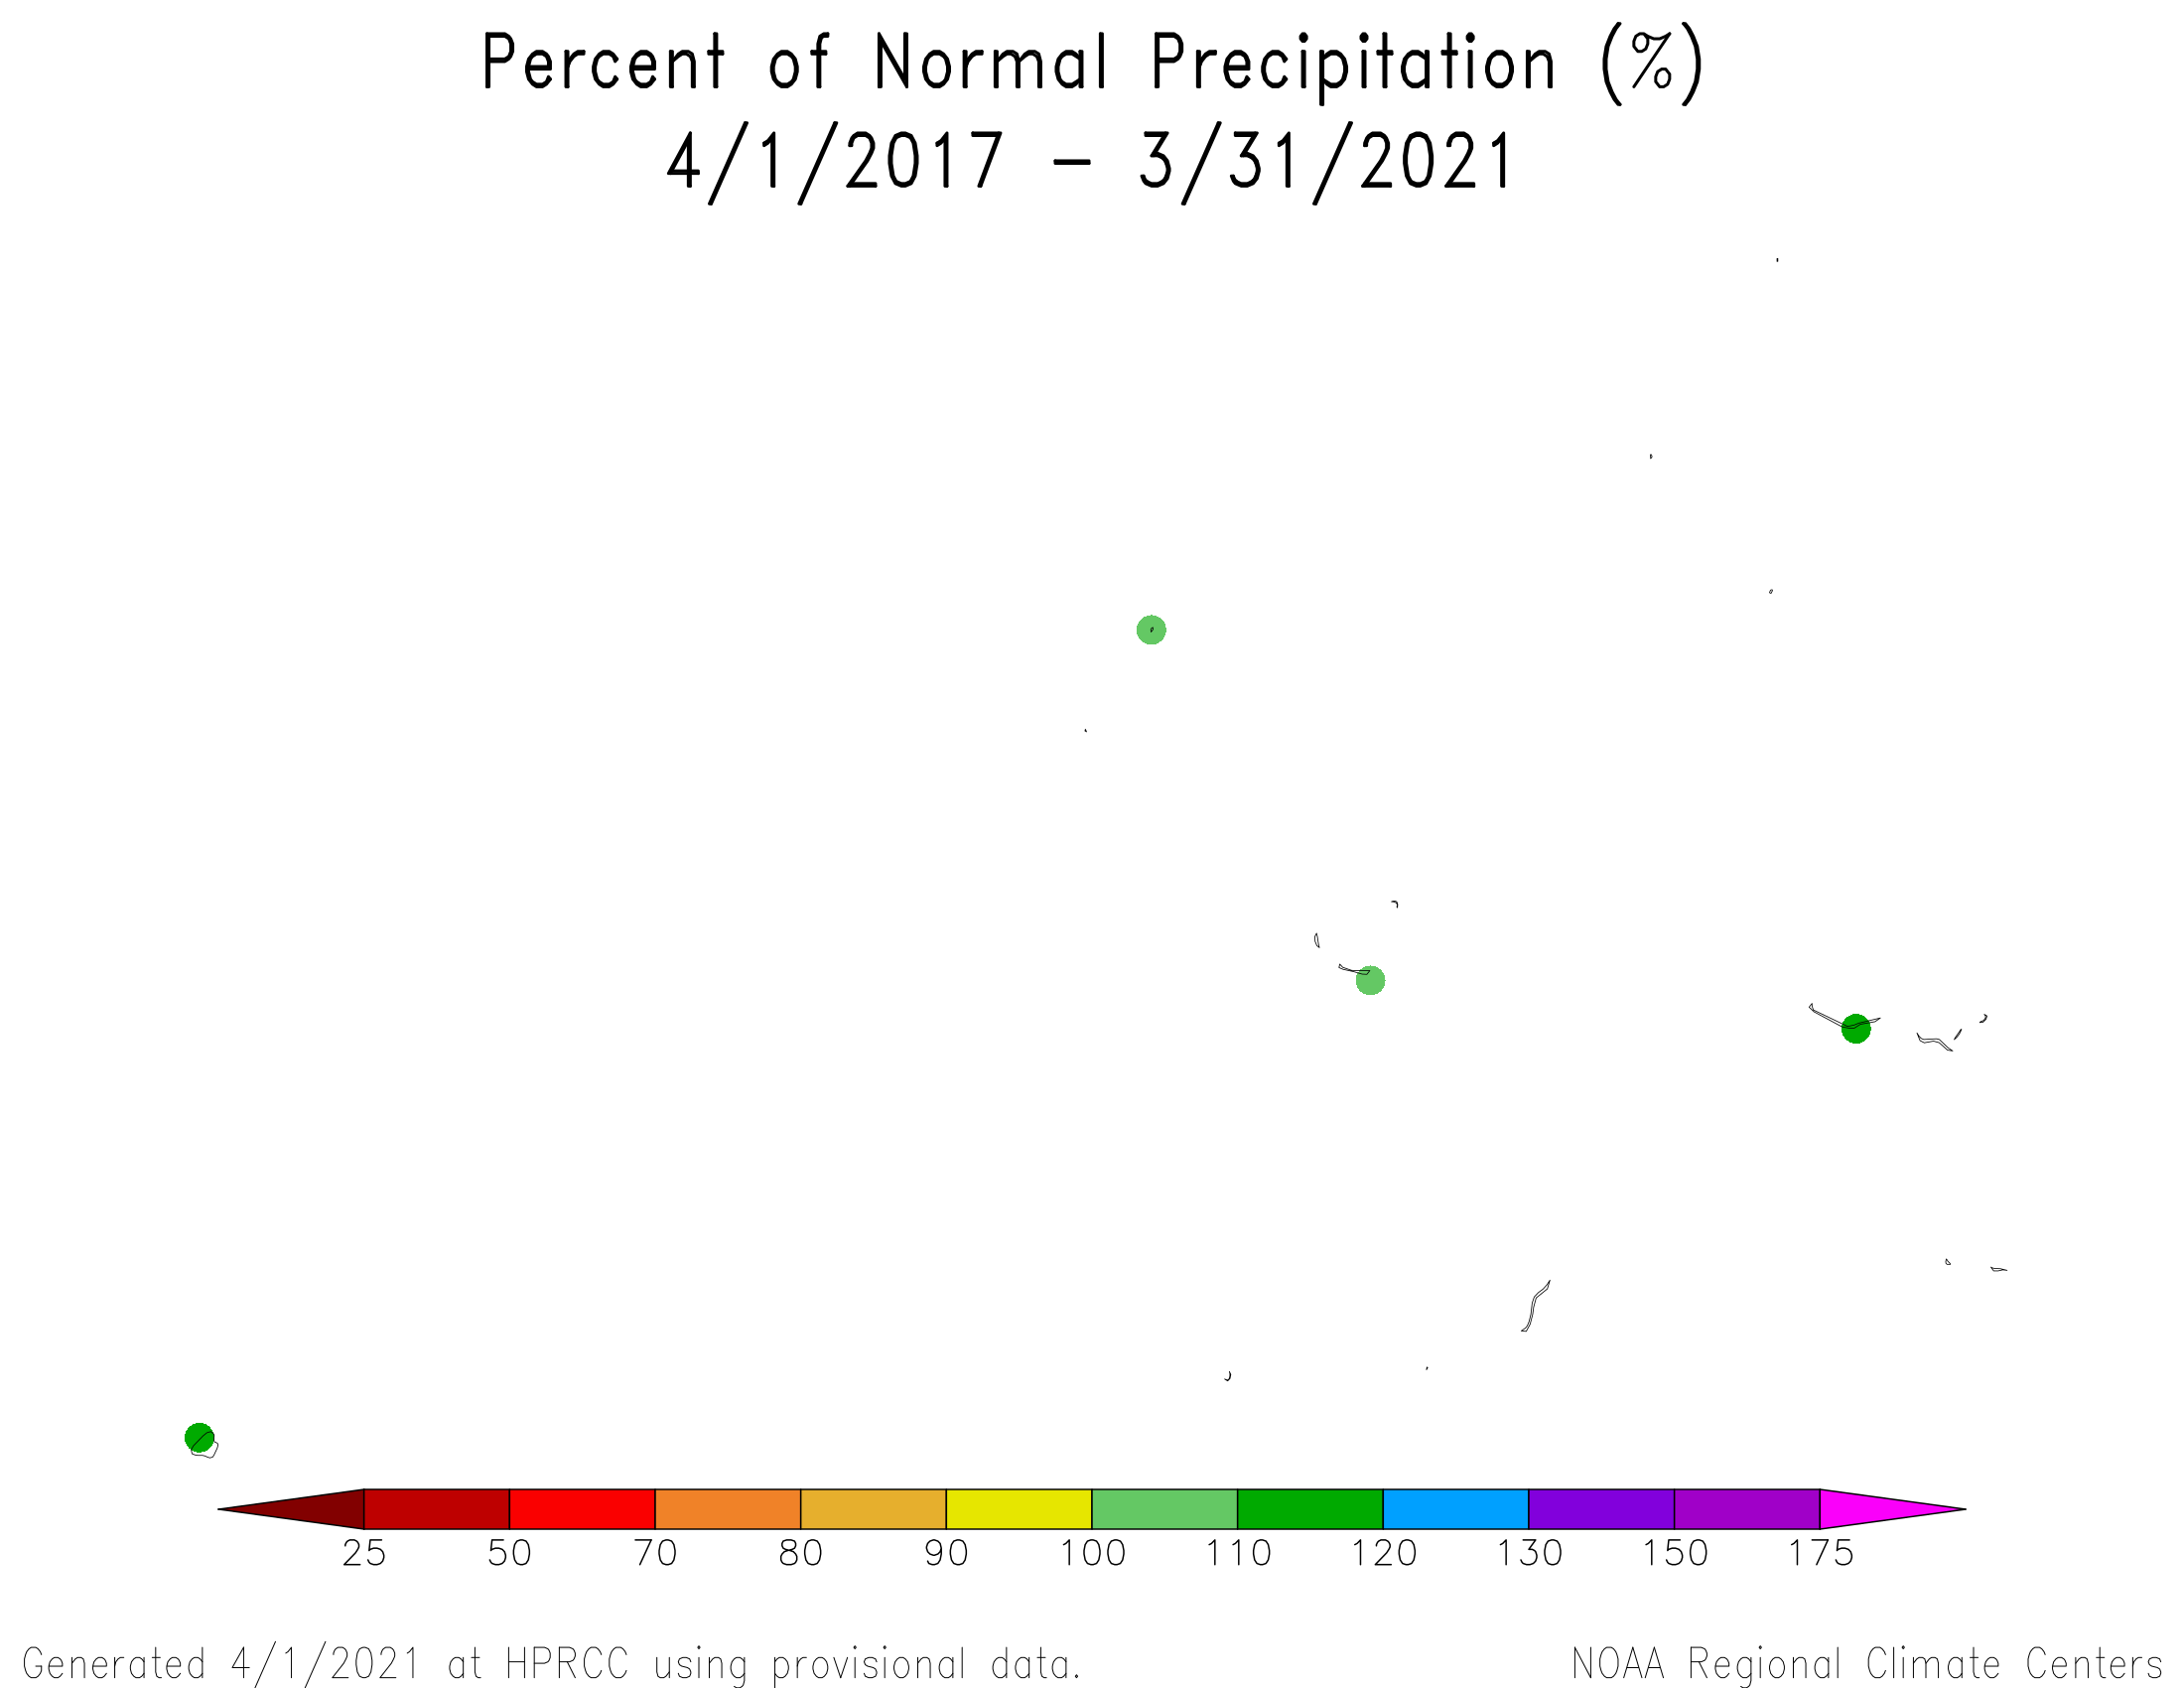
As measured by percent of normal precipitation, Kapingamarangi and Saipan were drier than normal in the short term (March and the last 3 months [January-March 2021]) and long term (last 12 months [ April 2020-March 2021]). Guam was drier than normal for the last 3 and 12 months but wetter than normal for March. Lukunor and Pago Pago were drier than normal for March but near to wetter than normal for the last 3 and 12 months. Chuuk, Koror, Kosrae, Kwajalein, Majuro, Pohnpei, and Yap were near to wetter than normal at all 3 time scales.


Based on percent of normal average (instead of normal median values), in the Marianas Islands, precipitation during March was generally below normal across the islands except for some locally heavy showers on Guam that gave some stations a wetter-than-normal month. The last 2 to 3 months was drier than normal across all of the islands with reporting stations. A mixed precipitation anomaly pattern was evident at 4 months. It was wetter than normal in the south and drier than normal on the islands to the north at 6 to 12 months. A mixed precipitation anomaly pattern was evident again at 24 to 36 months, with drier conditions dominating at longer time scales (percent of normal precipitation maps for the last 1, 2, 3, 4, 6, 9, 12, 24, 36, 48, 60 months).


In the Marshall Islands, March was wetter than normal except for the far northern islands (Wotje in particular). Most of the islands were wetter than normal for the last 2 months, with a mixed anomaly pattern dominating at 3 to 4 months. It was mostly wetter than normal at the 6-month time scale, with a mixed anomaly pattern again at longer time scales (percent of normal precipitation maps for the last 1, 2, 3, 4, 6, 9, 12, 24, 36, 48, 60 months).

![0-10 cm [0-4 inches] depth](/monitoring-content/sotc/drought/2021/03/SPoRT-LIS-0-10cm-pct-0331.vsm0-10percent_20210331_00z_conus.gif)
![0-40 cm [0-16 inches] depth](/monitoring-content/sotc/drought/2021/03/SPoRT-LIS-0-40cm-pct-0331.vsm0-40percent_20210331_00z_conus.gif)
![0-100 cm [0-39 inches] depth](/monitoring-content/sotc/drought/2021/03/SPoRT-LIS-0-100cm-pct-0331.vsm0-100percent_20210331_00z_conus.gif)
![0-200 cm [0-79 inches] depth](/monitoring-content/sotc/drought/2021/03/SPoRT-LIS-0-200cm-pct-0331.vsm0-200percent_20210331_00z_conus.gif)
According to the March 31st USDM produced for the USAPI, extreme drought (D3) developed at Wotje in the northern RMI and moderate drought (D1) developed at Saipan in the northern Marianas; conditions improved to severe drought (D2) in the southern FSM at Kapingamarangi; Kwajalein (in the RMI) improved to D1; Guam and Rota (Marianas) improved to D0 (abnormally dry); and drought or abnormal dryness ended at Fananu (northern FSM) and Jaluit and Majuro (RMI). The rest of the stations in Micronesia, and Tutuila in American Samoa, were free of drought and abnormal dryness. Storage in the Majuro reservoir gradually increased throughout the month to end at 29.5 million gallons, which is 82 percent of maximum and above the 28.8 million gallon threshold for concern. The National Weather Service office in Guam issued three Drought Information Statements for the drought in March (on March 5 and 19) and early April discussing the conditions in the USAPI. La Niña has kept Kapingamarangi very dry since summer 2020. Rainfall has increased in the last few months, enough to replenish water catchments and change the drought status from D3-SL (short- and long-term dryness) to D2-L (long-term dryness). Although some improvement has been noted, vegetation continues to suffer from the long-term dryness, with taro, breadfruit and banana trees remaining in very poor condition. Well water remains unsafe to drink. In the RMI, water conservation measures are in place across the far northern Marshall Islands. The most impacted islands have strict drinking water conservation measures in place while reserving well water for other needs. Several of the islands have Reverse Osmosis (RO) units but some are not operational.
The last one to 12 months have been especially dry at some of the islands in Micronesia (based on monthly and seasonal precipitation ranks) and the last 6 to 12 months have been dry at others. March 2021 ranked as the eighth driest March in a 31-year record at Kapingamarangi, and February-March ranked fifth driest, but longer time scales were drier. The five time periods from September-March through January-March each ranked third driest, and the five time periods from April-March through August-March ranked driest on record. Saipan had the fourth driest March in a 40-year record. October-March through February-March were wetter, but the longer time scales ranked third driest (April-March) to sixth driest (August-March). March 2021 was 34th driest (32nd wettest) for Guam, but in spite of the March wetness, February-March still ranked ninth driest (out of 64 years) and January-March tenth driest. Wotje had the 14th wettest March (out of 38 years), but still fifth driest January-March, sixth driest February-March, and seventh driest December-March.
The following analysis of historical data for the USAPI stations in the Global Historical Climatology Network-Daily (GHCN-D) dataset, augmented with fill-in data from the 1981-2010 Normals, helps put the current data into historical perspective by computing ranks based on the period of record. The table below lists the precipitation ranks for March 2021, October 2020-March 2021 (last 6 months), and April 2020-March 2021 (the last 12 months). Some stations have a long period of record and their dataset is fairly complete, while other stations have a shorter period of record and the dataset has some missing data.
| Station | March 2021 | Oct 2020-Mar 2021 | Apr 2020-Mar 2021 | Period of Record | |||
|---|---|---|---|---|---|---|---|
| Rank | Years | Rank | Years | Rank | Years | ||
| Ailinglapalap | 38 | 38 | 36 | 36 | 34 | 35 | 1981-2021 |
| Chuuk | 68 | 70 | 69 | 70 | 55 | 69 | 1951-2021 |
| Fananu | 7 | 7 | 6 | 6 | -- | 2 | 2003-2021 |
| Guam | 34 | 65 | 42 | 64 | 19 | 64 | 1957-2021 |
| Jaluit | 22 | 38 | 21 | 36 | 9 | 35 | 1981-2021 |
| Kapingamarangi | 8 | 31 | 3 | 23 | 1 | 16 | 1962-2021 |
| Koror | 46 | 70 | 59 | 70 | 58 | 68 | 1951-2021 |
| Kosrae | 48 | 51 | 38 | 38 | 31 | 33 | 1954-2021 |
| Kwajalein | 54 | 69 | 37 | 69 | 26 | 68 | 1952-2021 |
| Lukonor | 12 | 37 | 33 | 35 | 19 | 24 | 1981-2021 |
| Majuro | 58 | 67 | 61 | 67 | 58 | 66 | 1954-2021 |
| Mili | 37 | 38 | -- | 34 | -- | 32 | 1981-2021 |
| Nukuoro | 10 | 38 | 26 | 36 | 21 | 35 | 1981-2021 |
| Pago Pago | 25 | 55 | 46 | 55 | 53 | 55 | 1966-2021 |
| Pingelap | 29 | 37 | 31 | 34 | 29 | 32 | 1981-2021 |
| Pohnpei | 68 | 70 | 69 | 70 | 67 | 69 | 1951-2021 |
| Saipan | 4 | 40 | 18 | 32 | 3 | 32 | 1981-2021 |
| Ulithi | 37 | 38 | 33 | 35 | 28 | 35 | 1981-2021 |
| Utirik | -- | 17 | -- | 8 | -- | 4 | 1985-2020 |
| Woleai | 37 | 39 | 31 | 33 | 18 | 25 | 1968-2021 |
| Wotje | 25 | 38 | 29 | 35 | 27 | 34 | 1981-2021 |
| Yap | 54 | 70 | 67 | 70 | 52 | 69 | 1951-2021 |


SPI values for seven time periods for Pacific Islands, computed by the Honolulu NWS office.

NOAA Regional Climate Centers
More information, provided by the NOAA Regional Climate Centers and others, can be found below.
Southeast
There is no report from the Southeast Regional Climate Center this month.
South
As explained by the Southern Regional Climate Center, temperatures for the month of March were above normal across the Southern region, with the greatest departures from normal in the central and eastern parts of the region, while monthly precipitation varied spatially across the region. Parts of northwestern Louisiana, southwestern Oklahoma, and northern, eastern, central, southern, and western Texas received 50 percent or less of normal precipitation. Parts of northern, western, and southern Texas received 25 percent or less of normal precipitation, while parts of western and southern Texas received 5 percent or less of normal precipitation. In contrast, parts of northern Texas, western and northern Oklahoma, southeastern Louisiana, southern, northern, and eastern Arkansas, southern and northern Mississippi, and all of Tennessee received 130 percent or more of normal precipitation. Parts of northern Texas, western and northeastern Oklahoma, southern Louisiana, eastern and northern Arkansas, southern and northern Mississippi, and most of Tennessee received precipitation 150 percent or more of normal, while parts of northern Texas, western Oklahoma, southeastern Louisiana, eastern Arkansas, northwestern Mississippi, and eastern, central, and western Tennessee received 200 percent or more of normal precipitation.
At the end of March, drought conditions primarily deteriorated across the Southern region. Exceptional drought conditions persisted across western and northwestern Texas, while exceptional drought conditions developed in southern Texas. Extreme drought conditions persisted or even expanded across parts of western, northwestern, and southern Texas, while extreme drought conditions developed across southeastern Texas. However, extreme drought conditions in southwestern Oklahoma were eliminated. Severe drought classifications developed or expanded across parts of southern, central, southeastern, and northeastern Texas. Moderate drought classifications expanded or developed across parts of western Oklahoma, northeastern Louisiana, and northern, central, southern, and eastern Texas. However, the moderate drought conditions in southern Louisiana, northwestern Mississippi, and parts of northern Texas were eliminated. There was an increase in the total area experiencing abnormally dry conditions, as abnormally dry conditions developed across southeastern and western Oklahoma, central Mississippi, northwestern Louisiana, and central and eastern Texas. However, abnormally dry conditions reduced or were eliminated across parts of northern Texas, southern Louisiana, eastern Mississippi, Tennessee, and northern Arkansas.
Midwest
As described by the Midwest Regional Climate Center, March temperatures were warmer than normal across the Midwest and March precipitation was above normal. Precipitation fell below normal in northwestern Minnesota (less than 25 percent of normal in some areas), southern Wisconsin, northern Illinois, lower Michigan, and northern Ohio. The rest of the region saw above-normal precipitation.
March saw elimination of drought in southwestern Iowa, east central Illinois, and northwestern Indiana. There was also a slight decrease in drought severity in northwestern Iowa where long-term severe and extreme drought stubbornly were hanging on. Moderate drought expanded slightly in northeastern Minnesota and emerged in southern Michigan and northern Ohio. Abnormally dry conditions expanded across much of Wisconsin and Michigan in March, however along the Minnesota-Wisconsin border the abnormally dry conditions were alleviated late in March.
Northeast
As explained by the Northeast Regional Climate Center, March was a warmer-than-normal month for the Northeast with an average temperature of 35.8 degrees F (2.1 degrees C), 1.3 degrees F (0.7 degrees C) above normal. The Northeast had its 17th driest March since 1895 with 2.37 inches (60.20 mm) of precipitation, 66 percent of normal, and all 12 Northeast states were drier than normal.
The USDM from March 2 showed 4 percent of the Northeast in a moderate drought and 14 percent of the region as abnormally dry. These areas included portions of northern New England, New York, and northern Pennsylvania. With little precipitation, below-normal streamflow, and low soil moisture, conditions worsened in the region during the month. Moderate drought expanded in Vermont and northern New York and was introduced in western New York and northwestern Pennsylvania. Abnormal dryness expanded or was introduced in part of every Northeast state except Delaware and New Jersey. The USDM from March 30 showed 9 percent of the Northeast in a moderate drought and 28 percent of the region as abnormally dry. Spring fire season got underway in the Northeast, with an earlier-than-usual start in Maine. March's dry conditions added an increased risk of wildfires, allowing them to start easily and spread rapidly. On March 14 and 15, several National Weather Service offices in the Northeast issued Red Flag Warnings and/or Fire Weather Watches due to low humidity and strong winds. Indeed, these conditions helped fuel several brush fires in southern New England, as well as an unusually large wild fire in New Jersey that consumed 170 acres and damaged homes. Dry conditions this spring have affected cranberry operations in Massachusetts, with growers concerned that yields will be reduced. Farmers in New Hampshire noted low groundwater levels have that not been able to meet the demands of livestock.
High Plains
As summarized by the High Plains Regional Climate Center, the High Plains region experienced extremes in March that included heavy rain and snow, flooding and drought, and near-record warmth. Northern areas of the region were largely warm and dry, with many locations having both a top 10 warmest and top 10 driest March on record. With little to no snowfall as well, these conditions contributed to an expansion of drought across North Dakota and parts of South Dakota. This continued the increased risk for wildfires, with several burning in recent months. In fact, at the end of March, multiple fires burned in the Black Hills of South Dakota, forcing evacuations and closing Mt. Rushmore National Memorial. At the beginning of April, fire emergencies were declared in both North Dakota and South Dakota. Areas to the south, however, were extremely wet, with a large portion of the region receiving over 200 percent of normal precipitation. Much of this precipitation fell in mid-March, when an intense, slow-moving storm system brought heavy rain and snow to parts of Colorado, Kansas, Nebraska, Wyoming, and South Dakota. Numerous daily and monthly records were set, with some locations receiving more precipitation in this storm than what would be expected for the entire month of March. This heavy precipitation helped to alleviate or remove drought conditions across a large part of the region by building snowpack in the mountains, reducing or eliminating long-term precipitation deficits, and recharging soil moisture. Interestingly, soils were so dry in central and eastern Nebraska that very little flooding was reported, despite the heavy rain. In western areas of the region, where heavy snow and blizzard conditions were reported, several roads were closed, thousands of flights were cancelled, and some livestock perished. Although this storm, along with subsequent precipitation events later in the month, helped to alleviate drought conditions, it will take much more precipitation to overcome the long-term deficits that have accumulated over time, particularly for parts of Colorado and Wyoming.
With much of the region experiencing above-normal temperatures, some may be wondering about the status of spring leaf out. According to the USA National Phenology Network, spring leaf out was well underway across southern parts of the region, including Kansas, eastern Colorado, southern and eastern Nebraska, as well as portions of southern South Dakota. Interestingly, timing of the leaf out was mixed, with some areas of the region ahead of schedule and others behind. For instance, leaf out in parts of eastern Nebraska and southern South Dakota was up to 3 weeks ahead of average.
North Dakota, along with the northern half of South Dakota, was quite dry. Much of this area received less than 25 percent of normal precipitation and many locations ranked in the top 10 driest Marches on record. This dryness, along with low soil moisture supplies and a reduced snowpack, contributed to a substantial deterioration in drought conditions, with many concerns about crops, livestock, and wildfires. Because late spring and early summer is typically the wettest time of the year for the Dakotas, additional deficits could begin to mount quickly if precipitation does not materialize.
With variable amounts of snowfall across the Rockies this month, there were both increases and decreases in the upper Missouri Basin snowpack. According to the U.S. Army Corps of Engineers, between February 28th and March 28th, the Snow Water Equivalent (SWE) above Fort Peck Reservoir declined from 95 percent of average to 88 percent of average, while the reach between Fort Peck and Garrison Reservoirs increased by one percentage point to 95 percent of average. As of the week of March 29th, the statewide snowpack for Colorado and Wyoming was near median, at 92 and 98 percent of median, respectively. Plains snowpack, on the other hand, was largely non-existent most of the month. The 2021 runoff forecast for the upper Missouri Basin, as of March 2nd, was 21.7 MAF, which is 84 percent of average.
There were numerous changes in drought conditions across the High Plains region this month. Overall, according to the USDM, the area experiencing drought (D1-D4) decreased from approximately 82 percent to 64 percent since the end of last month. The last time the region had an areal drought coverage less than 65 percent was at the beginning of October 2020. Heavy precipitation across portions of Colorado, Kansas, Nebraska, Wyoming, and southern South Dakota either improved or removed drought conditions for a large part of the region. The largest reductions occurred in Wyoming, Kansas, and Nebraska, at about 20 percent, 28 percent, and 56 percent, respectively. In Colorado, drought conditions remained in place for about 92 percent of the state; however, major improvements were made, especially in eastern areas that had extreme (D3) drought. Meanwhile, drought conditions expanded and/or intensified across parts of the Dakotas due to persistent dryness, a lack of snow cover, and low soil moisture supplies. By the end of the month, D3 had developed and expanded to encompass a large area of western North Dakota and north-central South Dakota. It is also important to note that, as of March 9th, the entire state of North Dakota was in drought for the first time since 2012. For North Dakota, this is an exceedingly rare occurrence. Prior to 2021, the entire state had been in drought only 10 other weeks during the entire history of the USDM.
West
As described by the Western Regional Climate Center, by the end of March, 75% of the West was experiencing drought (21% in D4--Exceptional Drought) according to the USDM — with the most severe drought conditions centered on the Four Corners states and Nevada. However, some minor relief came during March as a record-breaking winter storm event impacted eastern Colorado and southeastern Wyoming dumping up to four feet of snow. Elsewhere, isolated areas of northern Arizona, northeastern New Mexico, and eastern Utah experienced above-normal precipitation for March. However, below-normal Water-Year-to-Date (WYTD) precipitation as well as substantial longer-term (12-24 months) deficits kept most of the Four Corners states entrenched in extreme-to-exceptional drought with growing concern moving into the summer months as Lake Mead is expected to drop to historic low levels. In California, the statewide snow water equivalent (SWE) stood at 60% of normal on March 31. The poor hydrological conditions (snowpack and reservoirs) across California are expected to have a significant negative impact on water allotments and, subsequently, the agricultural sector moving into the summer dry season. In the Pacific Northwest, precipitation for the month was below normal; however, WYTD precipitation accumulations remained at near normal to above normal levels across parts of the region. In statewide reservoir conditions (March 1), below-average storage levels were observed in Arizona, California, Colorado, Nevada, New Mexico, and Oregon.
In California, several cut-off lows during March brought cool temperatures and beneficial snowfall accumulations to areas of the Klamath Mountains and Sierra Nevada as well as modest rainfall accumulations to coastal areas, the Sierra foothills, and the Central Valley; however, the storms had little impact on the substantial WYTD precipitation deficits (up to 20 inches [508 mm] in northern California and the southern Sierra) observed across the state. In the southern Sierra, the Tulare Basin 6-station precipitation index was at 43% of the historical average (bottom 10th percentile) by the end of the month and the regional SWE breakdown was as follows: North--67%, Central--64%, and South--42%. With back-to-back dry winters, the state's two largest reservoirs, Shasta and Oroville, were at 65% and 53% of historical averages, respectively.
In the Pacific Northwest, precipitation in March was below normal across most of the region — particularly in areas of central Oregon and Washington including at the Columbia Gorge Region AP (Dallesport, Washington), which observed its second driest March on record with 0.18 in (5 mm; 15% of normal). As of March 31, NRCS SNOTEL stations were reporting normal to above-normal SWE across much of the Cascade Range of Oregon and Washington, Blue Mountains (OR), and portions of the Bitterroot Range (ID/western MT). Moreover, basin-wide (6-Digit HUC) SWE levels ranged from 79% (Klamath Basin) of median to 135% (Lower Columbia) of median with the Pacific Northwest region (2-Digit HUC) at 110% of median.
In the Four Corners states, March precipitation events provided a slight boost in SWE levels across many of the drainage basins in the region including the South Platte (107%), Upper Arkansas (109%), Rio Grande Headwaters (105%), and the Upper Canadian (100%). However, the remainder of the basins in the region continued to be below normal, especially in southern portions of Arizona and New Mexico where basin-wide SWE (March 31) ranged from 37% of median (Upper Gila) to 57% of median (Rio Grande-Elephant Butte). In the Colorado River system, the total system was at 44% of normal in early April with Lake Powell and Lake Mead at 36% and 40% of capacity, respectively. Systemwide, the Colorado was 44% full in early April as compared to 52% full at the same time in 2020. Looking towards the summer months, there is growing concern that Lake Mead could reach a critical threshold level and trigger a first-time federal water-shortage declaration (for 2022) that would severely impact Arizona and Nevada.
In Alaska, below-normal temperatures prevailed across much of the state except for areas along the North Slope and the Aleutians where average temperatures were above normal including at St. Paul Island which observed its 10th warmest March on record. Conversely, the greatest negative anomalies were observed in Southcentral along the Cook Inlet with Kenai AP observing an average temperature of 14.7 F (-9.6 C), a -11.0 F (-6.1 C) departure from normal. Precipitation for the month was a mixed-bag statewide with drier-than-normal conditions observed in the Cook Inlet, Northwest Gulf, and in parts of the Aleutians climate division (CD) while above-normal precipitation was observed across the Panhandle, Bristol Bay, Central Interior, and in the West Coast CD where King Salmon observed its fourth wettest March on record with 2.17 in (55 mm; 310% of normal).
In the Hawaiian Islands, a strong, slow moving low-pressure system brought torrential rains (72-hour totals up to 21 in [533 mm]), landslides, severe flash flooding (overtopping Kaupakalua Dam, Maui), and evacuations to areas of Kauai, Maui, and Oahu. For the month, rainfall totals were as follows: Hilo Intl AP 24.99 in (635 mm; 186% of normal), Honolulu Intl AP 4.21 in (107 mm; 208% of normal), Kahului AP 9.78 in (248 mm; 399% of normal), Lihue AP 11.89 in (302 mm; 258% of normal), and Molokai AP 6.18 in (157 mm; 231% of normal). The rains brought an end to the drought areas in the state.