|
Contents Of This Report: |


|
Please note that the values presented in this report are based on preliminary data. They will change when the final data are processed, but will not be replaced on these pages.
National Drought Overview
|
|
[top]
Detailed Drought Discussion
Overview

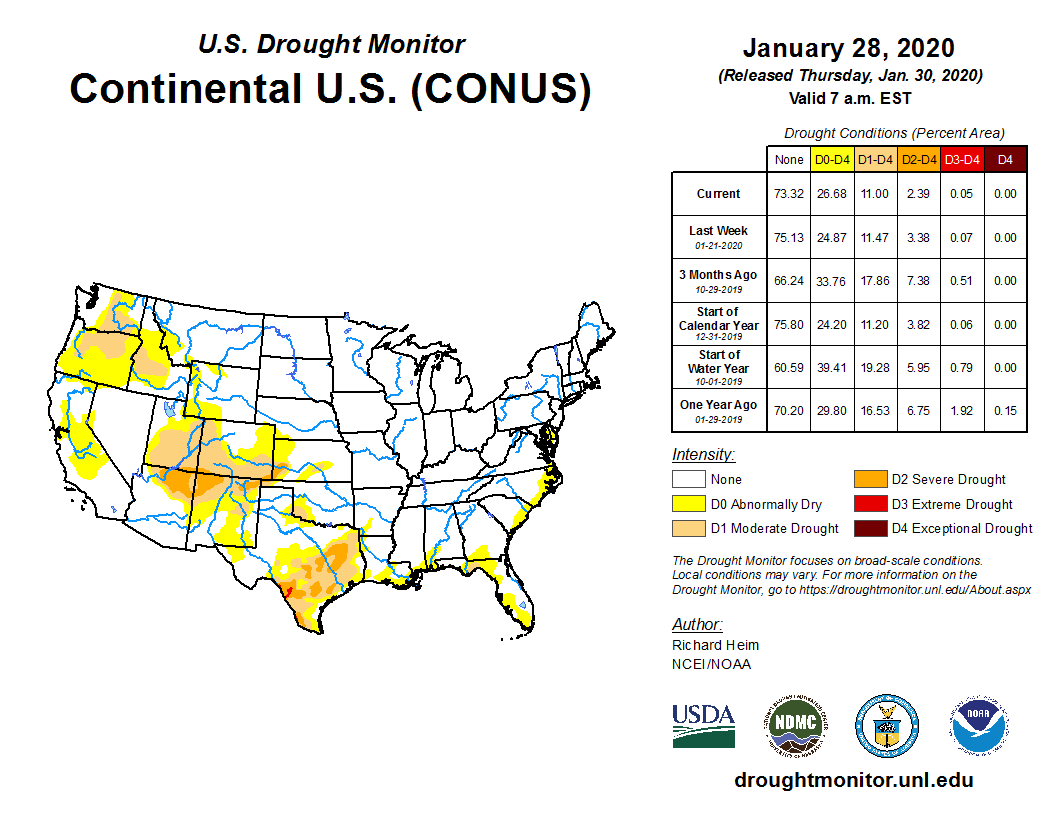
The U.S. Drought Monitor drought map valid January 28, 2020.
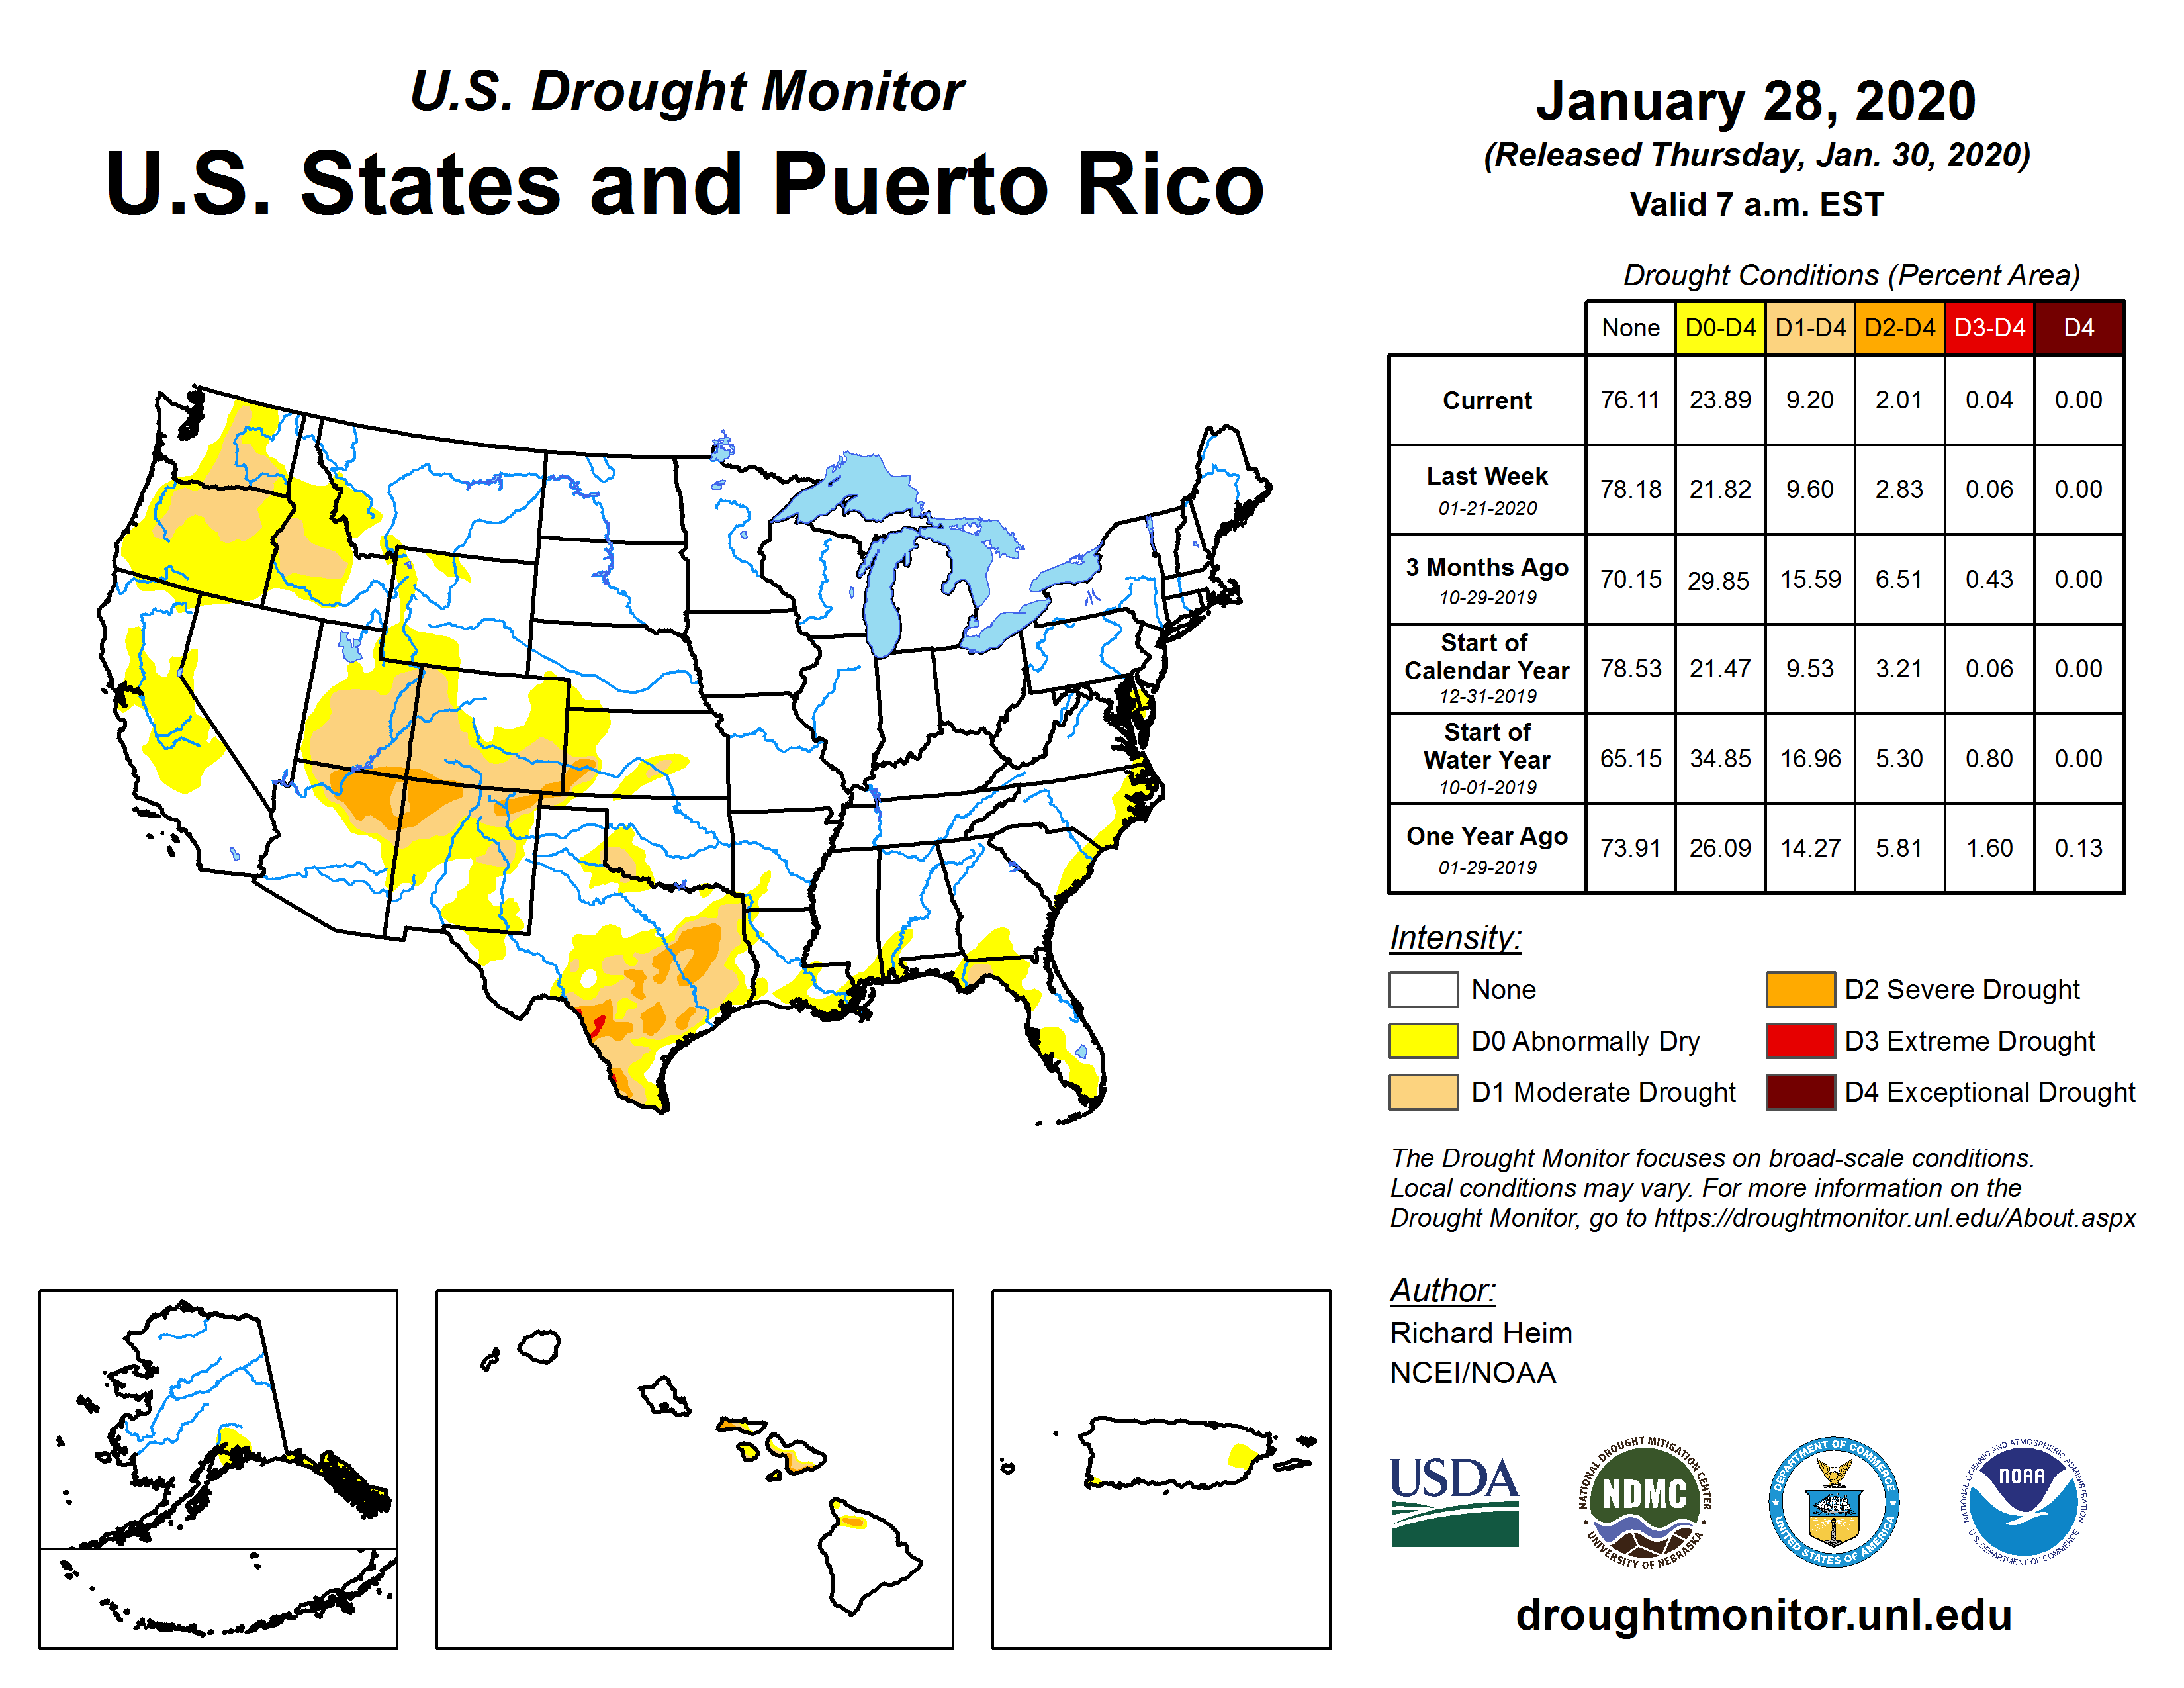
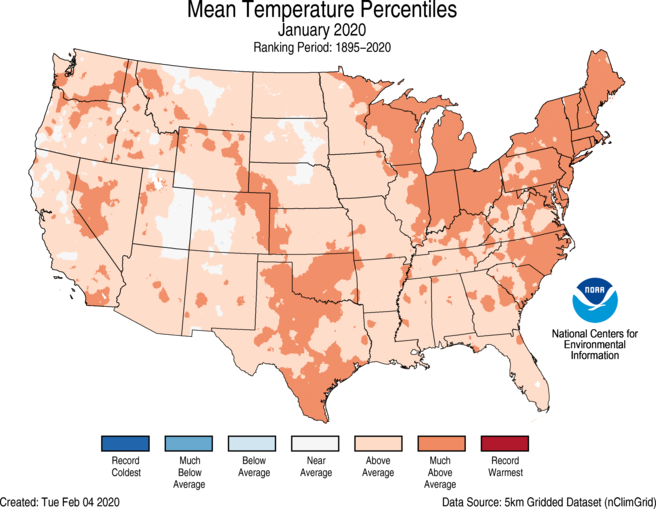
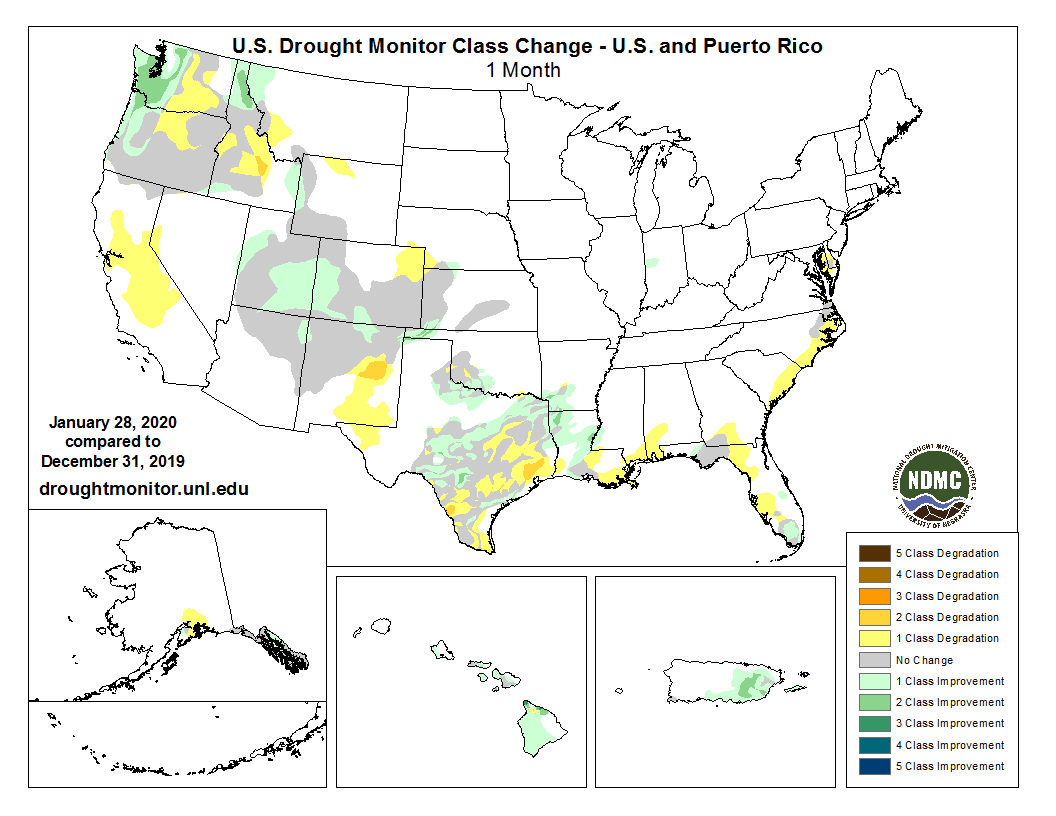
The upper-level circulation over the CONUS during January 2020 was very active with numerous short-wave troughs and ridges, and closed lows, which moved quickly west to east across the country. The upper-level systems dragged surface lows and fronts along with them. Occasionally long-wave ridges and troughs would become established, but they did not last longer than a few days. Cold Canadian air followed the fronts, bringing below-normal temperatures to some areas during a couple weeks (January 12-18 and 19-25). But the net effect of the variable circulation was a monthly average upper-level flow which was more zonal than usual (maps of upper-level circulation for January 2020 average and anomaly, climo), resulting in widespread warmer-than-normal temperatures. The weather systems dumped Pacific moisture across the Pacific Northwest as they came ashore, especially upslope mountain areas, giving this region above-normal precipitation for the month. They dried out as they trekked further across the West, but then they tapped Gulf of Mexico moisture and tracked to the northeast, spreading above-normal precipitation from central Texas to the Great Lakes and from the Lower Mississippi Valley to Appalachian Mountains. The Southwest and much of the High Plains, Rio Grande Valley, and East Coast were drier than normal for the month. Alaska and most of the U.S.-Affiliated Pacific Islands were drier than normal for the month, while Puerto Rico and the U.S. Virgin Islands were generally wetter than normal. Hawaii had a mixed precipitation anomaly pattern. As a result of these conditions, drought or abnormal dryness expanded or intensified in parts of the Southeast coast, Texas, southern High Plains, interior California, and rainshadow areas of the Pacific Northwest. Drought or abnormal dryness contracted or became less intense across upslope areas of the Pacific Northwest, in Hawaii and Puerto Rico, and parts of the Four Corners States and southern Plains to Lower Mississippi Valley. Drought contraction was slightly more than expansion this month, with the USDM-based national moderate-to-exceptional drought footprint across the CONUS falling from 11.2 percent of the CONUS at the end of December to 11.0 percent of the CONUS at the end of January (from 9.5 percent to 9.2 percent for the 50 States and Puerto Rico). According to the Palmer Drought Index, which goes back to the beginning of the 20th century, about 4.4 percent of the CONUS was in moderate to extreme drought at the end of January, decreasing about 1.6 percent from the 6.0 percent at the end of December.

Drought conditions at the end of January, as depicted on the January 28th, 2020 USDM map, included the following core drought and abnormally dry areas:
- Moderate (D1) to severe (D2) drought covered a large part of the Southwest spreading into the central High Plains, with abnormal dryness (D0) and moderate drought over the Pacific Northwest. The percent area of the West (from the Rockies to the West Coast) in moderate to extreme drought (based on the Palmer Drought Index) decreased compared to last month to about 6.3 percent. The area of the West experiencing moist conditions also decreased to 3.6 percent at the end of January.
- Abnormal dryness (D0) to severe drought continued in the central Plains, with abnormal dryness to extreme (D3) drought covering large parts of the southern Plains.
- In the Southeast, a spot of moderate drought continued in the Florida panhandle, with abnormal dryness spreading in areas along the Gulf and East Coasts.
- In Hawaii, extreme and exceptional (D4) drought disappeared with abnormal dryness to severe drought continuing. About 4.1 percent of the state was in drought (D1-D4) and 15.0 percent was experiencing abnormally dry conditions or drought (D0-D4). These numbers are down from last month's 17.6 and 63.2 percent, respectively.
- Moderate drought disappeared on Puerto Rico, leaving behind small spots of abnormal dryness. In the U.S. Virgin Islands, moderate drought continued on St. Croix while St. Thomas and St. John were free of drought or abnormal dryness.
- In the U.S.-Affiliated Pacific Islands (USAPI), moderate drought developed on Guam, and abnormal dryness developed across the rest of the Marianas, most of the Marshall Islands, and some islands in the Federated states of Micronesia, while the rest of the USAPI was free of drought or abnormal dryness.
- Moderate drought disappeared from Alaska map, with only a couple areas of abnormal dryness remaining.
Palmer Drought Index
The Palmer drought indices measure the balance between moisture demand (evapotranspiration driven by temperature) and moisture supply (precipitation). The Palmer Z Index depicts moisture conditions for the current month, while the Palmer Hydrological Drought Index (PHDI) and Palmer Drought Severity Index (PDSI) depict the current month's cumulative moisture conditions integrated over the last several months. While both the PDSI and PHDI indices show long-term moisture conditions, the PDSI depicts meteorological drought while the PHDI depicts hydrological drought. The PDSI map may show less severe and extensive drought (as well as wet spell conditions) in some parts of the country than the PHDI map because the meteorological conditions that produce drought and wet spell conditions are not as long-lasting as the hydrological impacts.
|
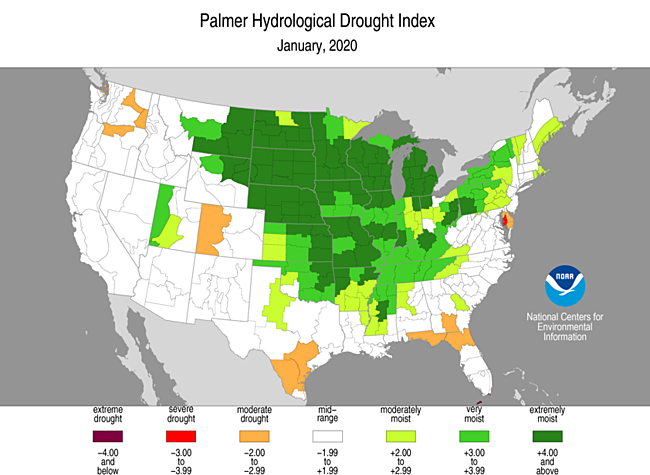 |
Used together, the Palmer Z Index and PHDI maps show that short-term drought occurred in California, Arizona, and Nevada, as well as southern New England, eliminating long-term wet conditions there. Short-term drought occurred in western Colorado, contributing to the establishment of long-term drought (PHDI maps for January compared to December. Short-term drought occurred in South Texas and Florida to Georgia, expanding long-term drought in these areas. Short-term wet conditions in the Pacific Northwest reduced the area of long-term drought there.
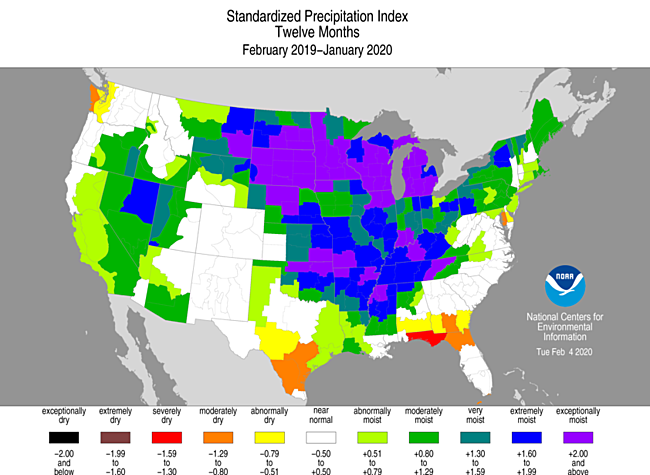
Standardized Precipitation Index
The Standardized Precipitation Index (SPI) measures moisture supply. The SPI maps here show the spatial extent of anomalously wet and dry areas at time scales ranging from 1 month to 24 months.
 |
 |
 |

The SPI maps illustrate how moisture conditions have varied considerably through time and space over the last two years. Dryness is widespread from California to Utah at the 1-month time scale and again at 6 months, but not the other time scales. Parts of Florida are dry at 1 month and 6-12 months. Parts of the central to northern High Plains (eastern Colorado to Montana) are dry at 1 to 3 months. Southern New England is dry at the 1-month time scale, but not others. The coastal Mid-Atlantic (Delaware and eastern Maryland) is dry from 6 to 12 months. Parts of Texas are dry at the 2- to 12-month time scales. Parts of the Pacific Northwest are dry for the last 3 to 24 months. The Four Corners states have dryness at the 6-, 9-, and 24-month time scales. Wet conditions dominate much of the country east of the Rockies at 6 to 24 months.
 |
 |
 |
Regional Discussion

Hawaii percent of normal precipitation map, August 2019-January 2020.
January 2020 had a mixed precipitation anomaly pattern across the Hawaiian Islands. The Big Island was mostly wetter than normal with the rest of the main islands drier than normal for the last 2 to 4 months. The central islands were generally drier than normal and the others wetter than normal for the rest of the time periods over the last year (last 1, 2, 3, 4, 6, 7, 9, 10, 12 months). Wetter-than-normal conditions generally dominated at longer time periods (last 24, 36, 48, 60 months). Streamflow was mostly near to above normal. Drought and abnormal dryness contracted during January with extreme to exceptional drought ending. The statewide drought area decreased from 17.6 percent at the end of December to 8.1 percent at the end of January.
 Gridded precipitation percentile map for Alaska, January 2020.
|
 Alaska 24-month percent of normal precipitation map, February 2018-January 2020.
|
January 2020 was drier than normal across most of Alaska, with wetter-than-normal conditions only along the northern coastal areas. The last two months also were mostly drier than normal. Wetter-than-normal conditions dominate much of the state from the 3- to 12-month time scales, except for drier-than-normal conditions in the panhandle and south central coastal areas. At longer time scales, wetter-than-normal conditions dominate except in the panhandle (low elevation station precipitation anomaly maps for the last 1, 2, 3, 4, 6, 7, 9, 10, 12, 24, 36, 48, 60 months) (high elevation SNOTEL station precipitation maps for last 1 and 4 months, and SNOTEL basin map for last 4 months) (gridded precipitation percentile maps for the last 1 and 3 months) (climate division precipitation rank maps for the last 1, 3, 6, 12 months) (Leaky Bucket model precipitation percentile map). Temperatures were colder than normal across the state during January and colder than normal across most of the state for December 2019-January 2020. The temperature anomaly pattern transitioned to a mixed pattern for the last 3 to 6 months, then warmer than normal across the state at the 12-month time period (low elevation station temperature maps for the last 1, 2, 3, 4, 12 months) (gridded temperature percentile maps for the last 1 and 3 months) (climate division temperature rank maps for the last 1, 3, 6, 12 months) (Leaky Bucket model temperature percentile map). Modeled soil moisture and snow pack were below average in the southern SNOTEL basins. Streamflow was near to above normal at the unfrozen streams reporting at this time of year. Improved water levels allowed Alaska Electric Light and Power to reconnect all interruptible customers, so moderate drought disappeared from the panhandle during January, leaving only abnormal dryness covering 9.7 percent of Alaska on the January 28th USDM map.
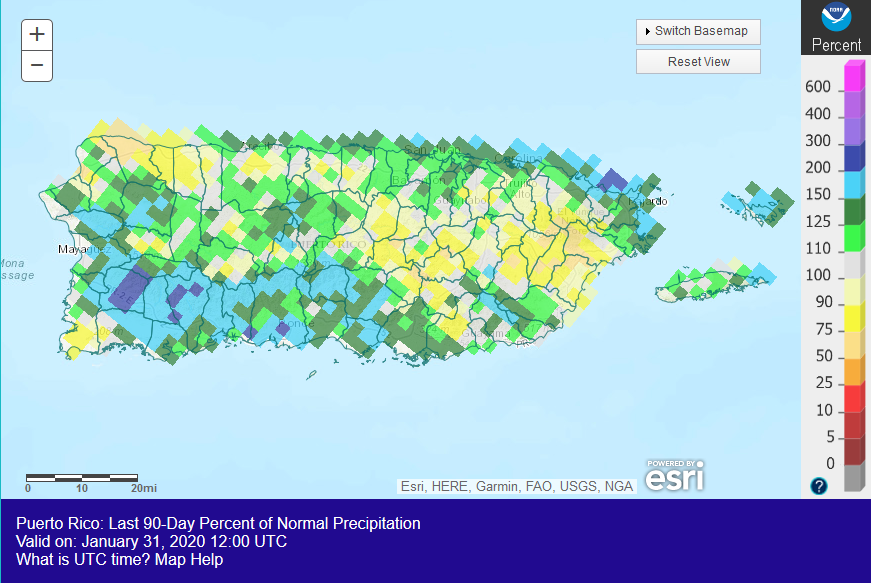
 Puerto Rico percent of normal precipitation map for October 2019-January 2020.
|
 Puerto Rico and the U.S. Virgin Islands percent of normal precipitation map for February 2019-January 2020.
|
Puerto Rico and U.S. Virgin Islands:
January was wetter than normal across most of Puerto Rico and the U.S. Virgin Islands (USVI). Some drier-than-normal conditions were evident on the maps for the last 2 months, with the dryness spreading to the east across Puerto Rico and spreading across the southern USVI at 3 to 4 months. At the 6-month time scale, the USVI and much of Puerto Rico were drier than normal, and this pattern held for much of the last 24 months. Wetter-than-normal conditions dominated at longer time scales (radar-based precipitation anomaly estimates for the last 1, 2, 3, 4, 6, 12 months) (low elevation station precipitation maps for the last 1, 2, 3, 4, 6, 7, 9, 10, 12, 24, 36, 48, 60 months). Root zone analyses indicated that soil conditions were still dry along some coastal areas of Puerto Rico. January streamflow was mostly near to above normal across Puerto Rico. Moderate drought disappeared from Puerto Rico, with only a couple spots of abnormal dryness remaining on the January 28th USDM map. In the USVI, moderate drought continued on St. Croix, but St. John and St. Thomas were free of drought and abnormal dryness.
CONUS State Precipitation Ranks:

|

|
January 2020 was drier than normal across the Southwest, High Plains, South Texas, and from Florida north along the coast to southern New England. Ten states in these regions had a rank in the driest third of the 126-year historical record for January, including to which ranked in the top ten category — Rhode Island which ranked sixth driest and Massachusetts which ranked tenth driest.
November 2019-January 2020 was drier than normal from central California to the Pacific Northwest and northern Rockies, across parts of the High Plains, from Texas to northern Florida, and parts of the Midwest to Mid-Atlantic Coast. Areas of wetter-than-normal precipitation dotted parts of some of the states in these areas. Only four states (in the Northwest plus Louisiana) had a rank in the driest third of the 125-year historical record for November-January.
The last six months were drier than normal from much of the Pacific Northwest to Texas, and parts of the Gulf Coast, Ohio Valley, and Mid-Atlantic region. Eight states in these regions had a rank in the driest third of the historical record for August-January.
The last 12 months were drier than normal across parts of the Pacific Northwest, Southwest, Texas, and Southeast, with wetter-than-normal conditions dotting these areas, and wetter-than-normal conditions spread across the rest of the CONUS. Only two states — Florida and Washington — ranked in the driest third of the historical record for February-January.
 Primary Hard Red Winter Wheat Belt precipitation, January, 1895-2020.
|
 Primary Hard Red Winter Wheat Belt precipitation, October-January, 1895-2020.
|
During January 2020, the Primary Hard Red Winter Wheat agricultural belt was warmer and mostly wetter than normal. The month ranked as the 21st wettest and 12th warmest January, regionwide, in the 1895-2020 record.
October marks the beginning of the growing season for the Primary Hard Red Winter Wheat agricultural belt. For October 2019-January 2020, temperatures were mostly near normal with precipitation having a mixed anomaly pattern. The 4-month period ranked as the 49th wettest and 46th warmest October-January, regionwide, in the 1895-2020 record.
As of January 28th, drought affected approximately 12 percent of winter wheat production, nine percent of cattle inventory and hay acreage, three percent of spring wheat production, and one percent of corn production. None of the soybean producing areas were in a drought status as of January 28.
NOAA Regional Climate Centers:
More information, provided by the NOAA Regional Climate Centers and others, can be found below.
As summarized by the High Plains Regional Climate Center, it was another mild month for the High Plains region, with temperature departures in the range of 2.0-4.0 degrees F (1.1-2.2 degrees C) above normal widespread across much of the region. The past month brought above-normal precipitation to much of the southern and eastern portions of the High Plains, with more variable precipitation across the remainder of the region. A large area of below-normal precipitation occurred across much of Colorado, northern and southeastern Wyoming, the panhandle of Nebraska, and western North Dakota and South Dakota. Precipitation in these areas was less than half of normal; however, these deficits are not large for this time of the year. Laramie, Wyoming tied with 2013 for its driest January on record with only a trace amount of precipitation observed for the entire month (period of record 1948-2020).
Mountain snowpack remained in good shape this month across much of Colorado and Wyoming. By the end of January, Colorado's statewide Snow Water Equivalent (SWE) was 109 percent of median, while Wyoming's was 108 percent of median. Basins in western Wyoming that had below-normal snowpack in December improved, with only one basin in the state with SWE below 90 percent. Meanwhile, across the Upper Missouri Basin, mountain SWE was still near to slightly above normal. As of February 2nd, mountain SWE was 98 percent of average above Fort Peck and also 98 percent of average in the reach from Fort Peck to Garrison, according to the U.S. Army Corps of Engineers. At the end of the month, plains snowpack was present across eastern portions of the region, as well as southwestern Kansas. SWE varied from a trace to about 6.0 inches (25 mm).
Drought conditions improved slightly across western portions of the High Plains region during the month of January. According to the USDM, the area experiencing drought (D1-D4) in the High Plains region remained nearly unchanged since the end of December. As of late January, around 12 percent of the High Plains was in drought. Although the area in drought remained about the same, the area in severe drought (D2) fell by about 3 percent over the course of the month. Many improvements occurred during January, especially in western and southern Colorado where a sizeable reduction of severe drought (D2) conditions occurred due to ample snowfall. With this reduction, just over 1 percent of the region remained in D2 at the end of the month. Meanwhile, across southwestern Kansas, moderate drought (D1) and severe drought (D2) decreased very slightly as well. Abnormally dry conditions (D0) expanded to include portions of northwestern Kansas, northeastern Colorado, southwestern Nebraska, and northern Wyoming. A small pocket of moderate drought (D1) remained in place across central Kansas throughout the month. The remainder of the region continued to be free of drought (D1-D4) and abnormally dry (D0) conditions. As of the January 28th release of the USDM, both Nebraska and South Dakota have been drought-free for more than a year.
With planting season around the corner, there are many concerns across the region. For instance, many fields remain unharvested, especially in North Dakota, and fields that went unplanted last year may have weed issues this year. With extremely wet conditions already in place, it may be difficult to get into the fields for spring planting activities. Conditions should be monitored closely through the late winter and spring.
As explained by the Southern Regional Climate Center, January temperatures were above normal across the Southern region, and precipitation was primarily above normal but with dry areas. Parts of southeastern Louisiana as well as parts of southern, northern, and western Texas received 50 percent or less of normal precipitation. Parts of southern and western Texas received 25 percent or less of normal precipitation, while parts of far southern and far western Texas received 2 percent or less of normal precipitation.
At the end of January, drought conditions both improved and deteriorated across the Southern region. Extreme drought conditions persisted across southern Texas with smaller areas developing along the southern border, while areas in central Texas experienced removal of extreme drought conditions. Severe drought classifications were still present in central and southern Texas as well as extreme western Oklahoma, while new areas developed in southern, southeastern, and eastern Texas. However, severe drought conditions were removed in southwestern Oklahoma and southwestern Arkansas. Moderate drought classifications decreased across extreme western Oklahoma, northern and west-central Texas, northeastern and northwestern Louisiana, and southwestern Arkansas, while new areas developed in eastern, southern, and southeastern Texas. There was an increase in the overall area experiencing abnormally dry conditions despite improvement across northern Texas, southwestern and extreme western Oklahoma, and central Arkansas. This was due to an increase in abnormally dry conditions across western, central, southern, and eastern Texas, southern Louisiana, and southern Mississippi.
As described by the Midwest Regional Climate Center, January precipitation was well above normal for much of the Midwest and temperatures were warmer than normal across the region. Precipitation averaged 2.80 inches (71 mm), which was 1.03 inches (26 mm) above normal, ranking as the 17th wettest January on record (1895-2020) for the region. Only scattered areas in Minnesota, Wisconsin, Michigan, Ohio, and Kentucky had slightly below-normal precipitation.
As noted by the Southeast Regional Climate Center, temperatures were much above average across the Southeast and Puerto Rico for the month of January and precipitation varied widely across the region. Unusual dryness was found across the East Coast of Virginia, the Carolinas, Georgia, and most of Florida, where the precipitation values ranged from 90 to less than 50 percent of normal.
Overall drought conditions have not changed for the month of January, with no areas of severe drought (D2). There continues to be a pocket of moderate drought (D1), ringed by an area of dry conditions (D0), in the Panhandle of Florida. Abnormally dry conditions (D0) have expanded through southern Florida, southern Alabama, and the coasts of the Carolinas. Puerto Rico no longer has moderate drought (D1); however, a few pockets of abnormally dry conditions (D0) remain. Wheat and winter forages were in good condition; however, many Alabama producers were still facing impending hay shortages due to drought conditions in the fall. Hay supplies were short in many areas of Georgia due to drought conditions last fall.
As explained by the Northeast Regional Climate Center, the Northeast region had its tenth warmest January since 1895 and wrapped up January with 2.88 inches (73.15 mm) of precipitation, which was 93 percent of normal. Ten of the twelve states were drier than normal, with January precipitation ranging from 37 percent of normal in Rhode Island to 106 percent of normal in West Virginia. This January ranked as the sixth driest on record for Rhode Island, the 10th driest for Massachusetts, and the 17th driest for Connecticut.
The USDM released on January 2 showed less than 1 percent of the region as abnormally dry. This included a small area in eastern Maryland and southern Delaware. Several factors, including persistent precipitation deficits, below-normal streamflow, and below-normal soil moisture, led to the expansion of abnormal dryness in Maryland and Delaware during the first three weeks of January. Rainfall during the last week of the month allowed for minor improvements. The USDM released on January 30 showed 2 percent of the region was abnormally dry.
As summarized by the Western Regional Climate Center, precipitation was above normal across most of the Pacific Northwest, northern Great Basin, and portions of the northern Rockies of western Montana, and northwestern Wyoming. A persistent ridge of high pressure situated off the coast of California steered storm systems into the Pacific Northwest, including a series of atmospheric rivers (AR) that brought heavy precipitation, strong winds, river flooding, and landslides to parts of the region. In Oregon and Washington, the ARs brought a mix of heavy rain and some snow to the lowlands as well as heavy snowfall to the higher elevations of the Olympic Mountains and Cascade Range. The series of storms led to significant improvement in snowpack conditions across the mountain ranges of central and northern Idaho, Oregon, and Washington as well as providing for continued drought amelioration in the region. Average temperatures were above normal for the region.
Elsewhere in the West, drier-than-normal conditions prevailed across much of the southern half of the region. Across California and Nevada, below-normal precipitation was observed with the exception of extreme northern portions of both states. In the southern half of California and Nevada, percent of normal precipitation was less than half of normal with some areas in southeastern California and southern Nevada experiencing record-dryness, including at McCarren International Airport in Las Vegas, Nevada which observed no precipitation during the month and tied for the driest January on record. In California, snowpack conditions deteriorated by the end of the month with the snowpack at 70% of normal statewide, while most basins in Arizona, Colorado, New Mexico, and Utah ended January at normal to above-normal levels. According to the California Cooperative Snow Surveys summary by region, the percentage of normal SWE (snow water equivalent) on January 31 was as follows: Northern Sierra/Trinity 75%, Central Sierra 69%, and Southern Sierra 66%. Despite the decline in the Sierra Nevada snowpack by the end of January, California's major reservoirs remained at normal to above-normal levels as compared to historical averages. In other areas of the Intermountain West, drier-than-normal conditions were observed in northern and western Arizona, southern Utah, central Colorado, southeastern Wyoming, and central Montana. In north-central Colorado, Ft. Collins and Greeley both experienced their second-driest January on record.
In Alaska, colder-than-normal temperatures prevailed across the state in January with the greatest temperature anomalies observed in the following climate divisions: Bristol Bay (-13.8 F, -7.7 C), Cook Inlet (-11.8 F, -6.6 C), and Northwest Gulf (-10.8 F, -6.0 C). Statewide, it was the 13th coldest January on record with an average temperature of -6.2 F (-21.2 C), which was 8.4 F (4.6 C) below normal. In the Interior, McGrath observed its fourth coldest January on record with an average temperature of -24.4 F (-31.3 C), which was 17.9 F (9.9 C) below average. In Southeast Alaska, the multi-year drought came to end, according to the USDM.
In the Hawaiian Islands, wetter-than-normal conditions prevailed across most of the Big Island, particularly in the districts of South Hilo, Puna, and Kau. On the windward side of the Big Island, the observing station, Hilo 5 S, reported 27.09 in (688 mm - 214% of normal) while the USGS rain gauge at the Saddle Road Quarry logged a monthly total of 56.41 in (1432.8 mm - 539% of normal). Elsewhere, near normal to above-normal precipitation was observed on Kauai and portions of the windward side of Maui while Lanai and Molokai were below normal. Average temperatures were a few degrees above normal across most of the island chain with notable departures on the windward side Big Island and on Kauai where Hilo had its warmest January on record and Lihue had its third warmest.
U.S.-Affiliated Pacific Islands
The NOAA National Weather Service (NWS) offices, the Pacific ENSO Applications Climate Center (PEAC), and partners provided reports on conditions across the Pacific Islands.
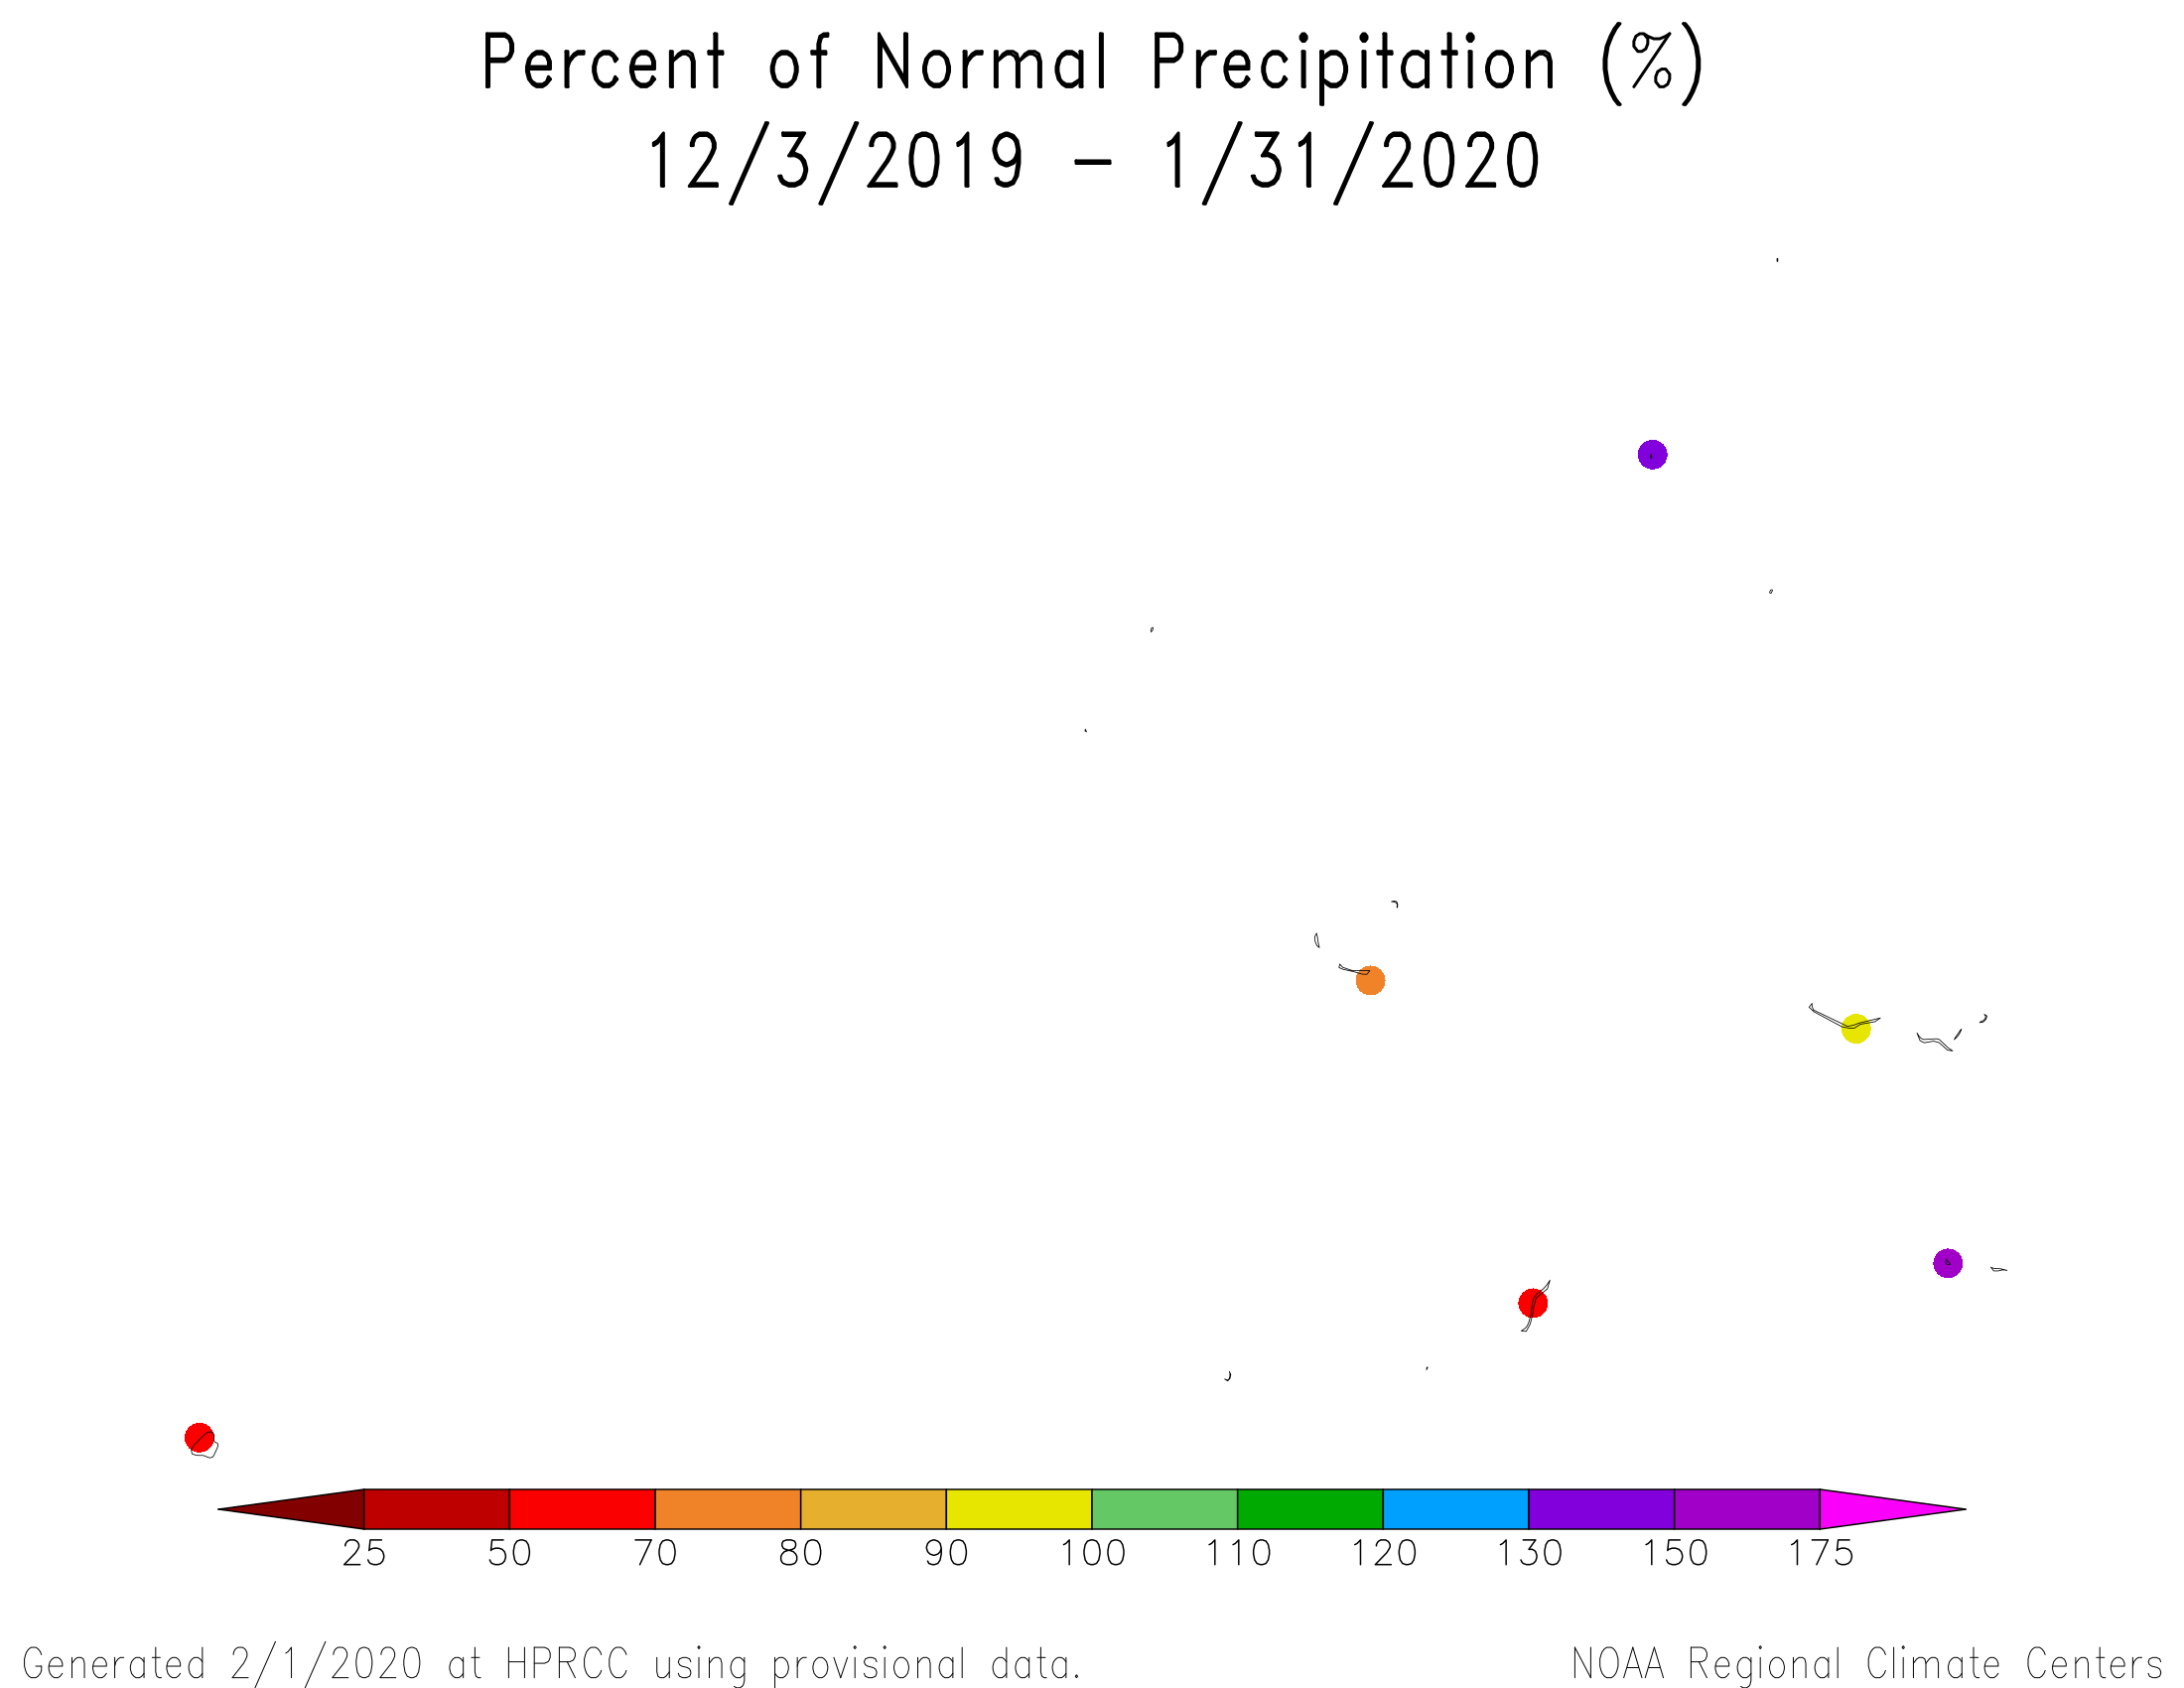
In the U.S. Affiliated Pacific Islands (USAPI) (maps — Federated States of Micronesia [FSM], Northern Mariana Islands, Marshall Islands [RMI], Republic of Palau, American Samoa, basinwide), January 2020 was drier-than-normal at most of the USAPI primary stations; only Kwajalein and Pago Pago were wetter than normal.
Monthly precipitation amounts were below the monthly minimum needed to meet most water needs (4 inches in the Marianas and Pago Pago, and 8 inches elsewhere) at Guam, Rota, and Saipan (in the Marianas); Koror (in the Republic of Palau); Yap, Woleai, Kapingamarangi, Lukonor, Pohnpei, Mwoakilloa, and Pingelap (in the FSM); and Ailinglapalap, Jaluit, Kwajalein, Majuro, Utirik, and Wotje (in the RMI); and above the monthly minimums at the rest of the USAPI stations. The 4- and 8-inch thresholds are important because, if monthly precipitation falls below the threshold, then water shortages or drought become a concern.
| Station Name | Feb 2019 | Mar 2019 | Apr 2019 | May 2019 | Jun 2019 | Jul 2019 | Aug 2019 | Sep 2019 | Oct 2019 | Nov 2019 | Dec 2019 | Jan 2020 | Feb- Jan |
|---|---|---|---|---|---|---|---|---|---|---|---|---|---|
| Chuuk | 122% | 175% | 48% | 42% | 125% | 97% | 125% | 135% | 48% | 87% | 177% | 81% | 99% |
| Guam NAS | 228% | 39% | 45% | 77% | 46% | 46% | 135% | 166% | 93% | 214% | 29% | 75% | 92% |
| Kapingamarangi | 44% | 197% | 127% | 169% | 172% | 110% | 124% | 55% | 142% | 229% | 67% | 83% | 114% |
| Koror | 40% | 84% | 94% | 57% | 93% | 81% | 140% | 74% | 118% | 99% | 88% | 20% | 78% |
| Kosrae | 98% | 143% | 137% | 152% | 103% | 62% | 117% | 69% | 98% | 98% | 62% | 51% | 84% |
| Kwajalein | 183% | 52% | 22% | 159% | 69% | 48% | 104% | 92% | 94% | 111% | 99% | 112% | 89% |
| Lukonor | 71% | 103% | 126% | 32% | 127% | 104% | 96% | 63% | 51% | 66% | 91% | 27% | 72% |
| Majuro | 74% | 102% | 35% | 160% | 103% | 64% | 109% | 105% | 117% | 110% | 114% | 90% | 99% |
| Pago Pago | 200% | 107% | 108% | 154% | 117% | 316% | 160% | 81% | 105% | 74% | 140% | 163% | 124% |
| Pohnpei | 79% | 143% | 66% | 45% | 159% | 101% | 110% | 155% | 138% | 168% | 132% | 57% | 108% |
| Saipan | 59% | 28% | 35% | 243% | 58% | 76% | 140% | 218% | 169% | 126% | 95% | 60% | 125% |
| Yap | 30% | 107% | 52% | 91% | 109% | 81% | 78% | 65% | 70% | 105% | 116% | 23% | 76% |
| Station Name | Feb 2019 | Mar 2019 | Apr 2019 | May 2019 | Jun 2019 | Jul 2019 | Aug 2019 | Sep 2019 | Oct 2019 | Nov 2019 | Dec 2019 | Jan 2020 | Feb- Jan |
|---|---|---|---|---|---|---|---|---|---|---|---|---|---|
| Chuuk | 8.87" | 14.56" | 6.00" | 4.74" | 14.62" | 11.65" | 16.13" | 15.81" | 5.55" | 9.26" | 19.91" | 8.20" | 135.3" |
| Guam NAS | 6.90" | 0.81" | 1.15" | 2.61" | 2.85" | 4.63" | 19.92" | 21.03" | 10.59" | 15.76" | 1.46" | 2.99" | 90.7" |
| Kapingamarangi | 4.06" | 22.56" | 17.33" | 20.46" | 23.68" | 15.52" | 10.11" | 5.50" | 11.67" | 21.27" | 6.55" | 7.60" | 166.31" |
| Koror | 3.45" | 6.24" | 6.89" | 6.78" | 16.30" | 15.04" | 18.91" | 8.74" | 13.94" | 11.29" | 9.86" | 2.02" | 119.46" |
| Kosrae | 12.62" | 23.02" | 23.96" | 26.91" | 15.08" | 9.19" | 16.61" | 9.78" | 10.69" | 13.55" | 10.06" | 8.50" | 179.97" |
| Kwajalein | 4.82" | 1.22" | 1.14" | 10.71" | 4.76" | 4.77" | 10.10" | 9.89" | 10.53" | 12.52" | 6.62" | 3.53" | 80.61" |
| Lukonor | 6.33" | 9.58" | 14.30" | 3.75" | 14.80" | 16.63" | 13.47" | 6.44" | 5.79" | 6.01" | 10.23" | 2.26" | 109.59" |
| Majuro | 5.09" | 6.74" | 3.34" | 16.14" | 11.31" | 7.12" | 12.69" | 11.73" | 14.95" | 14.83" | 13.03" | 6.93" | 123.9" |
| Pago Pago | 24.04" | 11.47" | 10.17" | 14.91" | 6.24" | 17.54" | 8.60" | 5.28" | 9.71" | 7.48" | 17.93" | 21.77" | 155.14" |
| Pohnpei | 7.57" | 18.84" | 12.23" | 8.94" | 23.56" | 15.64" | 15.74" | 19.47" | 21.01" | 24.91" | 21.17" | 7.52" | 196.6" |
| Saipan | 1.54" | 0.53" | 0.93" | 5.78" | 2.11" | 6.73" | 18.32" | 21.99" | 17.92" | 7.06" | 3.64" | 1.53" | 88.08" |
| Yap | 1.57" | 4.88" | 2.92" | 7.15" | 13.14" | 12.25" | 11.58" | 8.82" | 8.54" | 9.30" | 9.89" | 1.46" | 91.5" |
| Station Name | Feb 2019 | Mar 2019 | Apr 2019 | May 2019 | Jun 2019 | Jul 2019 | Aug 2019 | Sep 2019 | Oct 2019 | Nov 2019 | Dec 2019 | Jan 2020 | Feb- Jan |
|---|---|---|---|---|---|---|---|---|---|---|---|---|---|
| Chuuk | 7.25" | 8.32" | 12.47" | 11.30" | 11.66" | 11.98" | 12.86" | 11.71" | 11.51" | 10.61" | 11.25" | 10.10" | 136.77" |
| Guam NAS | 3.03" | 2.07" | 2.53" | 3.40" | 6.18" | 10.14" | 14.74" | 12.66" | 11.44" | 7.38" | 5.11" | 4.01" | 99.09" |
| Kapingamarangi | 9.27" | 11.43" | 13.64" | 12.08" | 13.78" | 14.15" | 8.13" | 9.93" | 8.19" | 9.27" | 9.84" | 9.15" | 145.85" |
| Koror | 8.56" | 7.44" | 7.32" | 11.83" | 17.48" | 18.53" | 13.50" | 11.77" | 11.84" | 11.39" | 11.16" | 10.18" | 152.90" |
| Kosrae | 12.93" | 16.06" | 17.51" | 17.75" | 14.64" | 14.91" | 14.22" | 14.22" | 10.94" | 13.83" | 16.11" | 16.67" | 213.87" |
| Kwajalein | 2.64" | 2.35" | 5.26" | 6.72" | 6.93" | 9.87" | 9.74" | 10.74" | 11.18" | 11.28" | 6.66" | 3.16" | 90.41" |
| Lukonor | 8.93" | 9.26" | 11.31" | 11.69" | 11.65" | 15.93" | 14.04" | 10.15" | 11.32" | 9.08" | 11.27" | 8.41" | 151.36" |
| Majuro | 6.88" | 6.58" | 9.42" | 10.11" | 11.01" | 11.17" | 11.69" | 11.17" | 12.73" | 13.44" | 11.39" | 7.74" | 125.25" |
| Pago Pago | 12.00" | 10.68" | 9.39" | 9.66" | 5.33" | 5.55" | 5.38" | 6.53" | 9.26" | 10.14" | 12.84" | 13.34" | 125.57" |
| Pohnpei | 9.55" | 13.17" | 18.41" | 19.96" | 14.81" | 15.43" | 14.26" | 12.55" | 15.27" | 14.83" | 16.08" | 13.18" | 182.36" |
| Saipan | 2.59" | 1.89" | 2.63" | 2.38" | 3.62" | 8.91" | 13.13" | 10.09" | 10.62" | 5.61" | 3.85" | 2.53" | 70.25" |
| Yap | 5.19" | 4.56" | 5.63" | 7.85" | 12.04" | 15.08" | 14.82" | 13.50" | 12.18" | 8.83" | 8.51" | 6.39" | 120.31" |
As measured by percent of normal precipitation, Koror, Kosrae, Lukonor, and Yap were drier than normal in the short term (January and the last 3 months [November 2019-January 2020]) and long term (last 12 months [February 2019-January 2020]). Saipan was drier than normal in the short-term but wetter than normal in the long-term. Chuuk, Kapingamarangi, Majuro, and Pohnpei were drier for January but near to wetter than normal for the other two time periods. Guam was drier than normal for January and the last 12 months, but wetter than normal for the last 3 months. Kwajalein was drier than normal for the long-term but near to wetter than normal for the short-term. Pago Pago was wetter than normal at all three time periods. It should be noted that the monthly normal precipitation amount can vary significantly from month to month due to the strong seasonality of equatorial Pacific precipitation resulting from the seasonal migration of the Inter-Tropical Convergence Zone (ITCZ).
 Percent of normal precipitation map for December 2019-January 2020 for the Marianas Islands.
|
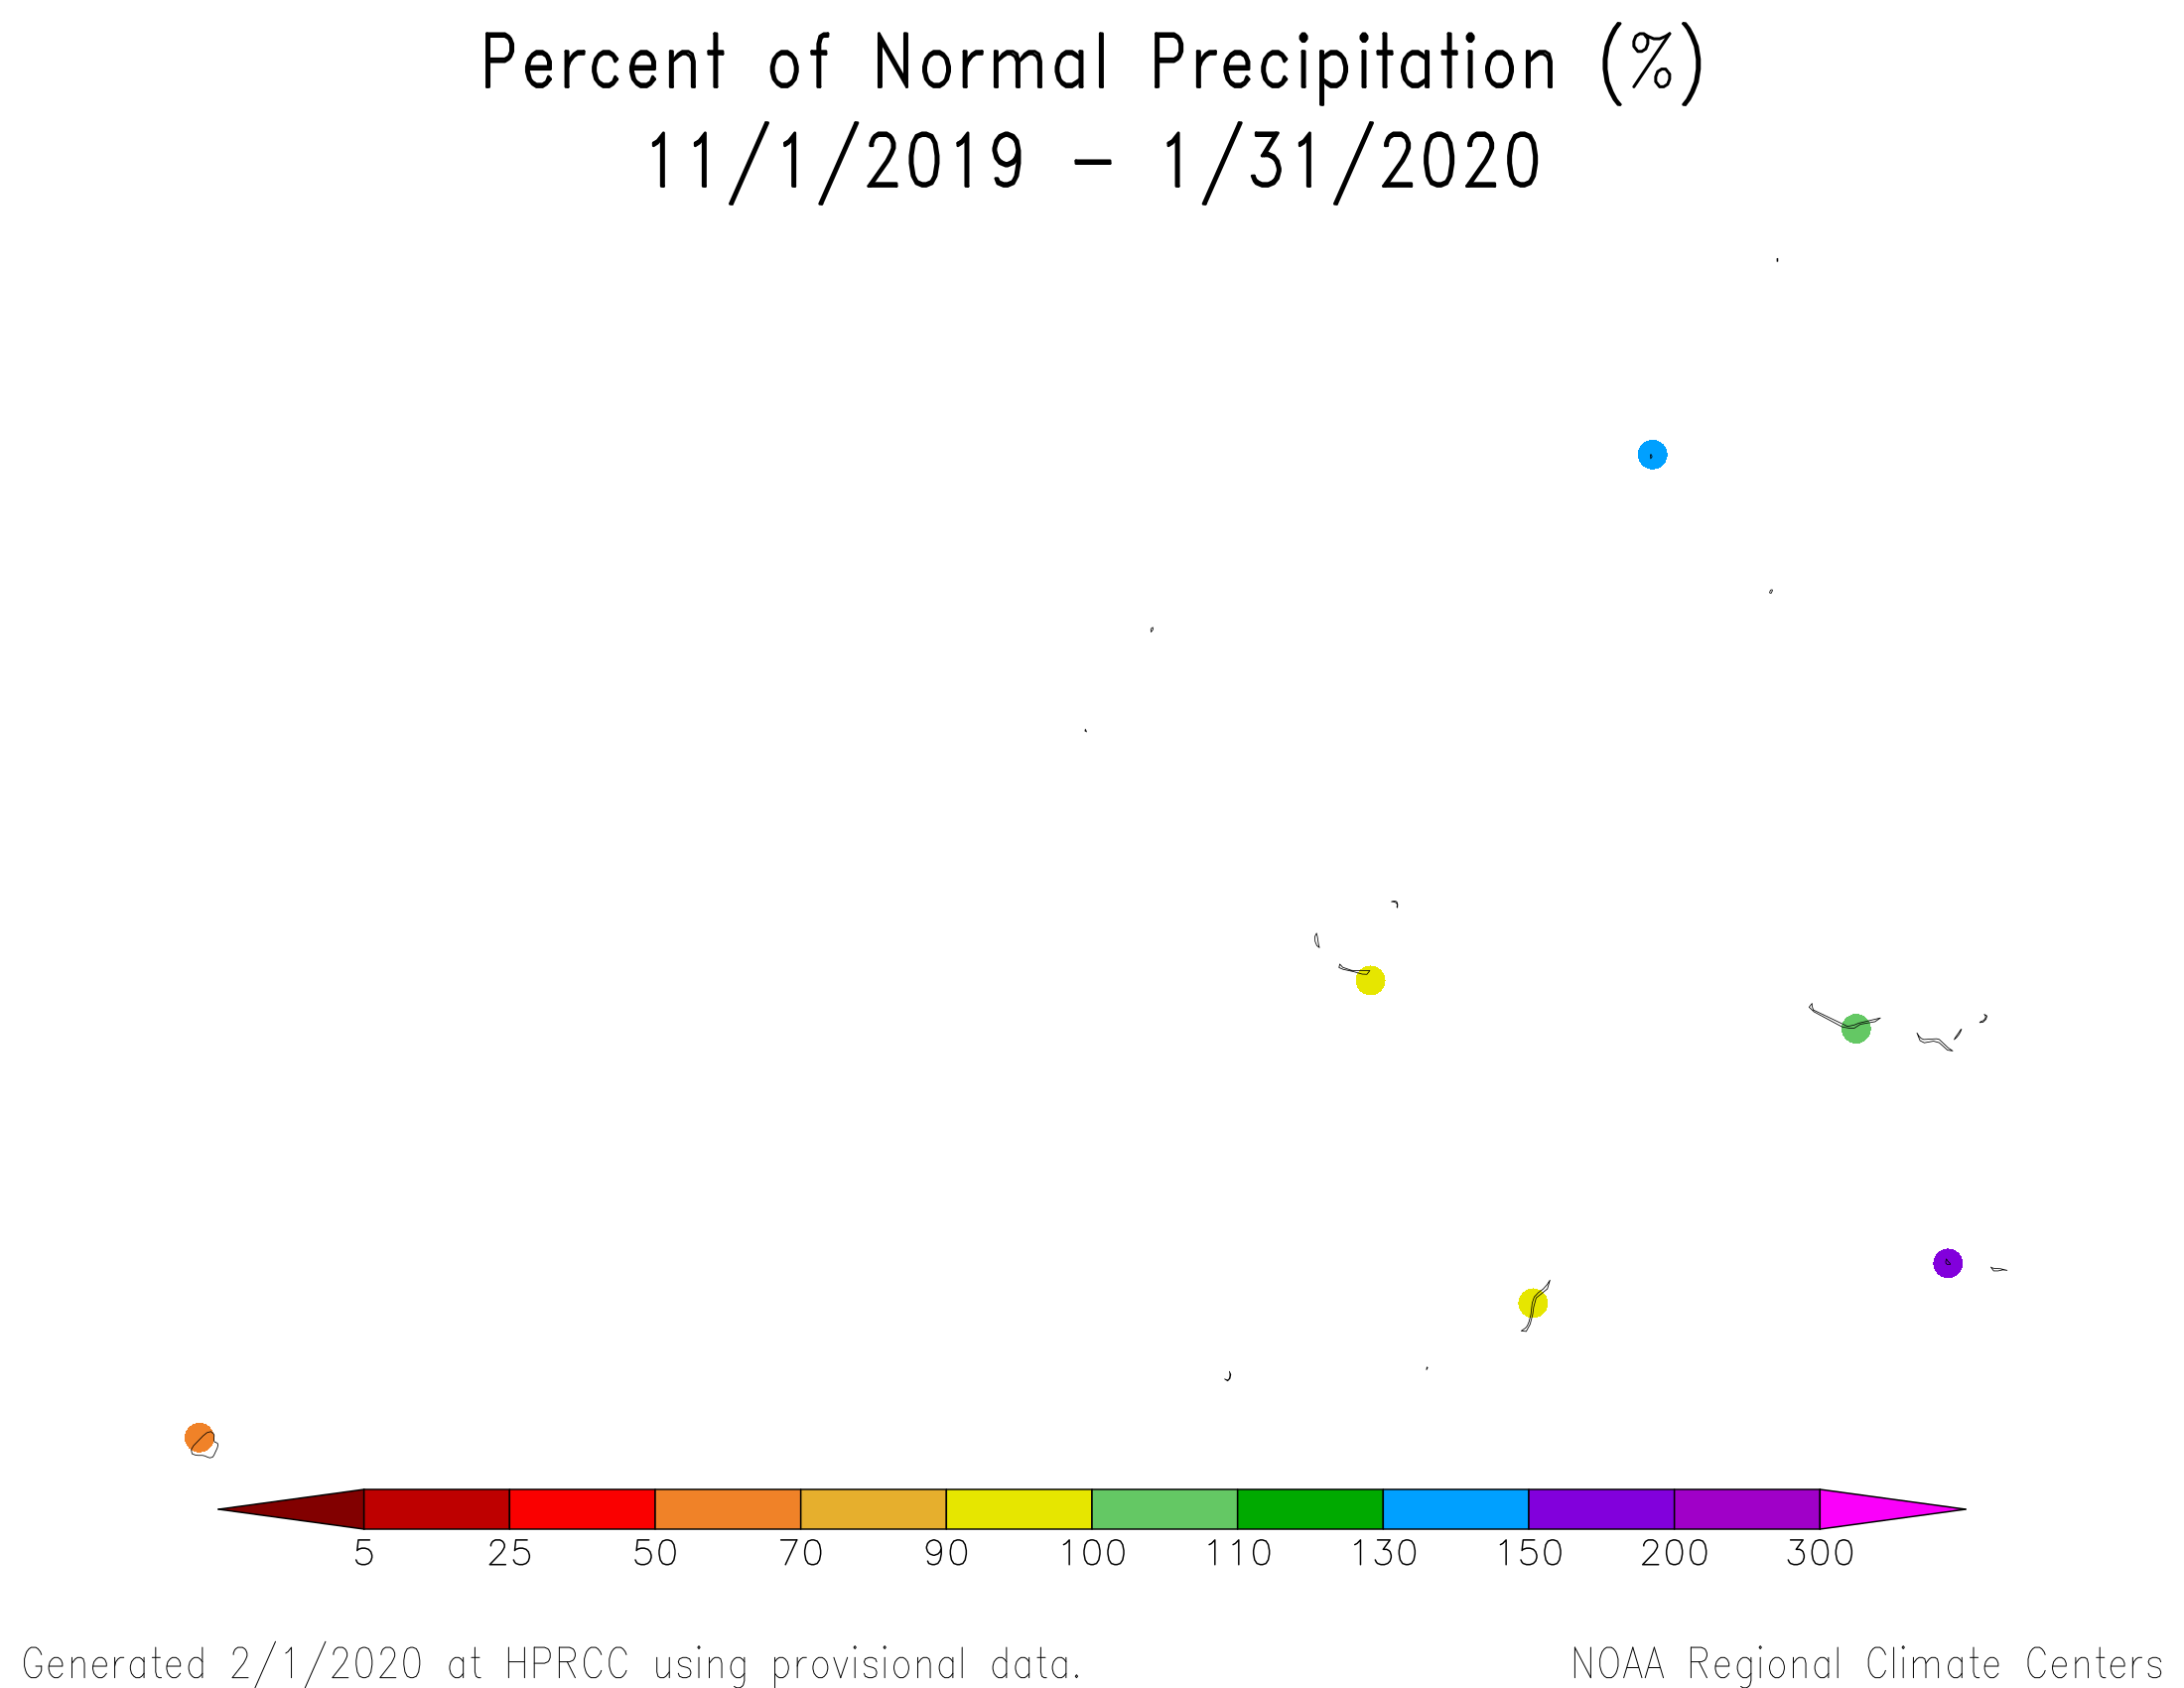
 Percent of normal precipitation map for February 2019-January 2020 for the Marshall Islands.
|
In the Marianas Islands, precipitation was drier than normal regionwide for January and the last 2 months. The northern stations were drier than normal for the last 3 to 4 months, with above-normal precipitation widespread at the 6- to 7-month time scales. The anomaly pattern was mostly mixed for the other time periods (percent of normal precipitation maps for the last 1, 2, 3, 4, 6, 7, 9, 10, 12, 24, 36, 48, 60 months). In the Marshall Islands, January and the last 2 months were mostly drier than normal. It was mostly drier than normal in the west and wetter than normal in the east for the last 3 to 12 months, with a mixed pattern continuing at longer time scales (percent of normal precipitation maps for the last 1, 2, 3, 4, 6, 7, 9, 10, 12, 24, 36, 48 months).

The USAPI U.S. Drought Monitor drought map valid for the end of January 2020.
According to the January 31st USDM produced for the USAPI, abnormal dryness (D0) had spread across the Marianas, Palau, most of the RMI, and part of the FSM (Yap, Woleai, and Lukonor), with moderate drought (D1) developing in Guam. Only one station in the RMI (Mili), several in the FSM, and Pago Pago were free of drought or abnormal dryness. Storage in the Majuro reservoirs fluctuated during January, ending the month at 24.06 million gallons, or about 67 percent of maximum, which is below the 80 percent threshold for concern.
The dry conditions in January 2020 in parts of Micronesia resulted in the driest January in the 69-year record at Koror; second driest January at Yap (in 69 years) and Lukonor (in 36 years); and third driest January (38 years) at Woleai. The dryness of January 2020, December 2019, and earlier months gave Lukonor the driest November-January through May-January, and third driest February-January (23 years); second driest February-January at Yap (68 years) and Woleai (24 years); and third driest February-January at Koror (67 years). December 2019-January 2020 was the second driest on record at Guam (63 years) and fourth driest on record at Kapingamarangi (26 years) and Kosrae (45 years). (It should be noted that there may have been an undercatch issue with Jaluit's rain gauge earlier in 2019.)
The following analysis of historical data for the USAPI stations in the Global Historical Climatology Network-Daily (GHCN-D) dataset, augmented with fill-in data from the 1981-2010 Normals, helps put the current data into historical perspective by computing ranks based on the period of record. The table below lists the precipitation ranks for January 2020, August 2019-January 2020 (last 6 months), and February 2019-January 2020 (the last 12 months). Some stations have a long period of record and their dataset is fairly complete, while other stations have a shorter period of record and the dataset has some missing data.
Rank of 1 = driest.
| Station | Jan 2020 Rank |
Jan No. of Years |
Aug 2019- Jan 2020 Rank |
Aug- Jan No. of Years |
Feb 2019- Jan 2020 Rank |
Feb- Jan No. of Years |
Period of Record |
| Pago Pago | 44 | 54 | 36 | 54 | 47 | 53 | 1966-2020 |
| Saipan | 7 | 40 | 32 | 32 | 29 | 31 | 1981-2020 |
| Kapingamarangi | 10 | 30 | 9 | 18 | 12 | 15 | 1962-2020 |
| Kosrae | 9 | 50 | 4 | 35 | 10 | 30 | 1954-2020 |
| Lukonor | 2 | 36 | 1 | 23 | 3 | 23 | 1981-2020 |
| Nukuoro | 25 | 38 | 14 | 36 | 10 | 35 | 1981-2020 |
| Pingelap | 9 | 37 | MSG | 34 | MSG | 33 | 1981-2020 |
| Ulithi | 31 | 36 | MSG | 34 | MSG | 33 | 1981-2020 |
| Woleai | 3 | 38 | 7 | 30 | 2 | 24 | 1968-2020 |
| Yap | 2 | 69 | 4 | 69 | 2 | 68 | 1951-2020 |
| Pohnpei | 13 | 69 | 63 | 69 | 45 | 68 | 1951-2020 |
| Chuuk | 29 | 69 | 39 | 69 | 27 | 68 | 1951-2020 |
| Guam | 21 | 63 | 48 | 63 | 21 | 62 | 1957-2020 |
| Koror | 1 | 69 | 14 | 68 | 3 | 67 | 1951-2020 |
| Ailinglapalap | 11 | 37 | 10 | 34 | 9 | 35 | 1981-2020 |
| Jaluit | 5 | 37 | 4 | 35 | 2 | 34 | 1981-2020 |
| Mili | 33 | 36 | 33 | 33 | 29 | 34 | 1981-2020 |
| Utirik | 18 | 22 | MSG | 9 | MSG | 4 | 1985-2020 |
| Wotje | 34 | 37 | 32 | 34 | 21 | 33 | 1981-2020 |
| Kwajalein | 35 | 68 | 22 | 68 | 10 | 67 | 1952-2020 |
| Majuro | 26 | 66 | 41 | 66 | 24 | 65 | 1954-2020 |


[top]
State/Regional/National Moisture Status
A detailed review of drought and moisture conditions is available for all contiguous U.S. states, the nine standard regions, and the nation (contiguous U.S.):
| northeast u. s. | east north central u. s. | central u. s. |
| southeast u. s. | west north central u. s. | south u. s. |
| southwest u. s. | northwest u. s. | west u. s. |
| Contiguous United States |
[top]
Contacts & Questions