|
Contents Of This Report: |


|
Please note that the values presented in this report are based on preliminary data. They will change when the final data are processed, but will not be replaced on these pages.
National Drought Overview
|
|
[top]
Detailed Drought Discussion
Overview
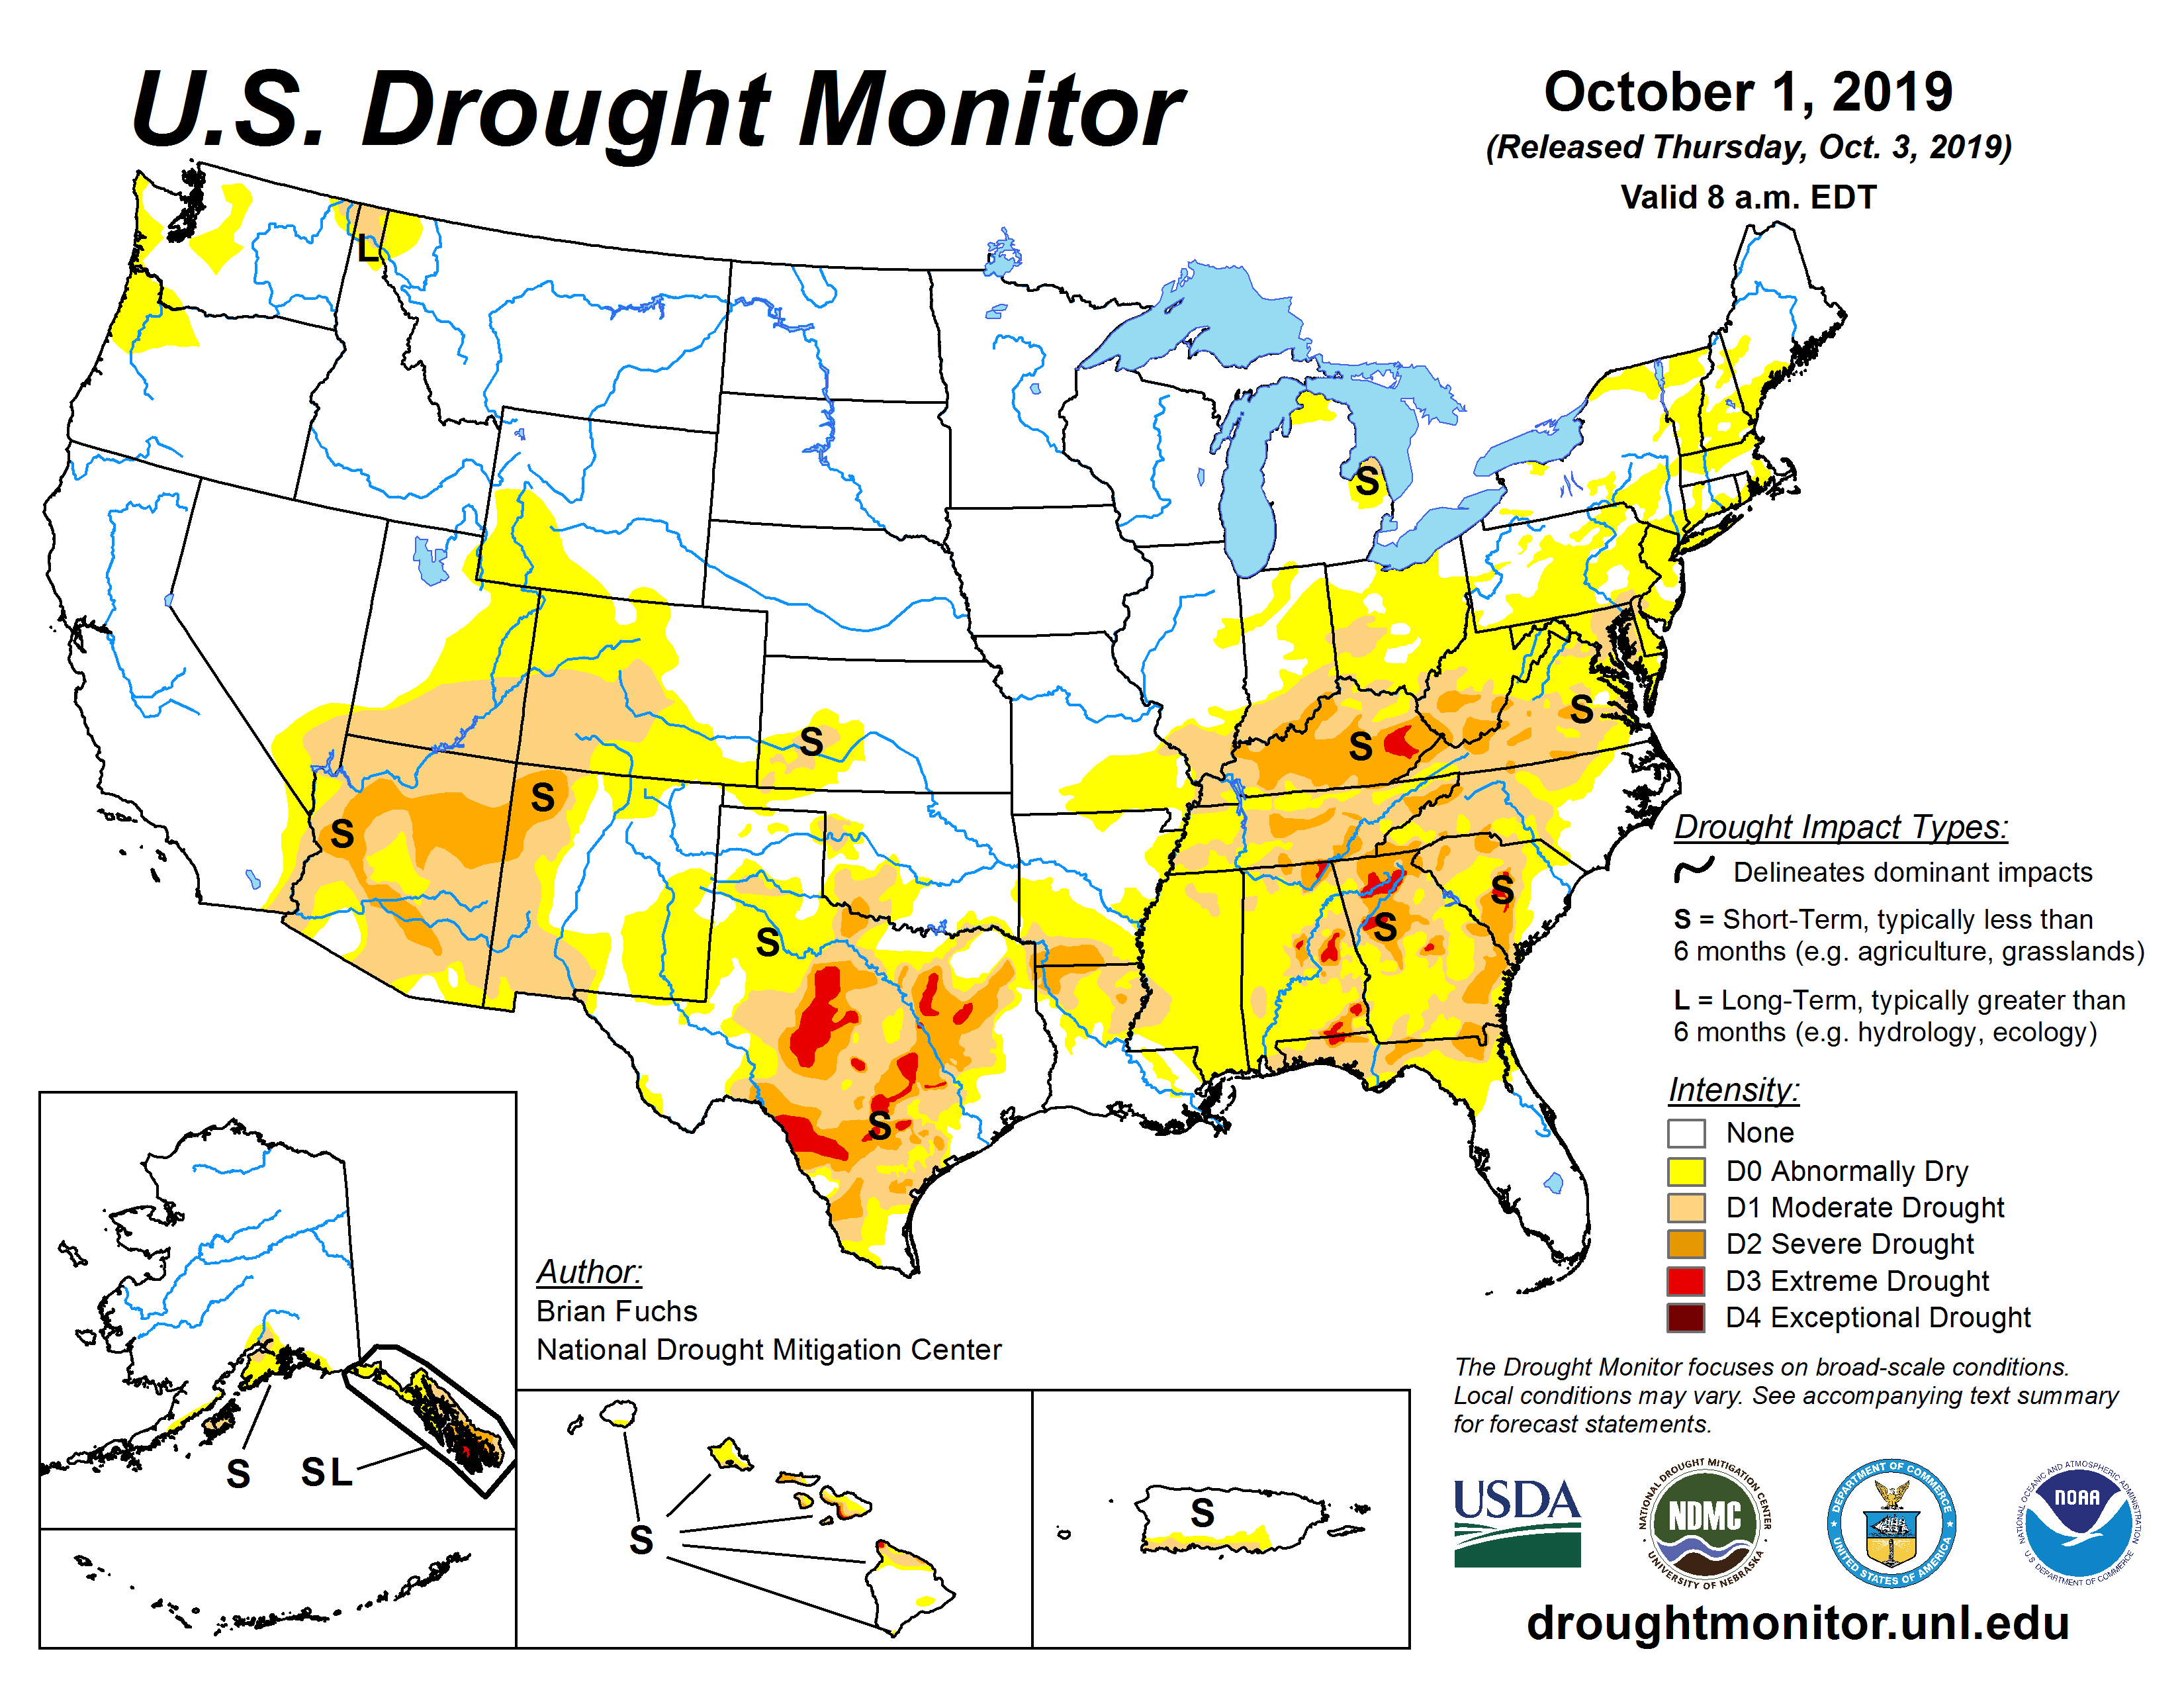
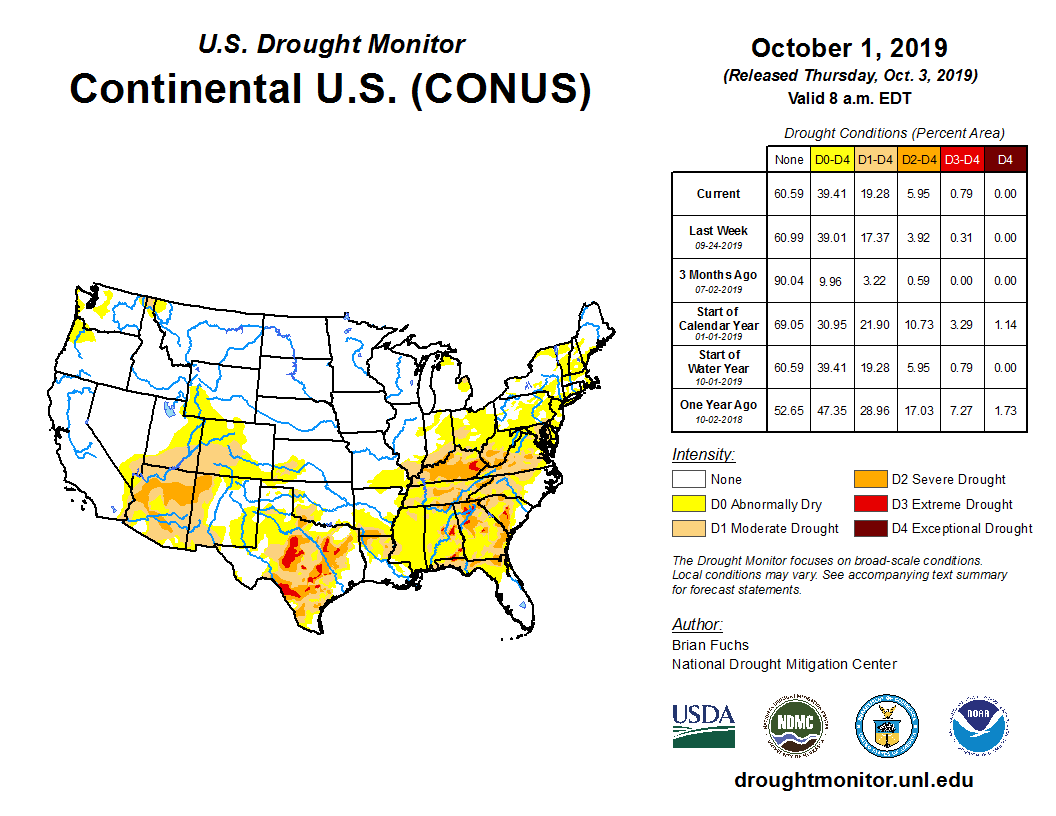
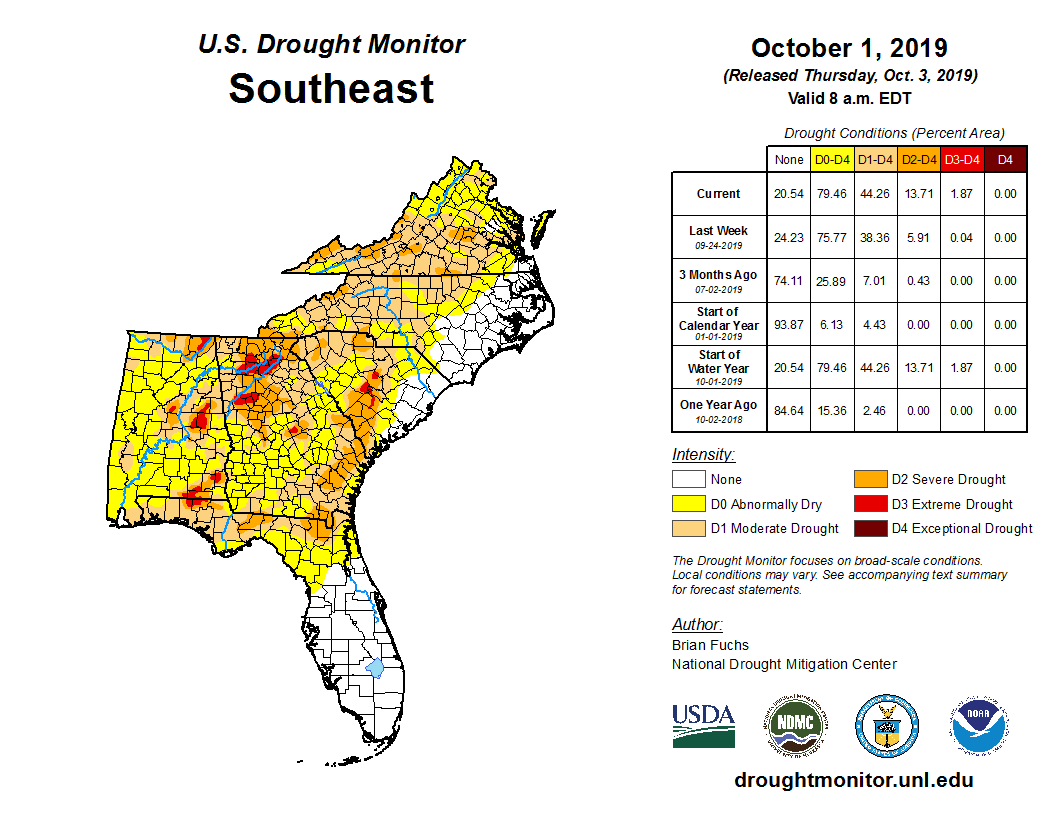
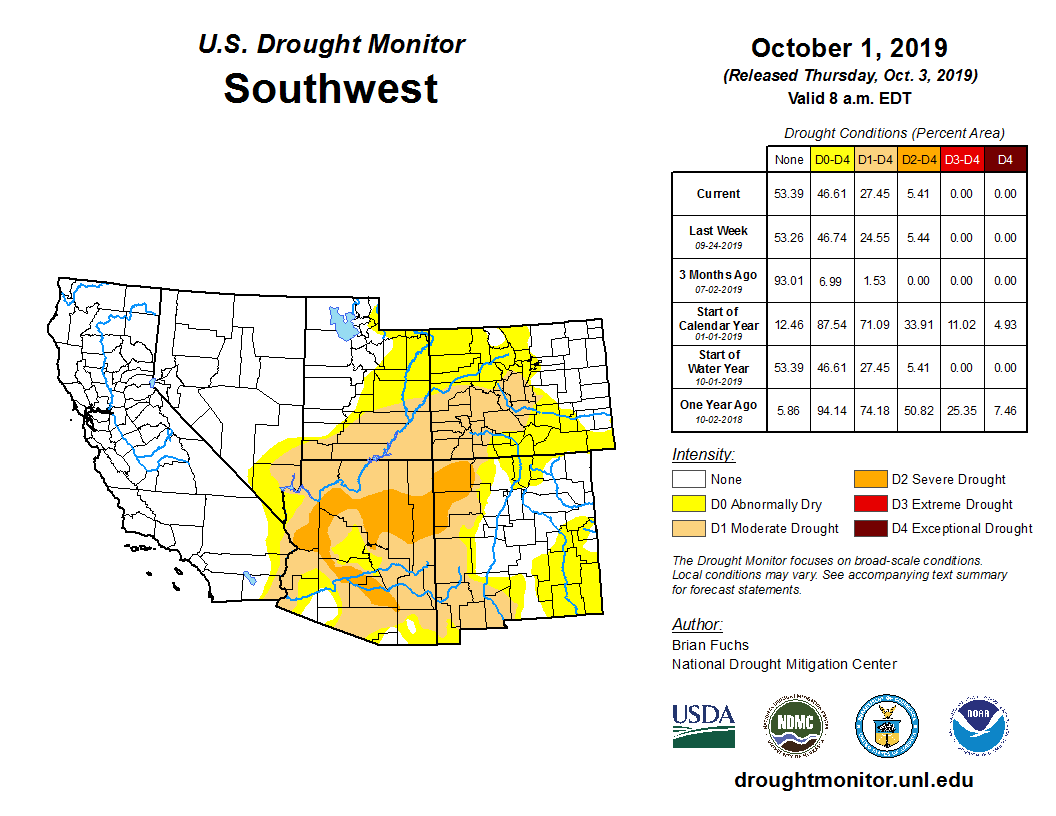
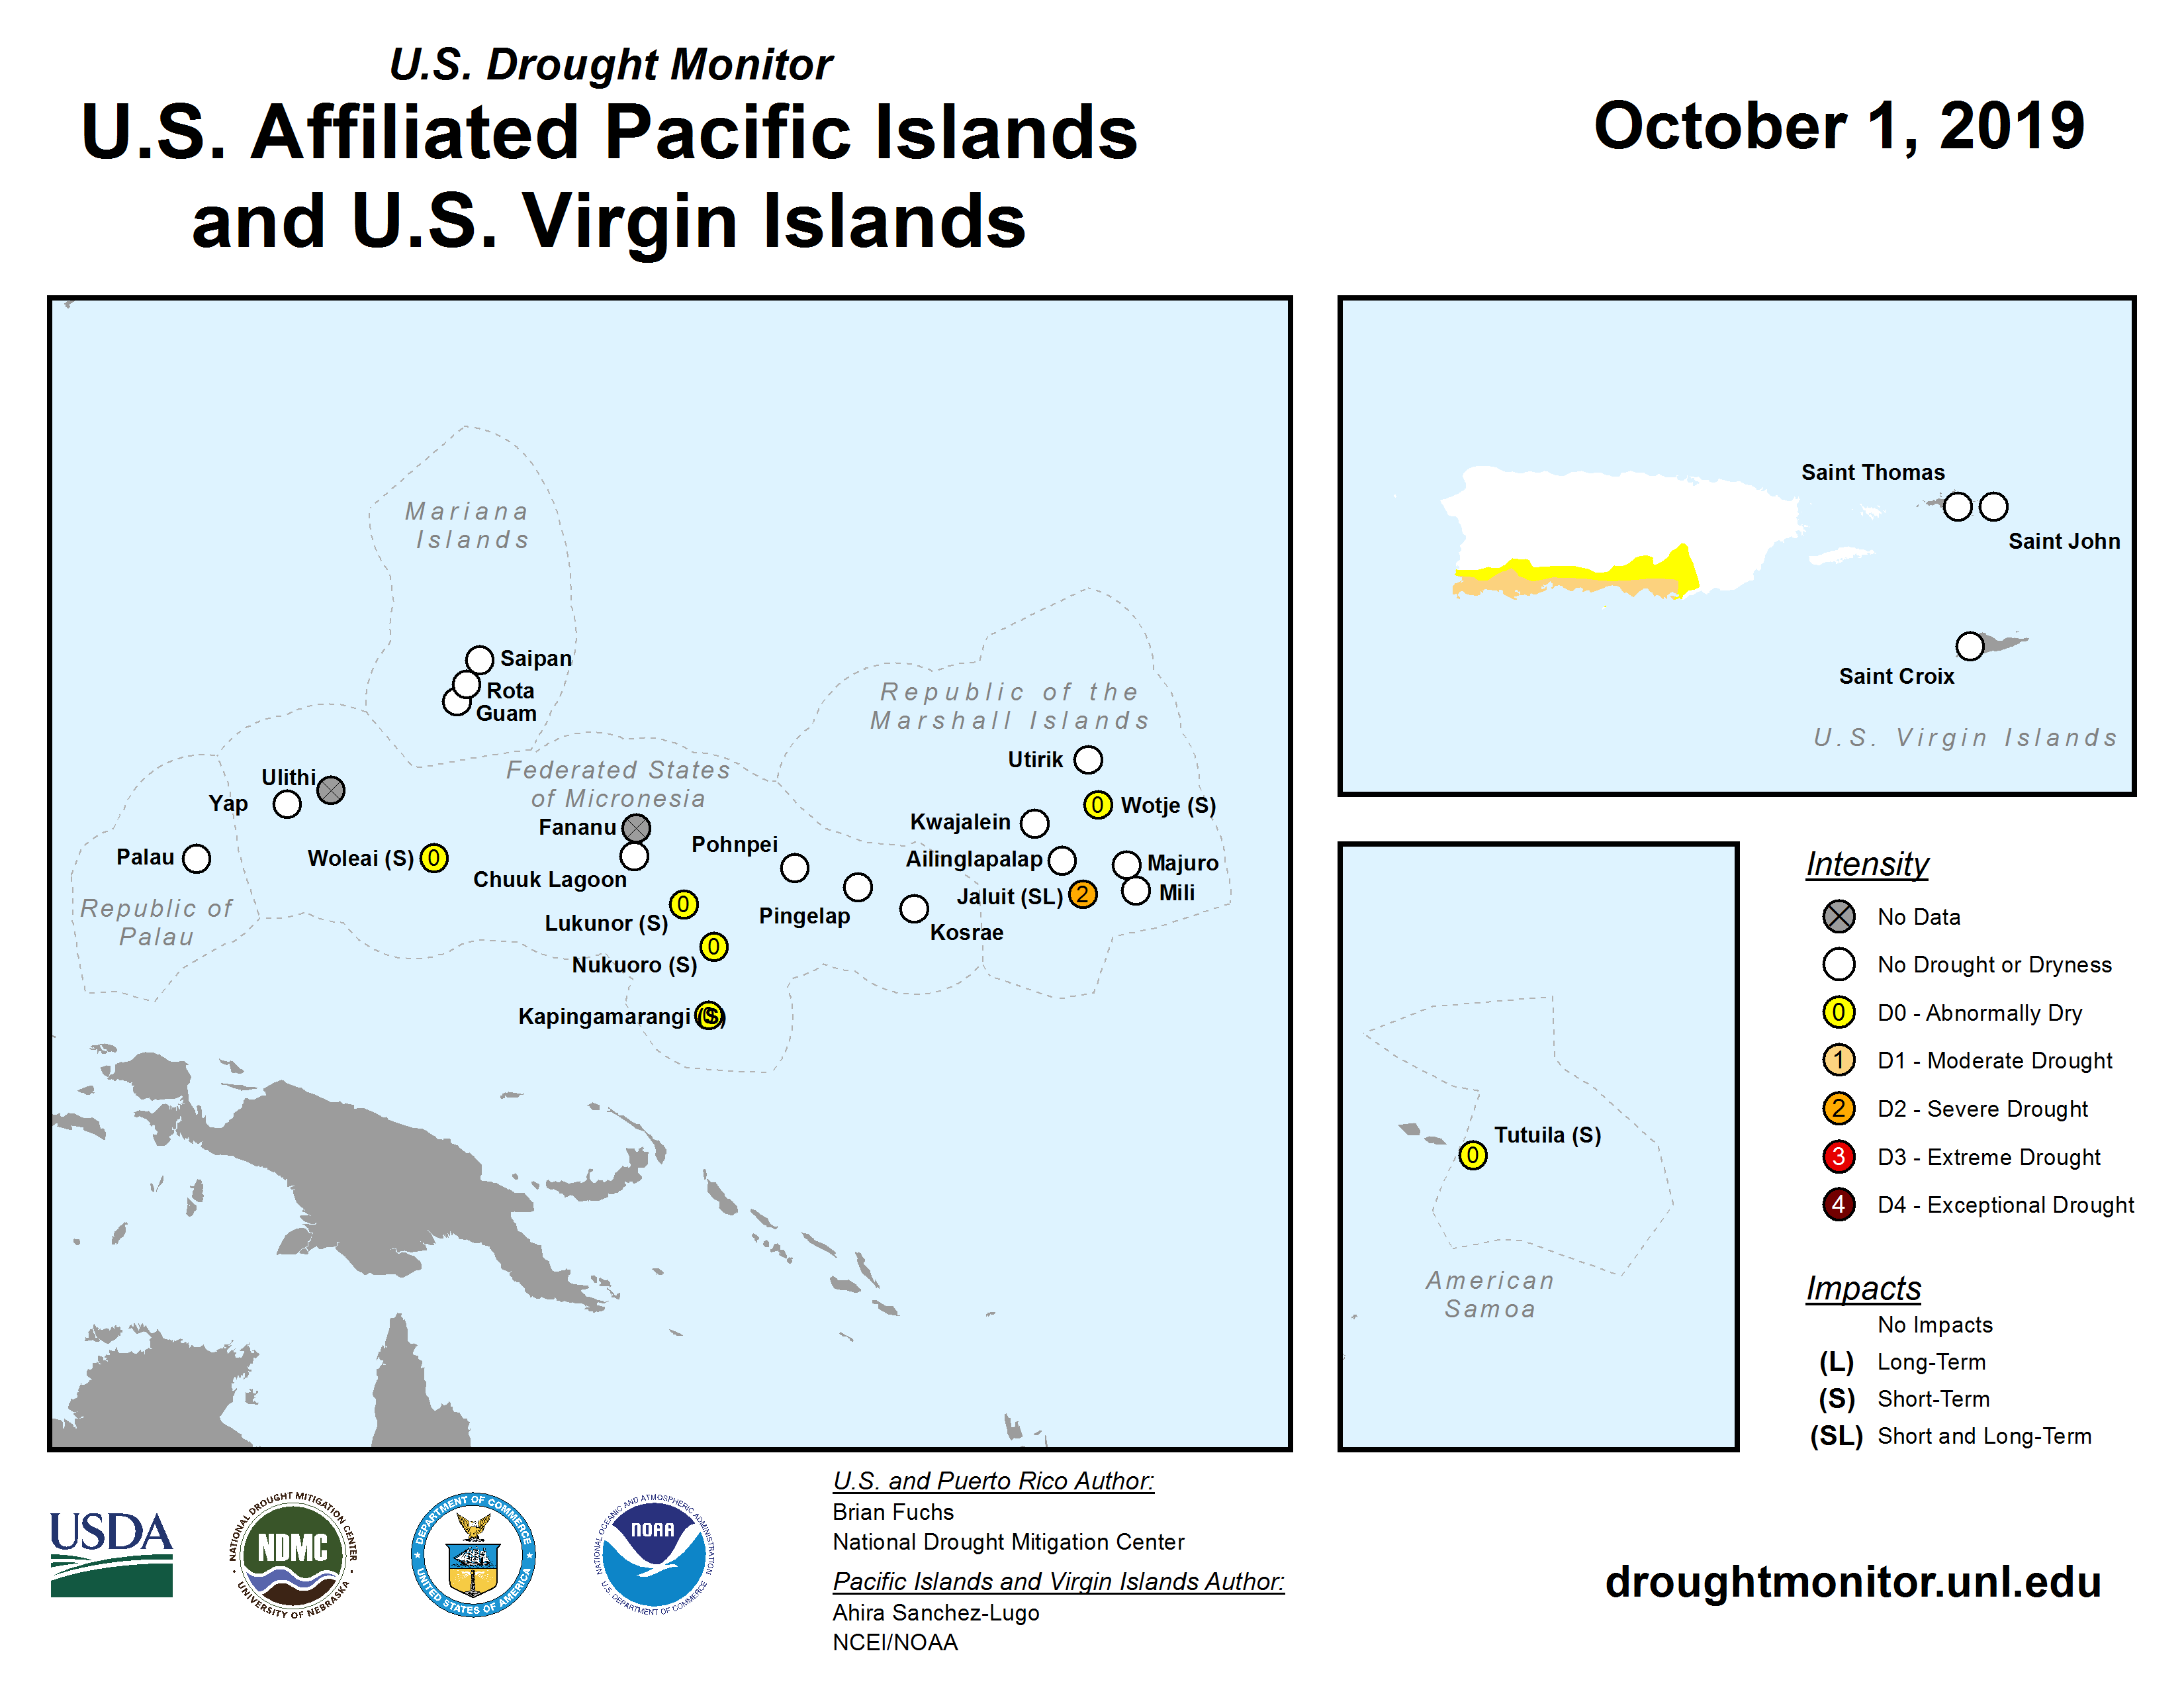
The U.S. Drought Monitor drought map valid October 1, 2019.
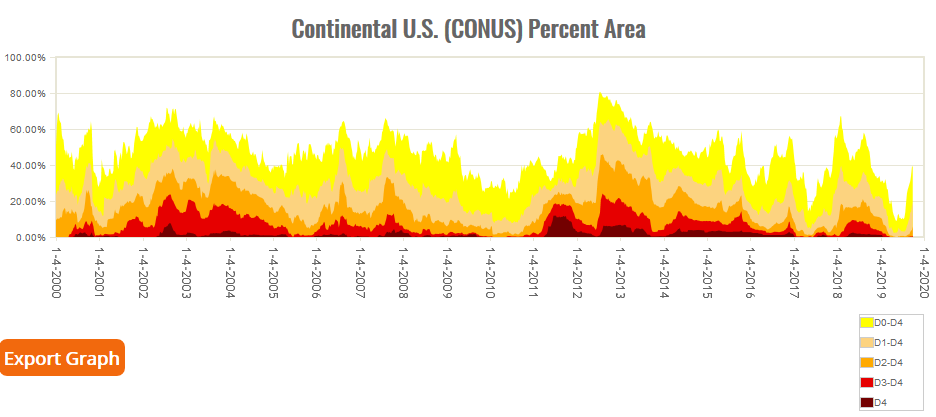
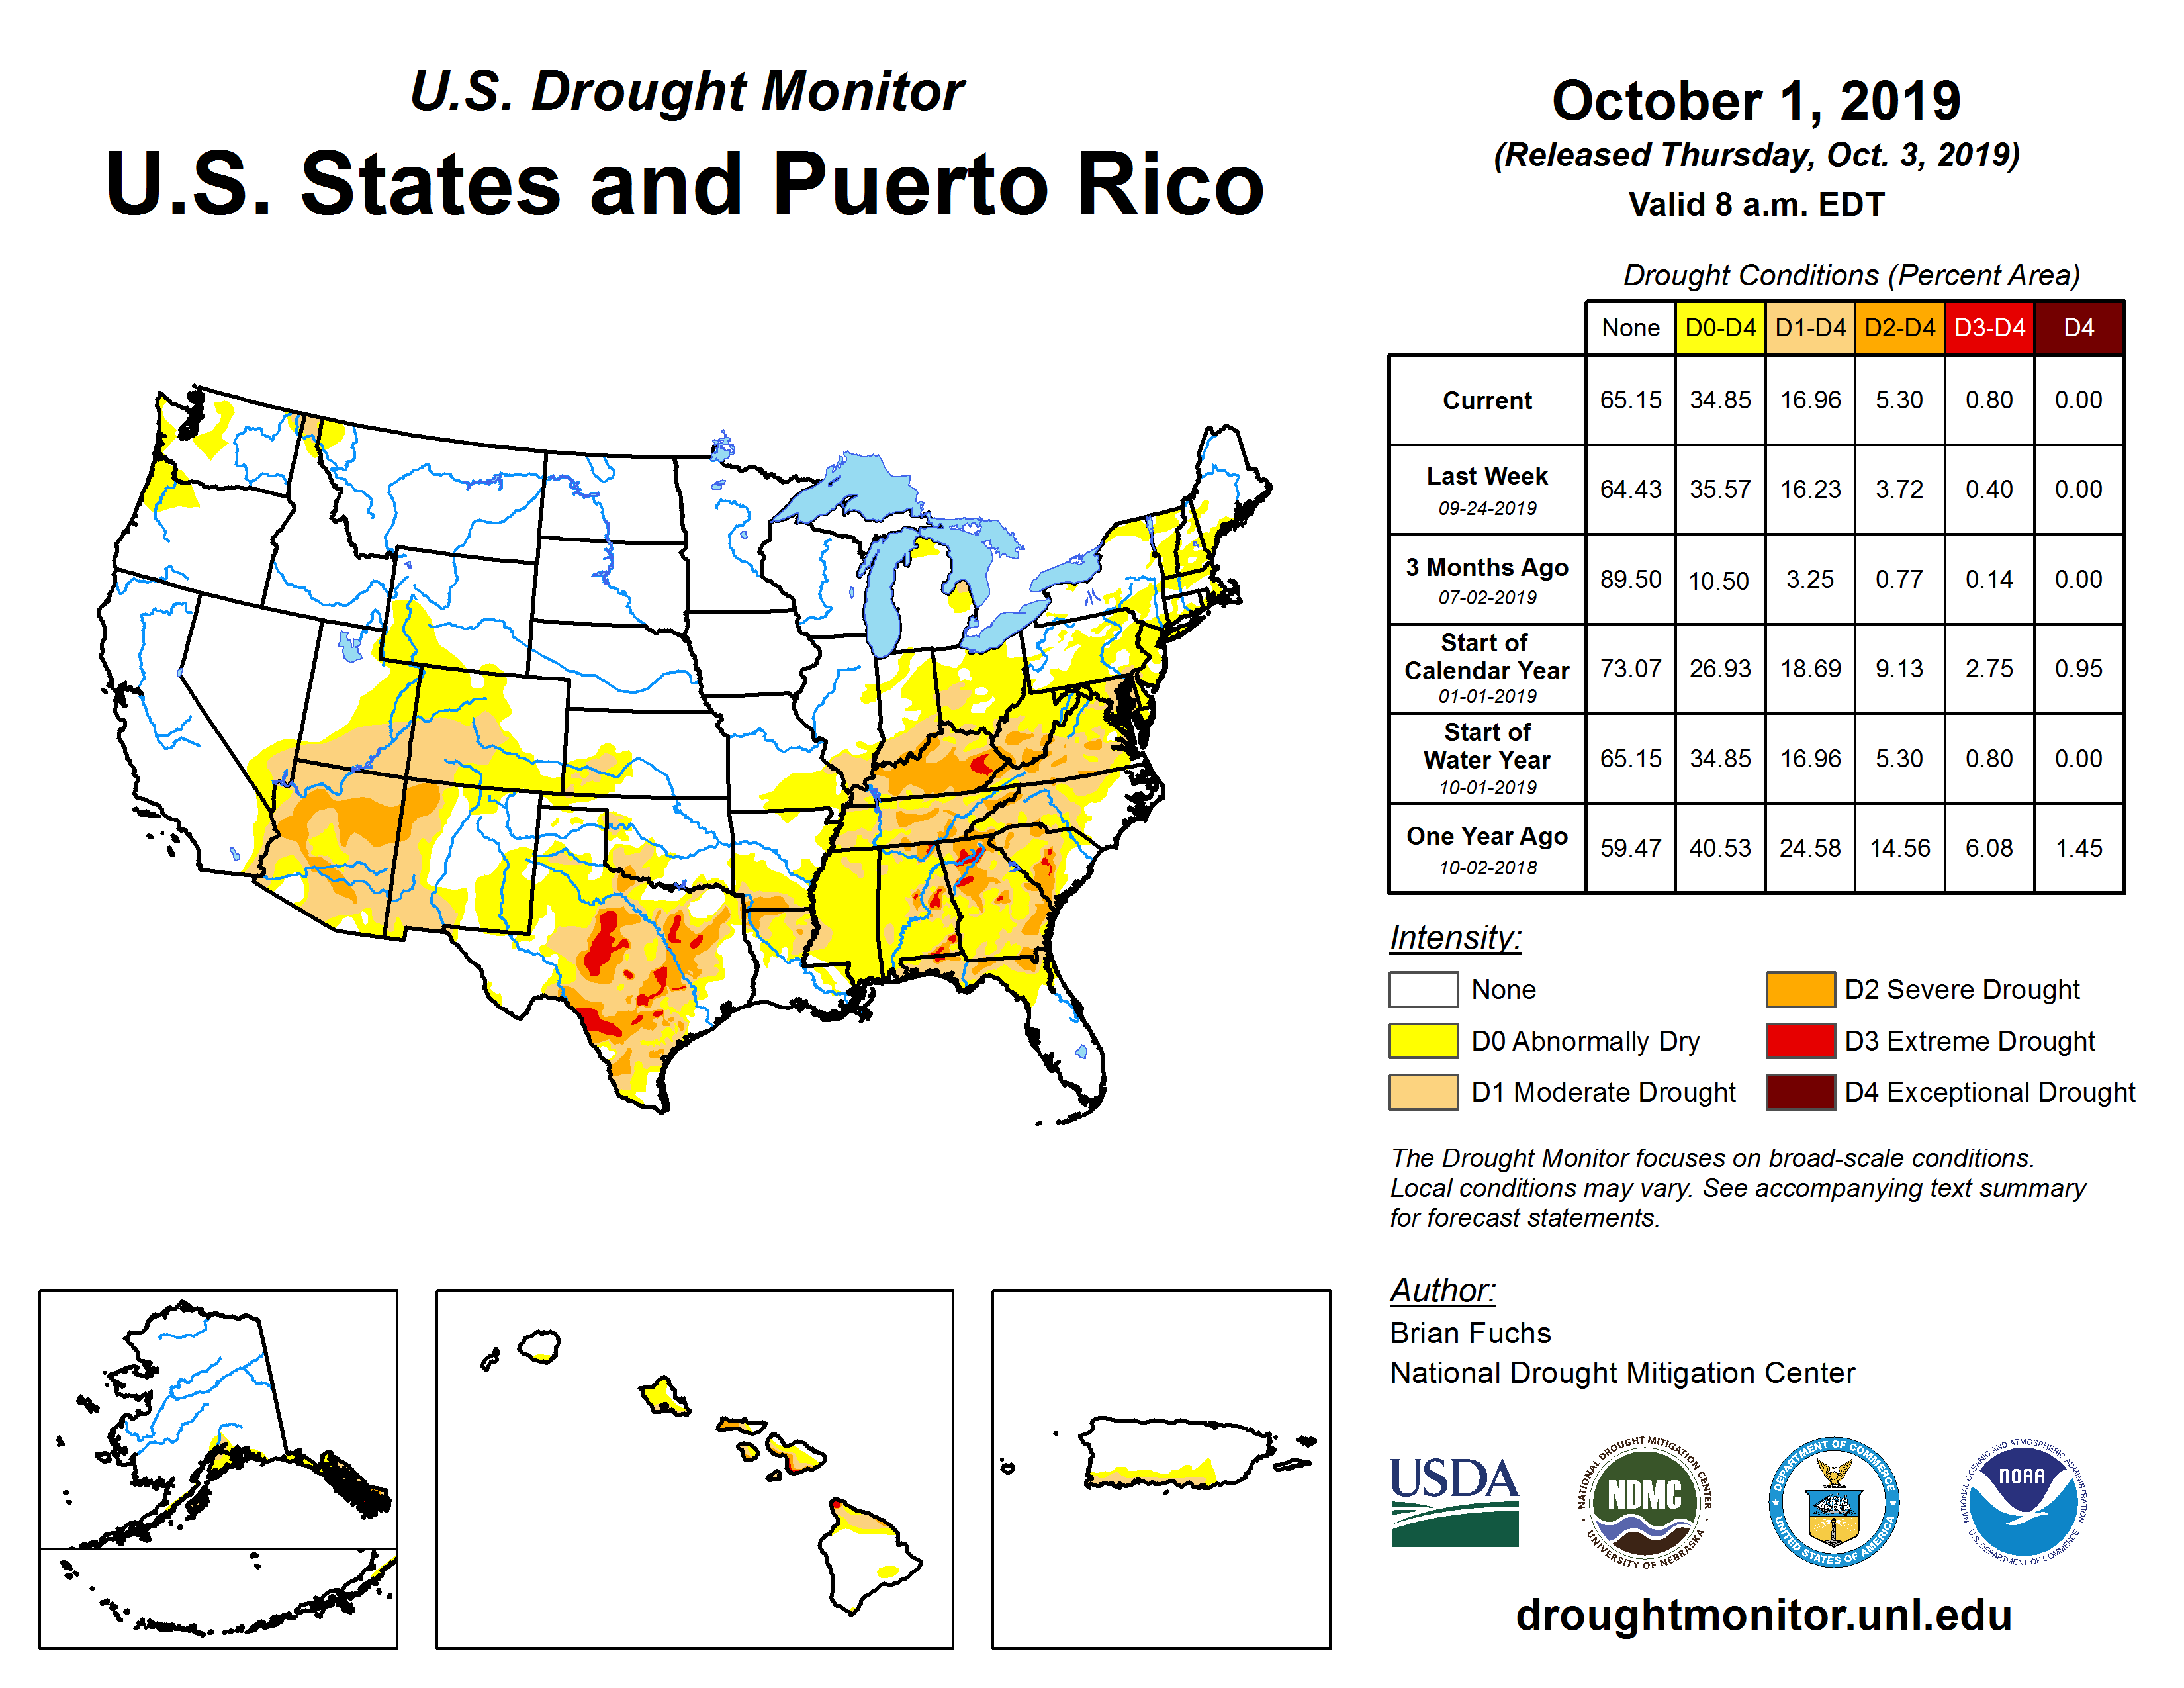
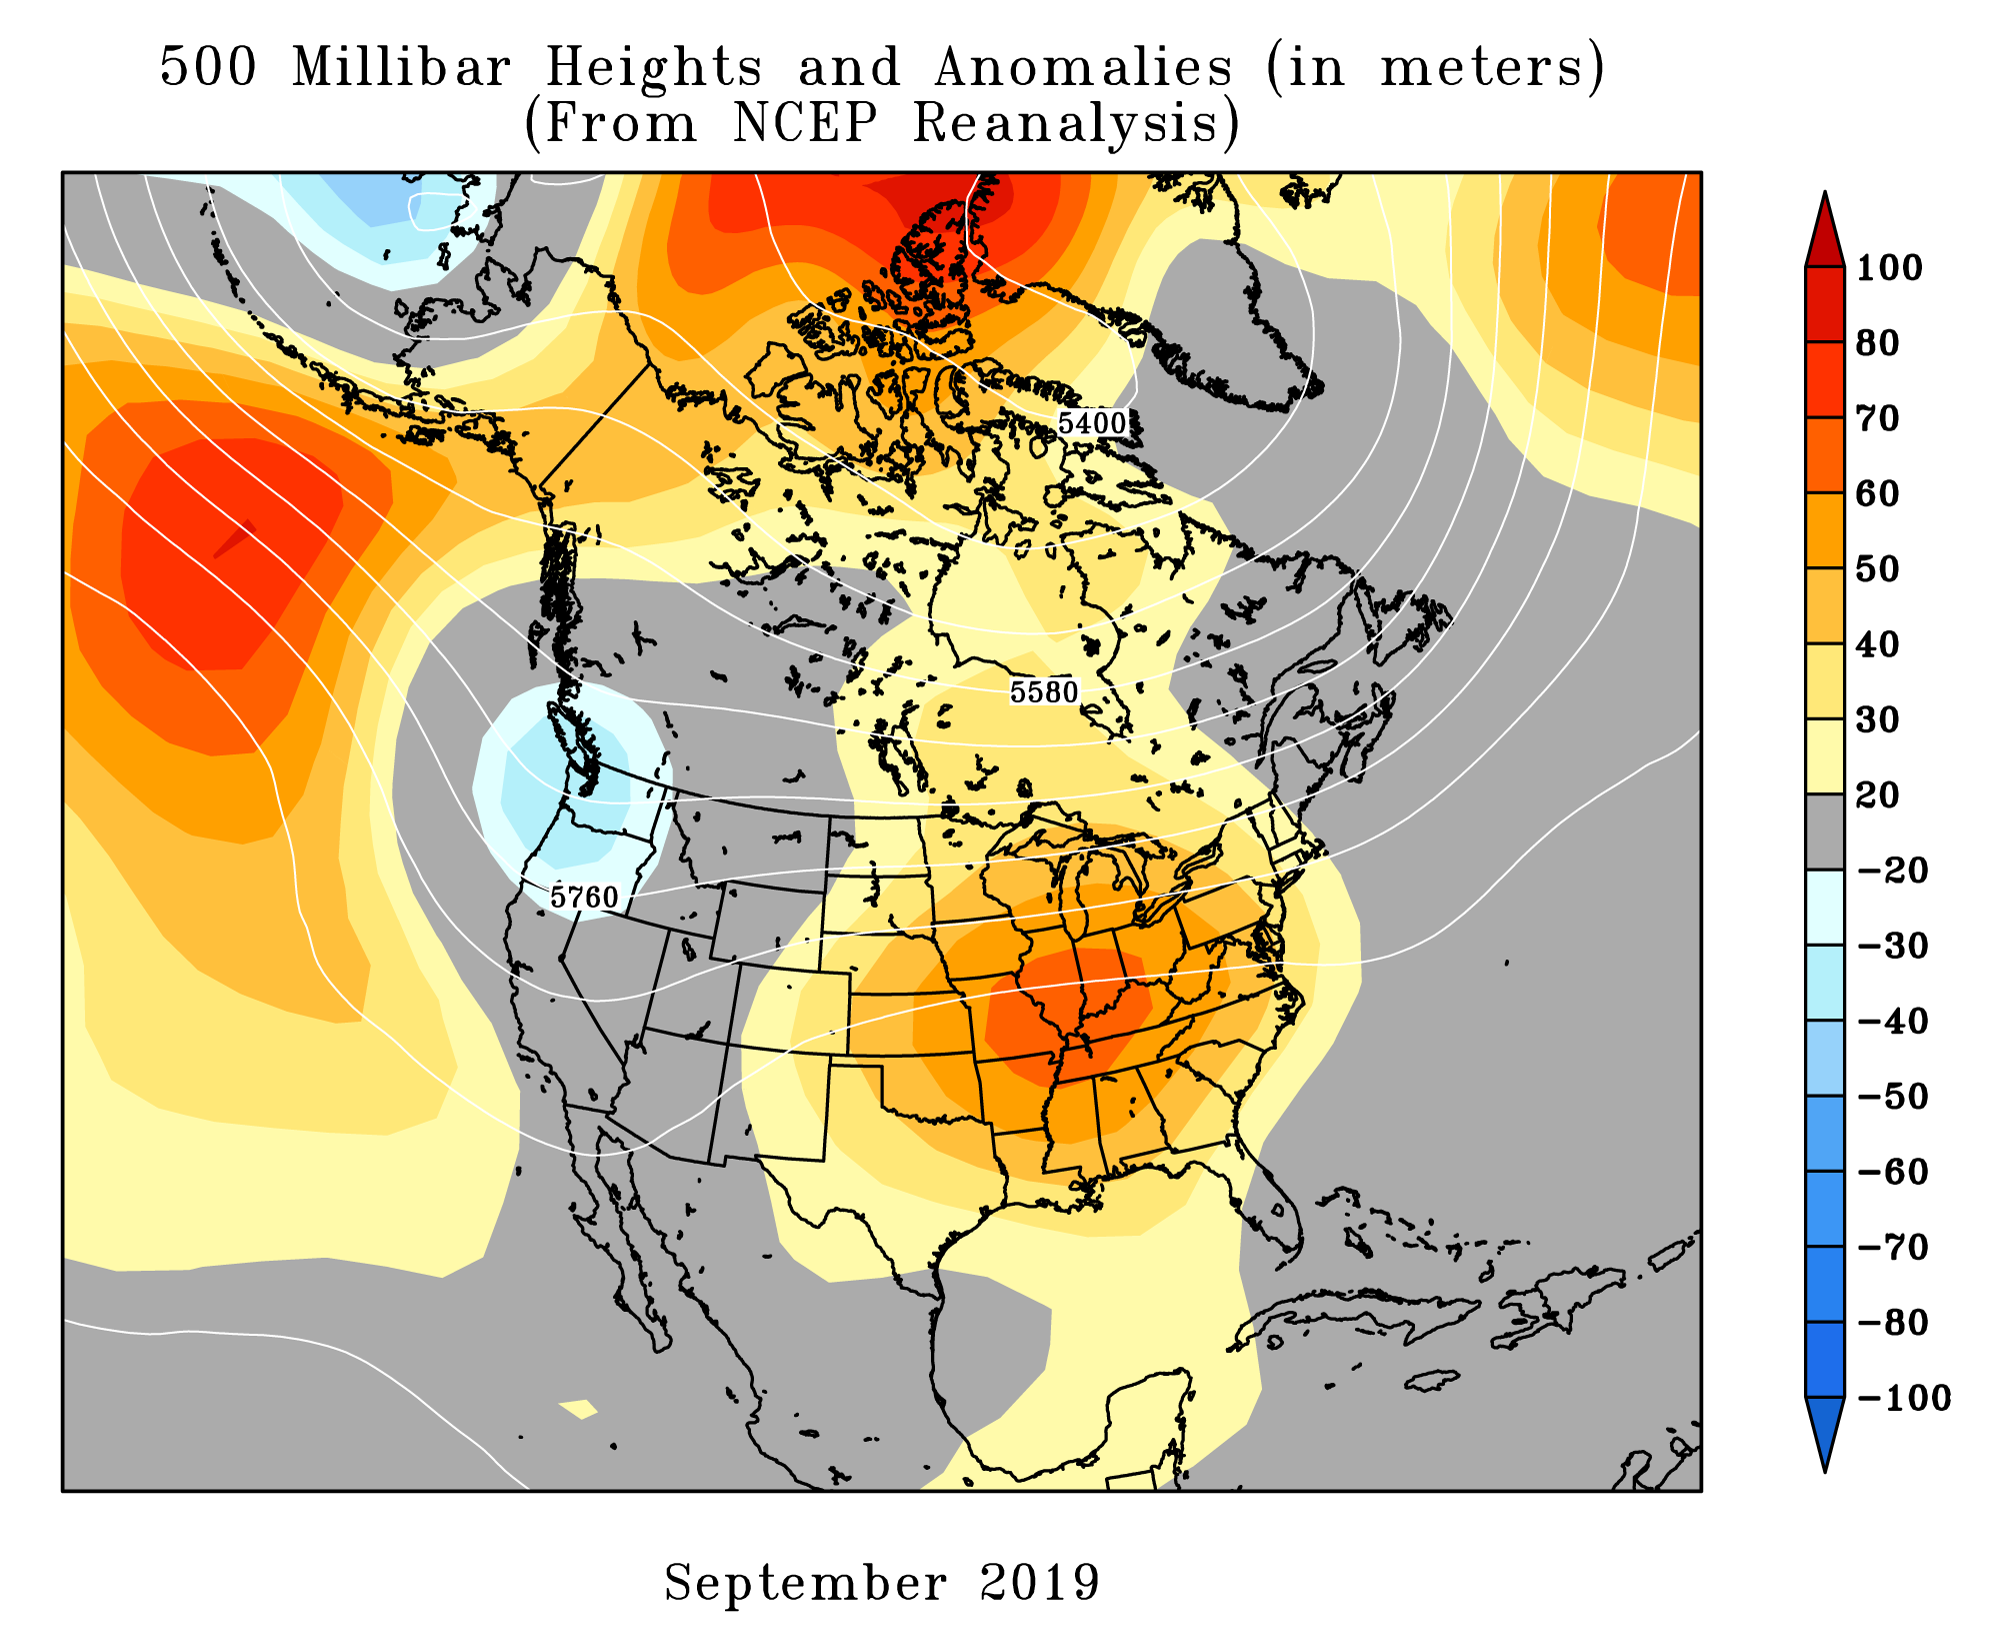
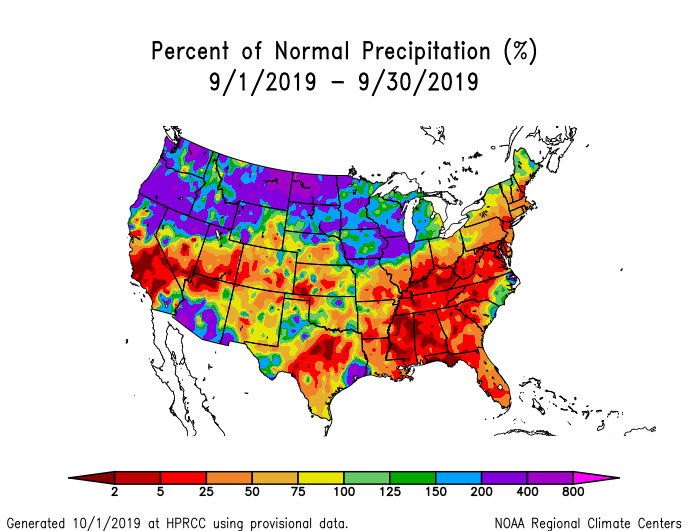
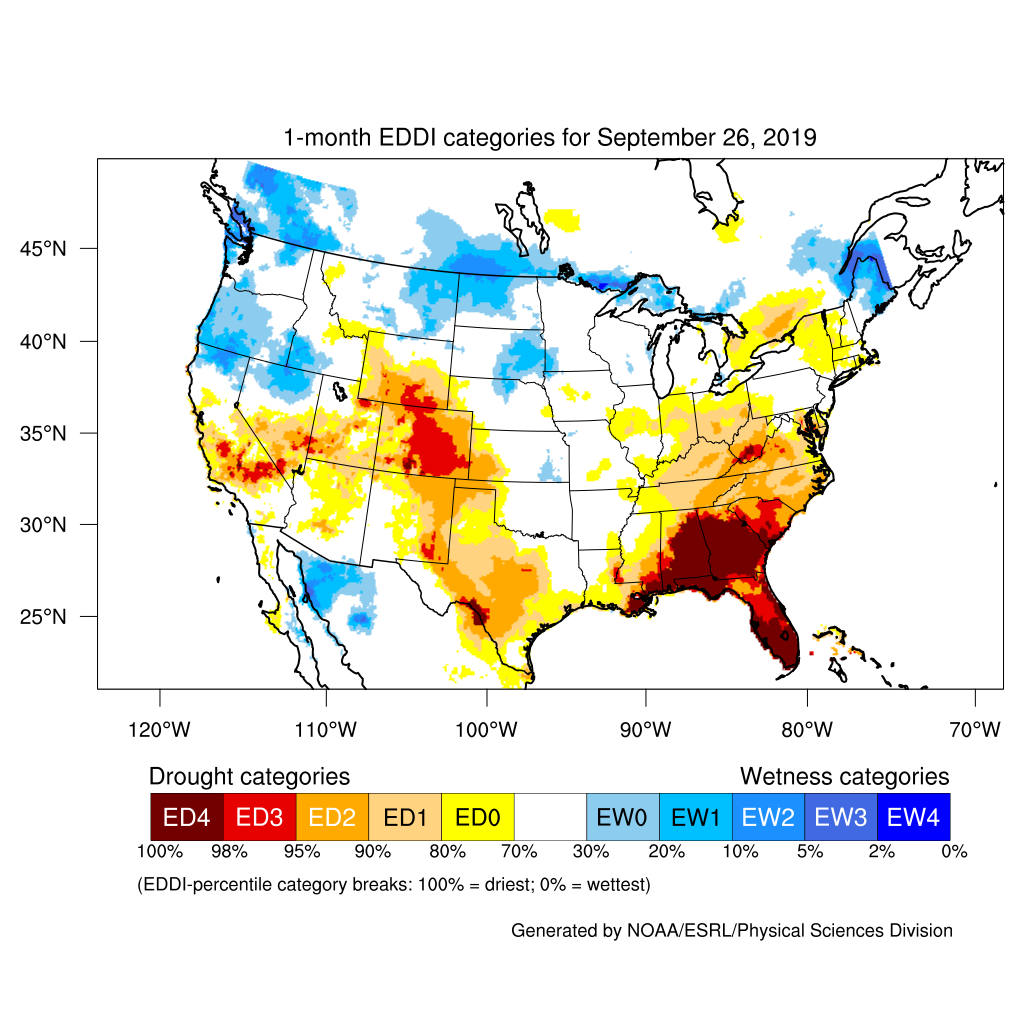
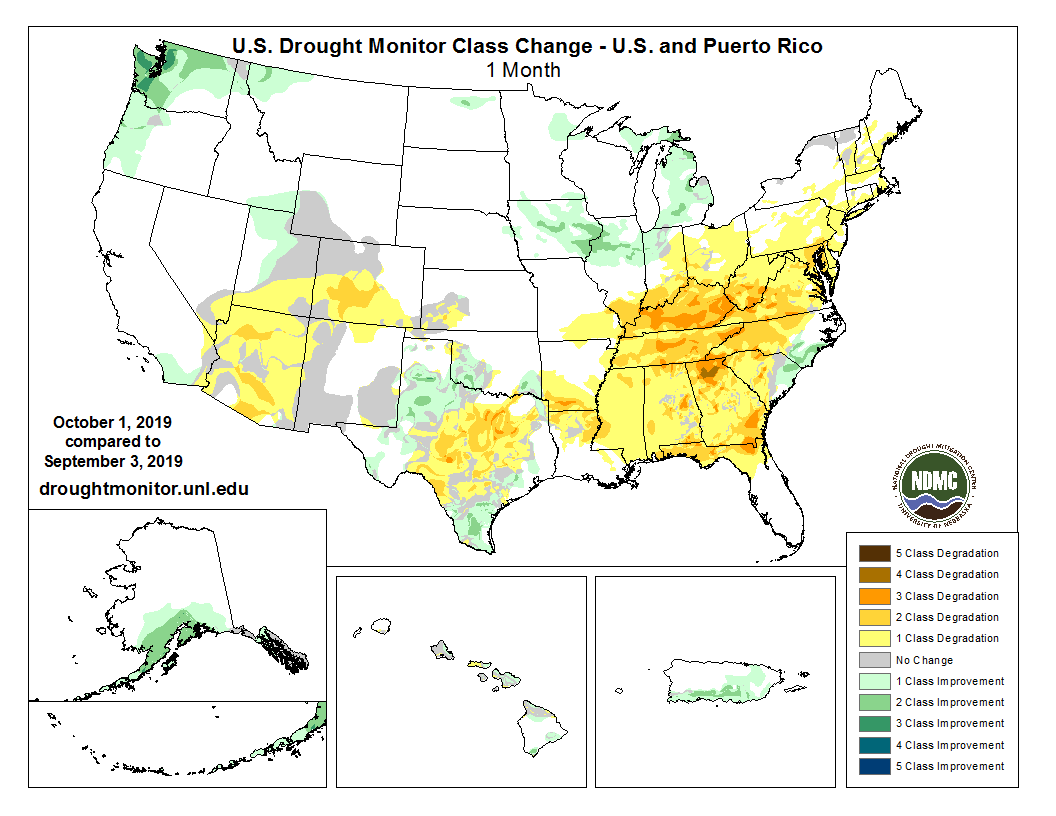
A high pressure ridge dominated the upper-level circulation over southern portions of the CONUS during September 2019, first over the Southwest for about a week then shifting to the Southeast for the rest of the month. Upper-level weather systems ("shortwave troughs") migrated through the jet stream flow along the northern tier of states, with a longwave trough eventually setting up over the western CONUS. When averaged across the month, a trough west/ridge east pattern was evident in the upper-level flow. At the surface, the eastern ridge manifested as an extension of the North Atlantic High (Bermuda High) westward into the eastern CONUS. The surface and upper-level high pressure over the eastern U.S. resulted in widespread subsidence (descending air) which kept skies clear and temperatures warm. Temperatures were warmer than normal and precipitation drier than normal across much of the CONUS east of the Rockies, with record hot and dry monthly conditions occurring in places, especially over the Ohio Valley to Southeast. A couple Atlantic tropical cyclones challenged the high pressure ridge — Hurricane Dorian brushed the Carolina coast early in the month, resulting in above-normal monthly precipitation there, and Tropical Storm Imelda meandered over southeastern Texas at mid-month, flooding many areas and giving that region above-normal monthly precipitation — but their rains affected only limited areas. The longwave trough over the West helped keep temperatures cooler than normal for the month and steered Pacific fronts and lows across the Pacific Northwest to the northern Plains and Great Lakes where they left above-normal precipitation. The summer monsoon in the Southwest failed to materialize this year, resulting in a drier-than-normal September and last four months. If not for moisture from the remnants of an East Pacific tropical cyclone — Hurricane Lorena, which brought above-normal precipitation southern Arizona the last week of the month — the Southwest dryness would have been more widespread. In the U.S.-Affiliated Pacific Islands (USAPI), a monsoon trough brought enough rain to northern portions of Micronesia that the monthly minimum precipitation needed to meet most water requirements was met or exceeded. Surface ridging dominated southern portions of Micronesia and American Samoa, keeping conditions dry. A southwesterly flow aloft directed Pacific weather systems into southwestern and south central coastal Alaska, bringing above-normal precipitation. The lack of precipitation and excessive heat increased moisture stress which resulted in an abnormally high Evaporative Demand Drought Index (EDDI) from the Ohio Valley to Southeast and in parts of the southern Plains. As a result of these conditions, drought and abnormal dryness expanded or intensified from the Ohio Valley to Southeast and across parts of the southern Plains, Southwest, and Northeast. Drought and abnormal dryness contracted or became less intense in southern coastal Alaska and parts of the Pacific Northwest, Great Lakes, coastal Carolinas, Hawaii, southern Puerto Rico, and other parts of the southern Plains. Drought expansion was more than contraction this month, with the USDM-based national moderate-to-exceptional drought footprint across the CONUS rising from 10.0 percent of the CONUS at the end of August to 19.3 percent of the CONUS at the end of September (from 11.3 percent to 17.0 percent for the 50 States and Puerto Rico). According to the Palmer Drought Index, which goes back to the beginning of the 20th century, about 10.8 percent of the CONUS was in moderate to extreme drought at the end of September, increasing about 3.2 percent from the 7.6 percent at the end of August.
Drought conditions at the end of September, as depicted on the October 1st, 2019 USDM map, included the following core drought and abnormally dry areas:
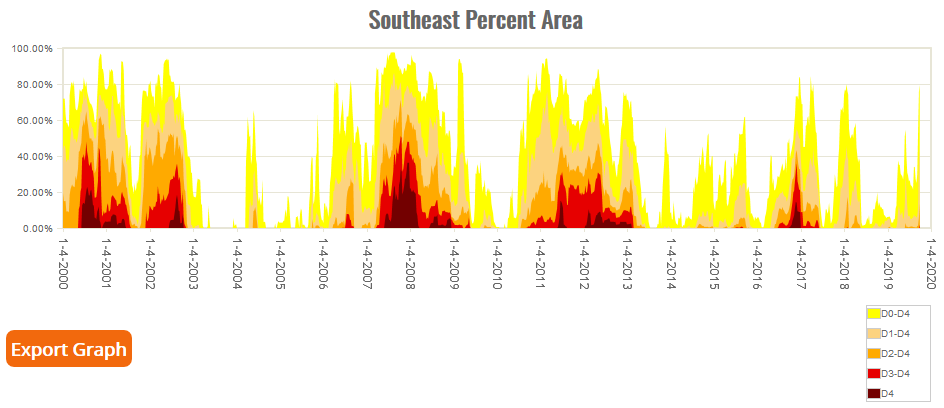
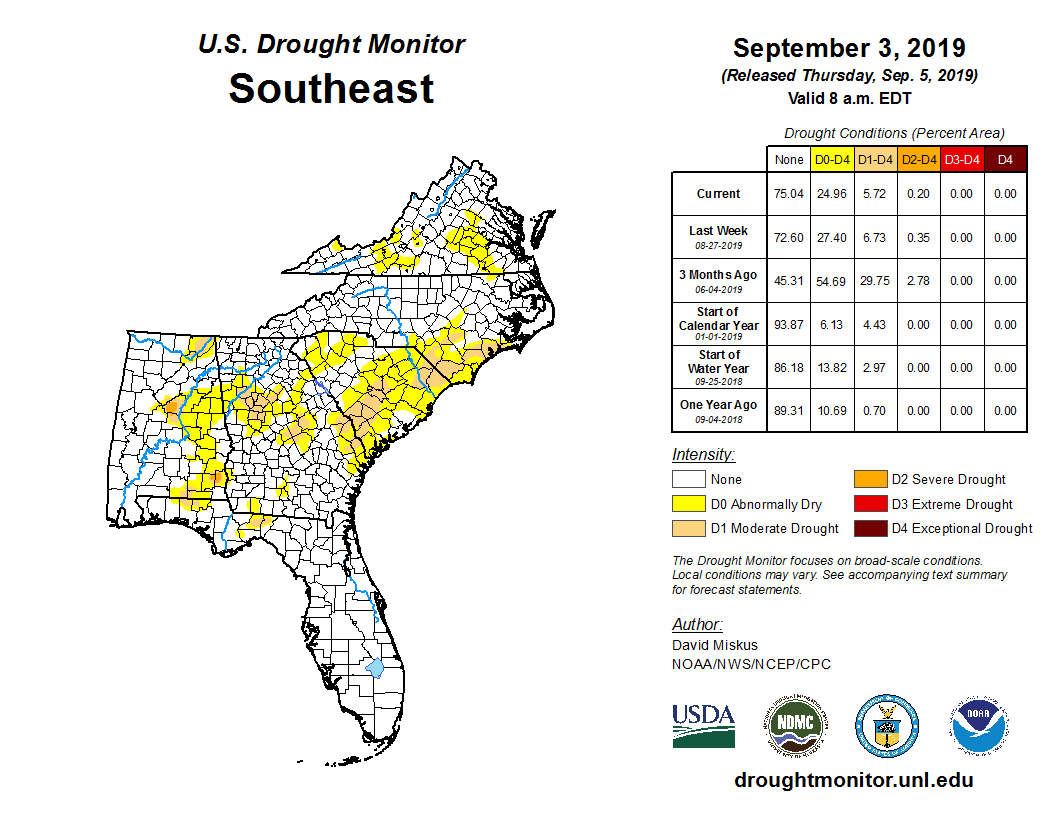
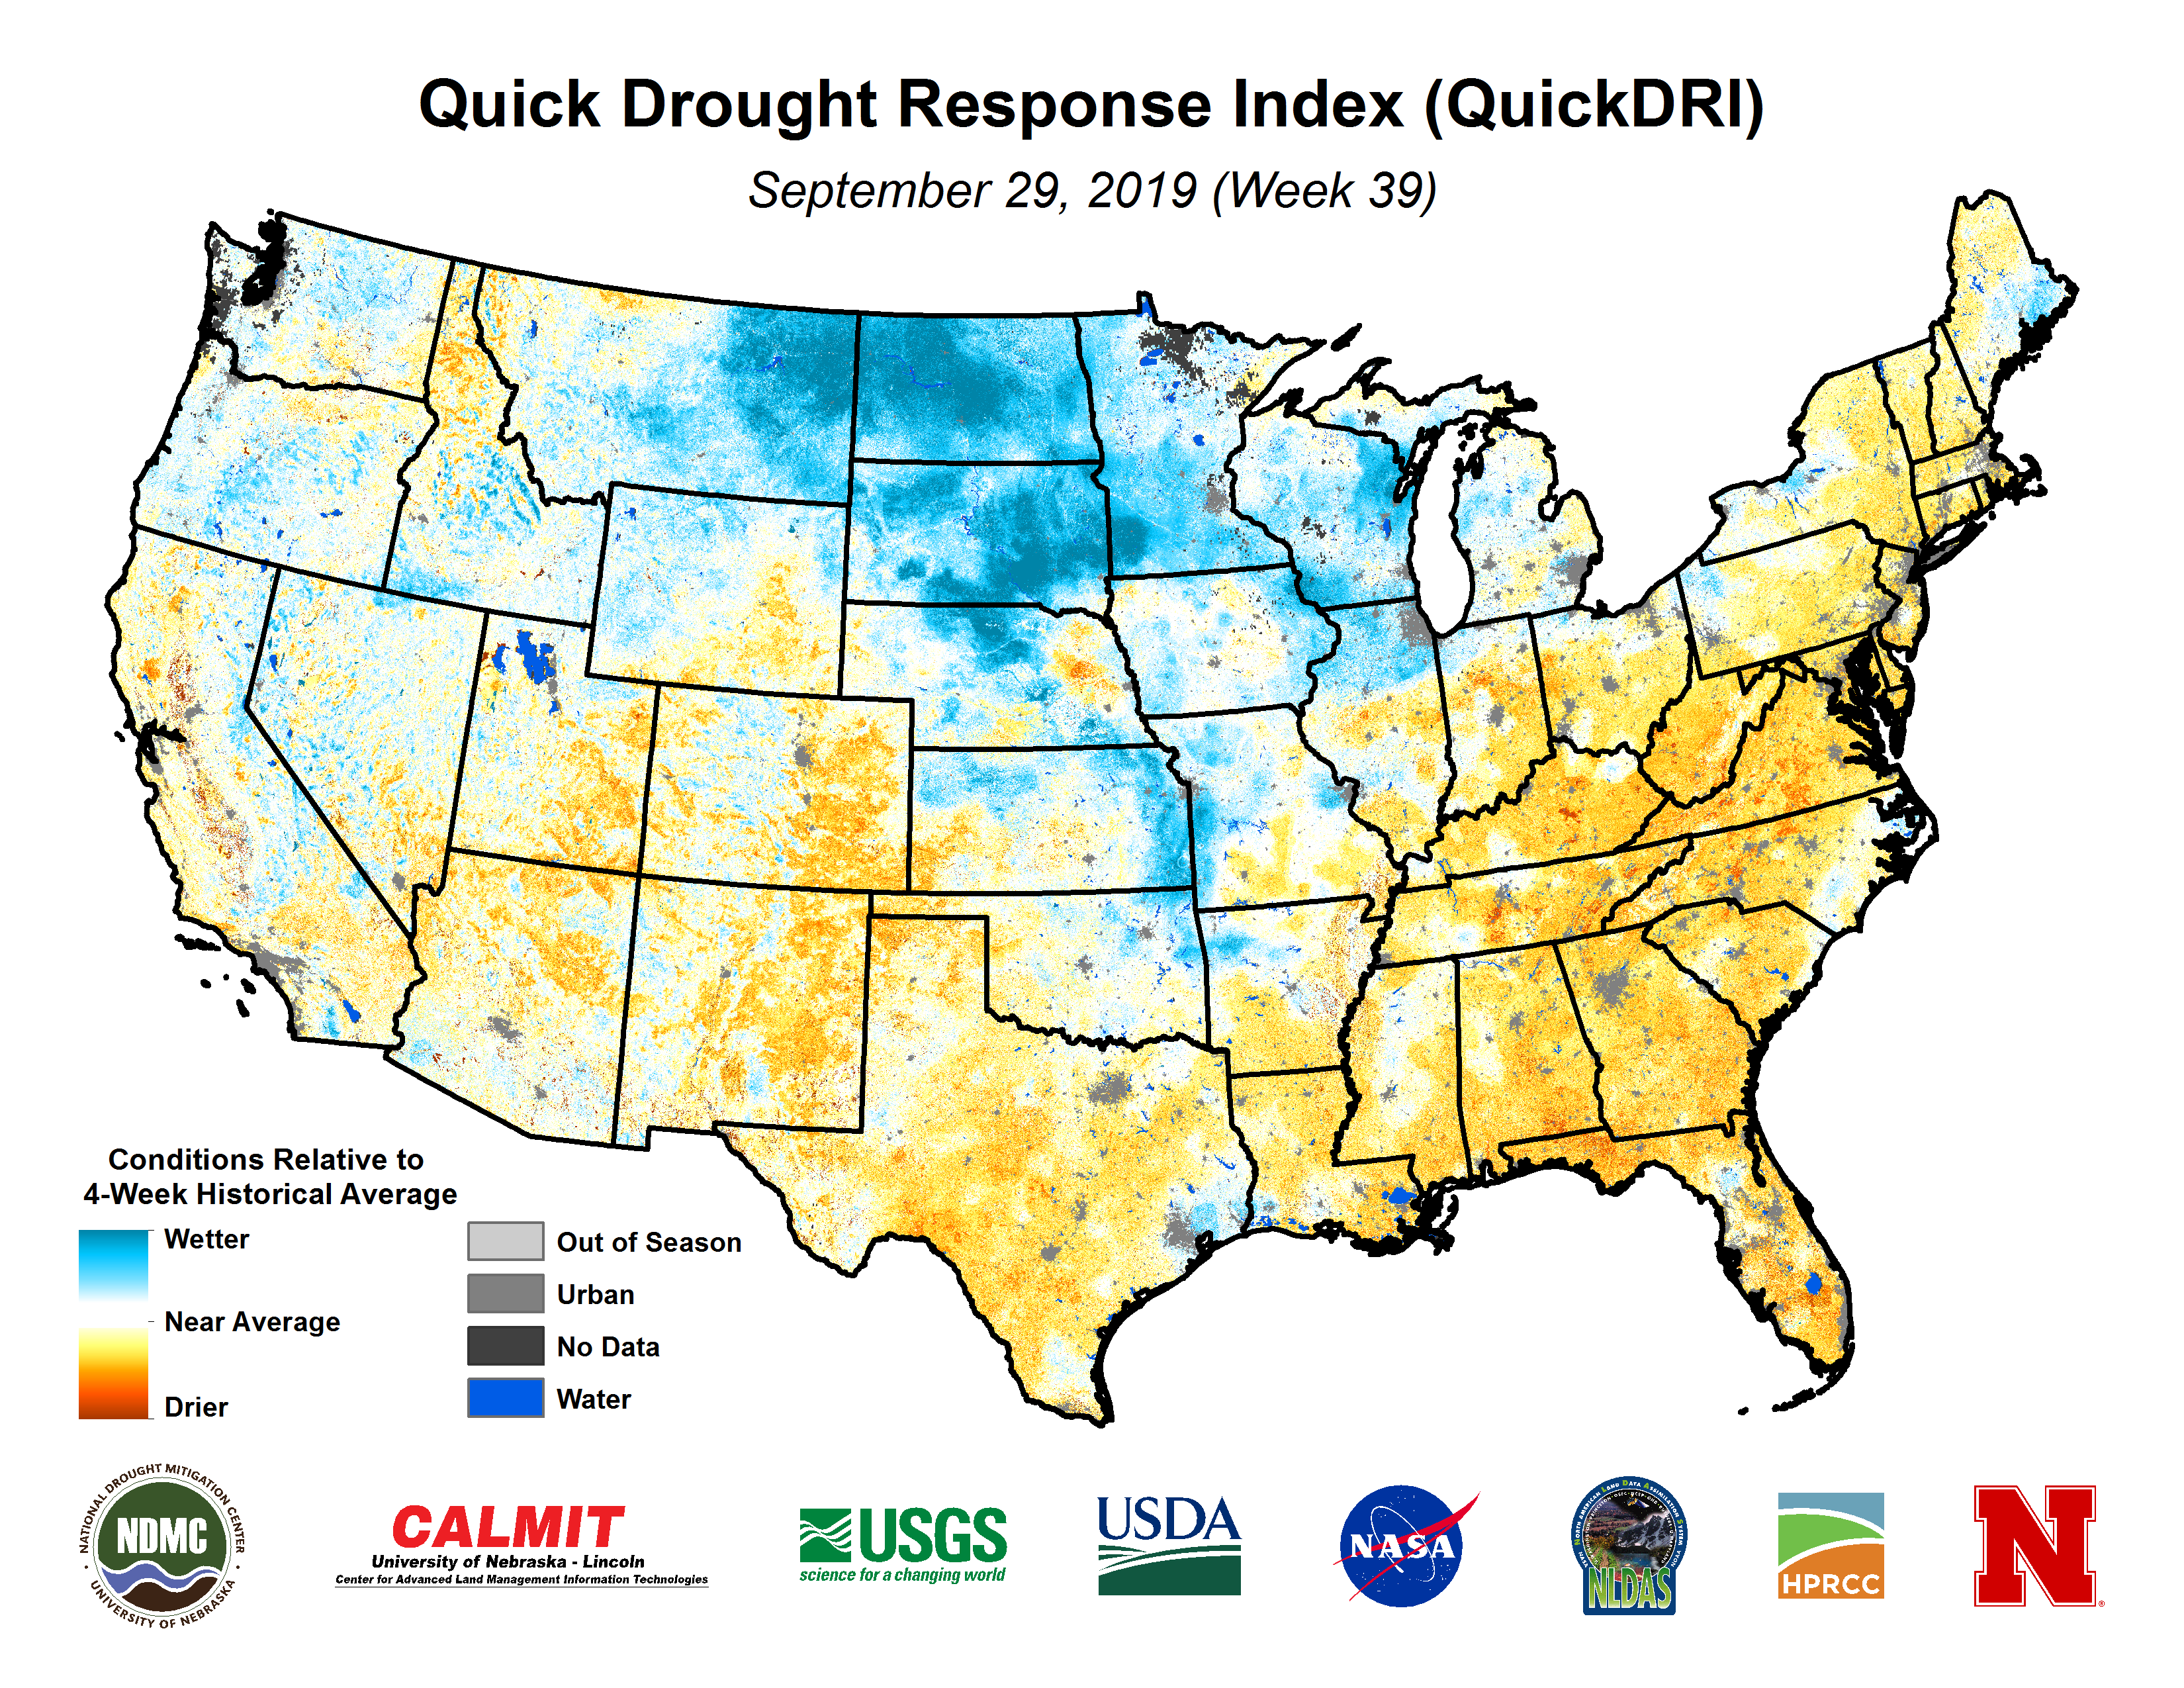
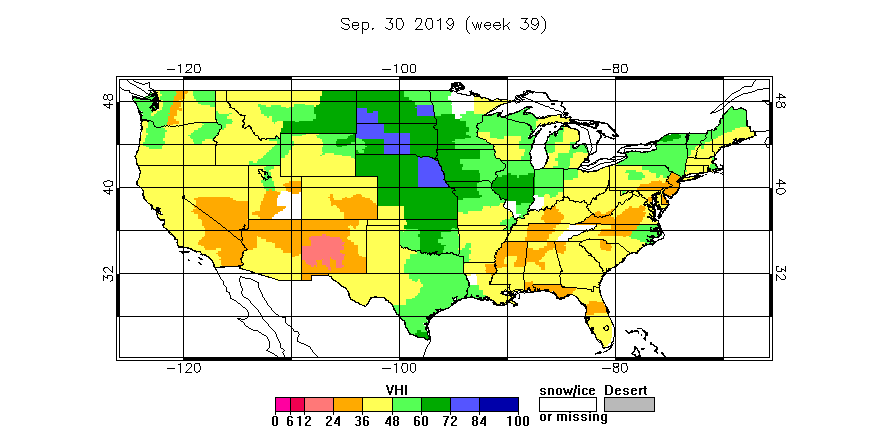
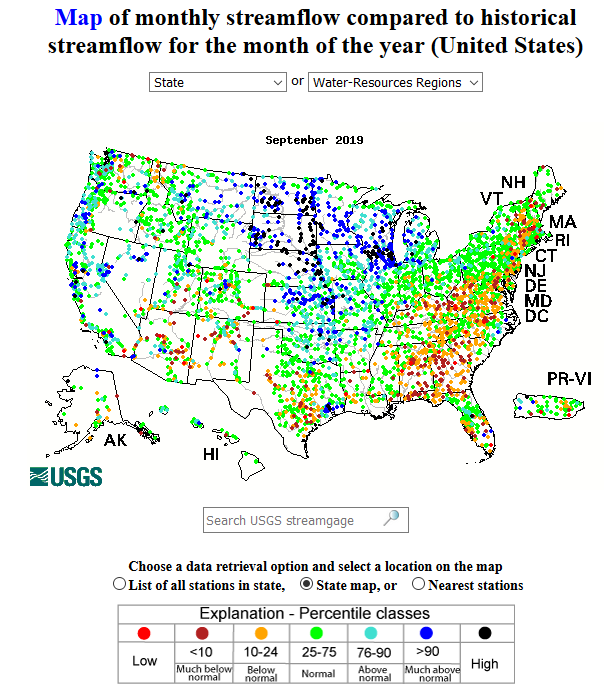
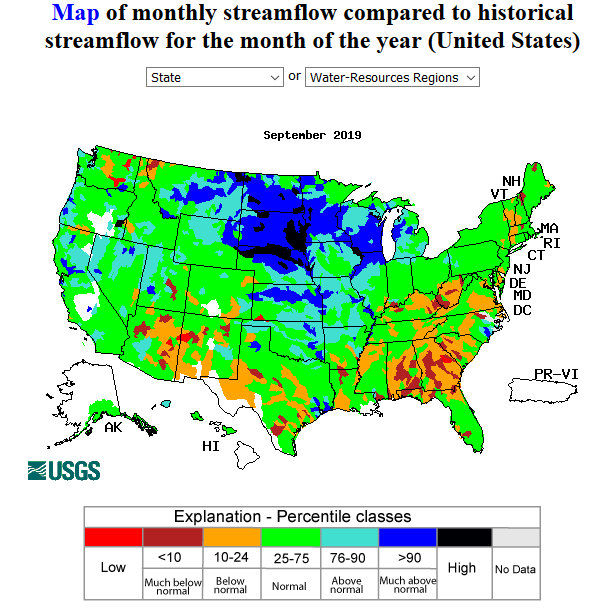
- The area in abnormal dryness (D0) to severe drought (D2) expanded explosively in "flash drought", with areas of extreme drought (D3) appearing, in the Southeast. The area in D0-D3 grew from 25.0 percent at the beginning of September to 79.5 percent by the end of the month, with moderate drought (D1) to extreme drought expanding from 5.7 percent to 44.3 percent. Below-normal to record low precipitation and warmer-than-normal temperatures, which increased evapotranspiration, dried soils, stressed vegetation (VegDRI, QuickDRI, VHI), and lowered stream levels.
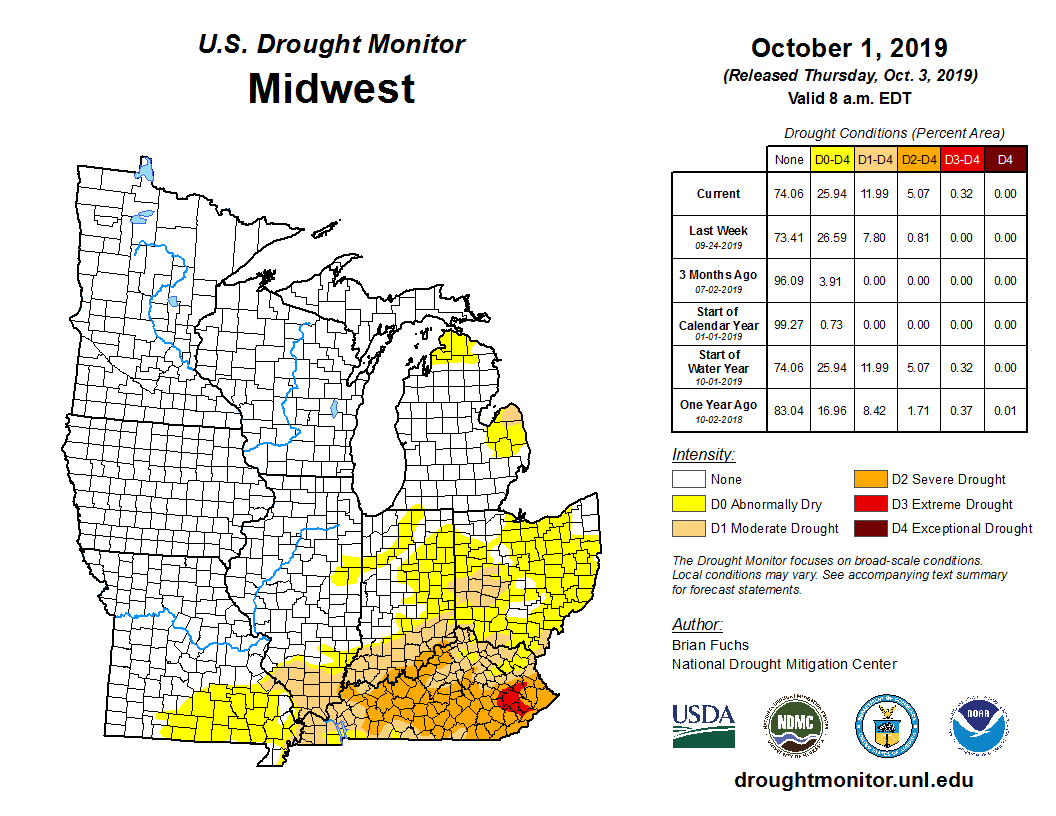
- Drought contracted in the Great Lakes but moderate to extreme drought developed in the Ohio Valley. The Ohio Valley dryness was an extension of the Southeast dryness, with similar indicators: below-normal to record low precipitation, warmer-than-normal to record-warm temperatures, increased evapotranspiration, dried soils, stressed vegetation (QuickDRI, VHI), and lowered stream levels. Kentucky was especially hard hit, with drought coverage increasing from zero percent at the beginning of September to 91.7 percent by the end of the month.
-
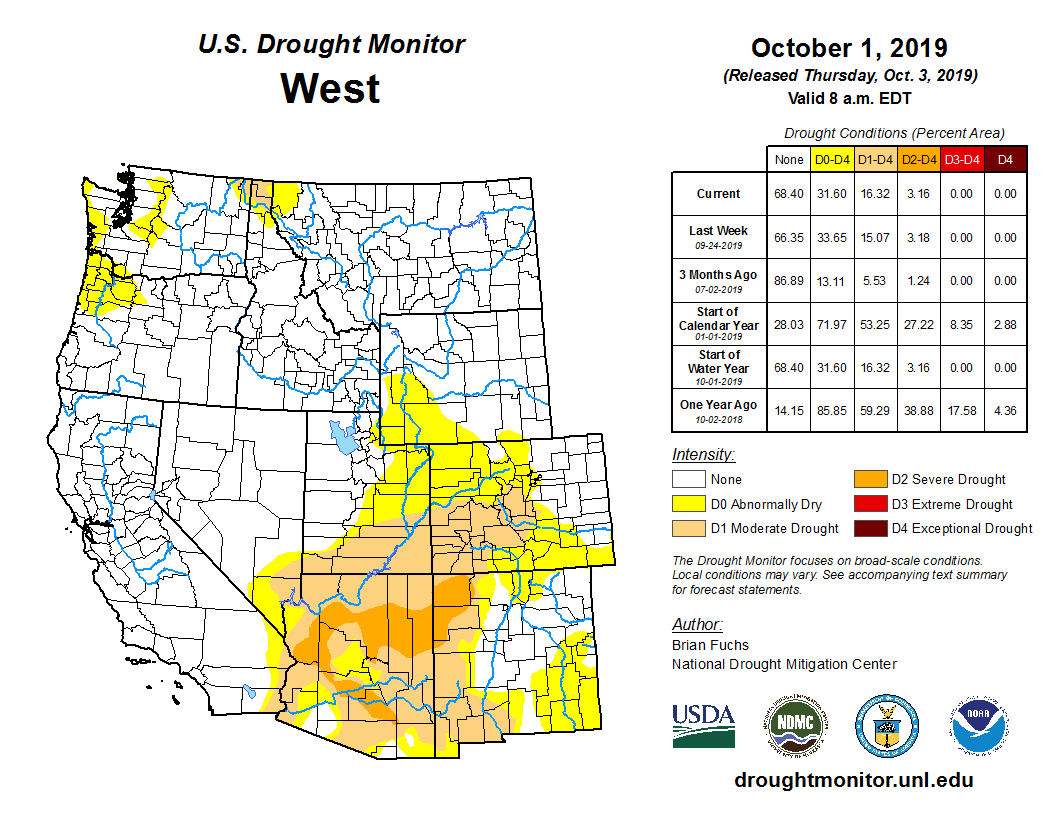
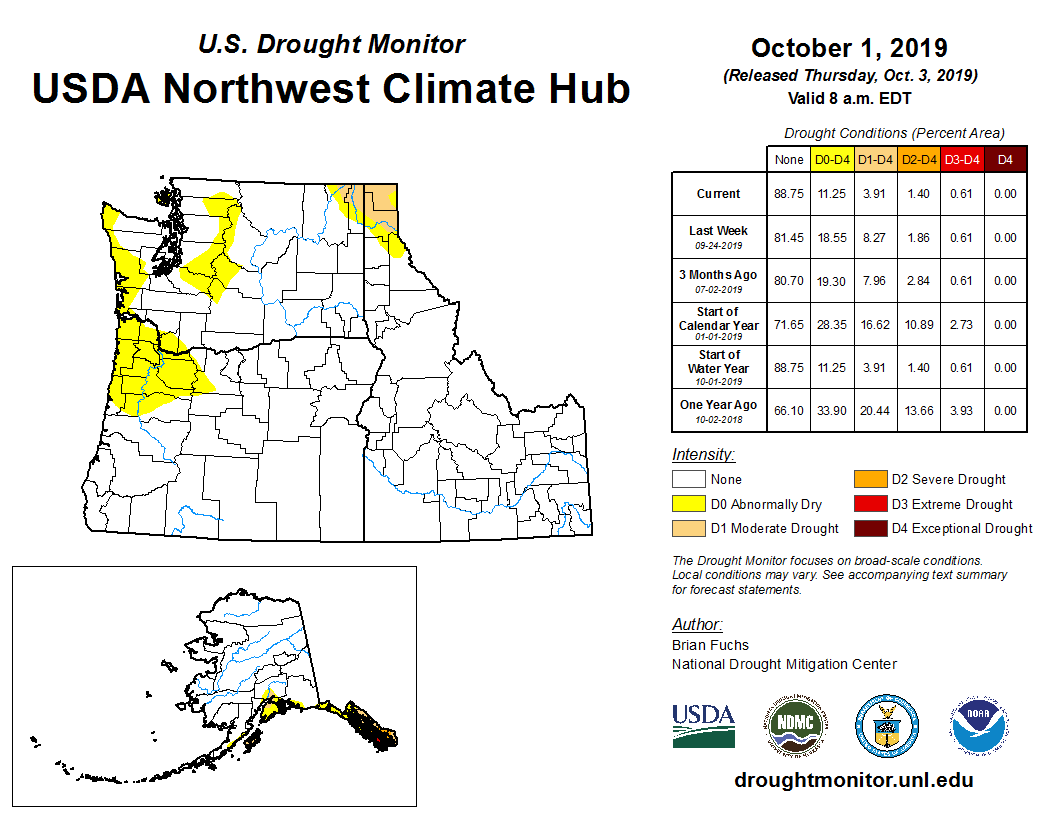
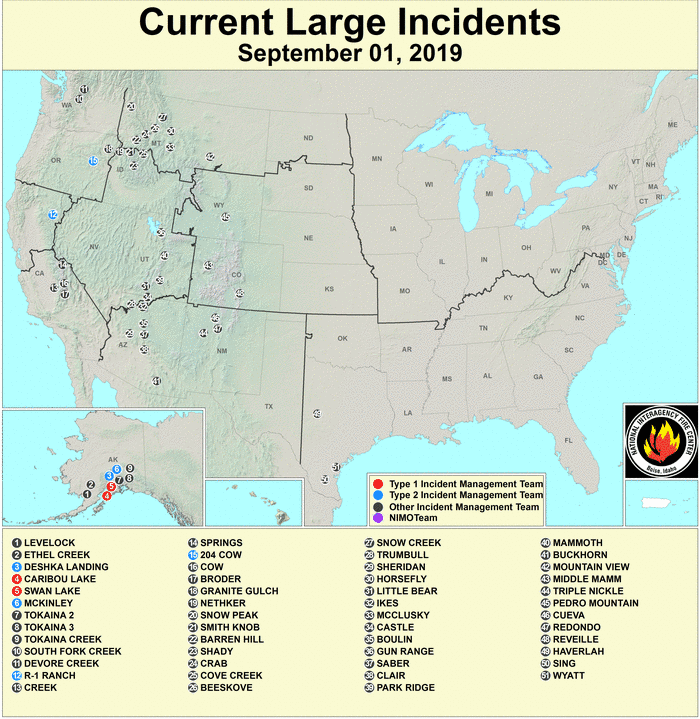
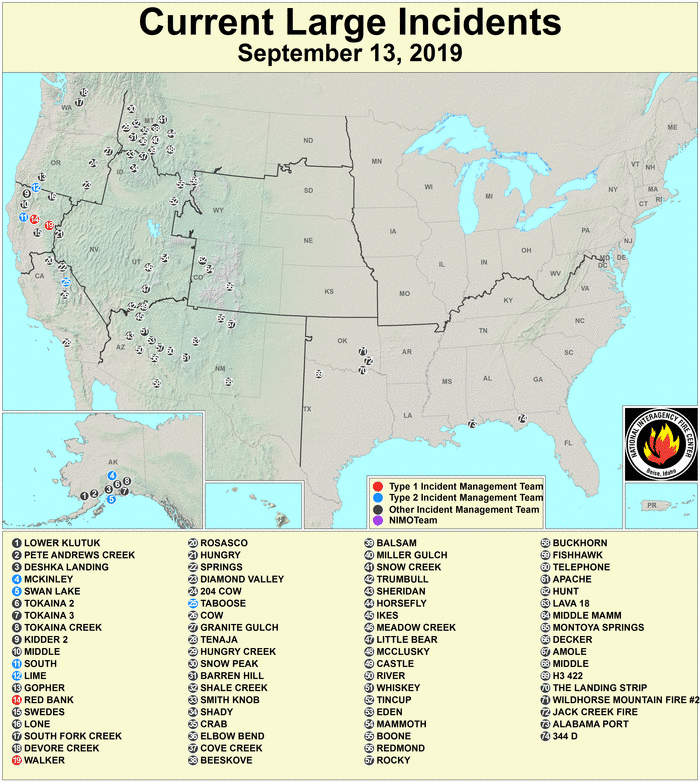
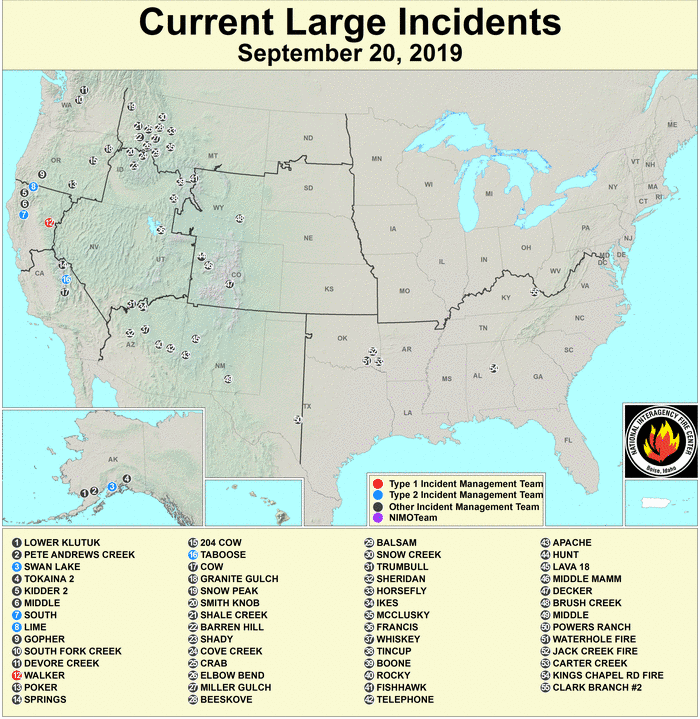
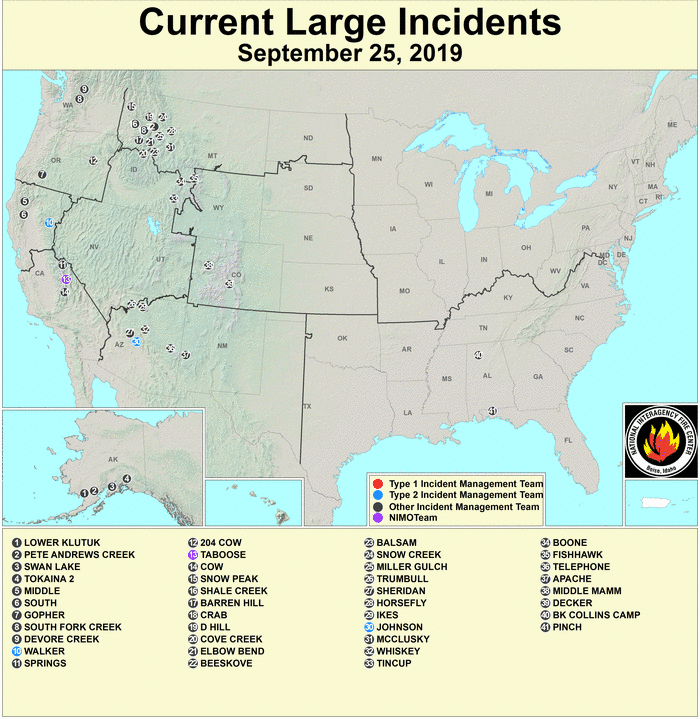
In the West, drought contracted in the Pacific Northwest and far northern Rockies but expanded in the Southwest. Moderate to severe (D2) drought had expanded from 11.2 percent of West at the beginning of the month to 16.3 percent by month's end. As in the Ohio Valley to Southeast, below-normal precipitation and (in the eastern sections) warmer-than-normal temperatures, which increased evapotranspiration, dried soils, stressed vegetation (VegDRI, QuickDRI, VHI), and lowered stream levels in the Southwest. Several large wildfires burned in parts of the West throughout the month (wildfire maps for September 1, 13, 20, 25, 30). The failure of the summer monsoon resulted in severe dryness over the last two to three months and aggravated lingering dryness at longer time scales (last 24 months).
- The percent area of the West (from the Rockies to the West Coast) in moderate to extreme drought (based on the Palmer Drought Index) decreased slightly compared to last month to about 11.6 percent due to more contraction in the Northwest than expansion in the Southwest. The area of the West experiencing moist conditions fell some more to 19.7 percent at the end of September.
- Abnormal dryness to extreme drought expanded in the southern Plains. Drought coverage grew from 23.9 percent of the region at the end of August to 33.9 percent by the end of September. Like the other regions, below-normal to record low precipitation (in places) and widespread warmer-than-normal to record-warm temperatures, which increased evapotranspiration, dried soils and stressed vegetation (VegDRI, QuickDRI).
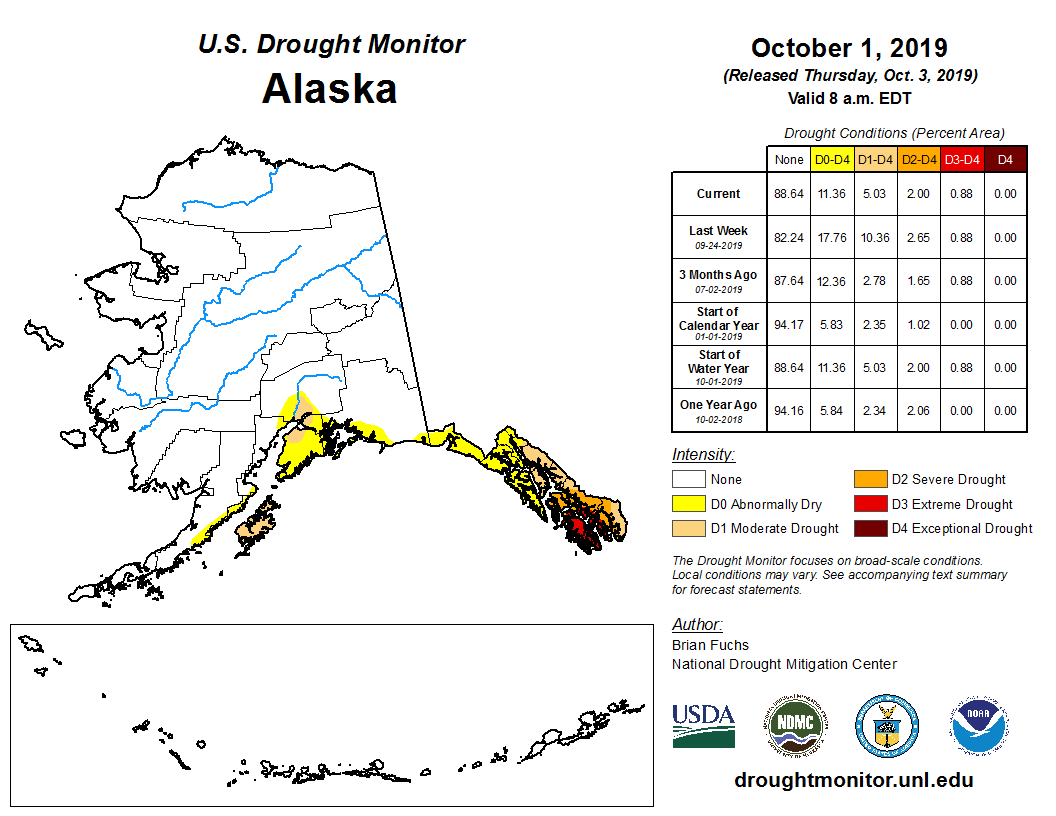
- Abnormal dryness to extreme drought shrank along southern coastal parts of Alaska, but continued in the Alaskan panhandle.
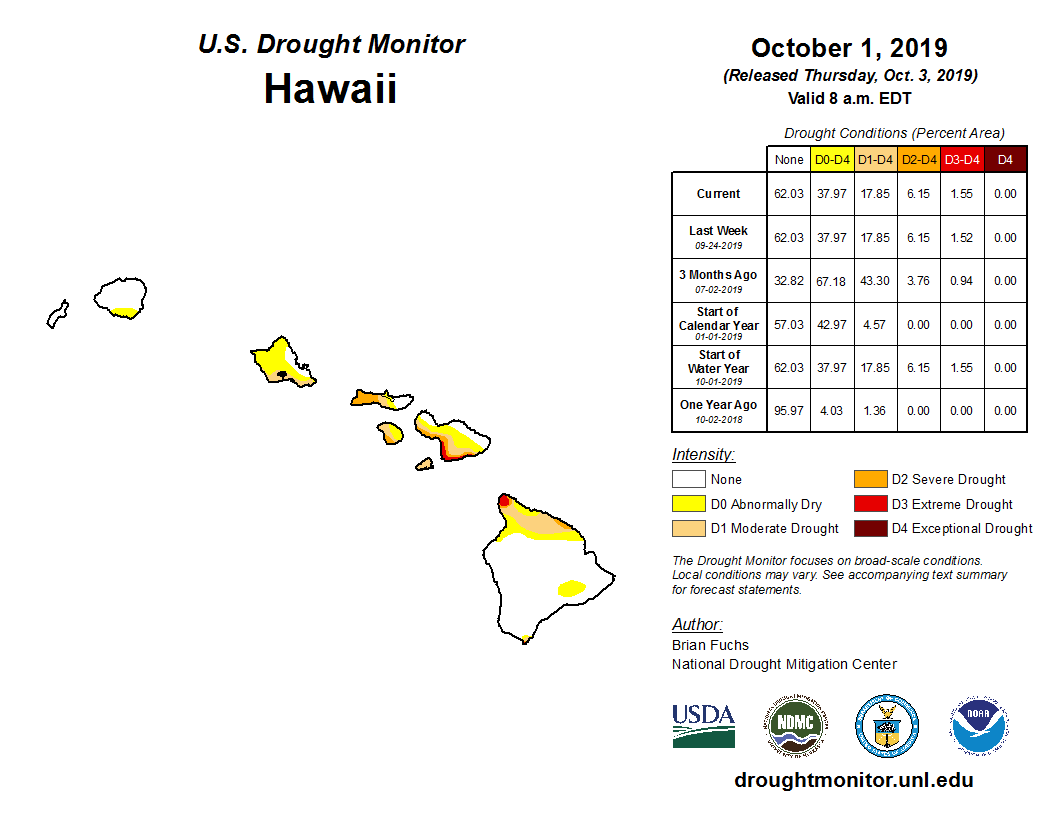
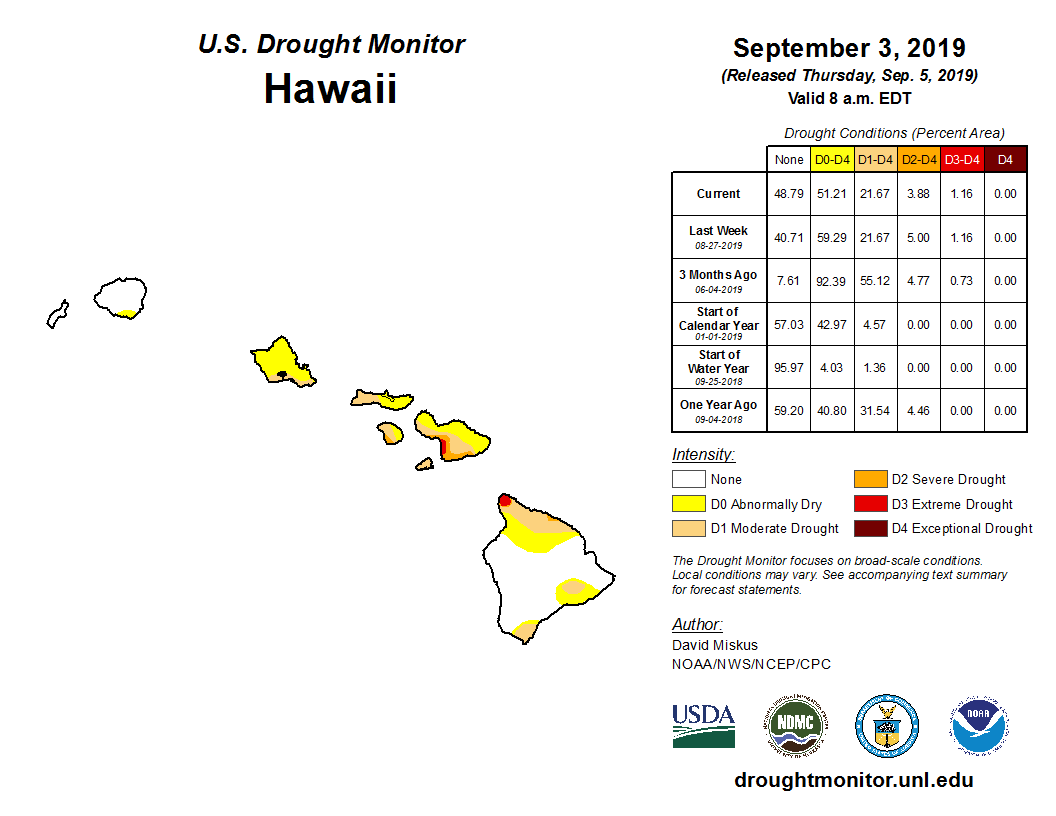
- In Hawaii, there was slight contraction of drought and abnormal dryness, but moderate to extreme drought continued.
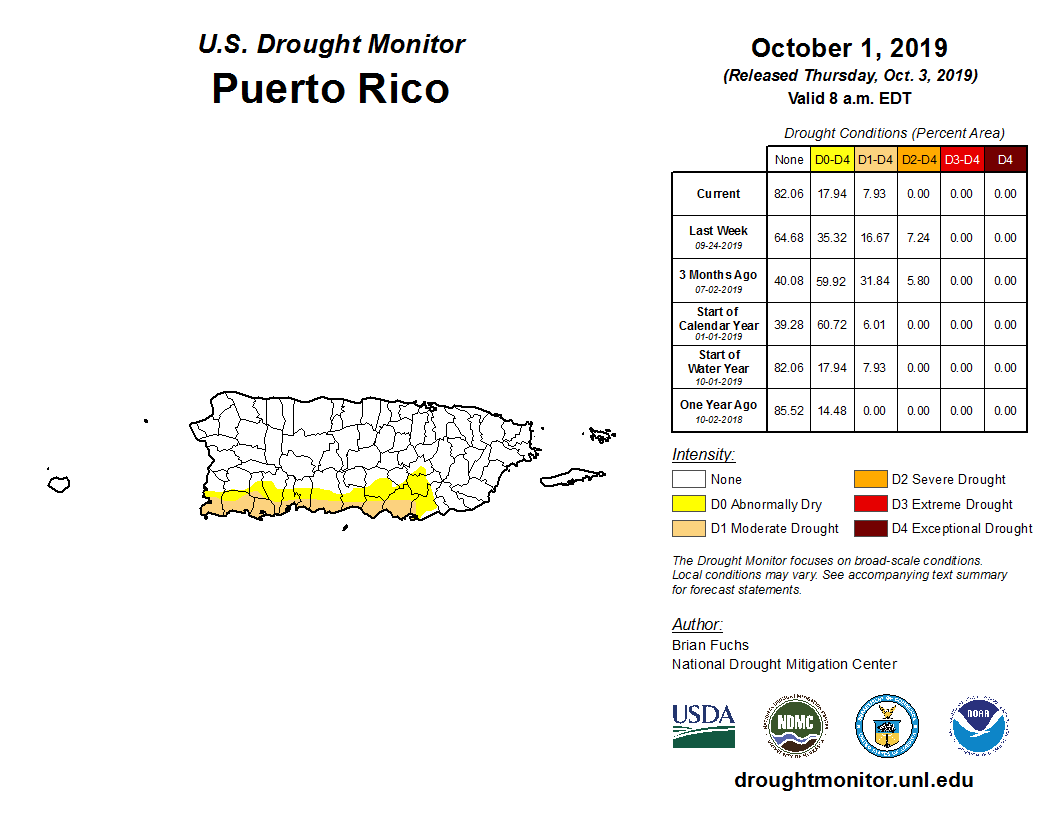
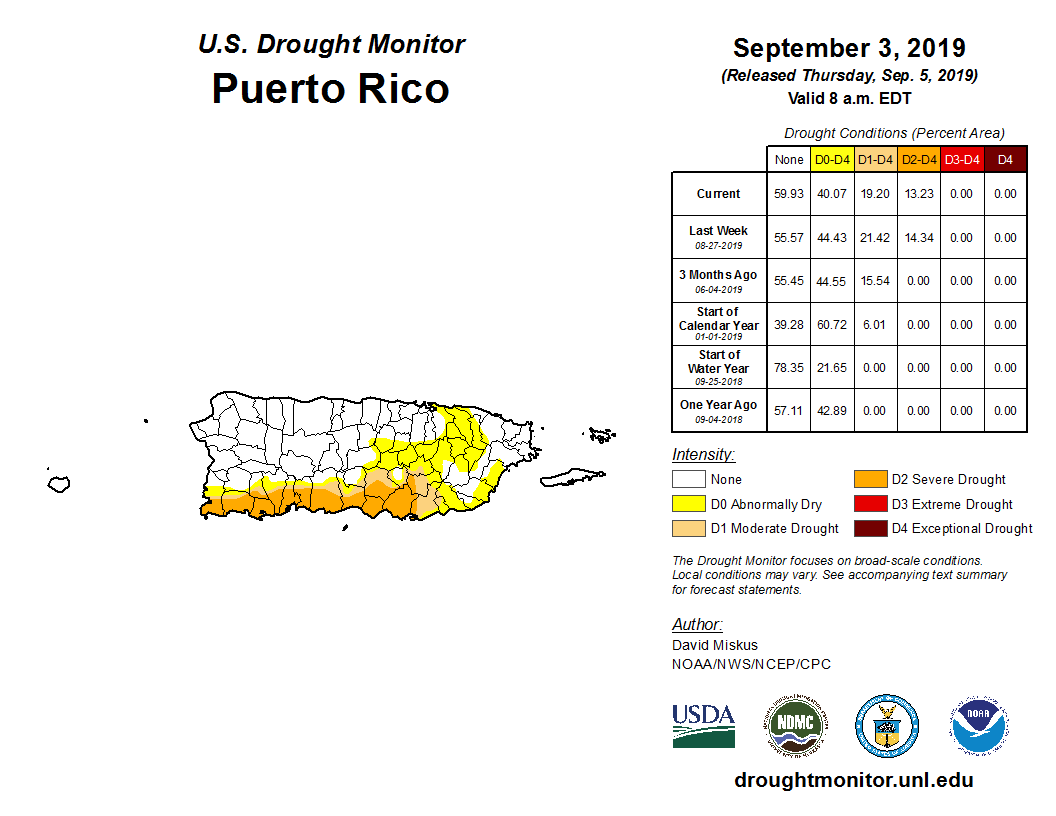
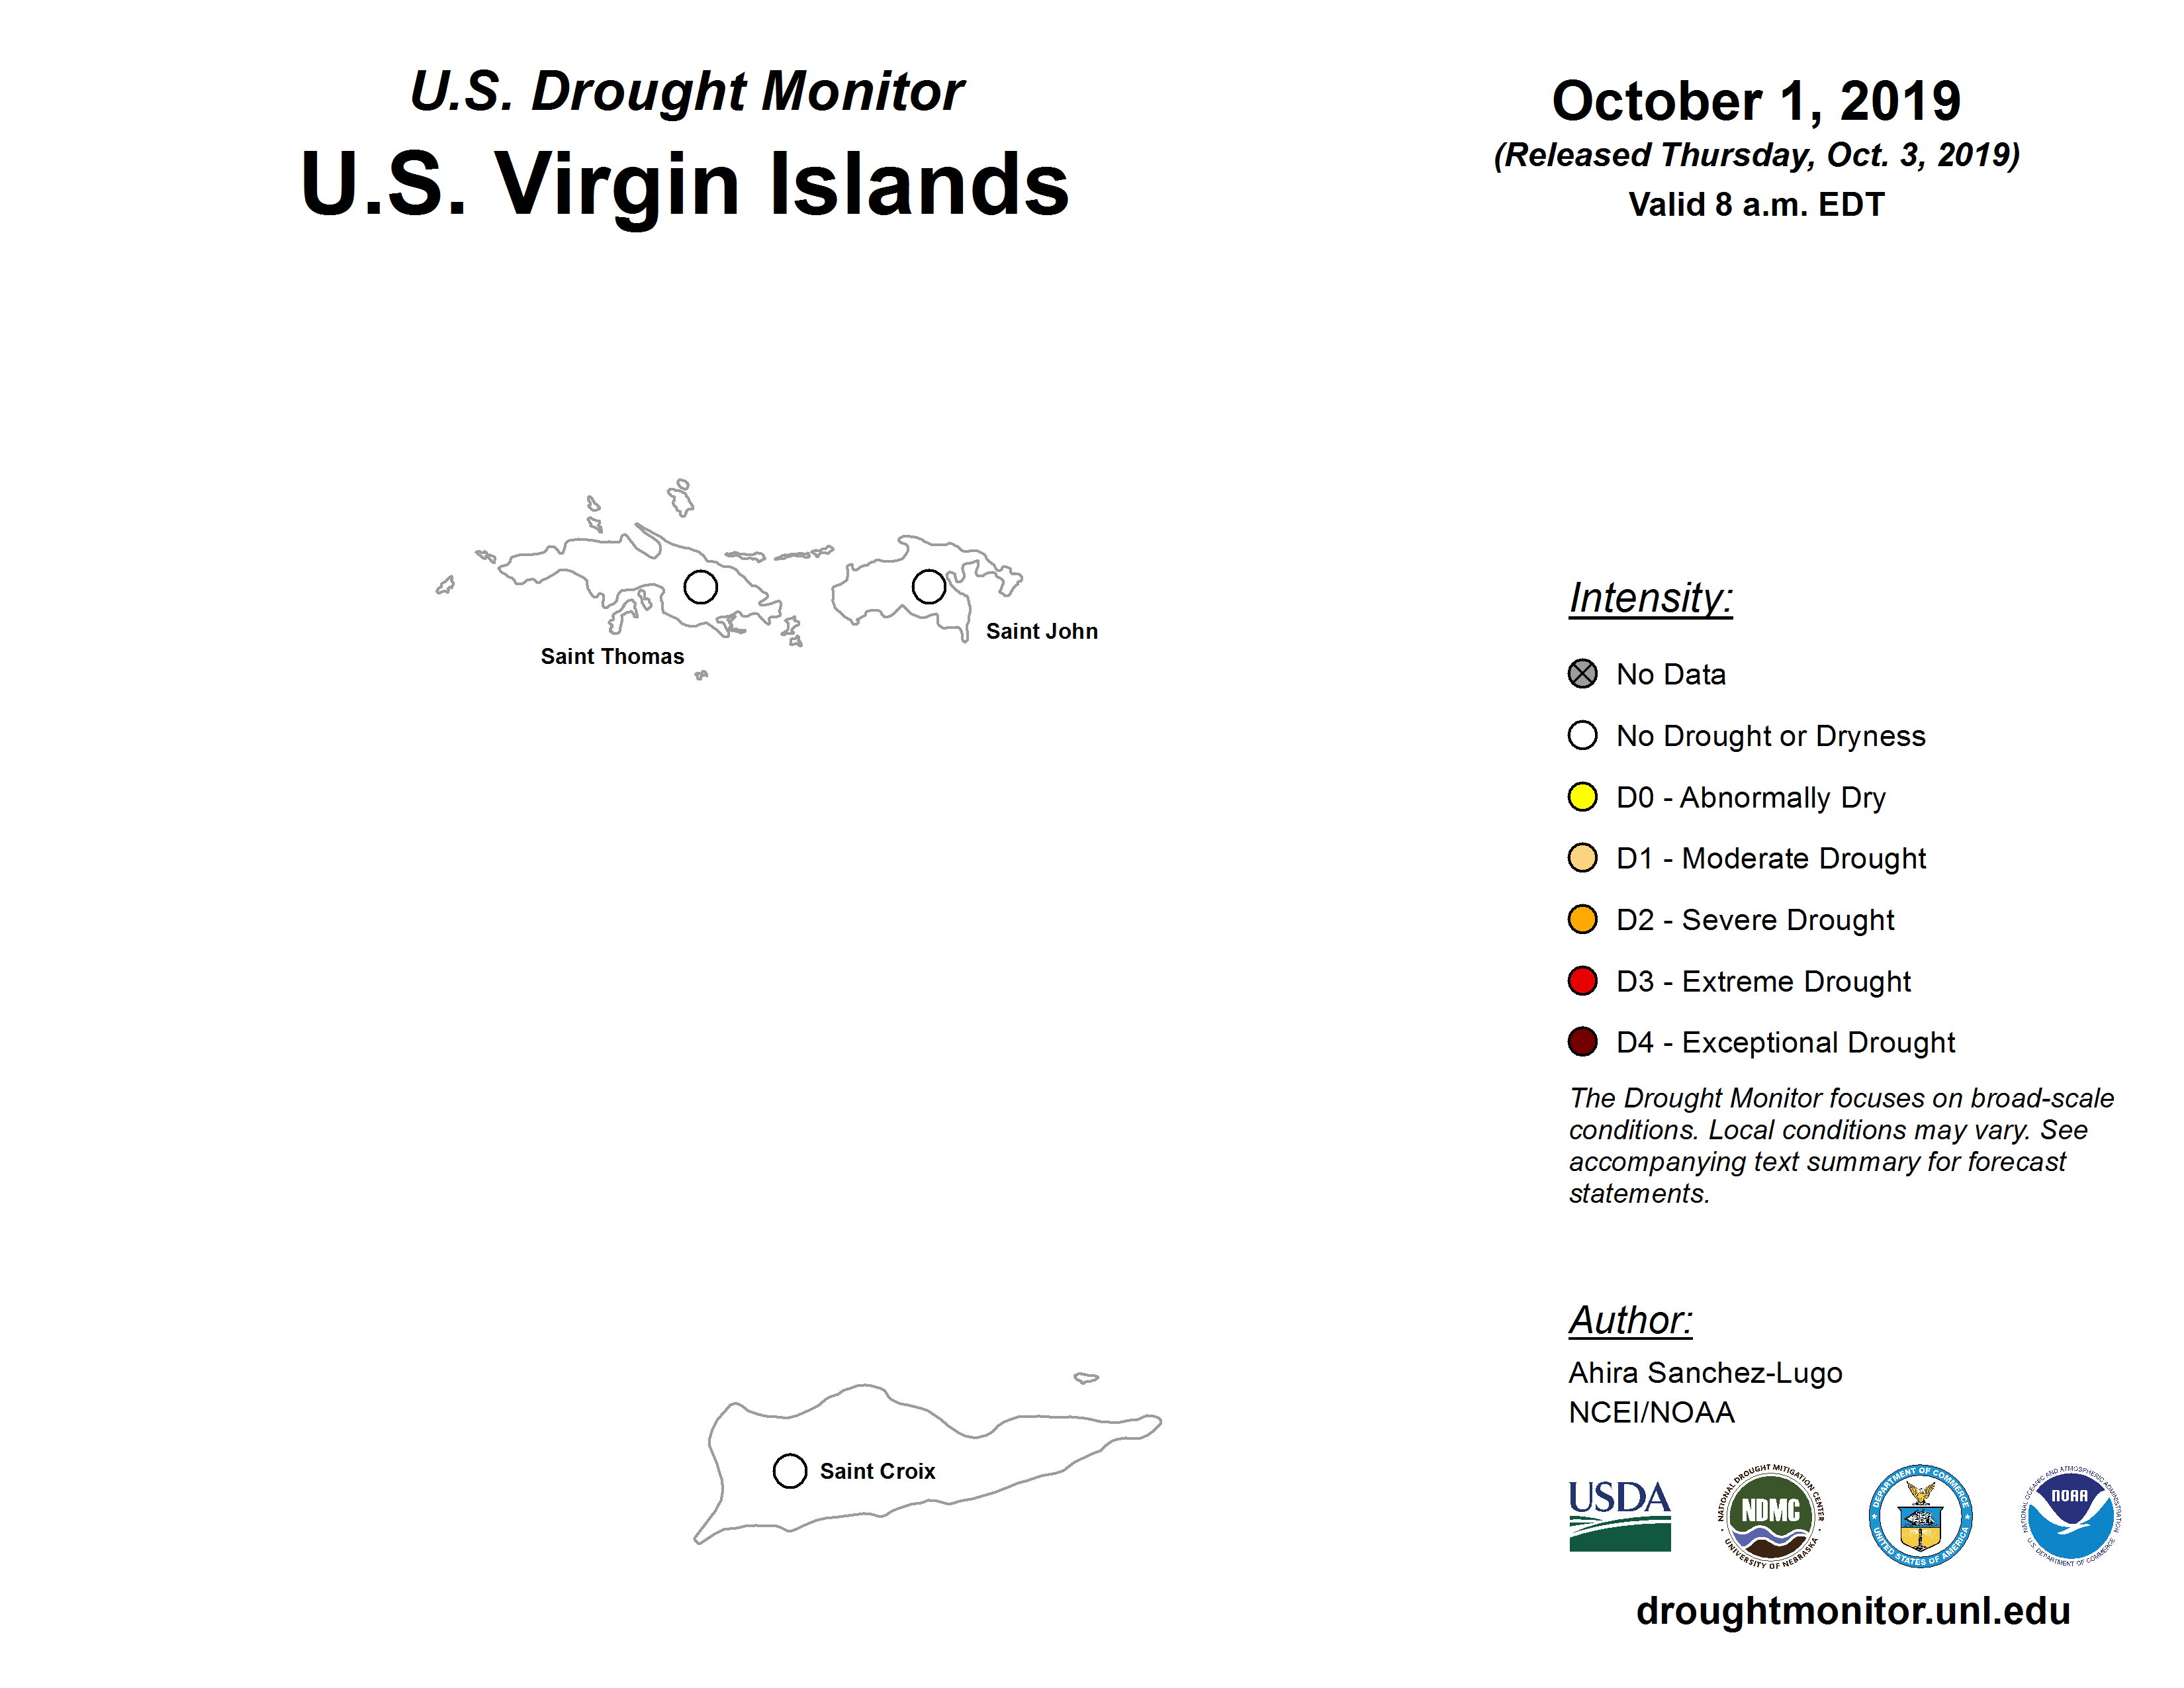
- Abnormal dryness to moderate drought shrank, and severe drought disappeared, in Puerto Rico, while abnormal dryness was eliminated in the U.S. Virgin Islands.
- In the U.S.-Affiliated Pacific Islands (USAPI), drought shrank in the Republic of the Marshall Islands but abnormal dryness appeared in southern parts of the Federated States of Micronesia and in American Samoa.
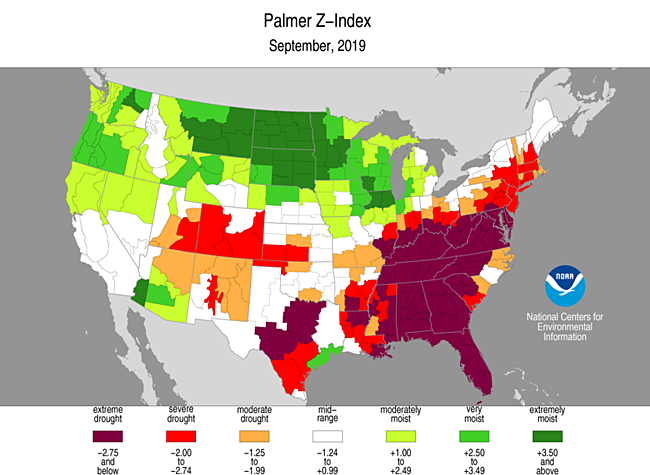
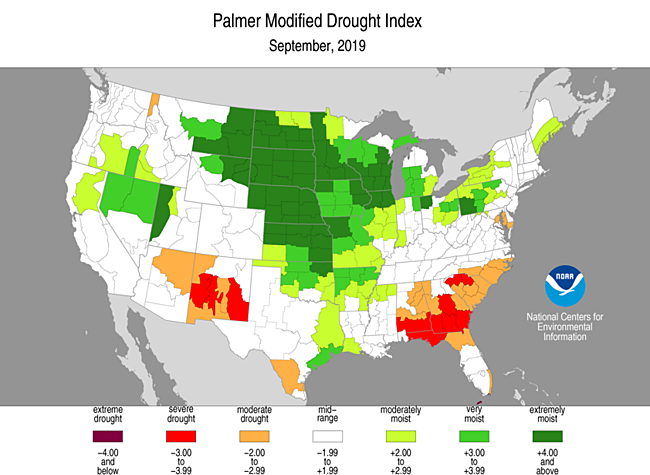
Palmer Drought Index
The Palmer drought indices measure the balance between moisture demand (evapotranspiration driven by temperature) and moisture supply (precipitation). The Palmer Z Index depicts moisture conditions for the current month, while the Palmer Hydrological Drought Index (PHDI) and Palmer Drought Severity Index (PDSI) depict the current month's cumulative moisture conditions integrated over the last several months. While both the PDSI and PHDI indices show long-term moisture conditions, the PDSI depicts meteorological drought while the PHDI depicts hydrological drought. The PDSI map shows less severe and extensive drought (as well as wet spell conditions) in some parts of the country than the PHDI map because the meteorological conditions that produce drought and wet spell conditions are not as long-lasting as the hydrological impacts.
|
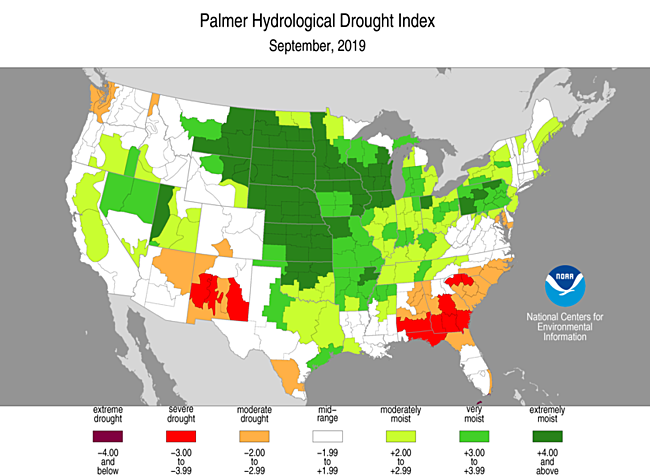 |
Used together, the Palmer Z Index and PHDI maps show that short-term drought occurred across a huge part of the country from the Lower and Mid-Mississippi Valley to East Coast and from the Ohio Valley to southern New England. This shrank or made less intense the previous long-term wet conditions and, over the Gulf to Atlantic coasts, expanded or intensified the previous long-term drought. Short-term drought occurred in the Southwest and parts of the southern to central Plains, shrinking previous long-term wet conditions and expanding or intensifying previous long-term drought (PHDI maps for September vs. August). Short-term wet conditions in the Pacific Northwest lessened or contracted previous long-term drought. Short-term wet conditions in the northern Plains to western Great Lakes intensified or expanded previous long-term wetness.
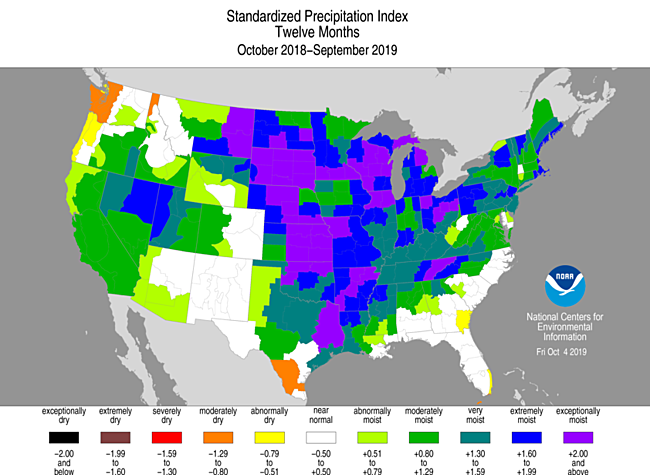
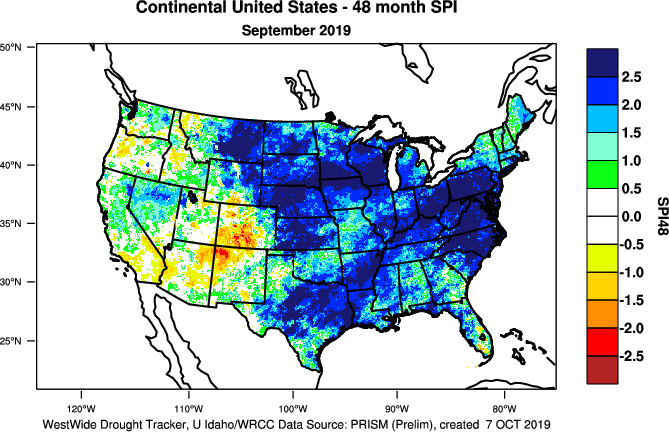
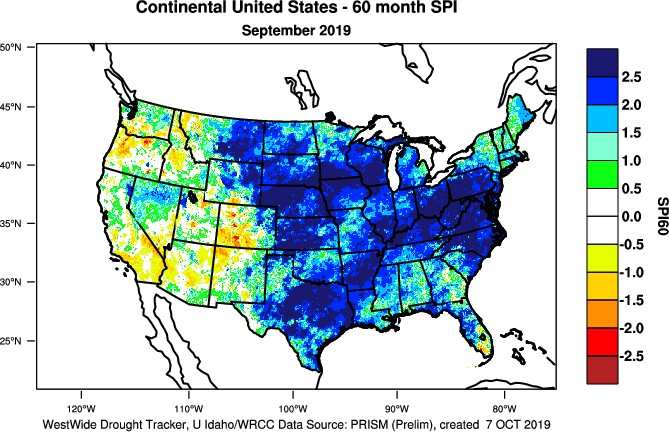
Standardized Precipitation Index
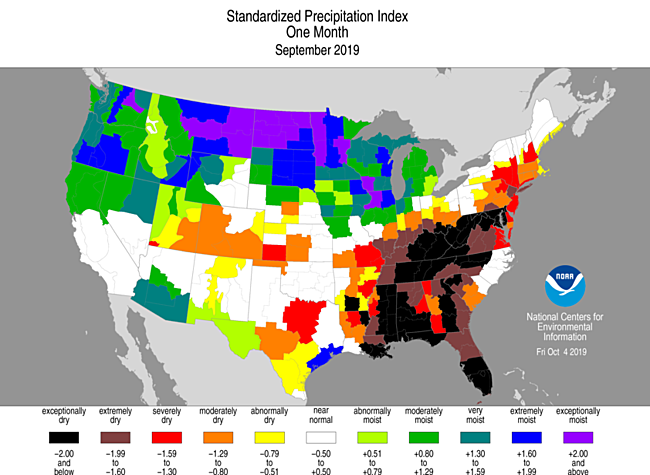
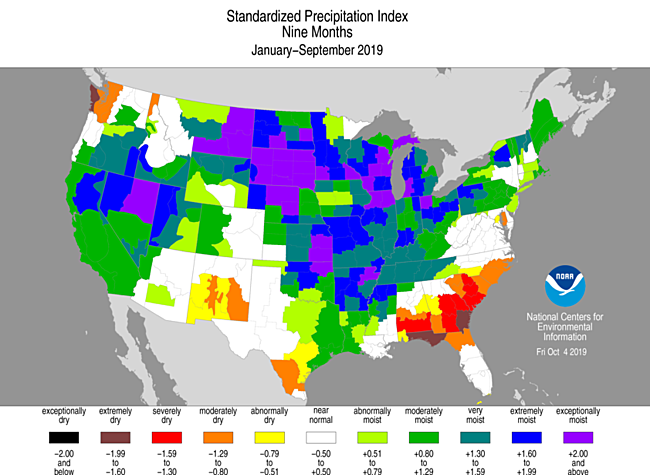
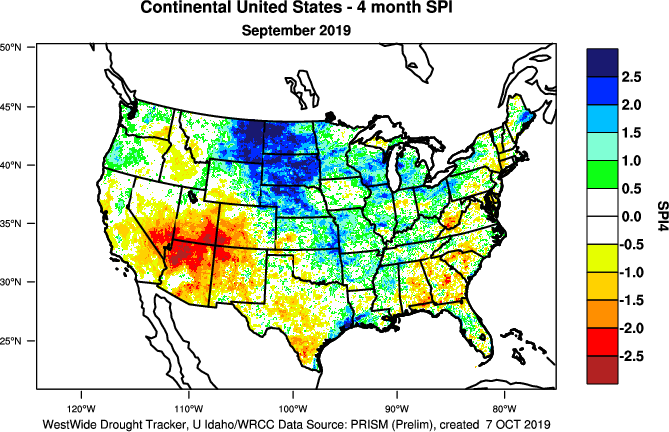
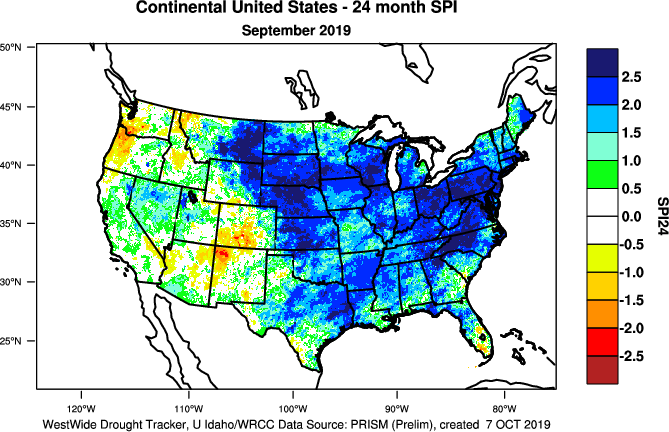
The Standardized Precipitation Index (SPI) measures moisture supply. The SPI maps here show the spatial extent of anomalously wet and dry areas at time scales ranging from 1 month to 24 months.
 |
 |
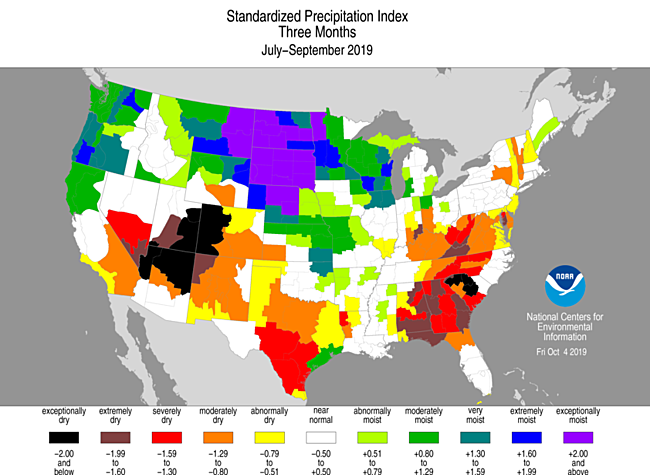 |
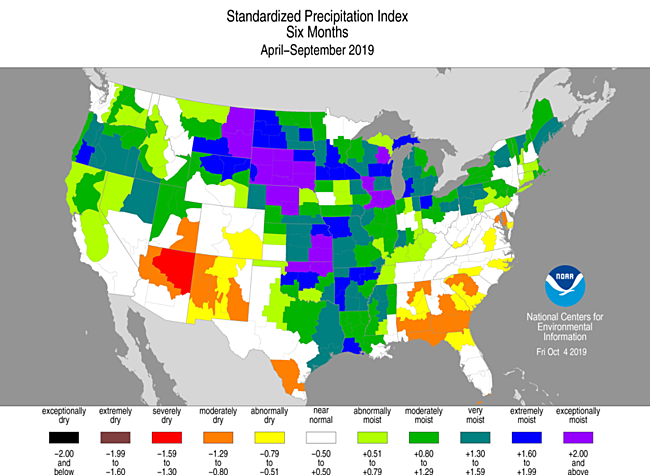
The SPI maps illustrate how moisture conditions have varied considerably through time and space over the last two years. A huge area from the Lower Mississippi Valley and Gulf Coast to southern New England is very dry at the 1- to 2-month time scales. This region is somewhat smaller at the 3-month time scale. At 6 to 9 months, the dry area is limited to the Southeast coastal area. In Texas, the central to southern parts are dry at the 1- to 2-month time scales; most of the state is dry at 3 months; and the dryness is limited to southern Texas at 6 to 12 months. Much of the Southwest is dry at the 2-, 3-, and 24-month time scales, with parts of the region dry at the 1-, 6-, and 9-month time scales. Dryness shows up in parts of the Pacific Northwest at longer time scales (9 to 24 months). On the wet side, the northern Plains has unusually wet conditions at all time scales; much of the Far West is wet at 1 to 12 months; the Great Lakes are wet at most time scales; the Mississippi and Ohio Valleys and Northeast are wet at the 6- to 24-month time scales; and the Mid-Atlantic region is wet at the 12- to 24-month time scales. The central Plains has dryness in some parts at the 1-month time scale, but it is wet at 2 to 24 months.
 |
 |
 |
Standardized Precipitation Evapotranspiration Index
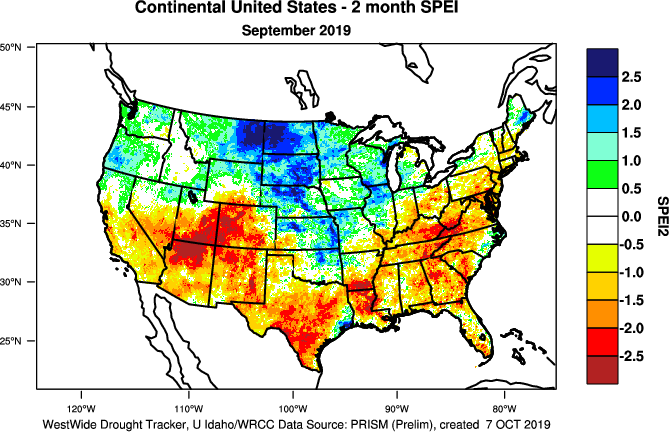
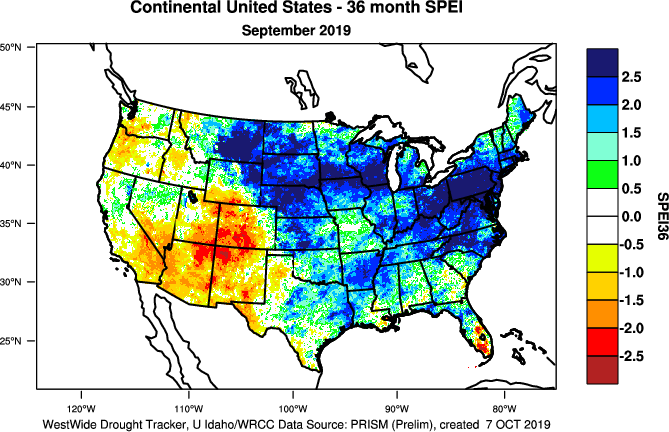
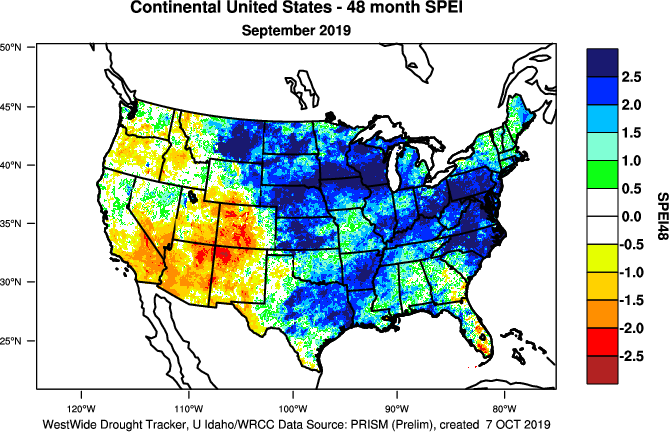
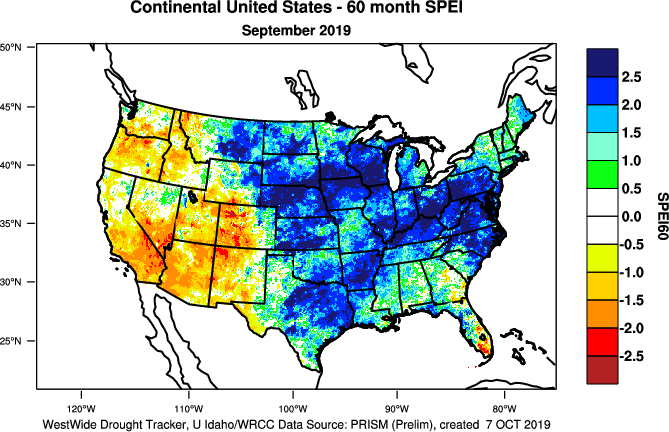
The SPI measures water supply (precipitation), while the SPEI (Standardized Precipitation Evapotranspiration Index) measures the combination of water supply (precipitation) and water demand (evapotranspiration as computed from temperature). Warmer temperatures tend to increase evapotranspiration, which generally makes droughts more intense.
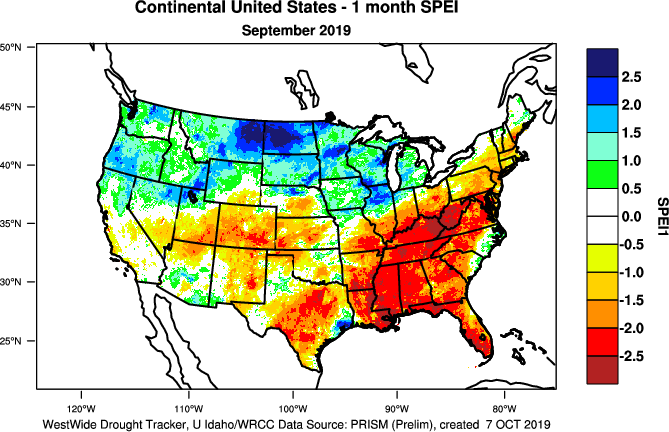 1-month SPEI for current month.
|
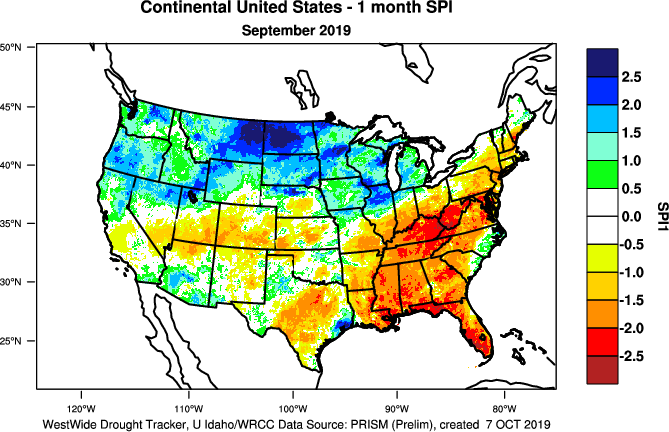 1-month SPI for current month.
|
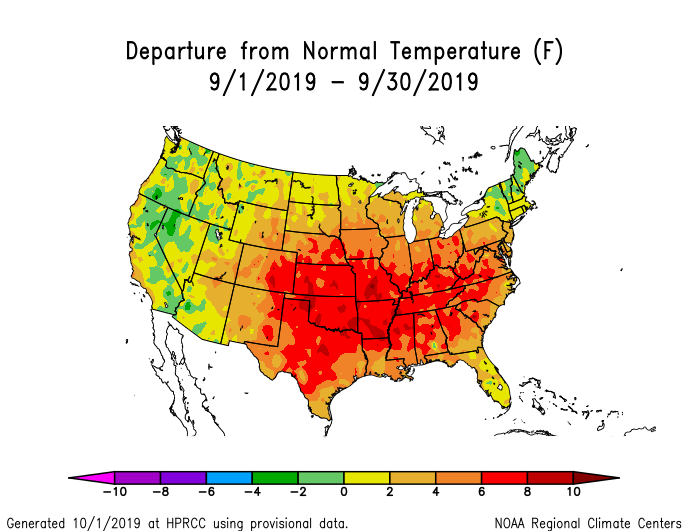
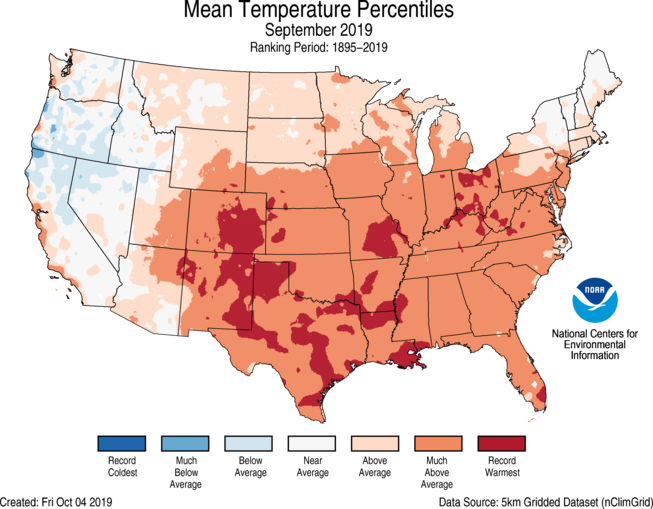
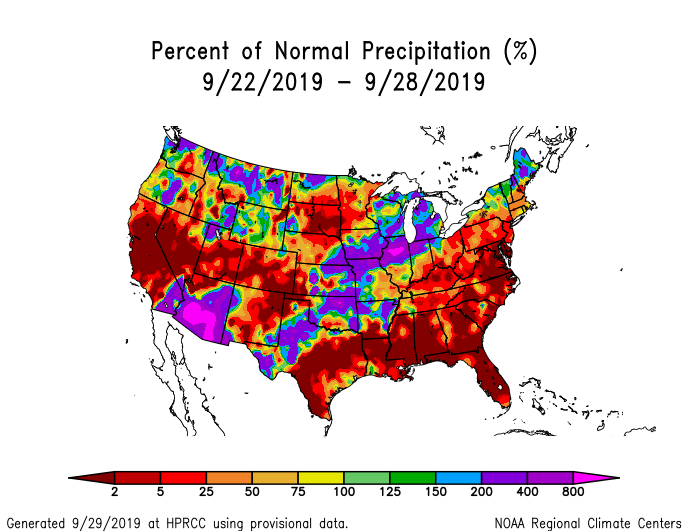
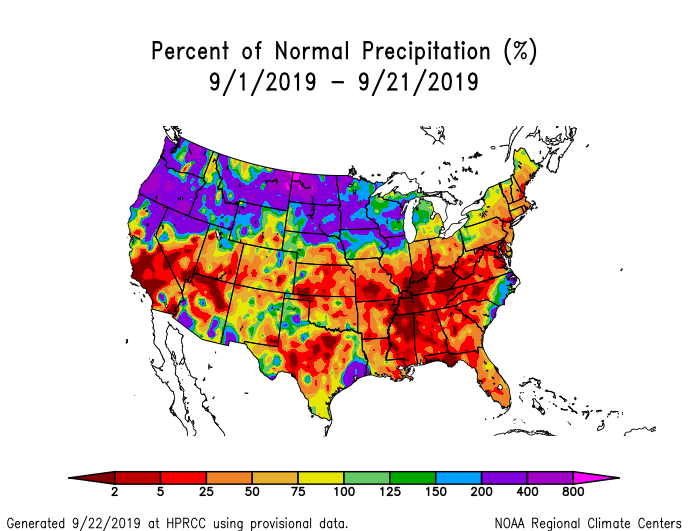
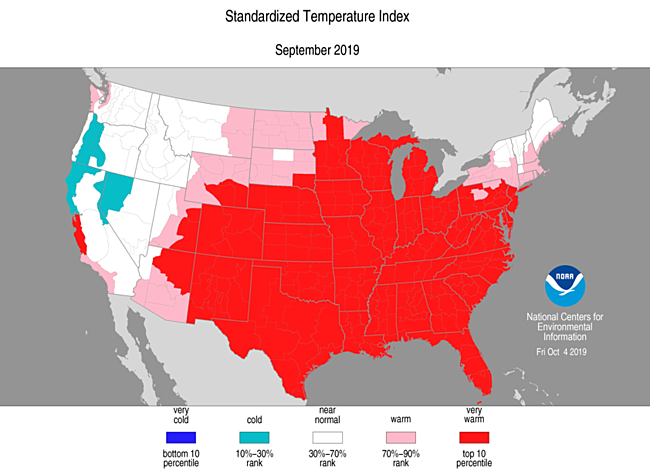
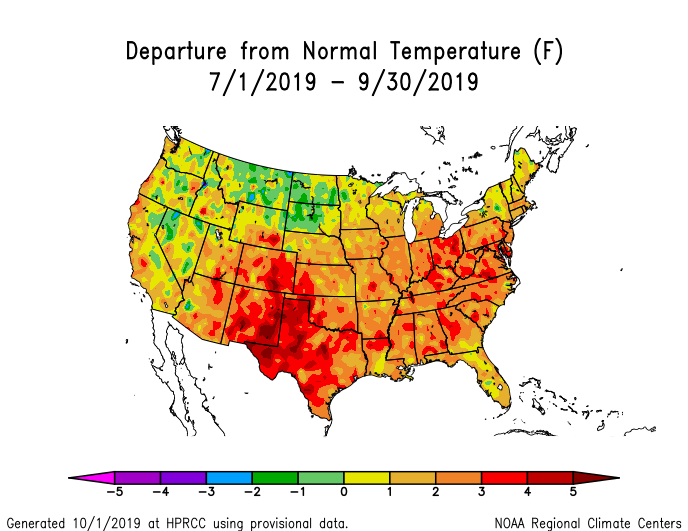
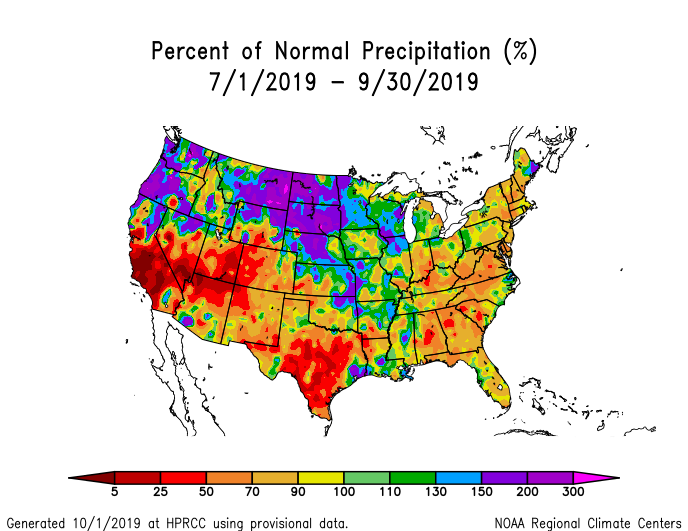
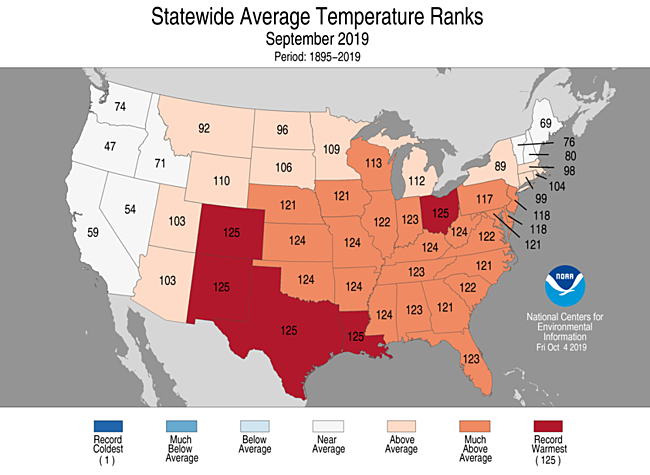
Temperatures during September 2019 were warmer than normal across much of the CONUS from the Rockies to East Coast and from the Gulf Coast to Canadian border, with record warm monthly temperatures occurring from the southern Plains and Southwest to Ohio Valley. Precipitation was below normal from the Lower and Mid-Mississippi Valley to the Gulf and East Coasts, in parts of the southern to central Plains, and much of the Southwest. Monthly precipitation was record dry across parts of the Southeast to Ohio Valley — much of the same region which had near to record-warm temperatures. The combination of drier- and warmer-than-normal conditions resulted in the increased evapotranspiration making drought conditions worse in the Southeast to Ohio Valley and southern Plains to Southwest, as seen by the more extreme SPEI in these regions than the SPI.
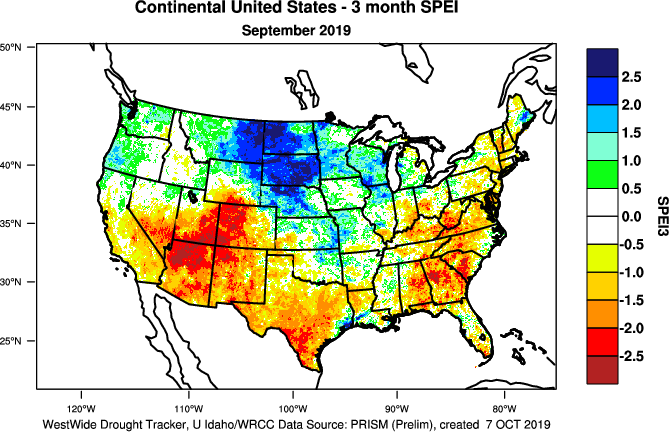
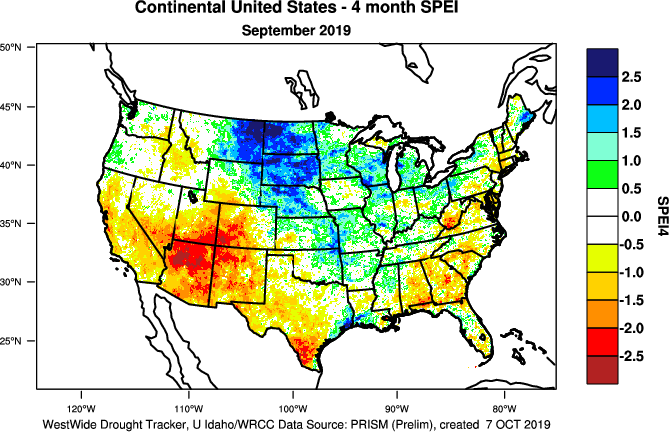
Temperatures in the Southwest were unusually warm for the last two, three, and four months. Precipitation was likewise drier than normal here as well as southern Texas (maps for last 2, 3, and 4 months). The combination of heat and dryness produced more extreme SPEI indices compared to the SPI (SPEI maps for last 2, 3, and 4 months) (SPI maps for last 2, 3, and 4 months).
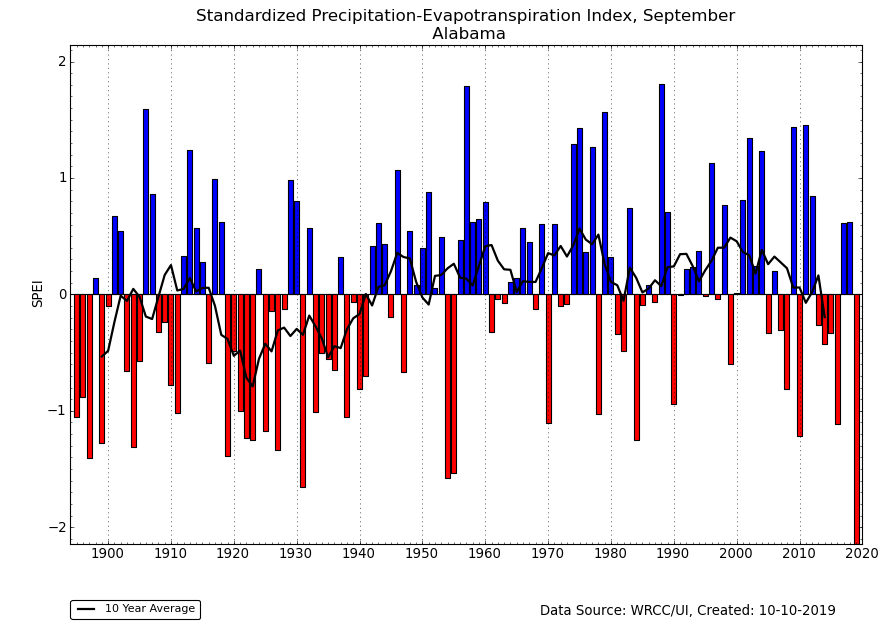 1-month SPEI for Alabama for September, 1895-2019.
|
 1-month SPEI for Kentucky for September, 1895-2019.
|
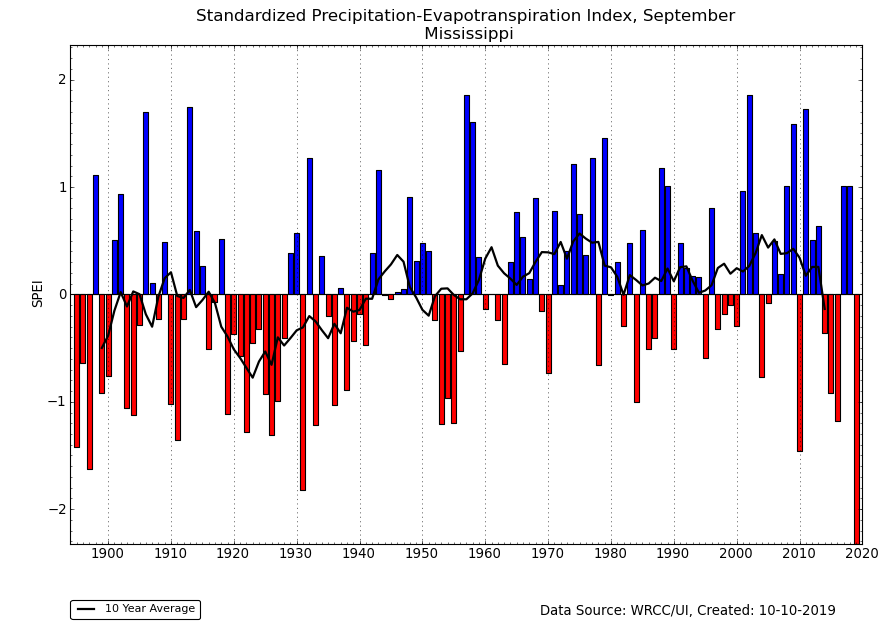
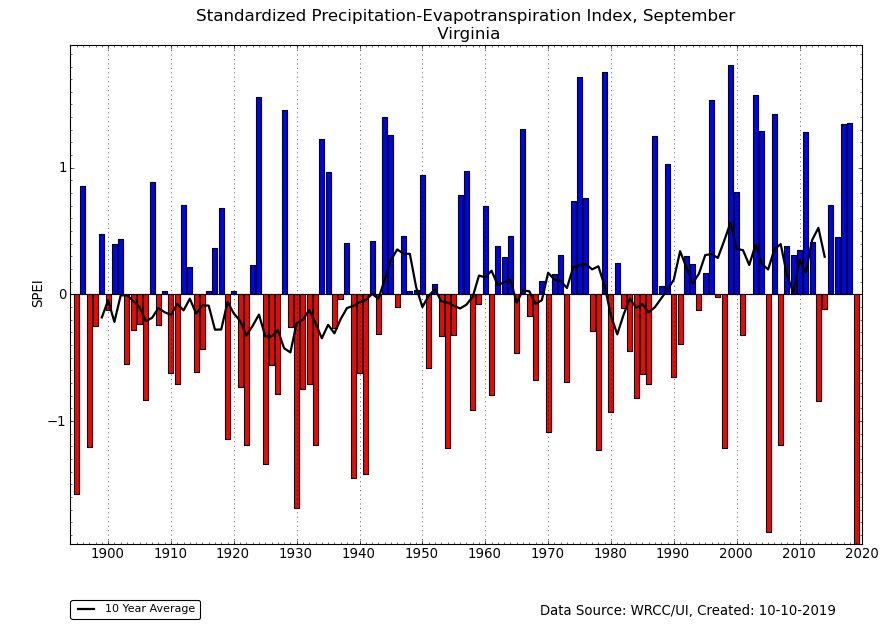
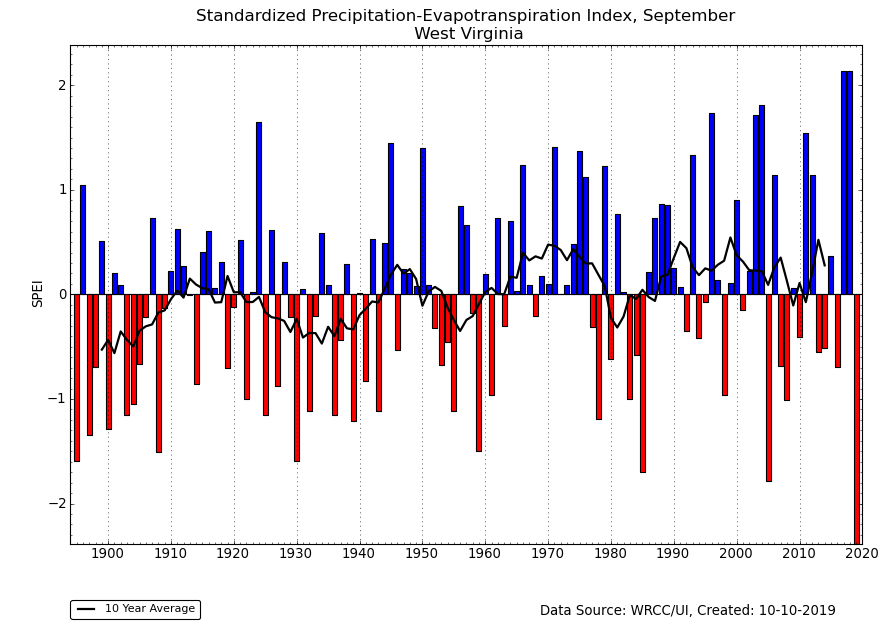
The excessive to record heat and dryness resulted in September SPEI values which far exceeded any in the historical record for several states in the Southeast to Ohio Valley. Record dry statewide SPEI values were set in Alabama, Kentucky, Mississippi, Tennessee, Virginia, and West Virginia. It was the second driest in Georgia.
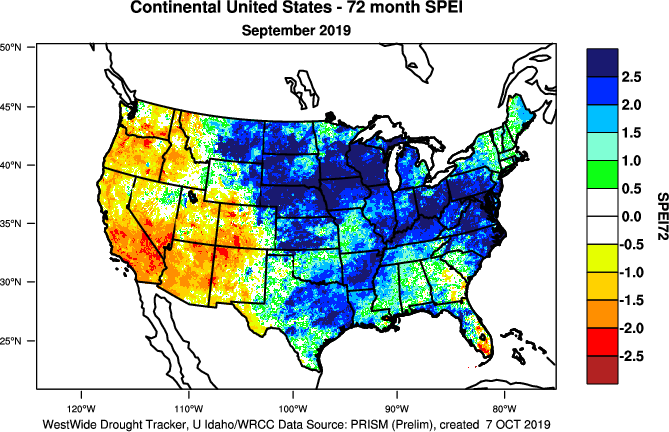 72-month SPEI for current month.
|
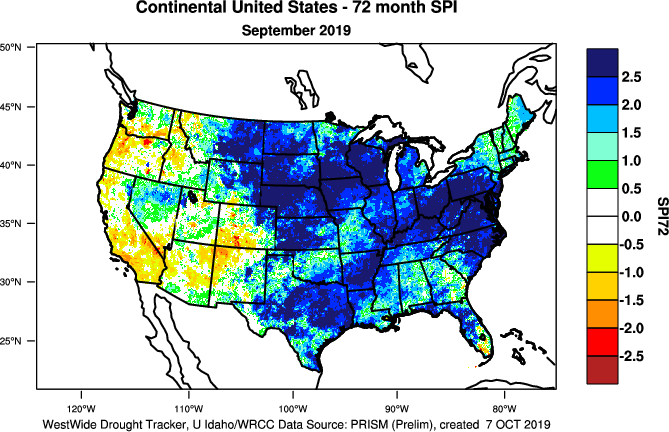 72-month SPI for current month.
|
Much of the West, especially from California to the central Rockies, experienced drier- and warmer-than-normal conditions for much of the last six years. The persistent and excessive heat increased evapotranspiration and made the drought conditions worse, as seen in a more extreme SPEI compared to SPI during this period (SPEI maps for last 24, 36, 48, 60, 72 months) (SPI maps for last 24, 36, 48, 60, 72 months).
Regional Discussion

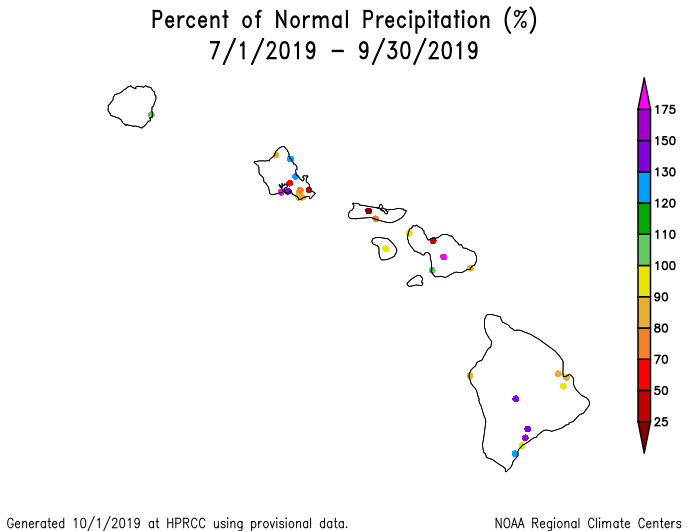
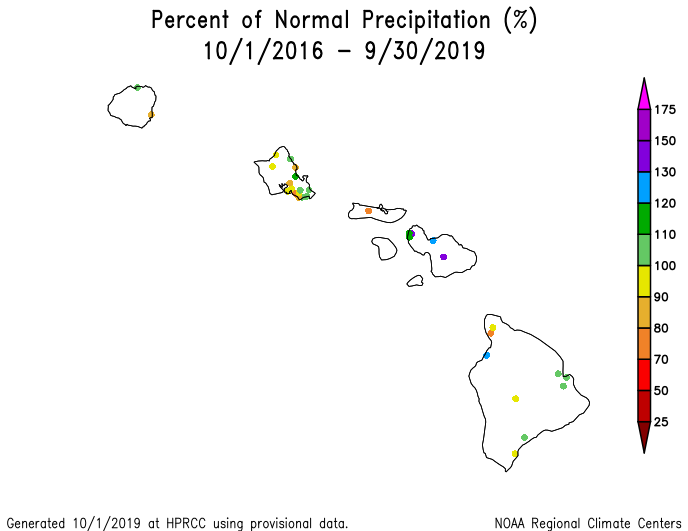
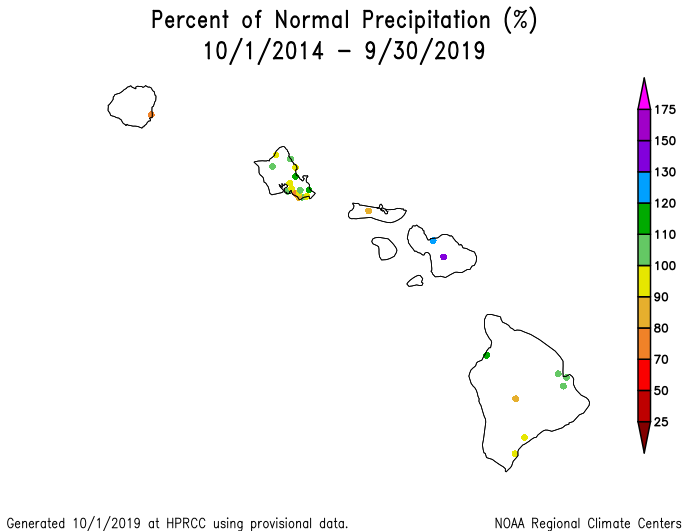
Hawaii percent of normal precipitation map, January-September 2019.
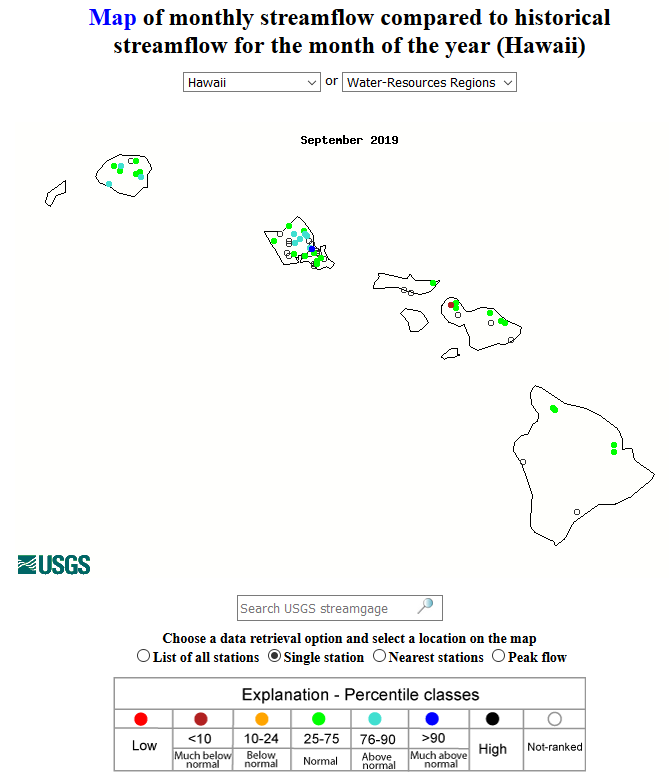
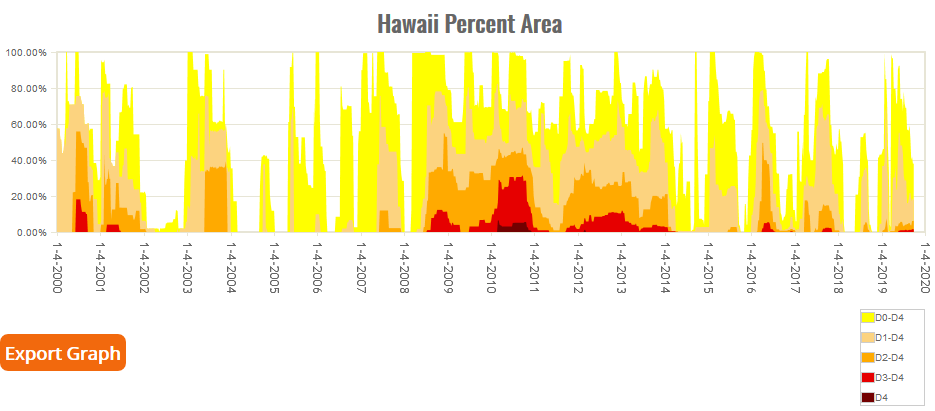
September 2019 had a mixed precipitation anomaly pattern across the Hawaiian Islands. Generally drier-than-normal conditions were observed from northern portions of the Big Island to parts of the central islands for the last two to 12 months; the last 24 months were generally wetter than normal; and drier-than-normal conditions were observed in southern portions of the Big Island and parts of the central islands for longer time scales (last 1, 2, 3, 4, 6, 9, 12, 24, 36, 48, 60 months). Streamflow was mostly near normal. Drought and abnormal dryness expanded in some areas but contracted in more areas due to September rains rains. The statewide drought area contracted slightly from 21.7 percent of Hawaii at the end of August to 17.9 percent at the end of September. Moderate to extreme drought remained on the October 1st USDM map.
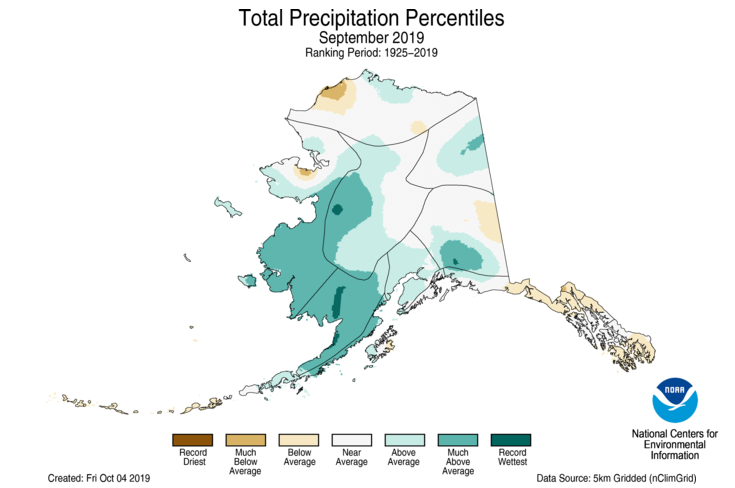
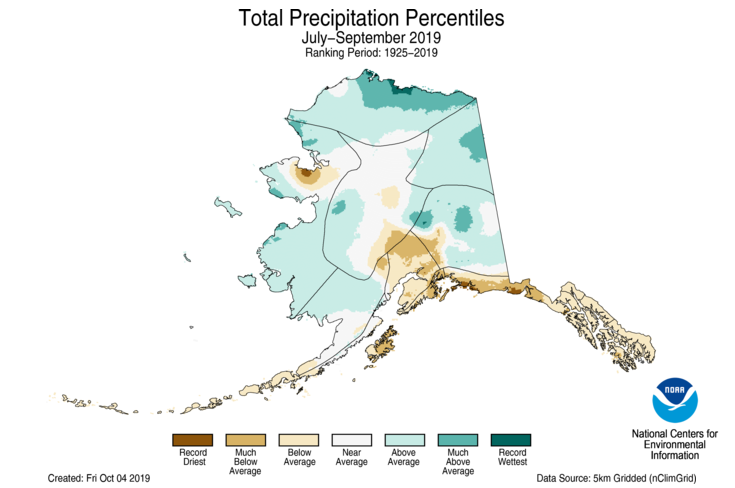
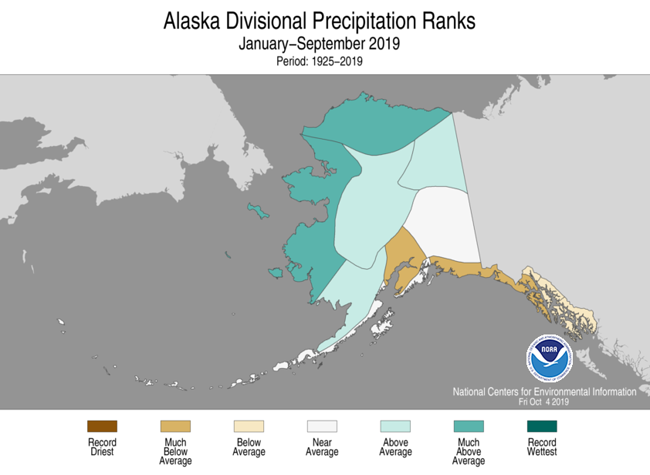
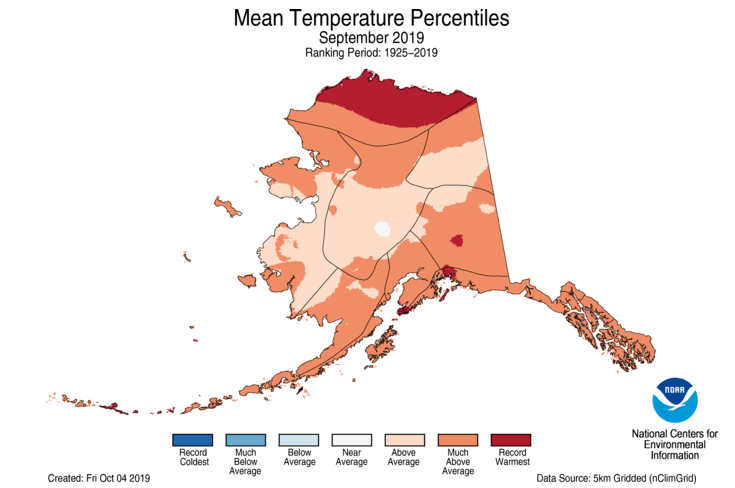
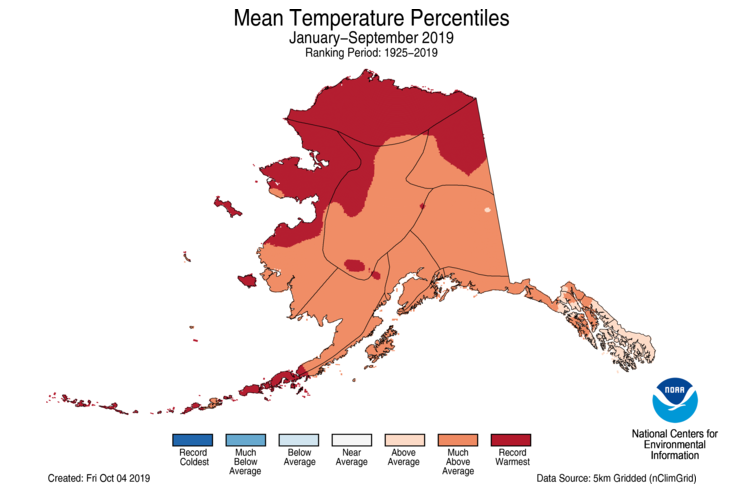
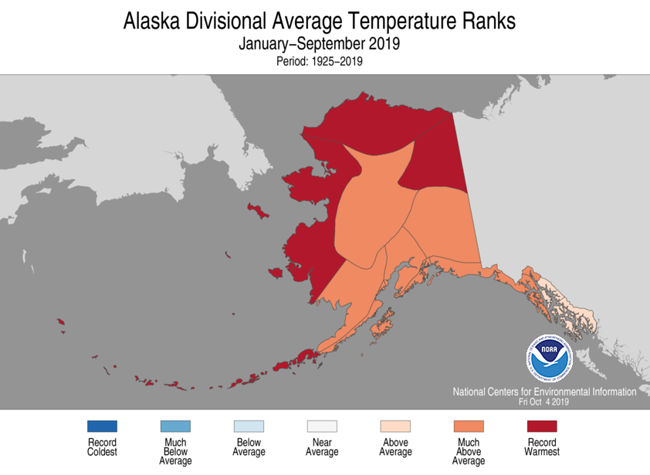
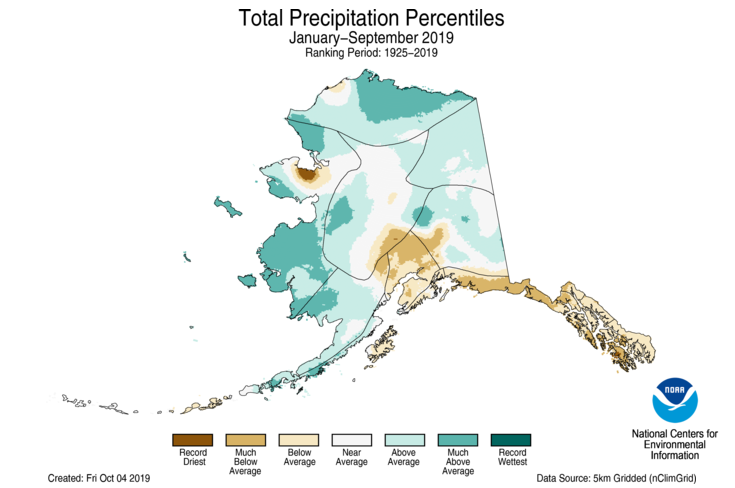 Gridded precipitation percentile map for Alaska, January-September 2019.
|
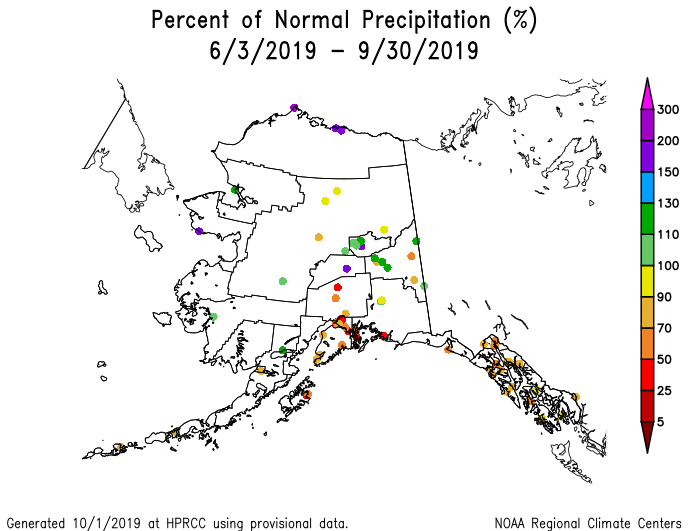
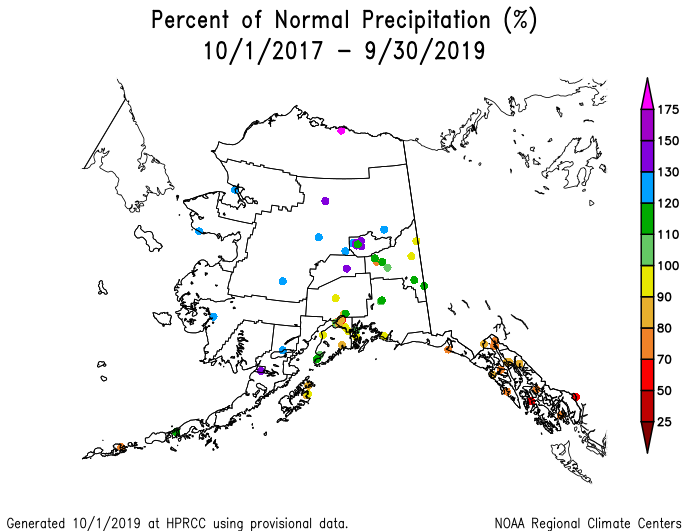
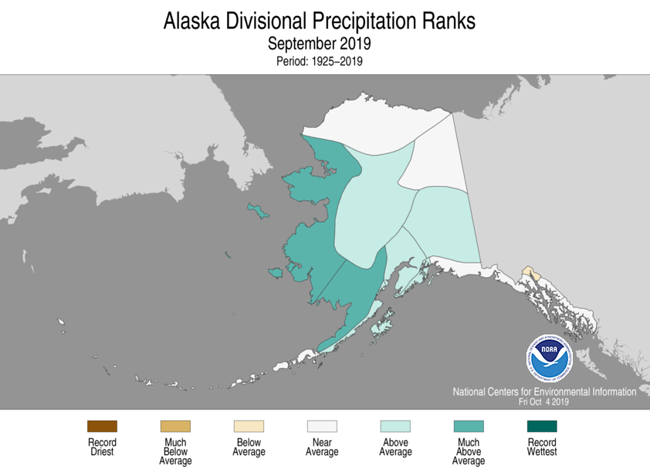
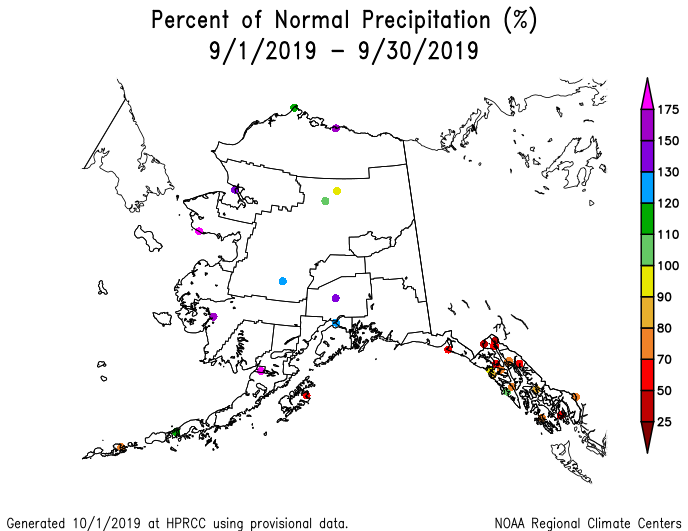 Alaska precipitation anomaly map, September 2019.
|
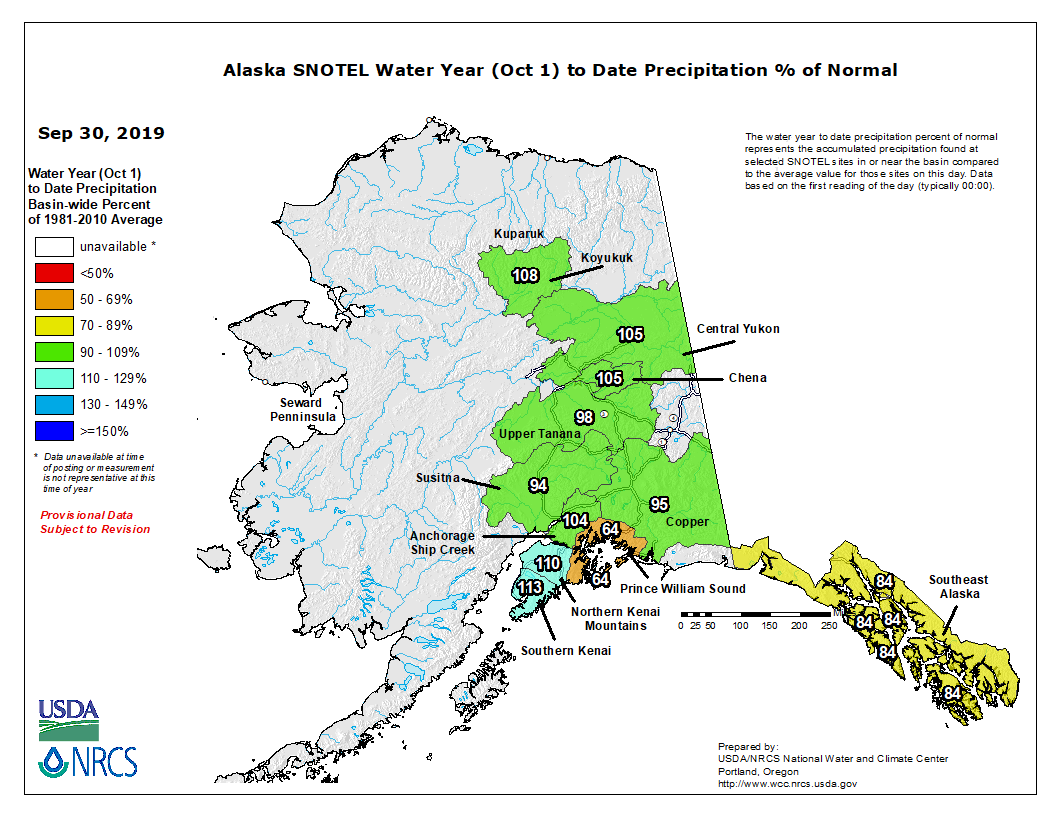
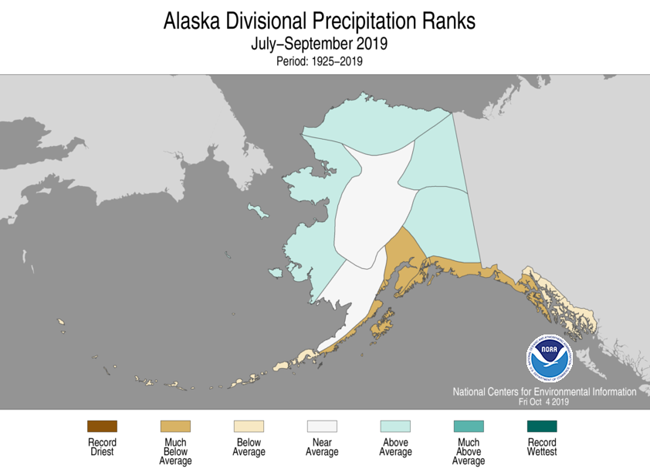
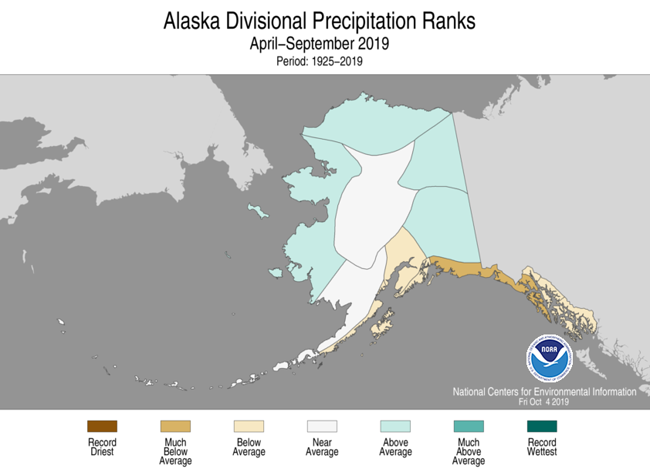
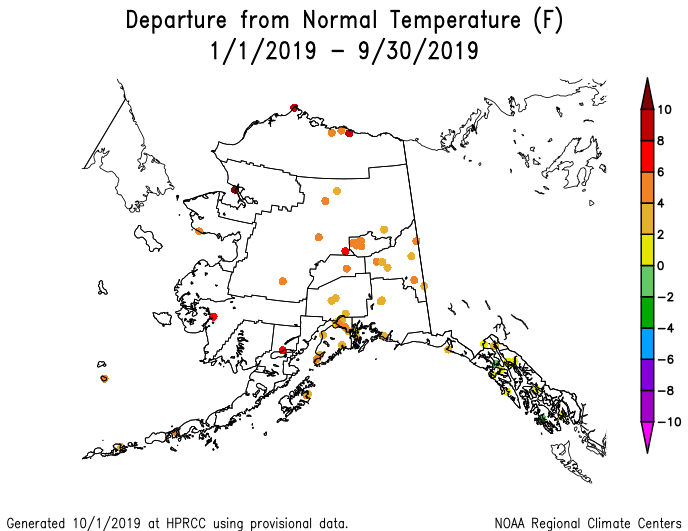
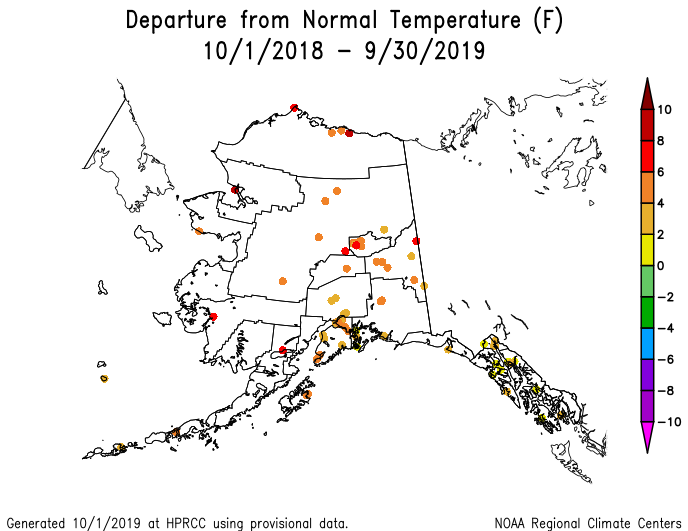
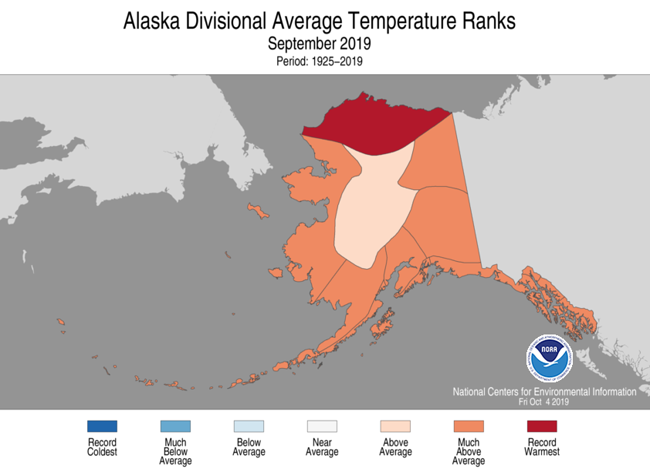
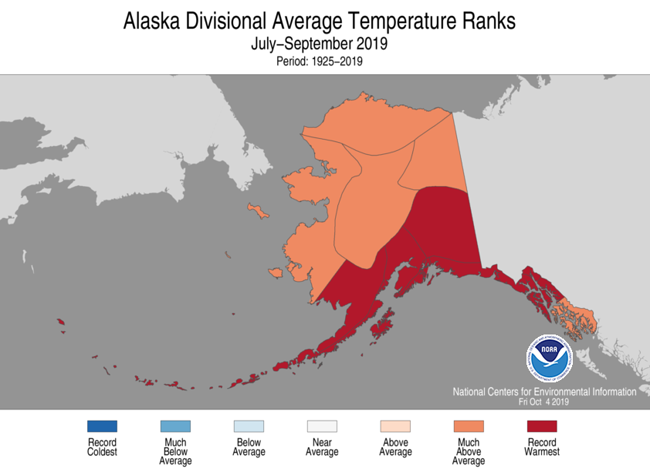
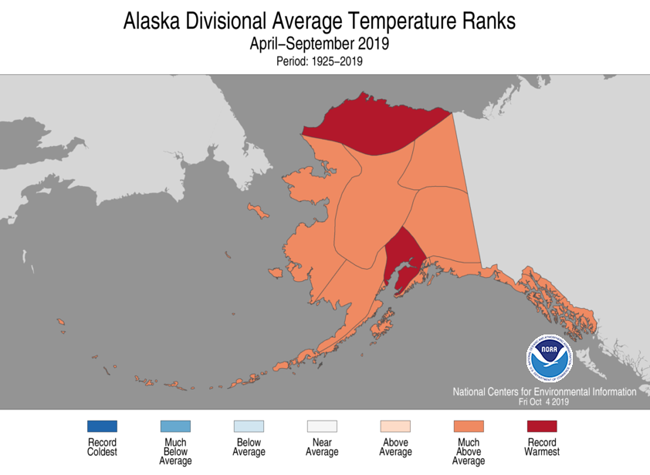
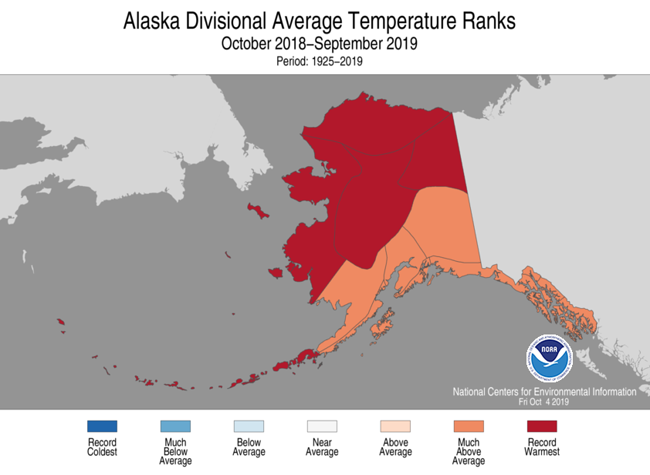
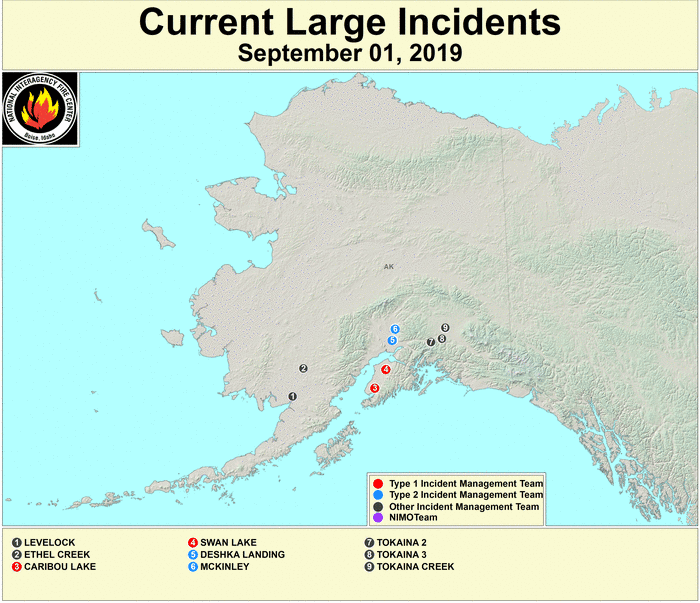
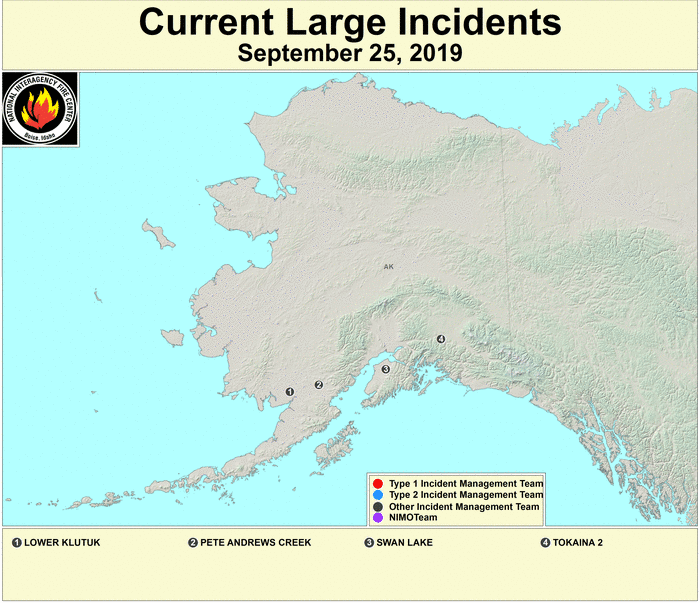
September 2019 was wetter than normal across the southwestern half of Alaska and continued drier than normal across the panhandle and a few other areas. Drier-than-normal conditions dominated the panhandle to south central coastal areas at the 2- to 9-month time scales, with wetter-than-normal conditions to the north and west. At longer time scales, dryness persisted in the panhandle with near to wetter conditions generally elsewhere (low elevation station precipitation anomaly maps for the last 1, 2, 3, 4, 6, 9, 12, 24, 36, 48, 60 months) (high elevation SNOTEL station precipitation maps for last 1 and 12 months, and SNOTEL basin map for last 12 months) (gridded precipitation percentile maps for the last 1, 3, 9 months) (climate division precipitation rank maps for the last 1, 3, 6, 9, 12 months) (Leaky Bucket model precipitation percentile map). Temperatures during September were warmer than normal across the state, with record warmth occurring in some areas, especially along the north coast. Warmer-than-normal conditions to record warmth dominated the state at longer time scales (low elevation station temperature maps for the last 1, 2, 3, 4, 9, 12 months) (gridded temperature percentile maps for the last 1, 3, 9 months) (climate division temperature rank maps for the last 1, 3, 6, 9, 12 months). (Leaky Bucket model temperature percentile map). Modeled soil moisture and satellite-based soil moisture estimates showed drier-than-normal conditions in southwestern areas and south-central coastal to panhandle areas, and streamflow was below normal below normal at a few southern locations. Several large wildfires were burning in the south central part of the state at the beginning of the, but by the end of the month only a couple large wildfires were noted (wildfire maps for September 1, 13, 20, 25, 30). According to the National Interagency Fire Center's (NIFC) National Interagency Coordination Center, as of September 30th, 2.58 million acres have been burned in Alaska so far this year. Abnormally dry to drought conditions contracted in the southern coastal region, leaving behind some abnormal dryness to moderate drought, while moderate to extreme drought continued in the panhandle. Moderate to extreme drought contracted from 17.8 percent of the state at the beginning of September to 5.0 percent on the October 1st USDM map, with abnormally dry to drought conditions shrinking from 30.9 percent to 11.4 percent. A new maximum drought duration record was set for the state — moderate drought began on July 17, 2018 and has continued to the latest map (dated October 1, 2019), last (so far) 64 weeks.
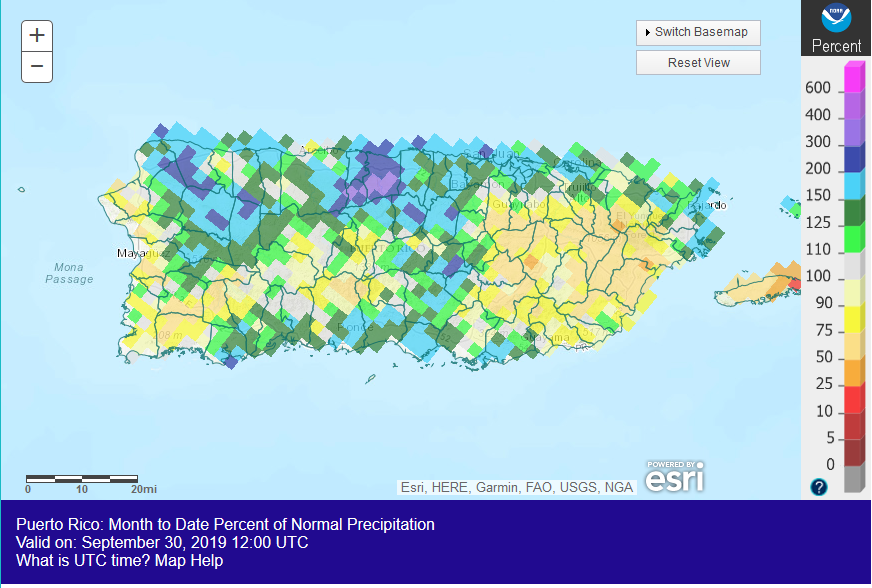
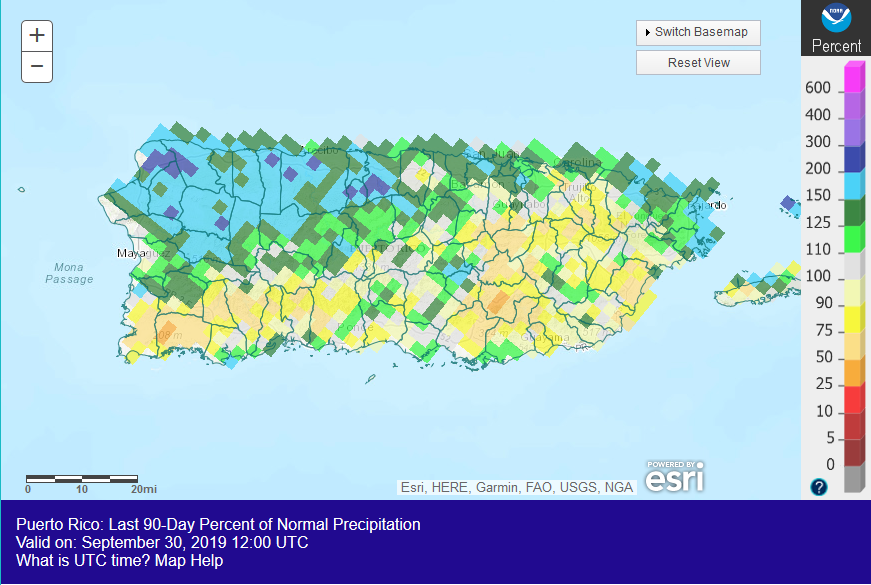
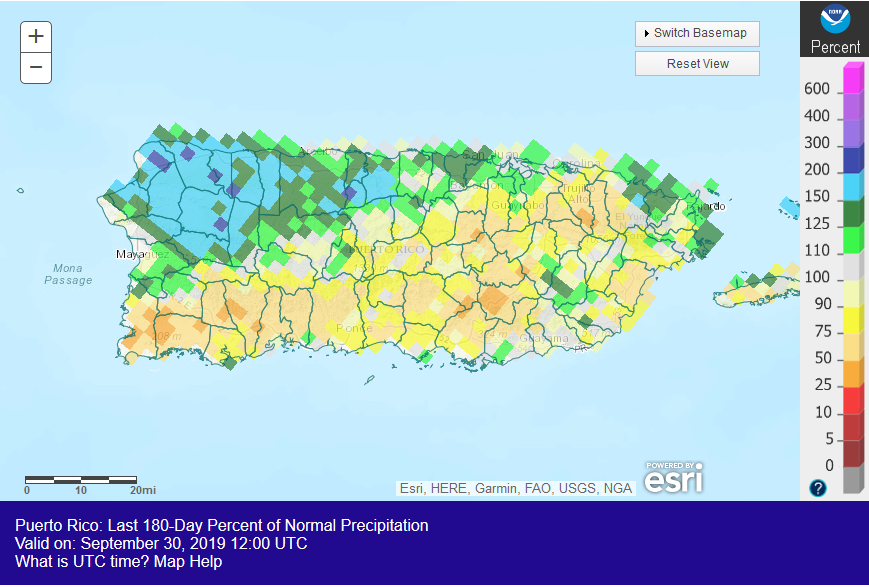
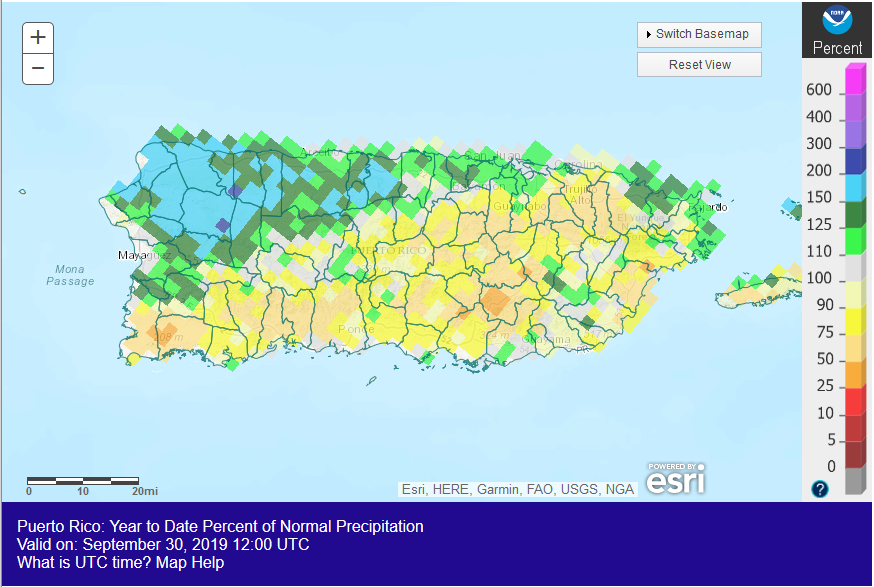
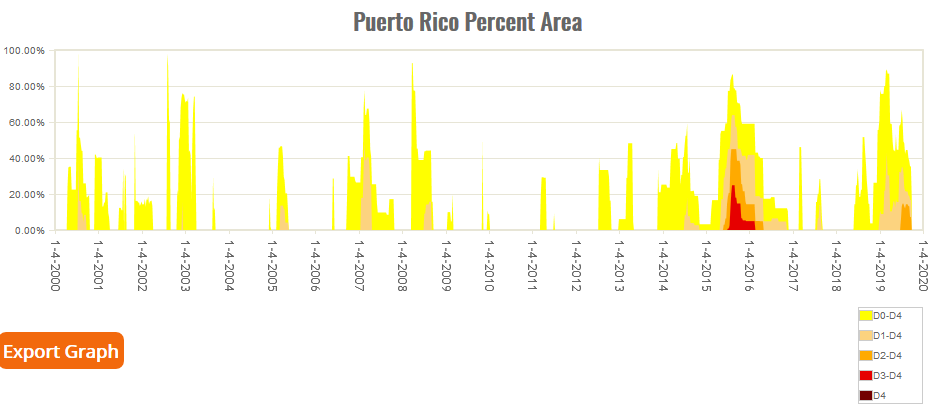
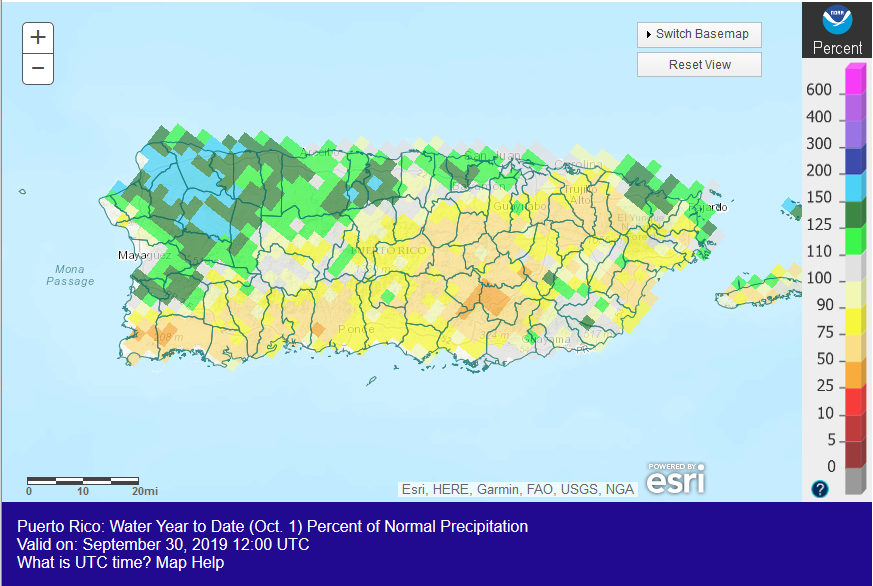 Puerto Rico percent of normal precipitation map for October 2018-September 2019.
|
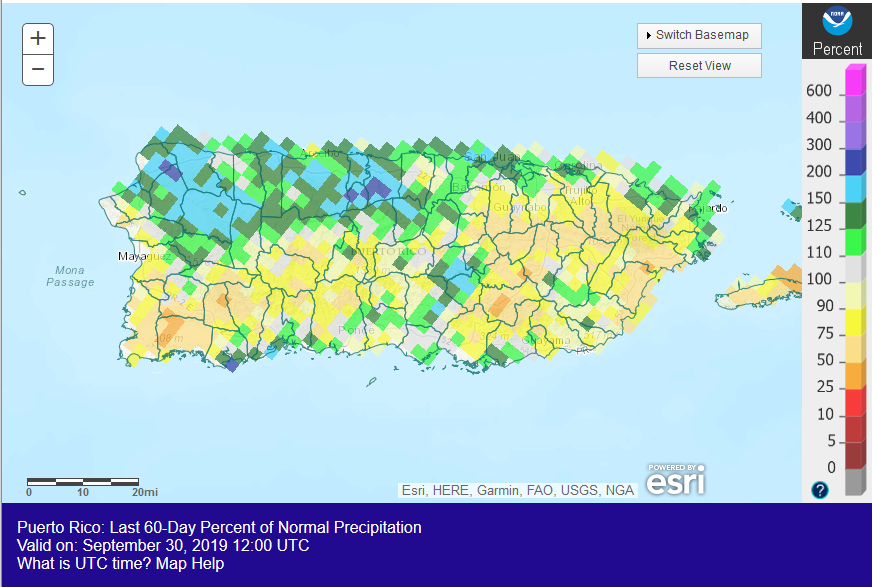
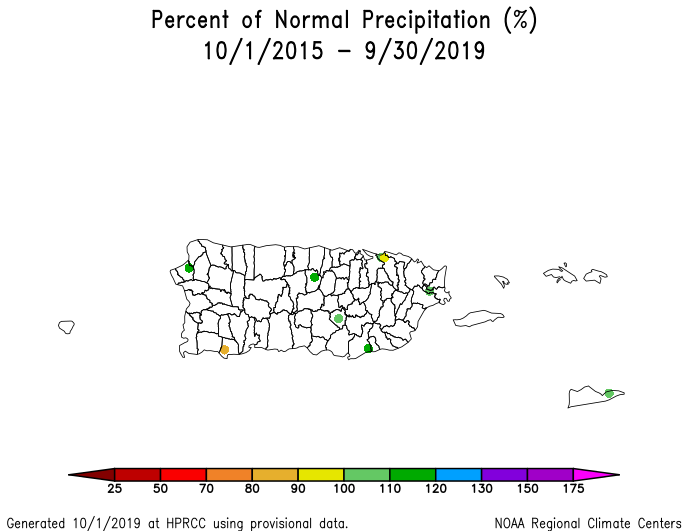
 Puerto Rico and the U.S. Virgin Islands percent of normal precipitation map for October 2018-September 2019.
|
Puerto Rico and U.S. Virgin Islands:
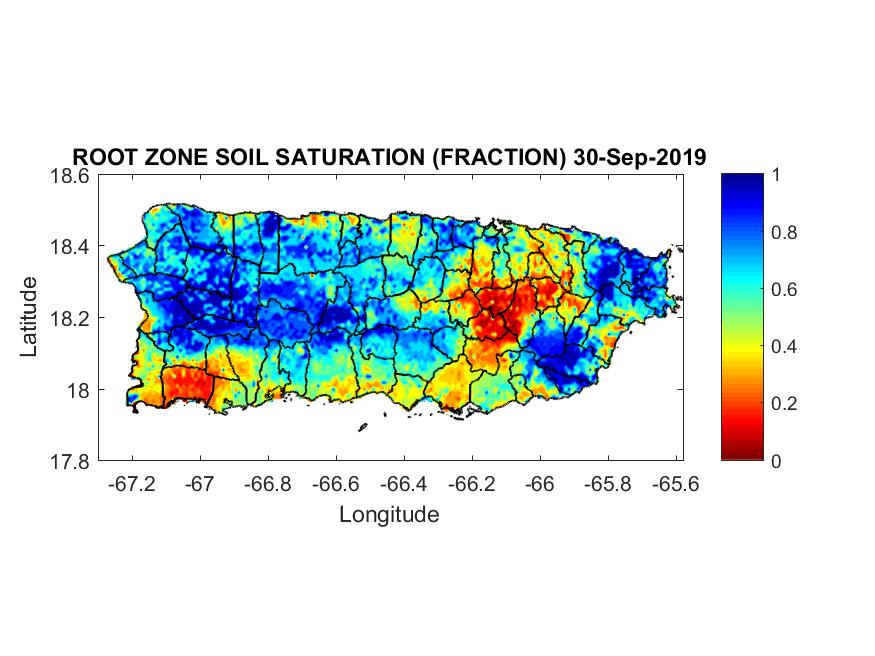
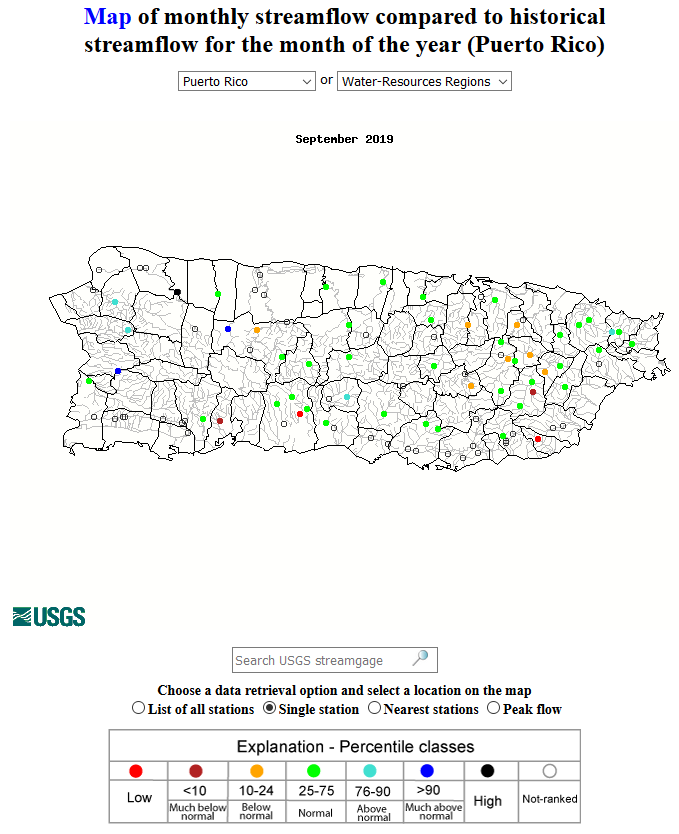
In spite of Tropical Storm Karen moving across the area the last half of the month, the U.S. Virgin Islands (USVI) and parts of Puerto Rico were still mostly drier than normal during September. Drier-than-normal conditions persisted and became more widespread across southwestern to northeastern Puerto Rico in 2019 at longer time scales. St. Thomas was wetter than normal for much of the 2019 time scales, while St. Croix was drier than normal. Puerto Rico and the USVI were drier than normal at 12 to 24 months, while wetter-than-normal conditions dominated at longer time scales (radar-based precipitation anomaly estimates for the last 1, 2, 3, 6, 9, 12 months) (low elevation station precipitation maps for the last 1, 2, 3, 4, 6, 9, 12, 24, 36, 48, 60 months). Soil conditions improved with just a couple areas in the southwest and east central still dry. September streamflow was below normal at just a few stations. As seen on the October 1st USDM map, abnormal dryness to moderate drought continued along the southern coast of Puerto Rico, contracting from 40.1 percent at the end of August to 17.9 percent at the end of September. The USVI were free of drought and abnormal dryness at the end of September.
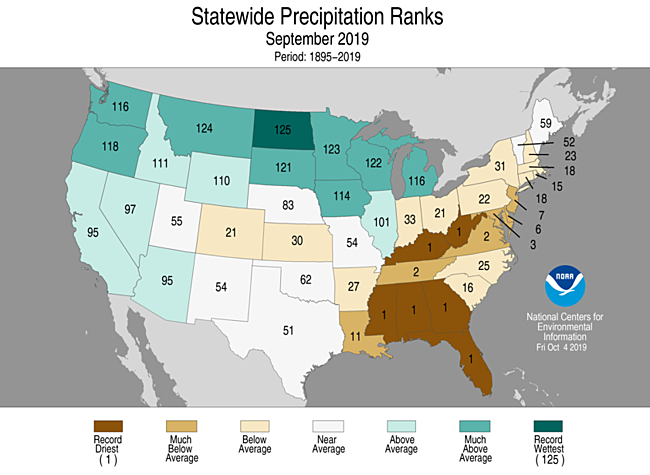
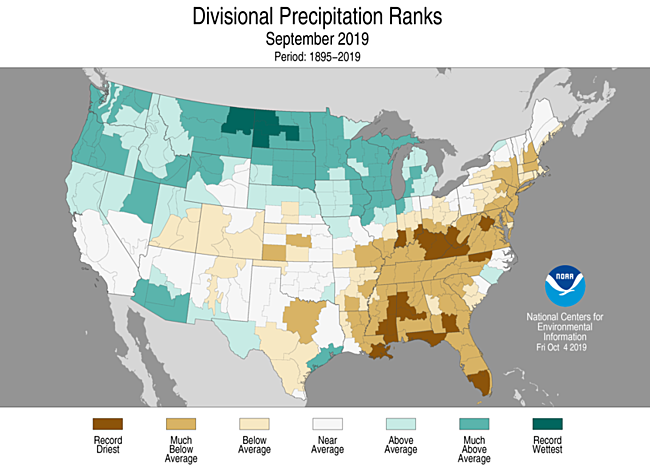
CONUS State Precipitation Ranks:
|
|
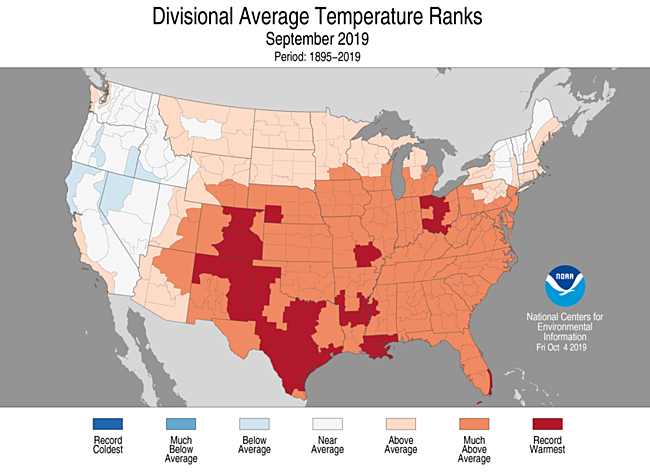
September 2019 was drier than normal across much of the Lower and Mid-Mississippi Valley to East Coast and parts of the Southwest and southern to central Plains. Twenty-five states had a rank in the driest third of the 125-year historical record for September, including eleven in the top ten category. These included the driest on record for Alabama, Mississippi, Georgia, Florida, Kentucky, and West Virginia; second driest for Tennessee and Virginia; third driest for Maryland; sixth driest for Delaware; and seventh driest for New Jersey. All of these states also ranked in the top ten warmest category for September.
|
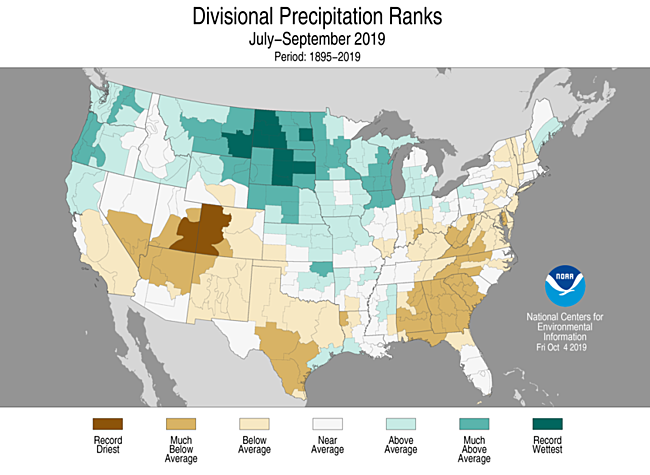
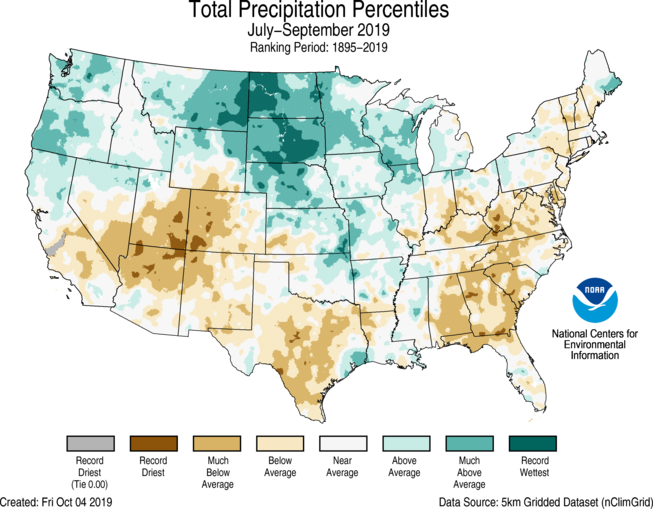
|
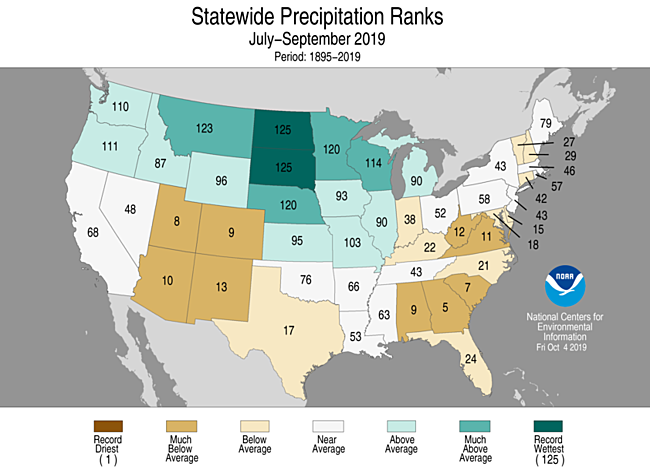
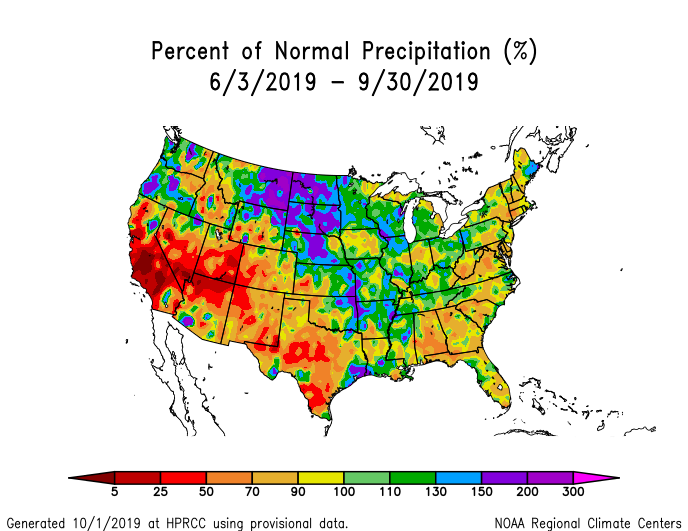
The last three months (July-September 2019) were drier than normal across the Southwest to southern Plains, Ohio Valley, and Southeast to Northeast. Local areas were record dry. Nineteen states had a rank in the driest third of the historical record, with six states top ten driest. These included Georgia (fifth driest), South Carolina (seventh driest), Utah (eighth driest), Alabama (ninth driest), Colorado (ninth driest), and Arizona (tenth driest).
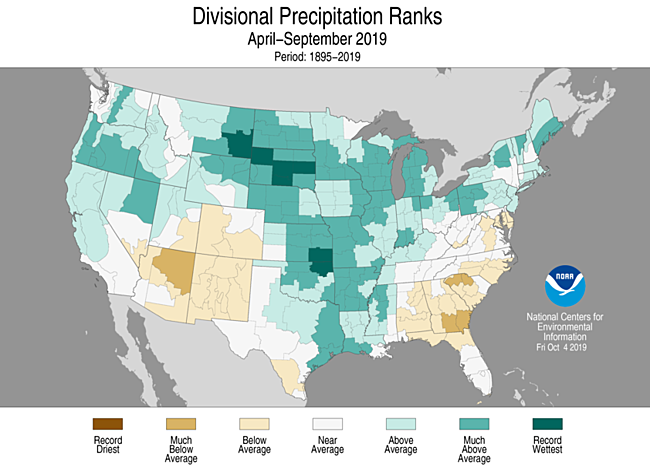
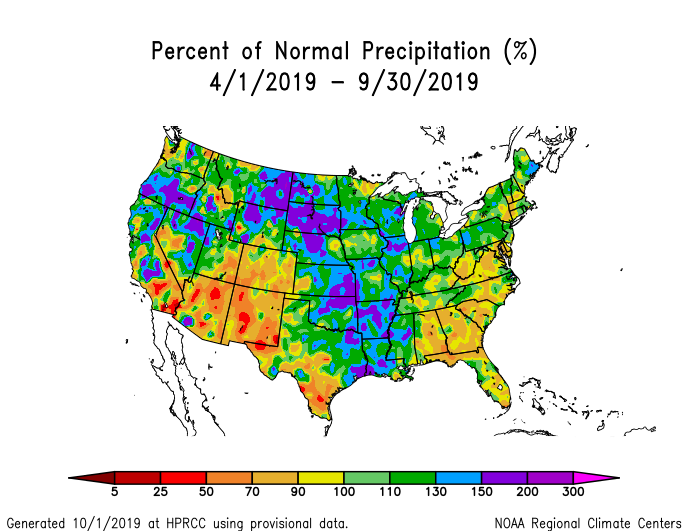
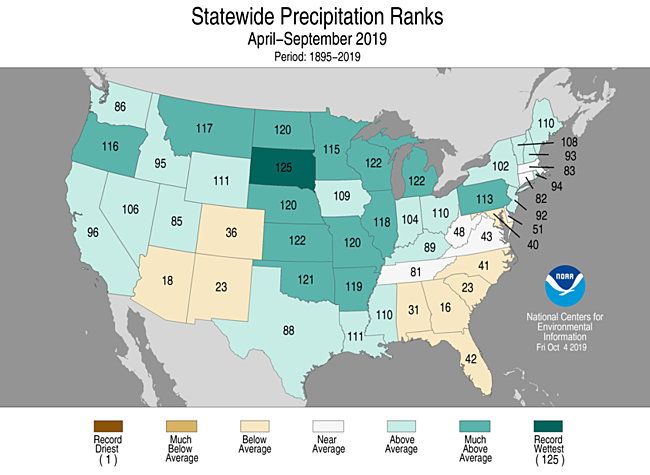
The last six months (April-September 2019) were drier than normal in the Southwest, Southeast, and part of the Mid-Atlantic region. Nine states had a rank in the driest third of the historical record.
|
|
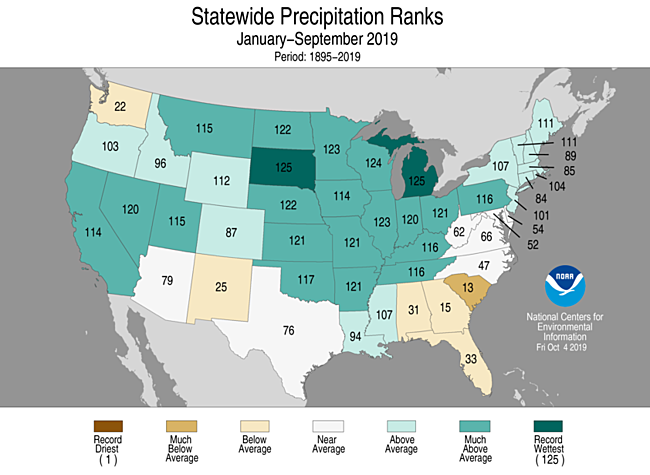
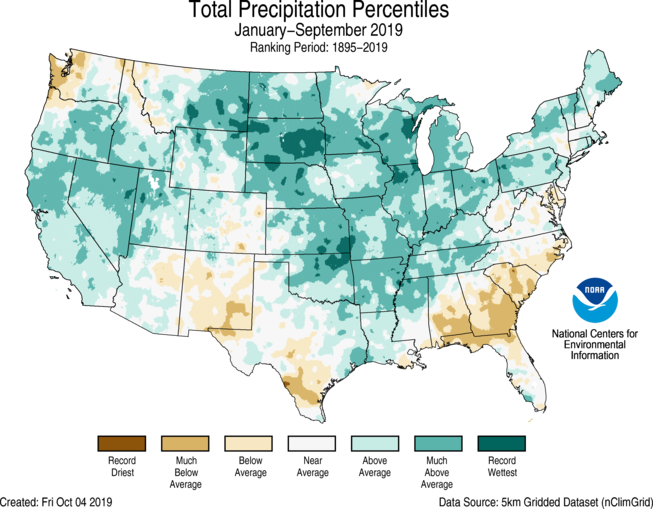
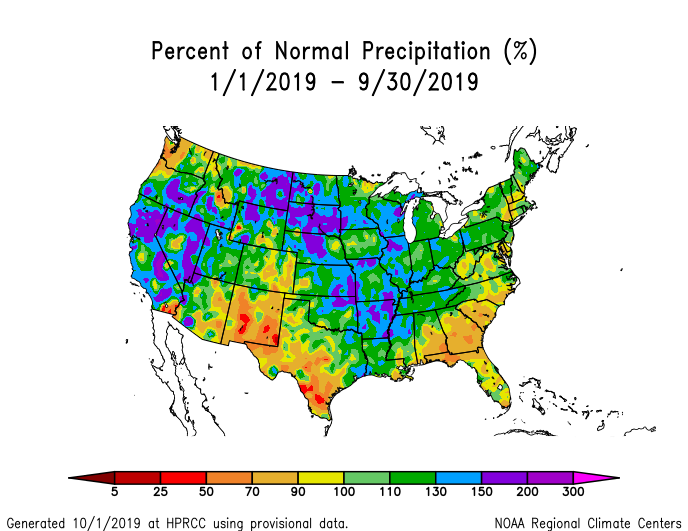
The precipitation anomaly map for the year to date (January-September) showed drier than normal conditions in the coastal Southeast and parts of the Pacific Northwest, Southwest, and southern Plains. Six states (in the Northwest, Southwest, and Southeast) ranked in the driest third of the historical record, including South Carolina which ranked 13th driest. Otherwise, a wet circulation pattern dominated much of the country.
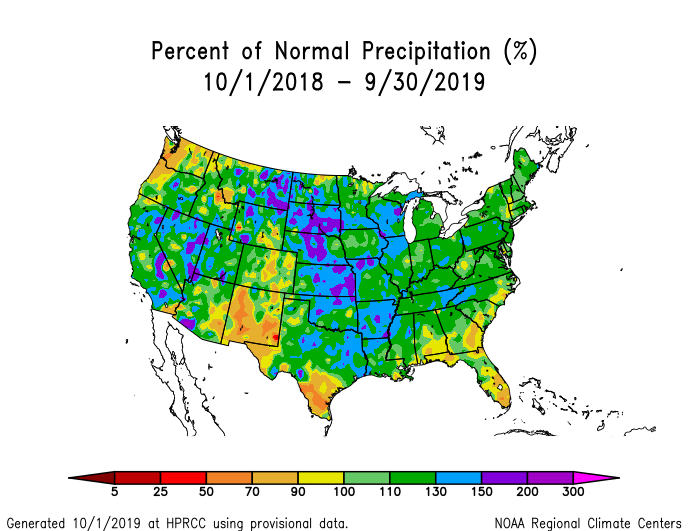
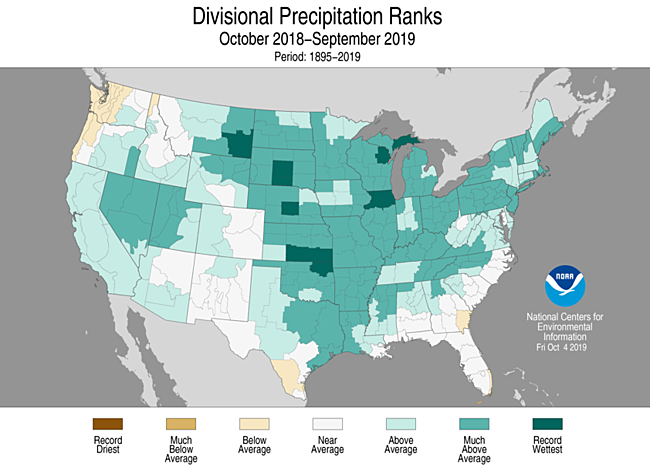
The wet circulation pattern persisted across much of the CONUS for the last 12 months. Washington was the only state that ranked in the driest third of the 1895-2019 record for October 2018-September 2019, while at the other end of the spectrum, South Dakota and Wisconsin were record wet.
 Primary Corn and Soybean Belt precipitation, September, 1895-2019.
|
 Primary Corn and Soybean Belt precipitation, March-September, 1895-2019.
|
During September 2019, the Primary Corn and Soybean agricultural belt was warmer than normal, while the northern parts were wetter than normal and the southern parts were drier than normal. The month ranked as the 35th wettest and third warmest September, regionwide, in the 1895-2019 record.
March marks the beginning of the growing season for the Primary Corn and Soybean agricultural belt. March-September 2019 was mostly wetter than normal with temperatures warmer than normal in the south and near normal in the north. The 7-month period ranked as the second wettest and 55th warmest March-September, regionwide, in the 1895-2019 record. It is interesting to note that, except for 2012 which ranked fifth driest, all of the growing seasons since 2008 have been much wetter than normal, and the last 12 years have generally been warmer than normal.
With the weather turning much drier and hotter in the Southeast and southern Plains, some agricultural regions were beginning to be affected by drought during September. As of October 1st, drought was affecting eight percent of the nation's corn production; nine percent of soybean production; 19 percent of hay acreage; 17 percent of cattle inventory; 13 percent of winter wheat production; and zero percent of spring wheat production. Except for spring wheat, these are all higher than they were the previous month. According to September 30th U.S. Department of Agriculture (USDA) reports, 14 percent of the nation's corn crop, 13 percent of soybeans, 20 percent of cotton, and 25 percent of pasture and range were in poor to very poor condition, while 31 percent of the nation's topsoil and 30 percent of subsoil were short to very short of moisture (dry to very dry). But these national conditions reflect an average of very wet and very dry areas. The states having the driest soils were spread across the country. More than 50 percent of the topsoils were very dry in states across the West, southern Plains, Southeast, Ohio Valley, Mid-Atlantic, and New England. They included (percent area with short to very short topsoil / subsoil): California (85% / 70%), Nevada (60% / 50%), Wyoming (65% / 69%), New Mexico (59% / 70%), Texas (64% / 70%), Indiana (52% / 51%), Ohio (54% / 46%), Kentucky (87% / 80%), Tennessee (78% / 81%), Arkansas (62% / 60%), Louisiana (65% / 40%), Mississippi (82% / 79%), Alabama (93% / 84%), Georgia (92% / 86%), South Carolina (85% / 77%), North Carolina (71% / 55%), Virginia (88% / 80%), West Virginia (85% / 69%), Maryland (99% / 89%), Delaware (100% / 97%), Massachusetts (80% / 58%), and New Hampshire (58% / 50%). More than a third of the pasture and rangeland was in poor to very poor condition in Alabama (51%), Arizona (52%), California (45%), Delaware (39%), Georgia (49%), Indiana (46%), Kentucky (60%), Maine (40%), Maryland (38%), New Mexico (35%), North Carolina (42%), Ohio (35%), South Carolina (42%), Tennessee (45%), Texas (49%), Virginia (74%), and West Virginia (63%).
NOAA Regional Climate Centers:
More information, provided by the NOAA Regional Climate Centers and others, can be found below.
As summarized by the High Plains Regional Climate Center, in a break from recent months, average temperatures across the High Plains region were, overall, above normal for September. Precipitation, however, was not uniform across the region, with above-normal precipitation generally to the north and below-normal precipitation to the south. Crops continued to progress through the month, but were still far behind previous years. Concerns at this time include the timing of the first freeze (some have already experienced this) and the wetness. Heavy rainfall across northern areas this month has led to muddy or inundated fields, which will be very slow to dry as the season progresses. It is possible that some areas of the region will need to wait until soils freeze in order to complete harvest.
Dry conditions prevailed across southern portions of the region. This was a welcome break from the heavy rain and flooding that has impacted so many in recent months. However, in some areas, such as western Wyoming, western and central Colorado, and southwestern Kansas, abnormally dry and moderate drought conditions have expanded or developed. Persistently drier than normal conditions over the last three months have been a key factor in the recent expansion of moderate drought.
Slight changes in drought conditions occurred this month, with both improvements and degradations. According to the USDM, the area experiencing drought or abnormally dry conditions (D0-D4) in the High Plains region increased over the past month, from approximately 12 percent to 21 percent. This included improvements to drought conditions in north-central North Dakota, and the development, or expansion, of drought conditions in portions of western Colorado and southwestern Kansas. Multiple rounds of showers and thunderstorms impacted the High Plains region this month, especially across northern areas. This rainfall was beneficial for portions of north-central North Dakota and northeast Nebraska, where drought and abnormally dry conditions were eliminated by the middle of the month. Other areas of the region, however, were much drier. For instance, abnormally dry conditions (D0) expanded in parts of Colorado and Wyoming. Moderate drought (D1) expanded in southwestern Colorado and a small pocket of D1 also developed just northeast of this area. Meanwhile, across Kansas, D0 expanded over the southwestern portion of the state, with a slight expansion of D1 as well. Consistently below-normal precipitation over the past three months in portions of Colorado and Kansas has been a key factor to the recent D1 expansion.
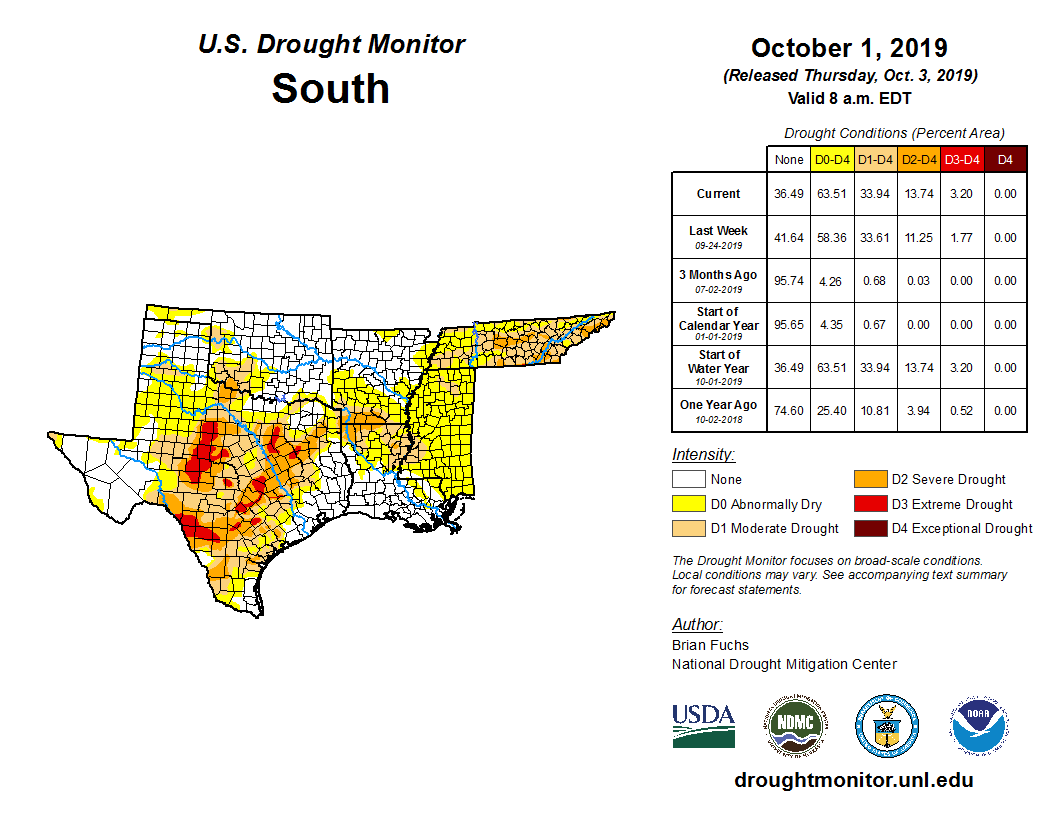
As explained by the Southern Regional Climate Center, temperatures for the month of September were above normal across the Southern region, with September 2019 ranking as the warmest September on record for the region. Precipitation for the month was below normal across much of the region. Parts of central, eastern, and northern Texas; western and eastern Oklahoma; northern, eastern, central, and southern Arkansas; and most of Louisiana, Mississippi, and Tennessee received 50 percent or less of normal precipitation. Parts of central, eastern, and southwestern Texas; western Oklahoma; southern, central, and eastern Arkansas; northern, northeastern, and southeastern Louisiana; and most of Tennessee and Mississippi received 25 percent or less of normal precipitation, while parts of central and eastern Texas; southern, central, and northern Mississippi; and western and eastern Tennessee received 5 percent or less of normal precipitation. This was the eighth driest September on record regionwide.
At the end of September, drought conditions continued to deteriorate across the Southern region. While extreme drought conditions improved across southwestern Oklahoma and deep south Texas, extreme drought conditions developed across central and southern Texas. Severe drought classifications were still present in central and southern Texas as well as southwestern Oklahoma, while new areas developed in eastern and central Texas, southeastern Tennessee, northwestern and northeastern Louisiana, and southwestern Arkansas. Moderate drought classifications expanded across central and northern Texas, western Oklahoma, northern Louisiana, southern Arkansas, western Mississippi, and most of Tennessee. There was an increase in the overall area experiencing abnormally dry conditions as abnormally dry conditions developed or expanded across northern, western, and eastern Mississippi, northern Louisiana, and southern, western, and eastern Arkansas.
As described by the Midwest Regional Climate Center, September precipitation ranged from record wet to record dry across the region. Most of the Upper Midwest received more than 150 percent of normal with some areas having more than three times normal. Meanwhile areas in the Ohio River Valley had less than 25 percent of normal in September with much of Kentucky receiving less than 10 percent of normal. Summer-like temperatures extended into September with above-normal conditions across the Midwest. Average temperature for the region was 67.8 degrees F (19.9 C) which was 4.9 degrees F (2.7 C) above normal ranking 2019 as the second warmest September on record (1895 to 2019).
The exceptionally dry conditions in Kentucky led to moderate and severe drought in September according to the USDM. Record low precipitation and extreme heat, which increased evaporation, quickly dried out soils. More than half the state was in drought as of September 24th, with more than 90 percent of the state in drought by October 1st. Meanwhile, drought and abnormally dry conditions across the Upper Midwest decreased significantly with heavy rainfall in September. All of Minnesota, Iowa and Wisconsin were free of drought, and even abnormally dry conditions, by October 1st, while just a few counties in Michigan and Missouri were affected by drought.
The warmer temperatures in September helped bring crops along toward maturity but likely affected grain fill, especially where it was dry. Due to the late planting that pushed into June, in eight Midwest states (excluding Kentucky) corn maturity (18 to 46 percent behind) and soybeans dropping leaves (21 to 35 percent behind) were well behind the 5-year averages on a statewide basis. The lack of freezing temperatures across much of the Midwest allowed the growing season to continue into October for most of the region.
As noted by the Southeast Regional Climate Center, temperatures were much above average across the Southeast and Puerto Rico for the month of September, while precipitation was well below normal across much of the Southeast region. There were 45 stations that ranked or tied for 1st warmest in the Southeast region as far as mean temperatures. A very dry airmass was over the region for most of the month. At least 72 long-term stations observed September precipitation totals that were ranked within their five lowest values on record, including Montgomery, AL (1872-2019; 0.05 inch, 1.3 mm), Muscle Shoals, AL (1893-2019; 0.11 inch, 2.8 mm), and Charlotte, NC (1878-2019; 0.19 inch, 4.8 mm). A few long-term stations had no measurable precipitation on any day in September, including Pensacola, FL (1879-2019), Gainesville, GA (1891-2019), and Marion, AL (1950-2019).
Drought conditions increased throughout the month of September due to extreme dryness and warmer than average temperatures for most of the region. The exceptions include the eastern Carolinas, which were impacted by Hurricane Dorian, southern Florida, and Puerto Rico. At the end of the month, a small pocket of extreme drought (D3) developed in central Alabama. Severe drought (D2) still covered small areas in Alabama, central Georgia, and areas in central South Carolina. Moderate drought (D1), ringed by an area of dry conditions (D0), expanded through western North Carolina, western South Carolina, Georgia, Virginia, northern Florida, and much of Alabama. Little change was observed in Puerto Rico, with severe drought (D2) covering the southern area, ringed by moderate drought (D1) and dry conditions (D0). Growers in Alabama continue to harvest cotton, soybean, and peanuts. However, summer pasture grasses are suffering due to the drought, and livestock farmers were concerned about resourcing hay, as they continue to feed their limited supply early and drought conditions prevent them from planting cool season annual forages. Pine trees are dying as a result of beetle damage due to the drought conditions, as well. Citrus and Marion counties in Florida showed abnormally dry conditions; however, the remaining portion of the citrus growing region remained drought-free. As a result, the citrus crops continue to do well. In Taylor County, GA, nearly all peanut and cotton harvesting stopped due to the dry conditions. Cattle are being sold or fed hay, and many water sources were drying up along with the Flint River. Vegetable producers in Grady County, GA were struggling to keep up with water demands. The sweet potato crop in North Carolina needs rain in order to finish maturing. Corn yield is incredibly low in Craven County, NC, and the hot, dry conditions are impacting grass and hay lands. Person County, NC reported that it was extremely dry and all crops are under severe stress.
As explained by the Northeast Regional Climate Center, the Northeast had its 16th driest September since record-keeping began with 2.21 inches (56.13 mm) of precipitation, 56 percent of normal, and it was the Northeast's 19th warmest September since 1895 with an average temperature of 62.9 degrees F (17.2 degrees C), 2.2 degrees F (1.2 degrees C) above normal. West Virginia was extremely dry, with September 2019 ranking as the all-time driest month on record for Beckley and as the driest September on record for Huntington. There was only one day with measurable precipitation [0.01 inch (0.25 mm)] during September in Huntington, with the site having its longest streak of days with less than or equal to 0.01 inch (0.25 mm) of precipitation at 36 days from August 28 through October 3, 2019 (the streak was ongoing at time of publication). Islip, New York, also had its driest September on record.
The USDM released on September 5 showed 7 percent of the Northeast was abnormally dry. These areas included parts of West Virginia, New York, Vermont, New Hampshire, Maine, and Connecticut. Below-normal precipitation, above-normal temperatures in southern areas, declining streamflow, and stressed vegetation led to the expansion of abnormal dryness and introduction of moderate drought in the region as the month progressed. By month's end, every Northeast state had areas of dryness, with moderate drought in southern West Virginia, parts of Maryland, northern Delaware, southeastern Pennsylvania, and southwestern New Jersey. The USDM released on September 26 showed 43 percent of the region was abnormally dry and 7 percent was in a moderate drought. Impacts of dry conditions included an early start to the fire season, dry soil, stunted growth and declining quality of some crops, diminishing water supplies and streamflows, and muted colors of fall foliage.
As summarized by the Western Regional Climate Center, precipitation was above normal across most of the northern half of the western U.S. as well as portions of southern Arizona and northern California. Elsewhere in the region, drier-than-normal conditions persisted across central California, southern Great Basin, southern Utah, and southern Rockies of Colorado and New Mexico. Across much of the Pacific Northwest and northern Rockies, precipitation was well above normal providing further relief to drought-stricken areas of northern Idaho, northwestern Montana, and northern and western portions of Washington. In Alaska, wetter-than-normal conditions prevailed in areas experiencing drought in Southcentral and Southwest Alaska while below-normal precipitation continued across much of Southeast Alaska. Average temperatures were above normal across the eastern half of the West with the greatest positive anomalies observed across eastern portions of Colorado and New Mexico while the remainder of the West varied closer to near normal. In Alaska, warmer-than-normal temperatures continued across the state in September with the greatest departures observed along the North Slope. In the Hawaiian Islands, average temperatures were above normal (1 to 5 degrees F) across most of the island chain for the month. For precipitation, the Big Island as well as Molokai and Lanai were drier than normal while Kauai, Oahu, and most of Maui were wetter than normal.
U.S.-Affiliated Pacific Islands
The NOAA National Weather Service (NWS) offices, the Pacific ENSO Applications Climate Center (PEAC), and partners provided reports on conditions across the Pacific Islands.
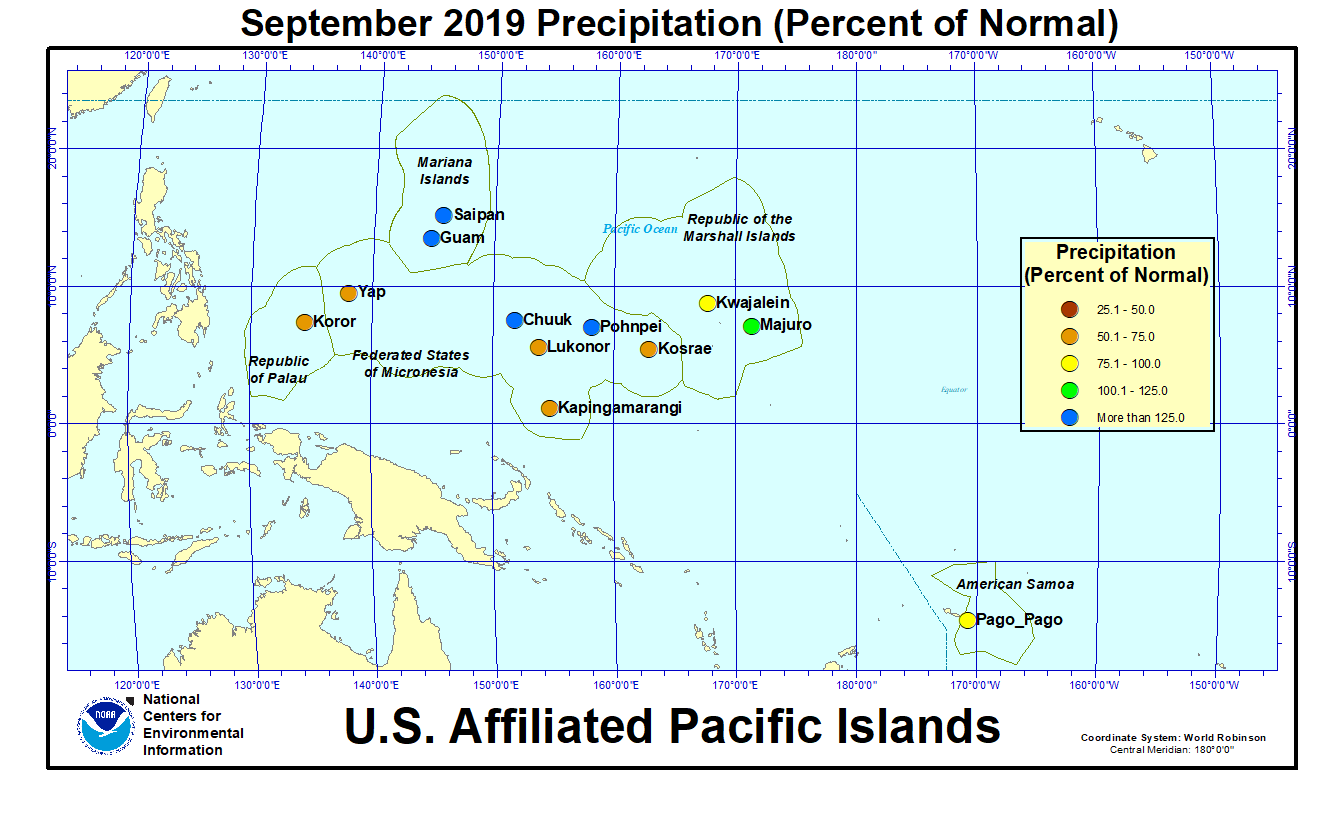
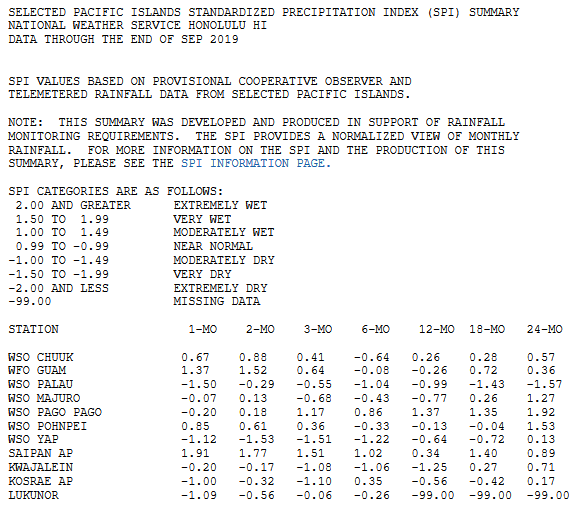
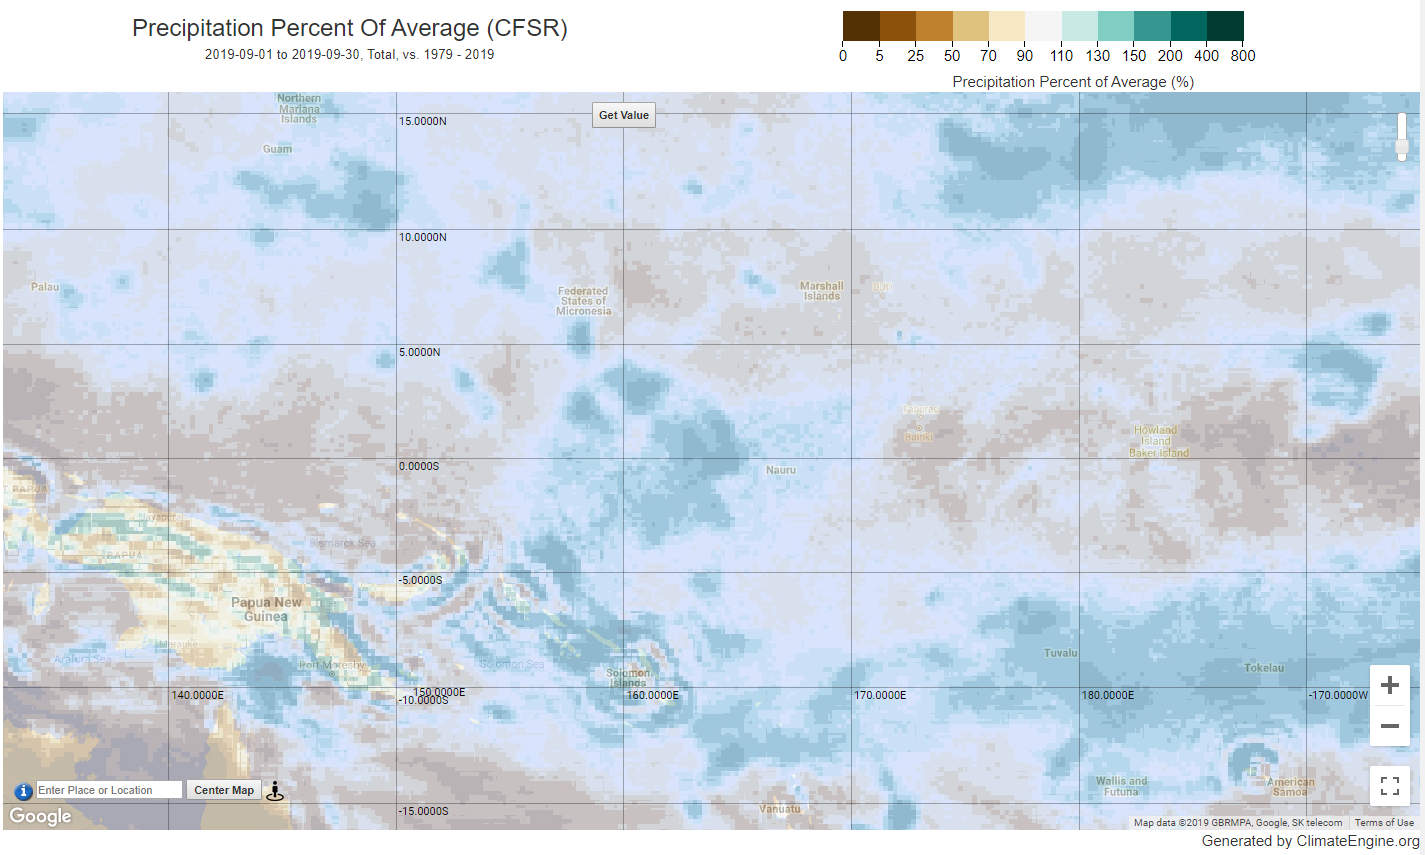
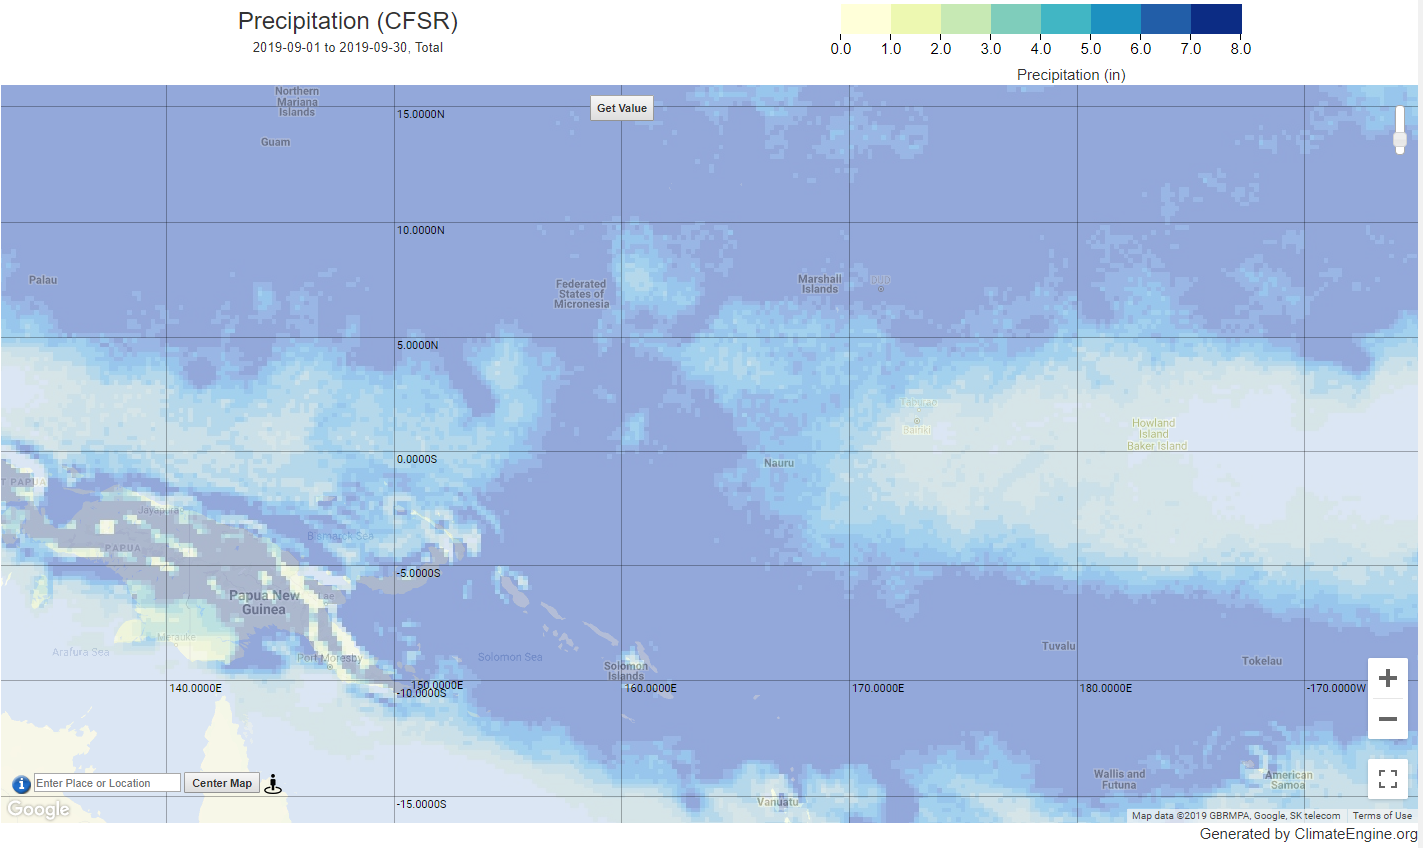
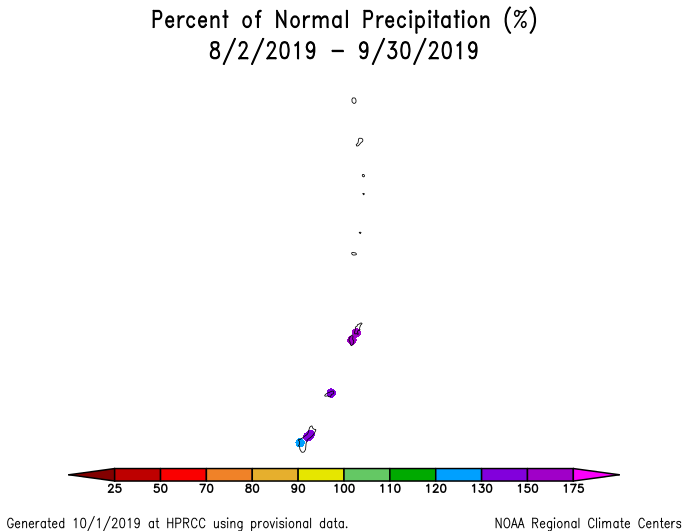
In the U.S. Affiliated Pacific Islands (USAPI) (maps — Federated States of Micronesia [FSM], Northern Mariana Islands, Marshall Islands [RMI], Republic of Palau, American Samoa, basinwide), September 2019 was drier-than-normal at southern station in Micronesia — including Koror, Yap, Lukonor, Kapingamarangi, and Kosrae, as well as Kwajalein and Pago Pago — and wetter than normal at the rest of the primary stations.
Convergence associated with a monsoon trough, along with several tropical disturbances, gave northern portions of Micronesia wet conditions during September. Upper-level troughs along the northern fringe of the USAPI also enhanced rainfall over the region. Surface ridging dominated southern portions of Micronesia and American Samoa, keeping conditions dry. Monthly precipitation amounts were below the monthly minimum needed to meet most water needs (4 inches in the Marianas and 8 inches elsewhere) at Woleai, Lukonor, Nukuoro, Kapingamarangi (in the FSM); Ailinglapalap, Jaluit, Mili (in the RMI); and Pago Pago (in American Samoa); and above the monthly minimums at the rest of the USAPI stations. The 4- and 8-inch thresholds are important because, if monthly precipitation falls below the threshold, then water shortages or drought become a concern.
| Station Name | Oct 2018 | Nov 2018 | Dec 2018 | Jan 2019 | Feb 2019 | Mar 2019 | Apr 2019 | May 2019 | Jun 2019 | Jul 2019 | Aug 2019 | Sep 2019 | Oct- Sep |
|---|---|---|---|---|---|---|---|---|---|---|---|---|---|
| Chuuk | 93% | 142% | 76% | 183% | 122% | 175% | 48% | 42% | 125% | 97% | 125% | 135% | 106% |
| Guam NAS | 78% | 61% | 152% | 106% | 228% | 39% | 45% | 77% | 46% | 46% | 135% | 166% | 86% |
| Kapingamarangi | 158% | 223% | 93% | 195% | 44% | 197% | 127% | 169% | 172% | 110% | 124% | 55% | 123% |
| Koror | 119% | 140% | 111% | 96% | 40% | 84% | 94% | 57% | 93% | 81% | 140% | 74% | 88% |
| Kosrae | 34% | 58% | 49% | 93% | 98% | 143% | 137% | 152% | 103% | 62% | 117% | 69% | 81% |
| Kwajalein | 63% | 107% | 99% | 49% | 183% | 52% | 22% | 159% | 69% | 48% | 104% | 92% | 83% |
| Lukonor | 89% | 78% | 70% | 148% | 71% | 103% | 126% | 32% | 127% | 104% | 96% | 63% | 81% |
| Majuro | 67% | 69% | 112% | 93% | 74% | 102% | 35% | 160% | 103% | 64% | 109% | 105% | 89% |
| Pago Pago | 128% | 117% | 176% | 83% | 200% | 107% | 108% | 154% | 117% | 316% | 160% | 81% | 124% |
| Pohnpei | 100% | 74% | 100% | 134% | 79% | 143% | 66% | 45% | 159% | 101% | 110% | 155% | 100% |
| Saipan | 90% | 83% | 137% | 70% | 59% | 28% | 35% | 243% | 58% | 76% | 140% | 218% | 113% |
| Yap | 46% | 136% | 125% | 249% | 30% | 107% | 52% | 91% | 109% | 81% | 78% | 65% | 89% |
| Station Name | Oct 2018 | Nov 2018 | Dec 2018 | Jan 2019 | Feb 2019 | Mar 2019 | Apr 2019 | May 2019 | Jun 2019 | Jul 2019 | Aug 2019 | Sep 2019 | Oct- Sep |
|---|---|---|---|---|---|---|---|---|---|---|---|---|---|
| Chuuk | 10.66" | 15.02" | 8.53" | 18.49" | 8.87" | 14.56" | 6.00" | 4.74" | 14.62" | 11.65" | 16.13" | 15.81" | 145.08" |
| Guam NAS | 8.87" | 4.51" | 7.75" | 4.24" | 6.90" | 0.81" | 1.15" | 2.61" | 2.85" | 4.63" | 19.92" | 21.03" | 85.27" |
| Kapingamarangi | 12.98" | 20.71" | 9.13" | 17.87" | 4.06" | 22.56" | 17.33" | 20.46" | 23.68" | 15.52" | 10.11" | 5.50" | 179.91" |
| Koror | 14.12" | 15.92" | 12.37" | 9.79" | 3.45" | 6.24" | 6.89" | 6.78" | 16.30" | 15.04" | 18.91" | 8.74" | 134.55" |
| Kosrae | 3.70" | 8.09" | 7.92" | 15.58" | 12.62" | 23.02" | 23.96" | 26.91" | 15.08" | 9.19" | 16.61" | 9.78" | 172.46" |
| Kwajalein | 7.05" | 12.12" | 6.58" | 1.54" | 4.82" | 1.22" | 1.14" | 10.71" | 4.76" | 4.77" | 10.10" | 9.89" | 74.7" |
| Lukonor | 10.06" | 7.12" | 7.89" | 12.41" | 6.33" | 9.58" | 14.30" | 3.75" | 14.80" | 16.63" | 13.47" | 6.44" | 122.78" |
| Majuro | 8.53" | 9.29" | 12.71" | 7.23" | 5.09" | 6.74" | 3.34" | 16.14" | 11.31" | 7.12" | 12.69" | 11.73" | 111.92" |
| Pago Pago | 11.83" | 11.90" | 22.59" | 11.10" | 24.04" | 11.47" | 10.17" | 14.91" | 6.24" | 17.54" | 8.60" | 5.28" | 155.67" |
| Pohnpei | 15.31" | 10.97" | 16.13" | 17.68" | 7.57" | 18.84" | 12.23" | 8.94" | 23.56" | 15.64" | 15.74" | 19.47" | 182.08" |
| Saipan | 9.59" | 4.64" | 5.28" | 1.76" | 1.54" | 0.53" | 0.93" | 5.78" | 2.11" | 6.73" | 18.32" | 21.99" | 79.2" |
| Yap | 5.56" | 12.03" | 10.68" | 15.90" | 1.57" | 4.88" | 2.92" | 7.15" | 13.14" | 12.25" | 11.58" | 8.82" | 106.48" |
| Station Name | Oct 2018 | Nov 2018 | Dec 2018 | Jan 2019 | Feb 2019 | Mar 2019 | Apr 2019 | May 2019 | Jun 2019 | Jul 2019 | Aug 2019 | Sep 2019 | Oct- Sep |
|---|---|---|---|---|---|---|---|---|---|---|---|---|---|
| Chuuk | 11.51" | 10.61" | 11.25" | 10.10" | 7.25" | 8.32" | 12.47" | 11.30" | 11.66" | 11.98" | 12.86" | 11.71" | 136.77" |
| Guam NAS | 11.44" | 7.38" | 5.11" | 4.01" | 3.03" | 2.07" | 2.53" | 3.40" | 6.18" | 10.14" | 14.74" | 12.66" | 99.09" |
| Kapingamarangi | 8.19" | 9.27" | 9.84" | 9.15" | 9.27" | 11.43" | 13.64" | 12.08" | 13.78" | 14.15" | 8.13" | 9.93" | 145.85" |
| Koror | 11.84" | 11.39" | 11.16" | 10.18" | 8.56" | 7.44" | 7.32" | 11.83" | 17.48" | 18.53" | 13.50" | 11.77" | 152.90" |
| Kosrae | 10.94" | 13.83" | 16.11" | 16.67" | 12.93" | 16.06" | 17.51" | 17.75" | 14.64" | 14.91" | 14.22" | 14.22" | 213.87" |
| Kwajalein | 11.18" | 11.28" | 6.66" | 3.16" | 2.64" | 2.35" | 5.26" | 6.72" | 6.93" | 9.87" | 9.74" | 10.74" | 90.41" |
| Lukonor | 11.32" | 9.08" | 11.27" | 8.41" | 8.93" | 9.26" | 11.31" | 11.69" | 11.65" | 15.93" | 14.04" | 10.15" | 151.36" |
| Majuro | 12.73" | 13.44" | 11.39" | 7.74" | 6.88" | 6.58" | 9.42" | 10.11" | 11.01" | 11.17" | 11.69" | 11.17" | 125.25" |
| Pago Pago | 9.26" | 10.14" | 12.84" | 13.34" | 12.00" | 10.68" | 9.39" | 9.66" | 5.33" | 5.55" | 5.38" | 6.53" | 125.57" |
| Pohnpei | 15.27" | 14.83" | 16.08" | 13.18" | 9.55" | 13.17" | 18.41" | 19.96" | 14.81" | 15.43" | 14.26" | 12.55" | 182.36" |
| Saipan | 10.62" | 5.61" | 3.85" | 2.53" | 2.59" | 1.89" | 2.63" | 2.38" | 3.62" | 8.91" | 13.13" | 10.09" | 70.25" |
| Yap | 12.18" | 8.83" | 8.51" | 6.39" | 5.19" | 4.56" | 5.63" | 7.85" | 12.04" | 15.08" | 14.82" | 13.50" | 120.31" |
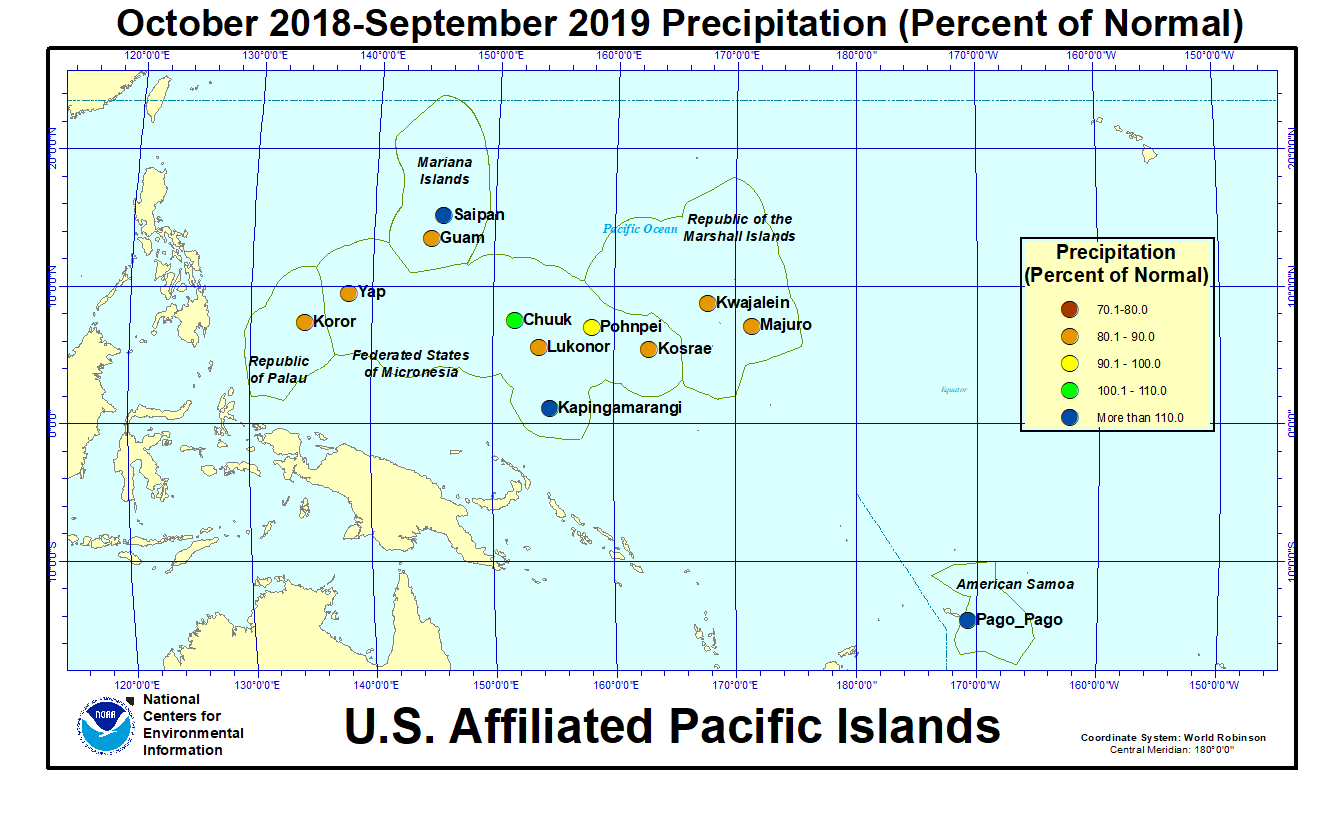
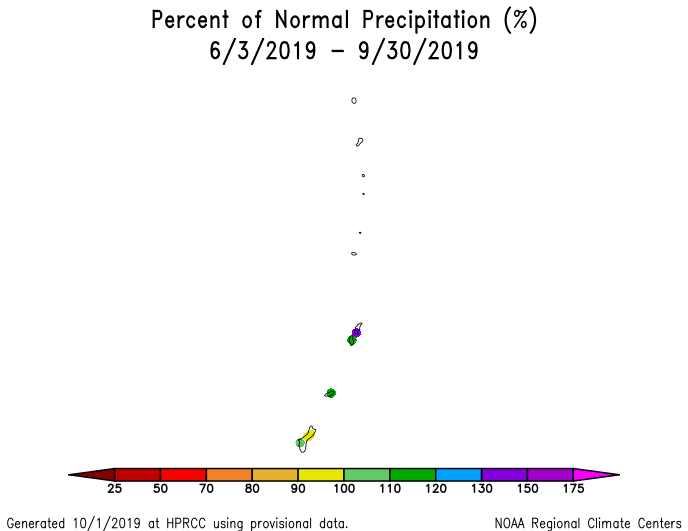
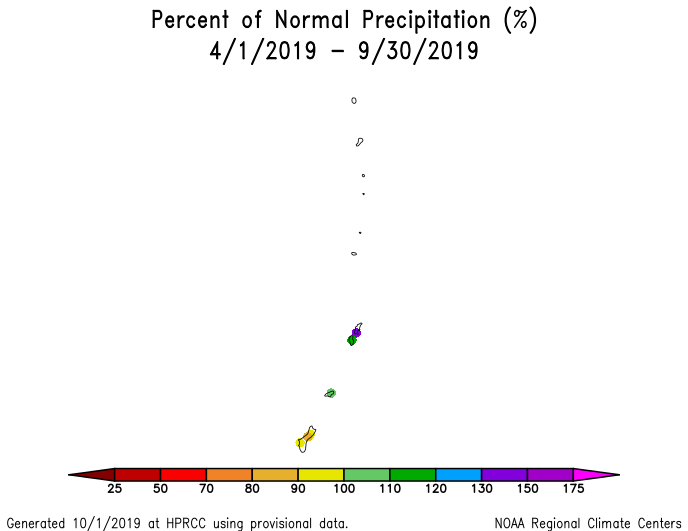
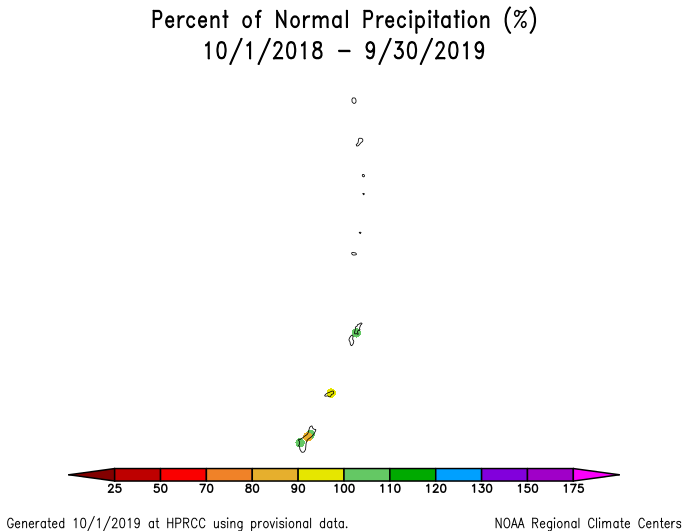
As measured by percent of normal precipitation, Koror, Kwajalein, Lukonor, and Yap were drier than normal in the short term (September and the last 3 months [July-September 2019]) and long term (year to date [January-September] and last 12 months [October 2018-September 2019]). Kapingamarangi was drier than normal in the short-term and wetter than normal in the long-term. Guam was wetter than normal in the short-term and drier than normal in the long-term. Kosrae was near normal for the year to date but drier than normal at the other 3 time scales. Likewise, Majuro was near normal for September but drier than normal at the other 3 time scales. Pago Pago was drier than normal for September but wetter than normal for the other 3 time scales. Chuuk, Pohnpei, and Saipan were near to wetter than normal at all 4 time scales. It should be noted that the monthly normal precipitation amount can vary significantly from month to month due to the strong seasonality of equatorial Pacific precipitation resulting from the seasonal migration of the Inter-Tropical Convergence Zone (ITCZ).
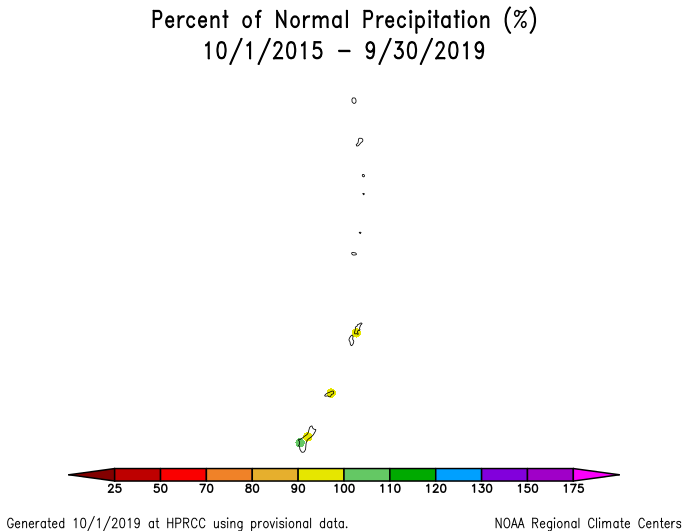
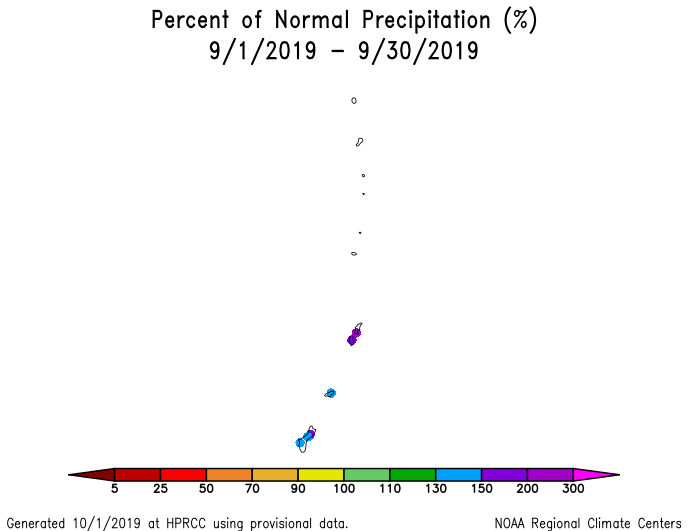 Percent of normal precipitation map for September 2019 for the Marianas Islands.
|
 Percent of normal precipitation map for September 2019 for the Marshall Islands.
|
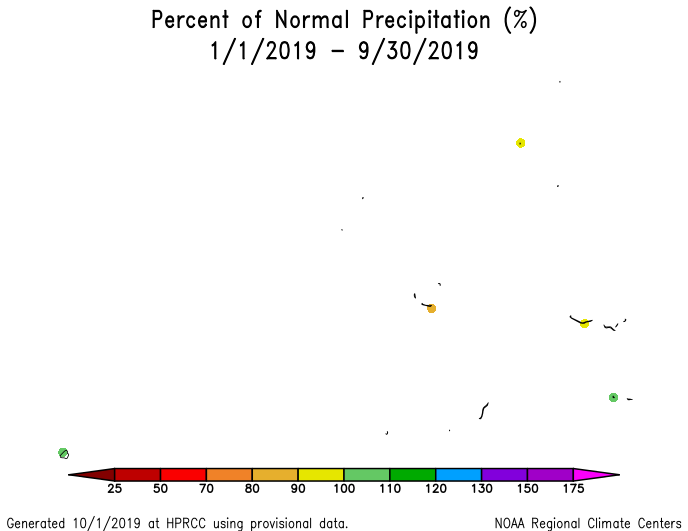
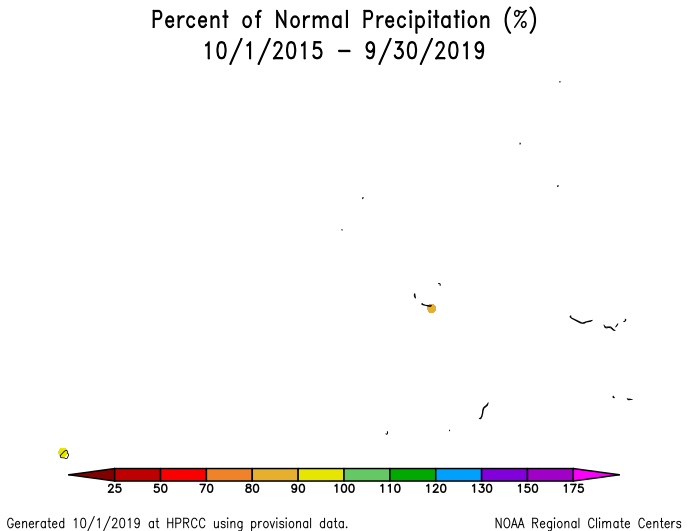
In the Marianas Islands, precipitation was wetter than normal regionwide for September. Abundant rainfall during August and September has resulted in a wetter-than-normal precipitation anomaly pattern for the last 2 to 3 months. A mixed precipitation anomaly pattern exists at longer time scales (percent of normal precipitation maps for the last 1, 2, 3, 4, 6, 9, 12, 24, 36, 48, 60 months). In the Marshall Islands, September precipitation was wetter than normal in the far north and drier than normal at southern locations. August-September was wetter than normal in the east and drier than normal in the west. Drier than normal conditions dominate for most of the last 3 to 12 months and at the 48-month time scale, with mixed anomalies at the 24- to 36-month time scales (percent of normal precipitation maps for the last 1, 2, 3, 4, 6, 9, 12, 24, 36, 48 months).
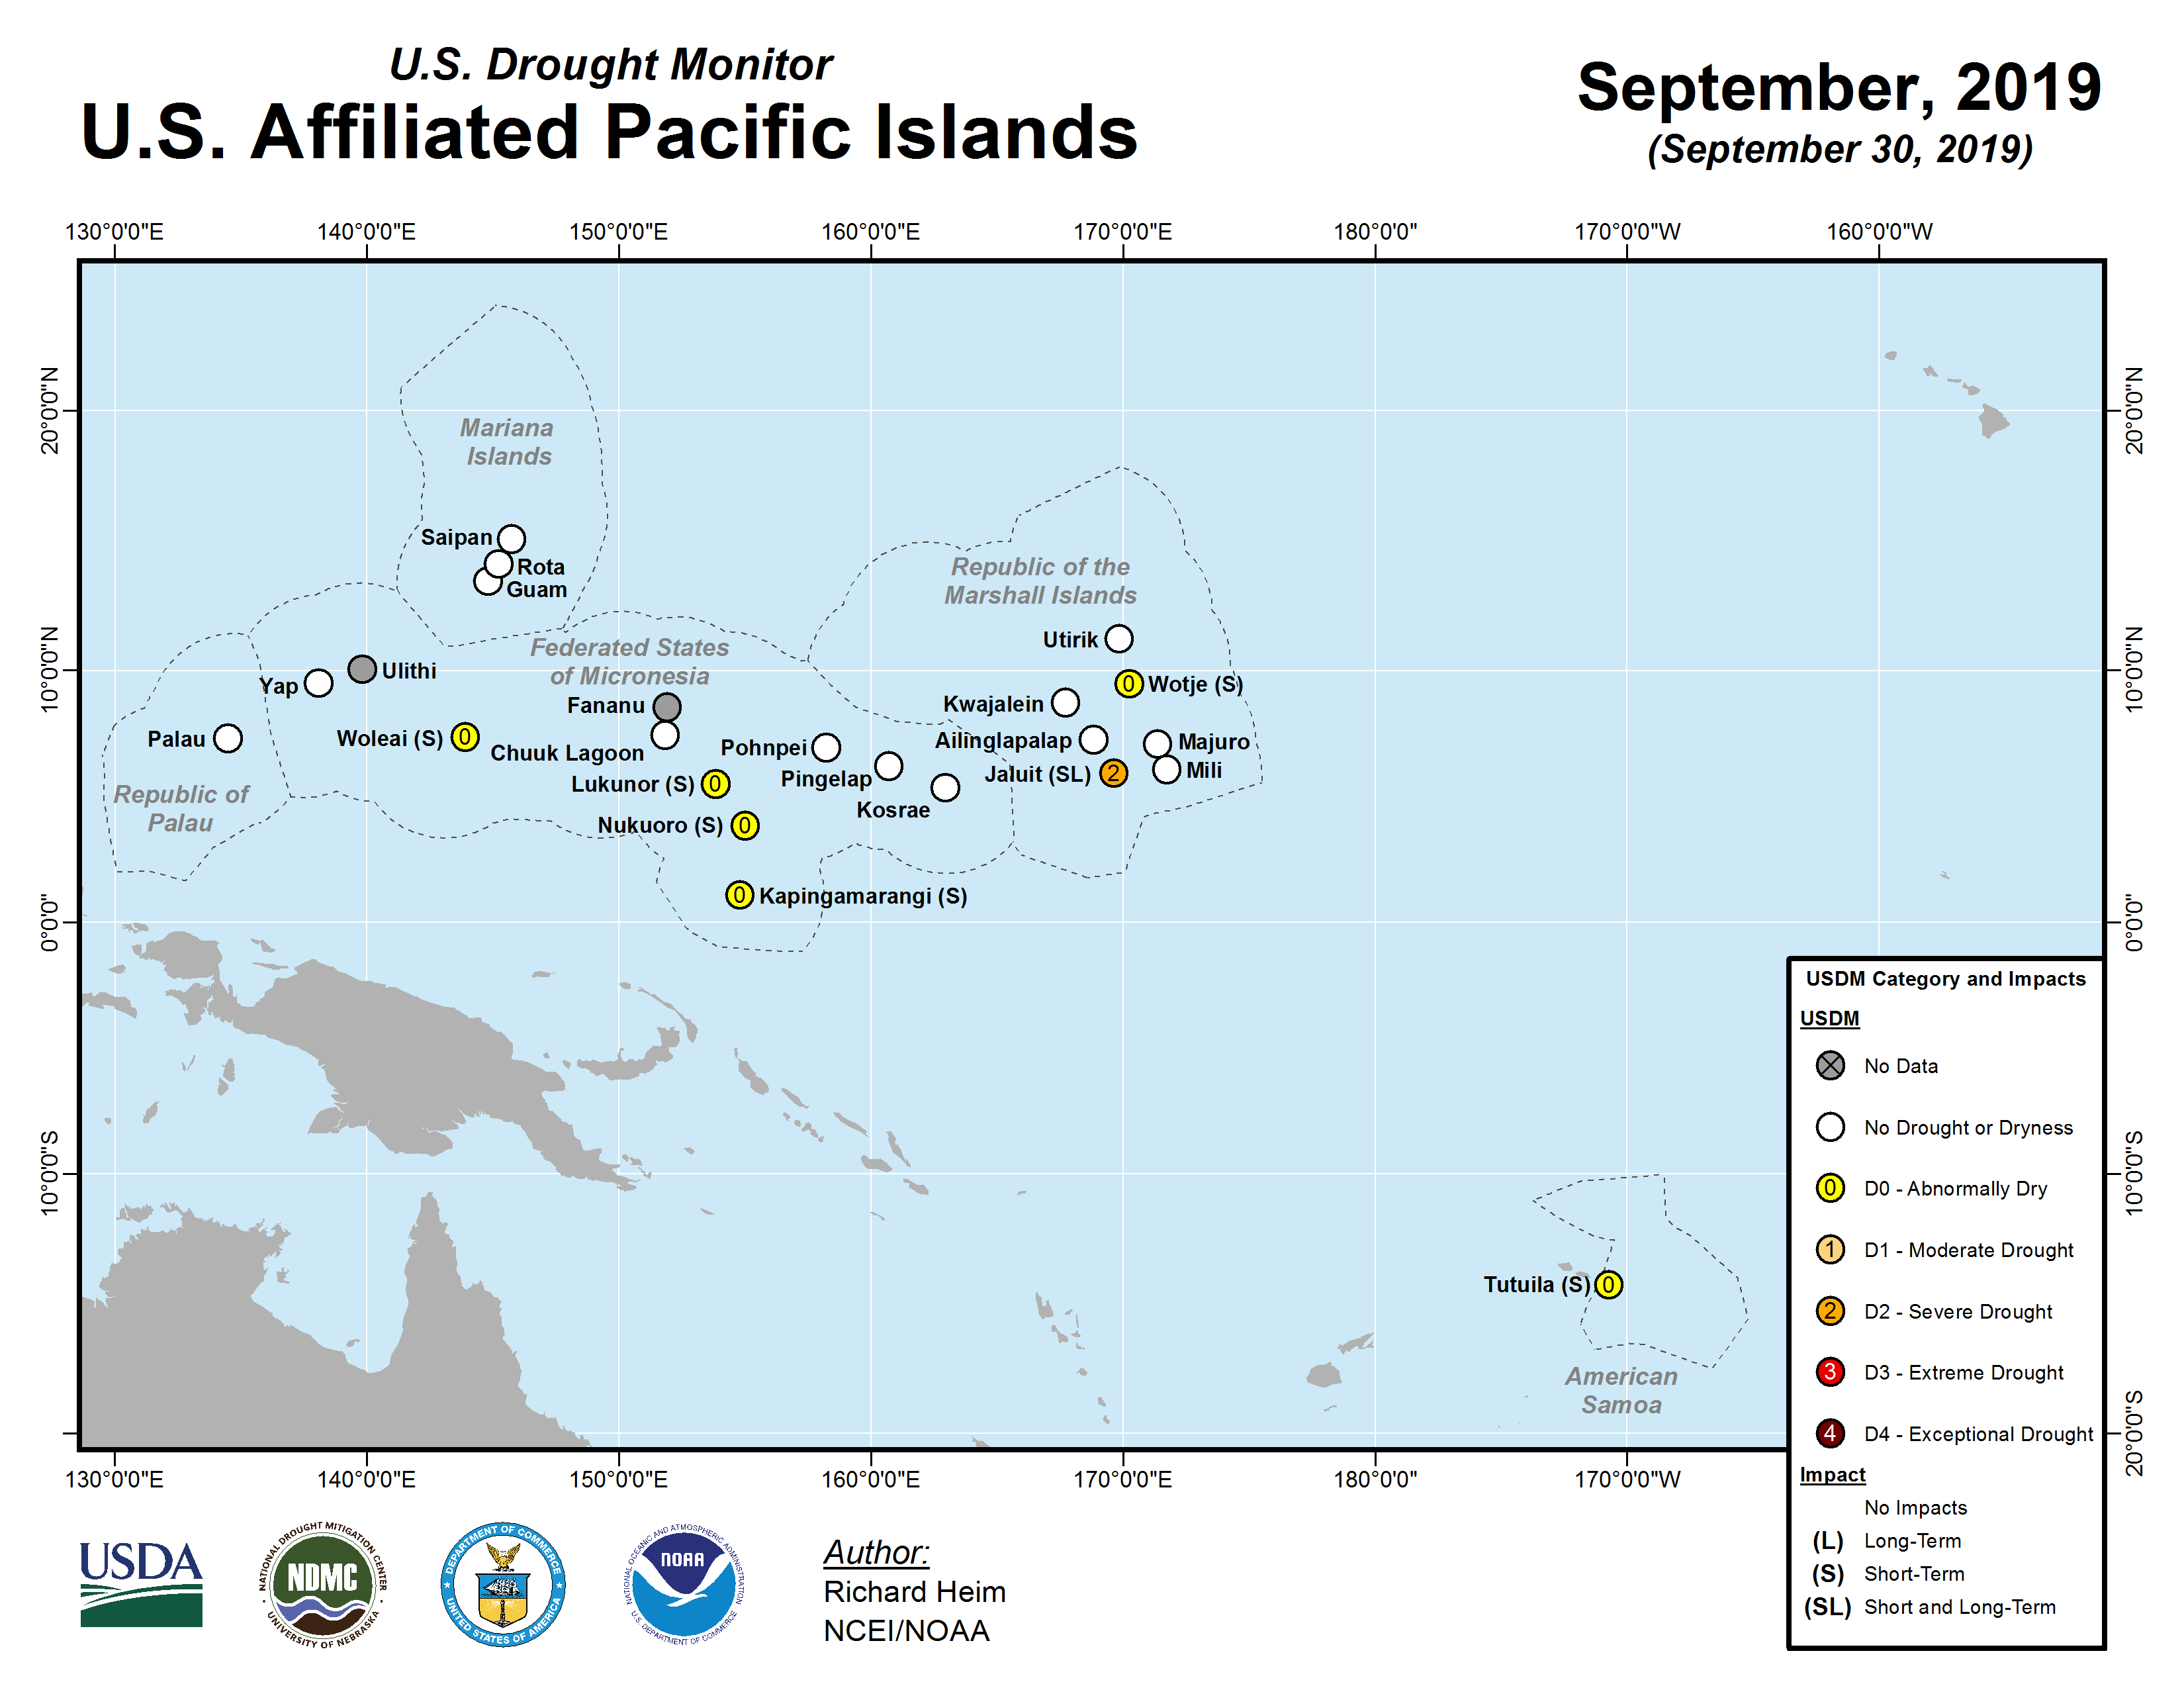
The USAPI U.S. Drought Monitor drought map valid for the end of September 2019.
According to the September 30th USDM produced for the USAPI, drought persisted only in the RMI with severe drought (D2) at Jaluit. Abnormal dryness (D0) developed at Woleai, Lukonor, Nukuoro, and Kapingamarangi in the FSM, and at Pago Pago in American Samoa. Storage in the Majuro reservoirs fluctuated up and down during September, starting at 28.9 million gallons at the beginning of the month, falling to 26.8 million gallons on the 24th, then rising to 29.7 million gallons at the end of the month, or about 82 percent of maximum, which is above the 80 percent threshold for concern.
The abundant rainfall in September 2019 in the Marianas resulted in the wettest September on record for Saipan. But the dryness in southern Micronesia led to low precipitation ranks for those stations. Nukuoro had the driest September in a 37-year record, Lukonor had the third driest September (in 36 years of data), Ailinglapalap the fourth driest September (36 years), Jaluit fifth driest (36 years), and Kapingamarangi eighth driest (28 years). September 2019 was the sixth driest September on record at Pingelap (36 years), Woleai (38 years), and Yap (69 years). October 2018-September 2019 was the seventh driest for Kosrae (31 years), sixth driest for Lukonor (22 years), fifth driest for Woleai (26 years), driest for Jaluit (33 years), and ninth driest for Ailinglapalap (33 years) and Kwajalein (67 years). It should be noted that there may be an undercatch issue with Jaluit's rain gauge.
The following analysis of historical data for the USAPI stations in the Global Historical Climatology Network-Daily (GHCN-D) dataset, augmented with fill-in data from the 1981-2010 Normals, helps put the current data into historical perspective by computing ranks based on the period of record. The table below lists the precipitation ranks for September 2019, April-September 2019 (last 6 months), and October 2018-September 2019 (the last 12 months). Some stations have a long period of record and their dataset is fairly complete, while other stations have a shorter period of record and the dataset has some missing data.
Rank of 1 = driest.
| Station | Sep 2019 Rank |
Sep No. of Years |
Apr- Sep 2019 Rank |
Apr- Sep No. of Years |
Oct 2018- Sep 2019 Rank |
Oct- Sep No. of Years |
Period of Record |
| Pago Pago | 23 | 54 | 46 | 54 | 51 | 53 | 1966-2019 |
| Saipan | 39 | 39 | 37 | 39 | 26 | 30 | 1981-2019 |
| Kapingamarangi | 8 | 28 | 18 | 20 | 18 | 18 | 1962-2019 |
| Kosrae | 9 | 48 | 21 | 40 | 7 | 31 | 1954-2019 |
| Lukonor | 3 | 36 | 7 | 23 | 6 | 22 | 1981-2019 |
| Nukuoro | 1 | 37 | 8 | 35 | 12 | 34 | 1981-2019 |
| Pingelap | 6 | 36 | 14 | 34 | MSG | 32 | 1981-2019 |
| Woleai | 6 | 38 | 5 | 30 | 5 | 26 | 1968-2019 |
| Yap | 6 | 69 | 9 | 68 | 16 | 68 | 1951-2019 |
| Pohnpei | 58 | 69 | 25 | 68 | 31 | 68 | 1951-2019 |
| Chuuk | 51 | 69 | 20 | 68 | 37 | 68 | 1951-2019 |
| Guam | 53 | 63 | 23 | 63 | 14 | 62 | 1957-2019 |
| Koror | 18 | 69 | 20 | 67 | 18 | 67 | 1951-2019 |
| Ailinglapalap | 4 | 36 | 5 | 35 | 9 | 33 | 1981-2019 |
| Jaluit | 5 | 36 | 1 | 35 | 1 | 33 | 1981-2019 |
| Mili | 10 | 35 | 12 | 34 | 17 | 32 | 1981-2019 |
| Utirik | 13 | 16 | 3 | 8 | 1 | 3 | 1985-2019 |
| Wotje | 21 | 36 | 18 | 35 | 14 | 32 | 1981-2019 |
| Kwajalein | 29 | 68 | 10 | 67 | 9 | 67 | 1952-2019 |
| Majuro | 32 | 66 | 10 | 67 | 9 | 67 | 1954-2019 |


[top]
State/Regional/National Moisture Status
A detailed review of drought and moisture conditions is available for all contiguous U.S. states, the nine standard regions, and the nation (contiguous U.S.):
| northeast u. s. | east north central u. s. | central u. s. |
| southeast u. s. | west north central u. s. | south u. s. |
| southwest u. s. | northwest u. s. | west u. s. |
| Contiguous United States |
[top]
Contacts & Questions