|
Contents Of This Report: |

|
Please note that the values presented in this report are based on preliminary data. They will change when the final data are processed, but will not be replaced on these pages.
National Drought Overview
|
|
[top]
Detailed Drought Discussion
Overview
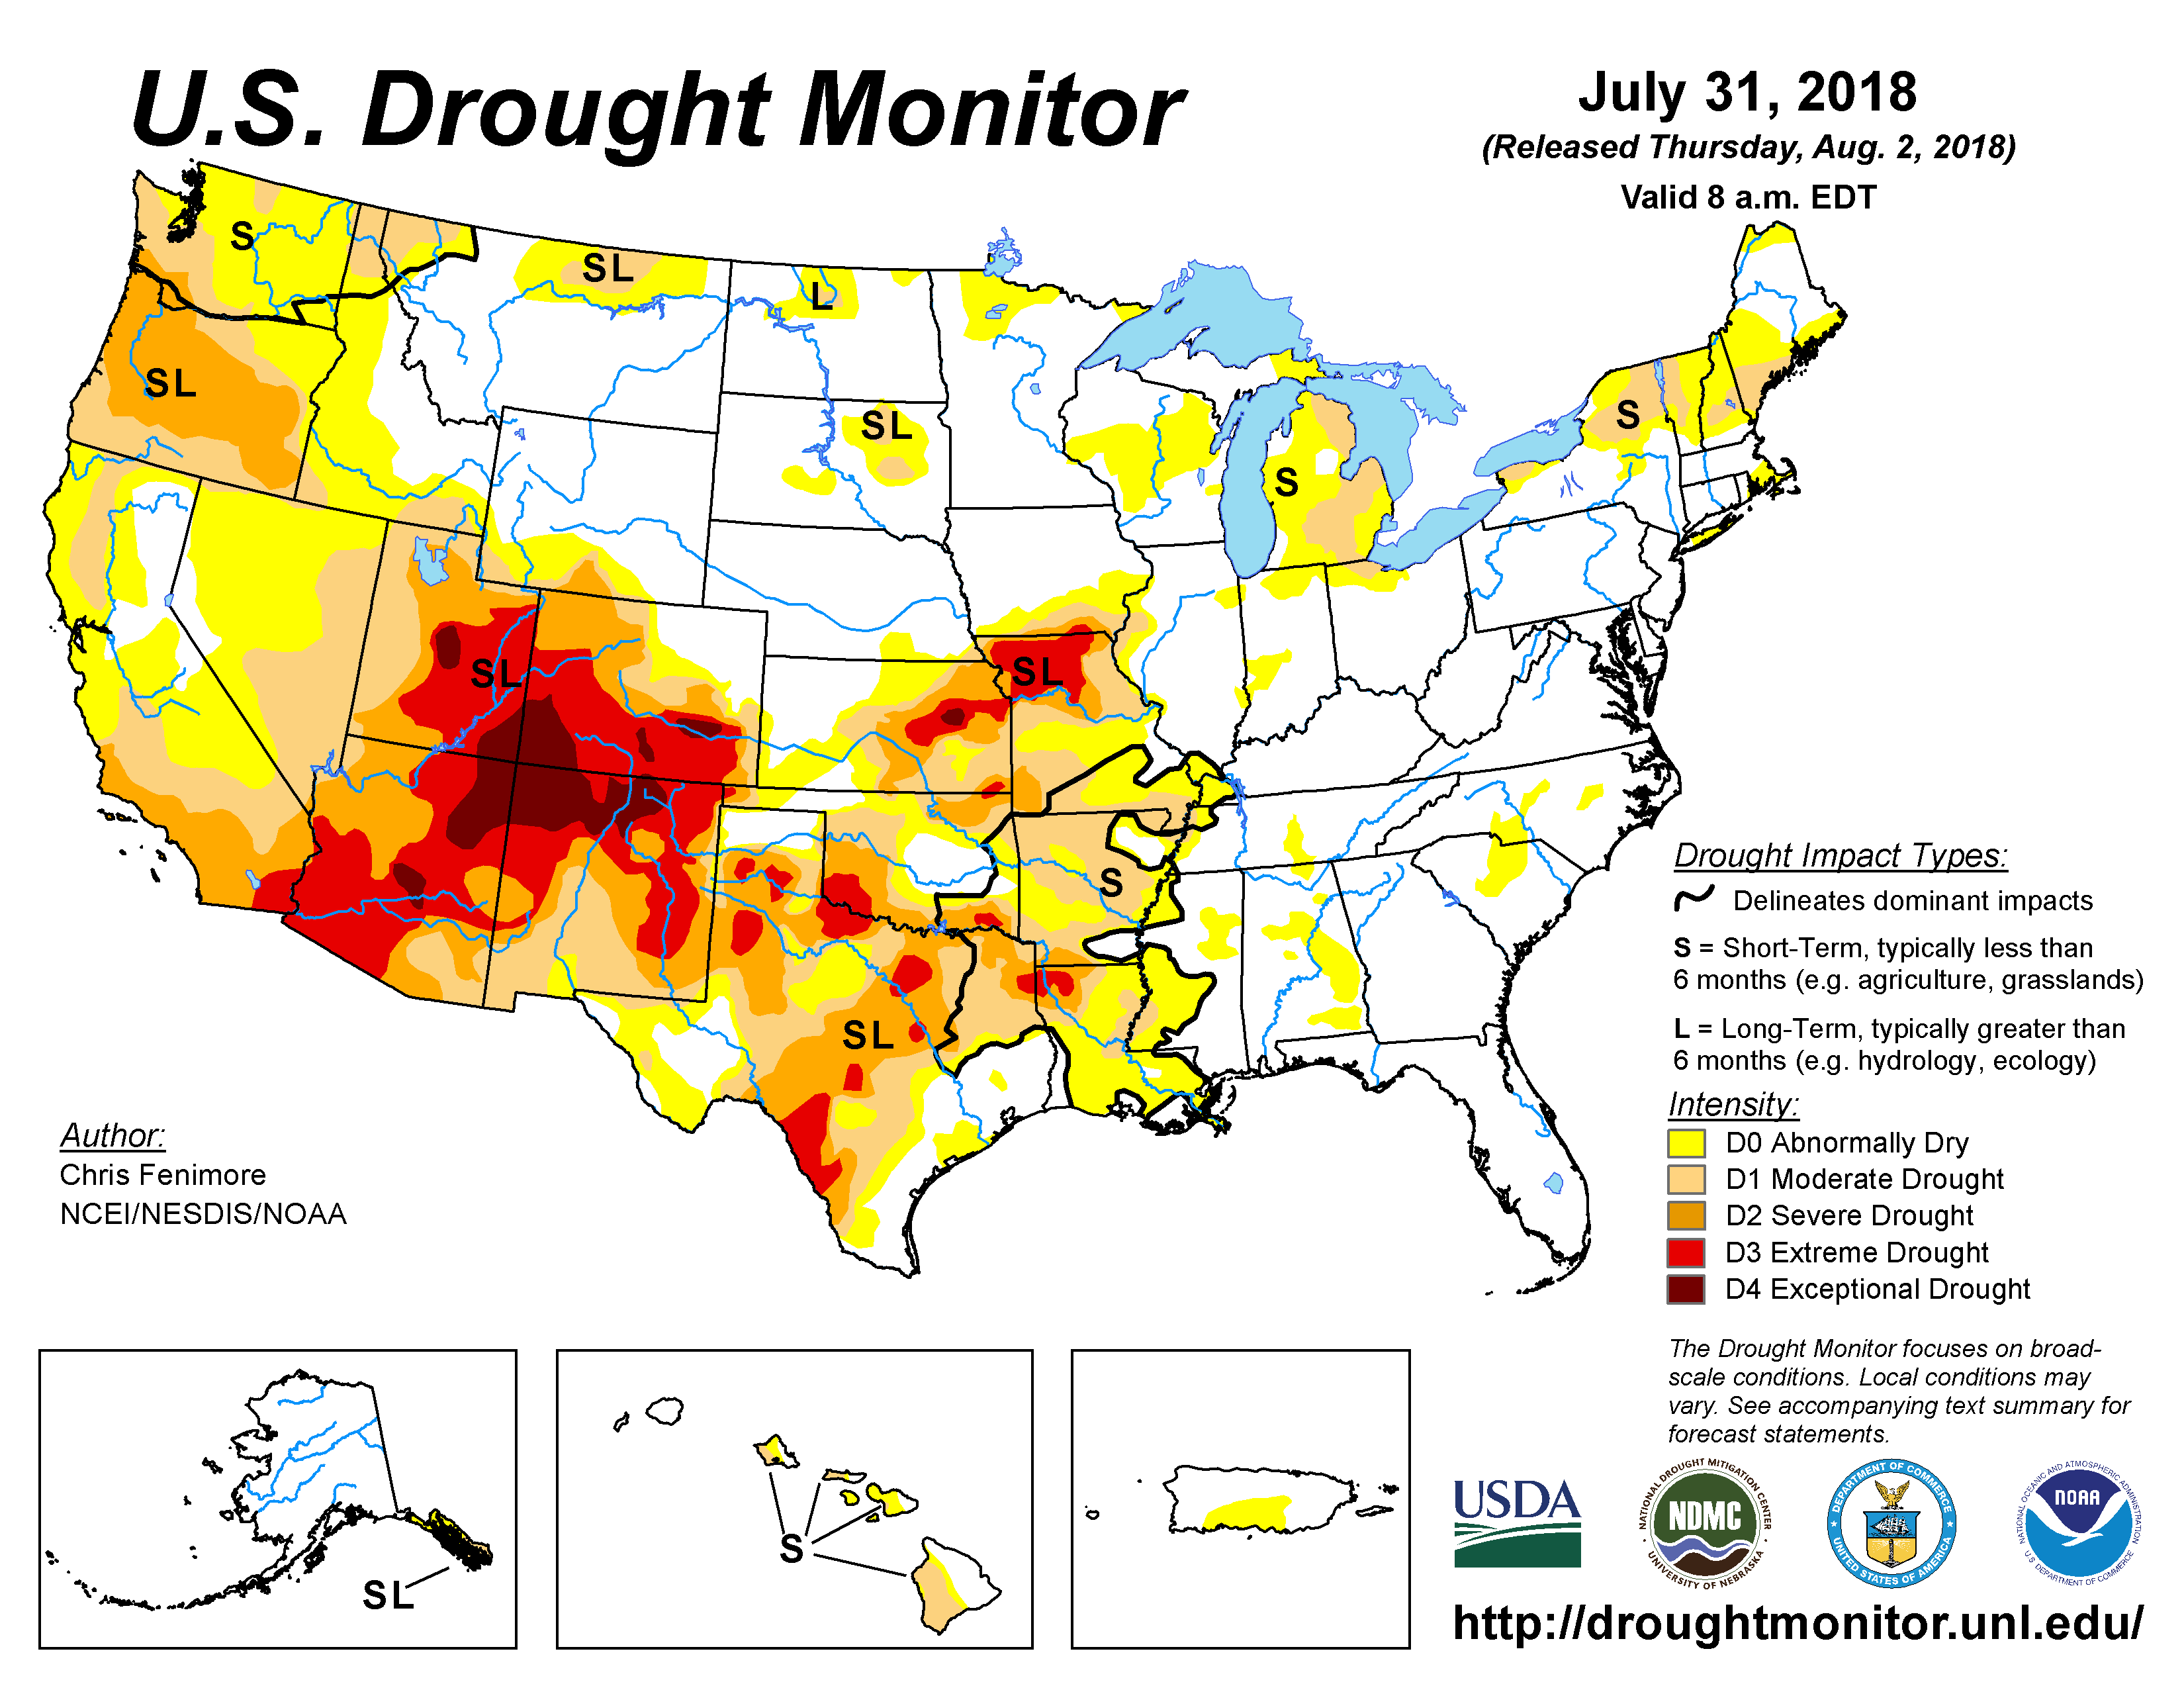
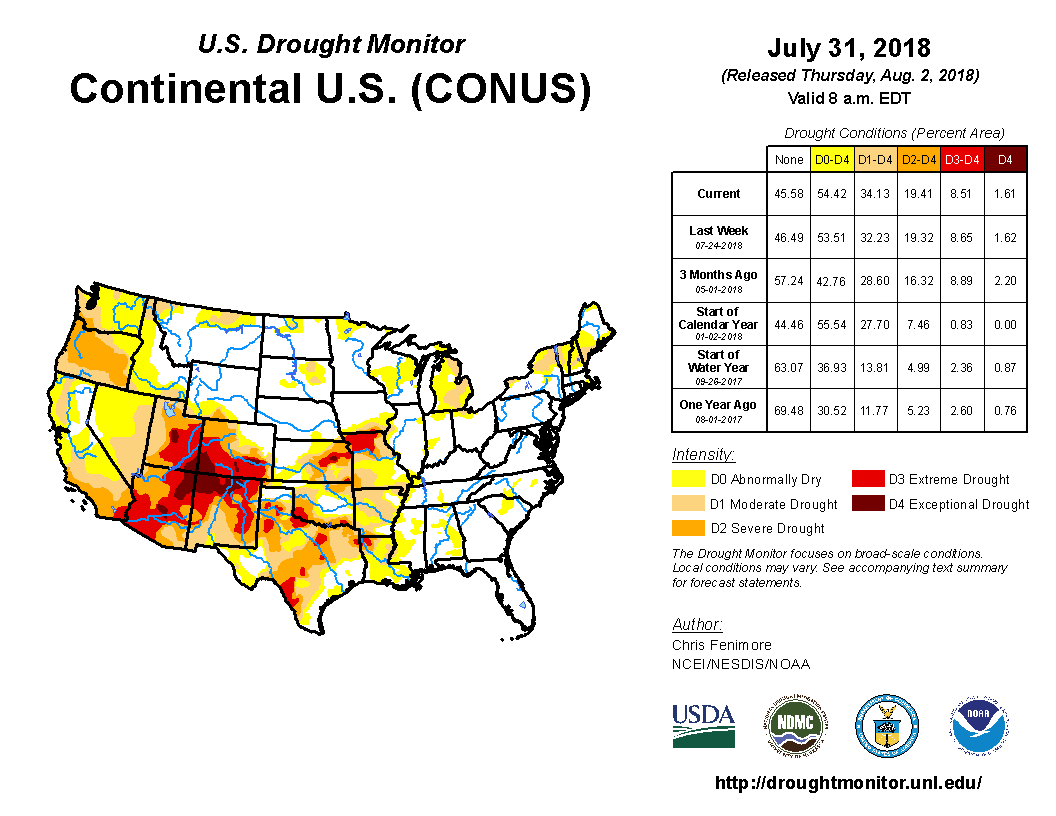
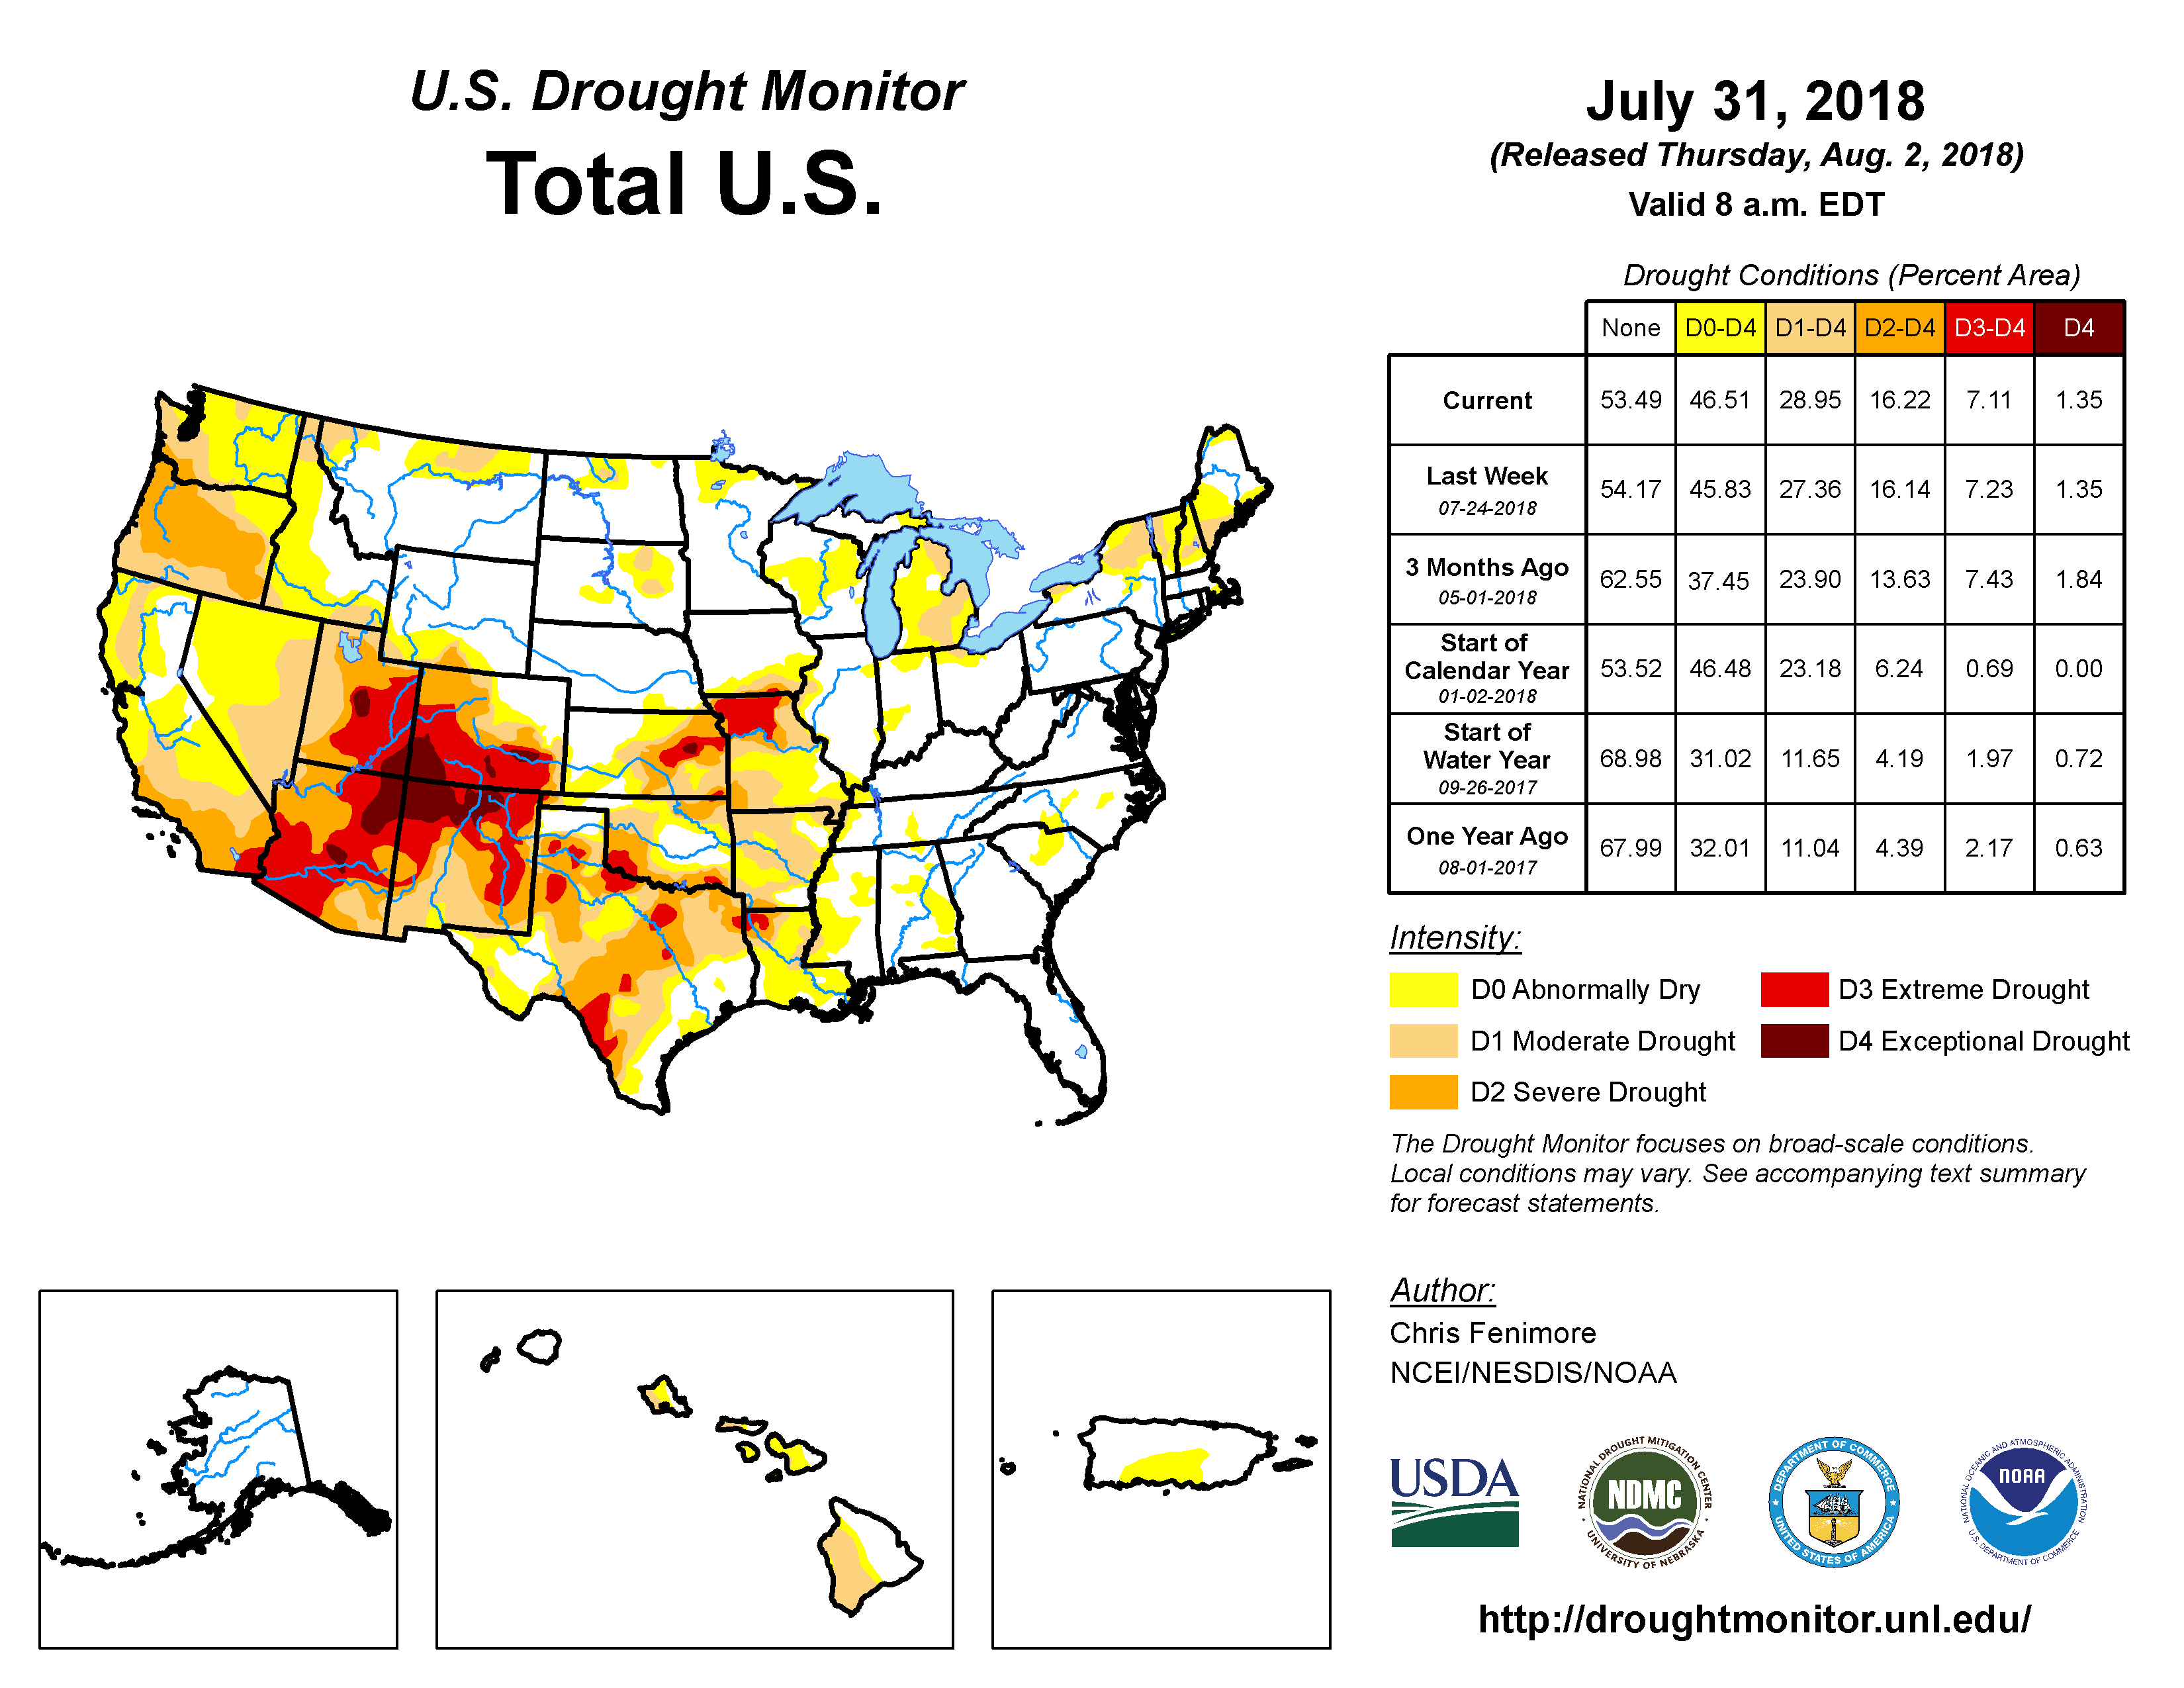
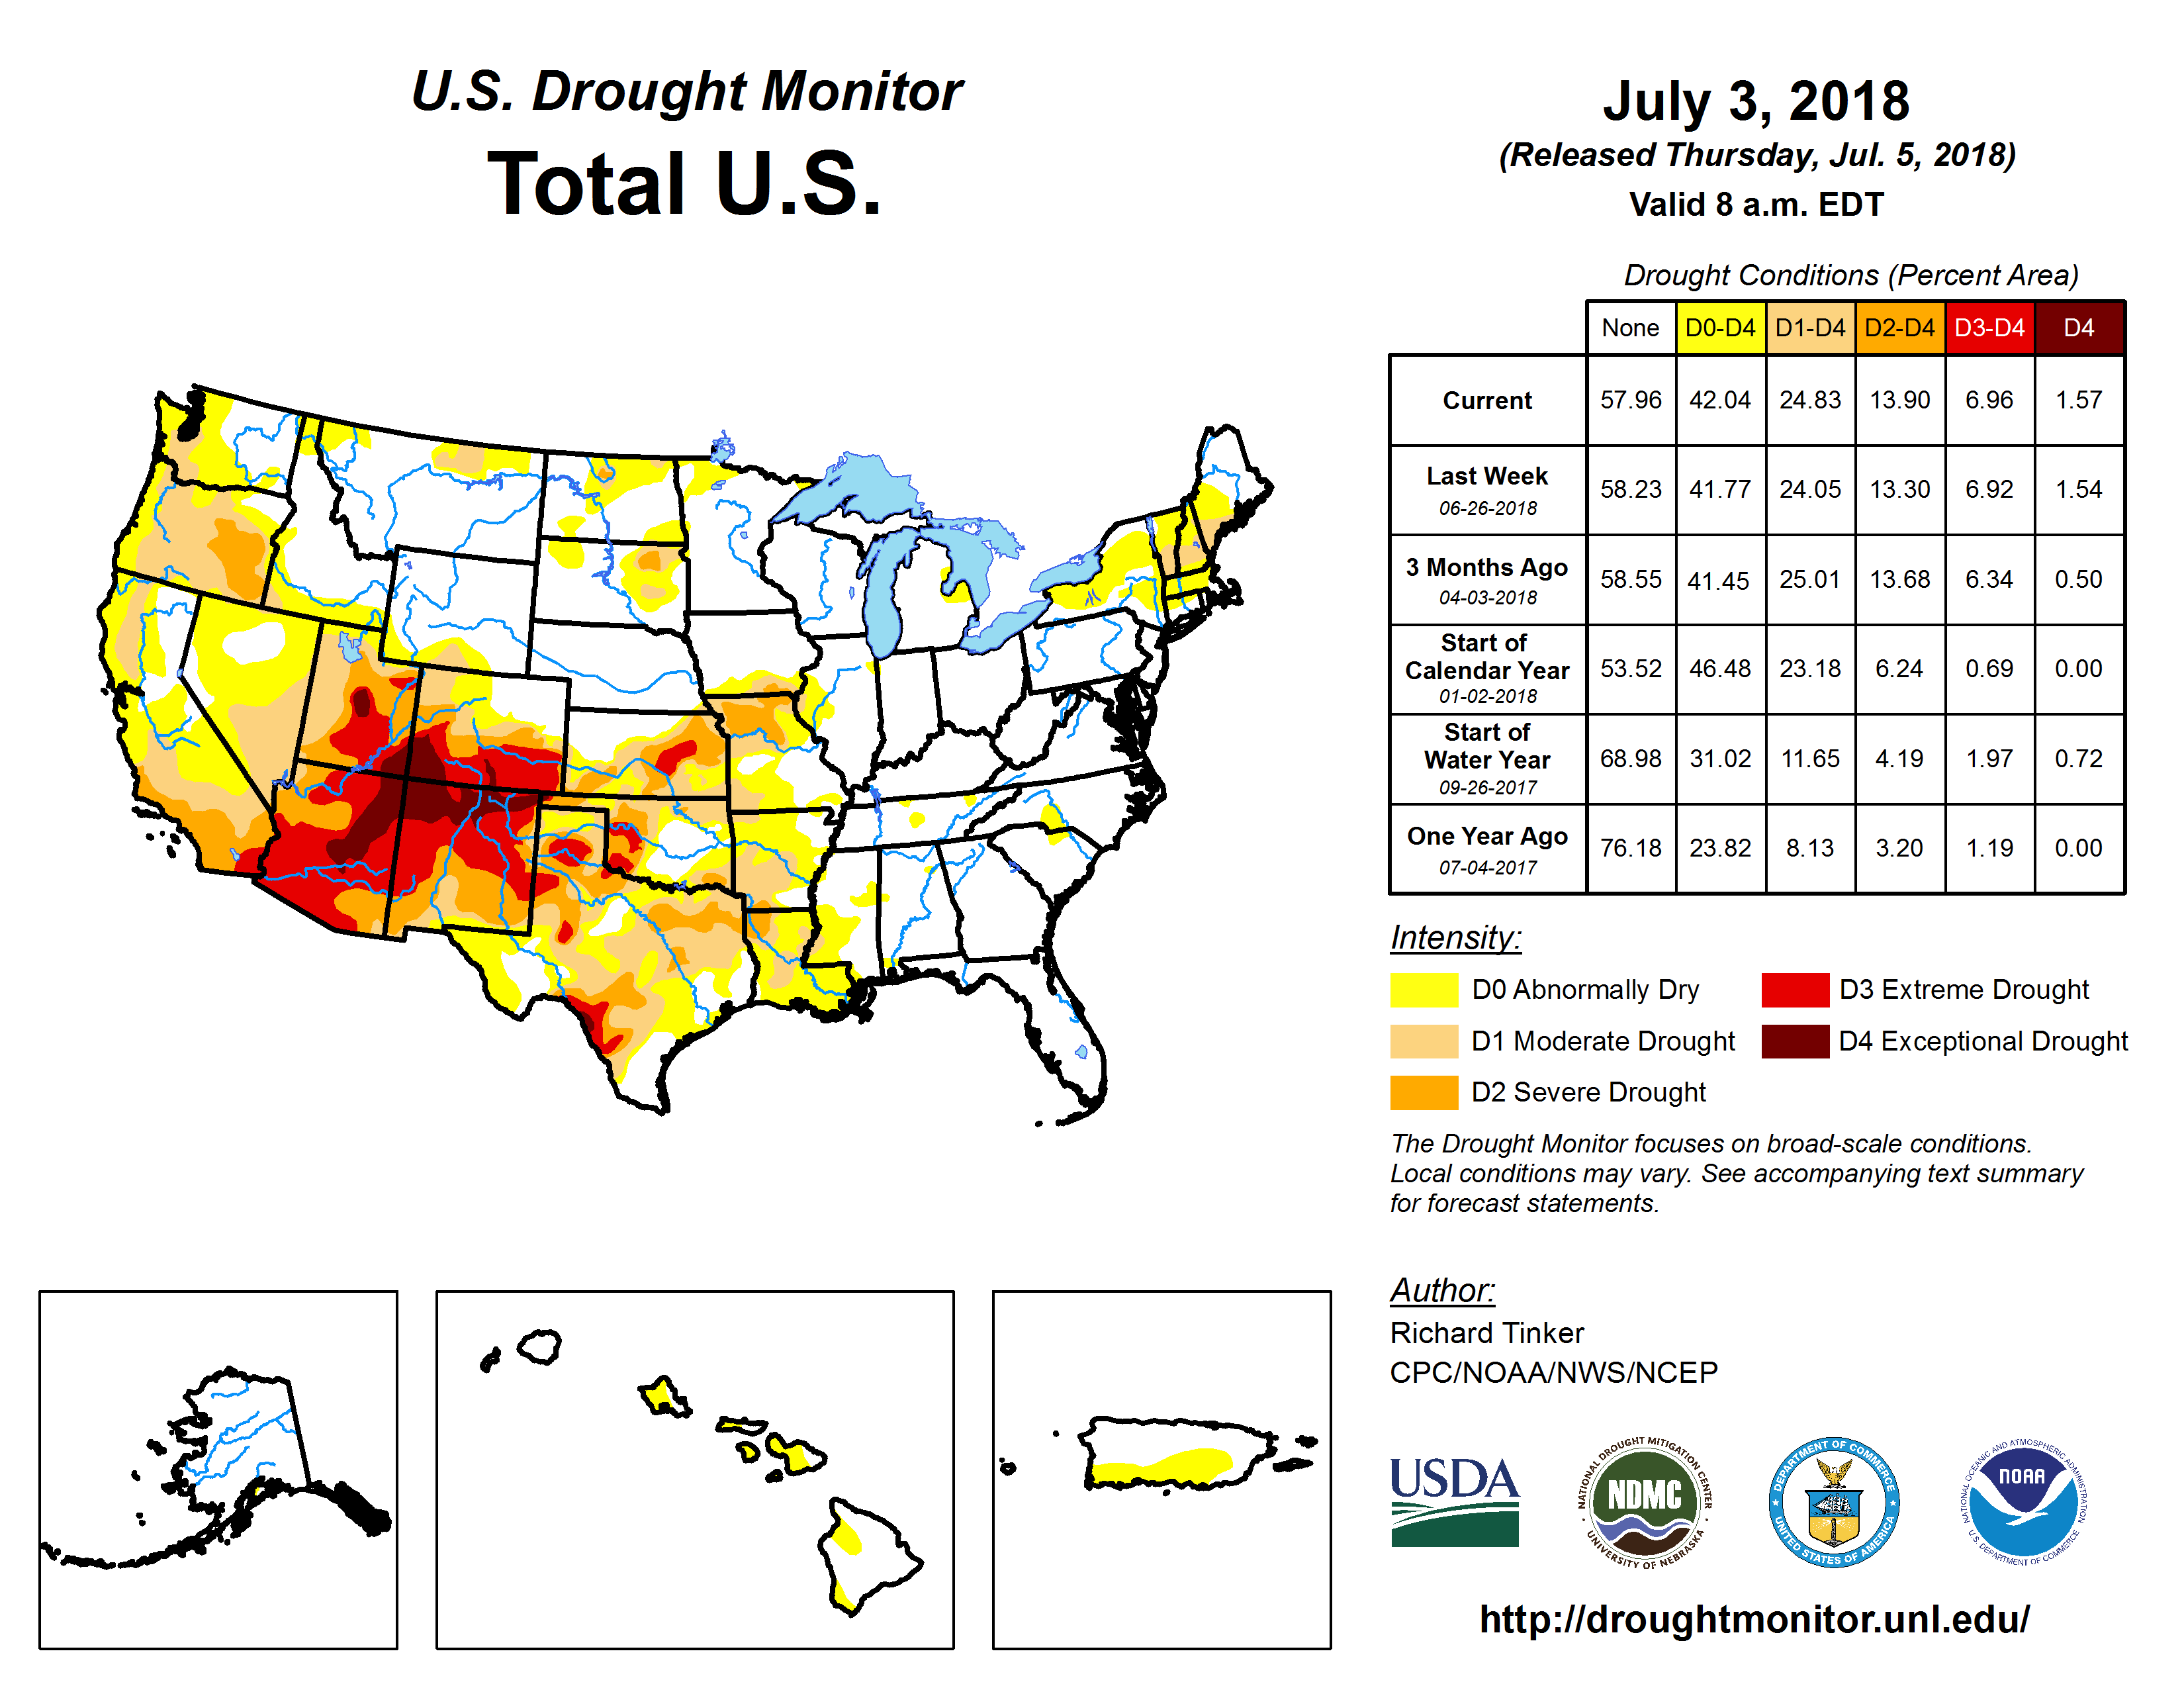
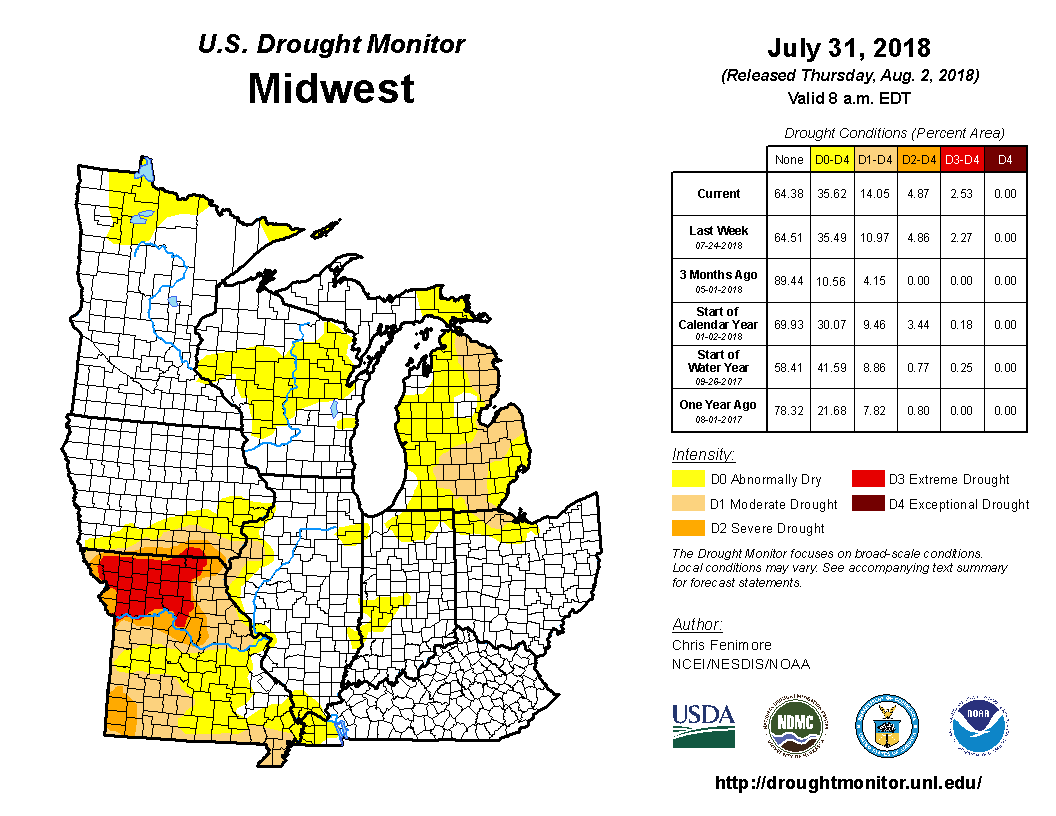
The U.S. Drought Monitor drought map valid July 31, 2018.
Like the last several months, the upper-level circulation pattern was quite active during July 2018 with ridge and trough patterns migrating through the jet stream flow over the CONUS. This activity occurred within a broadscale/long-wave ridge which dominated the overarching circulation over the CONUS. But this month a trough developed over the eastern U.S. during the last half of the month, and the focus of the heat and dryness shifted to the West. Cold fronts and surface lows moved into the trough bringing near to cooler-than-normal temperatures to the northern Plains to Southeast. The frontal systems also gave parts of the Plains above-normal precipitation, while a southerly flow ahead of the trough soaked much of the East Coast and monsoon showers brought above-normal rain to parts of the Southwest. Drought and abnormal dryness contracted in these areas. But the Pacific Northwest to northern and central Rockies, most of California, and much of the southern Plains to Great Lakes were drier than normal, with drought and abnormal dryness developing, expanding, or intensifying in these areas. The dry conditions during July were a continuation of persistent dryness for the last several months in parts of the Pacific Northwest and southern High Plains to Mid-Mississippi Valley (Standardized Precipitation Index maps for the last 1, 2, 3, 6, 9, 12 months). Drought expansion outweighed contraction this month, so the USDM-based national moderate-to-exceptional drought footprint across the CONUS expanded from 29.7 percent of the CONUS at the end of June to 34.1 percent of the CONUS at the end of July (from 24.8 percent to 29.0 percent for all of the U.S.). According to the Palmer Drought Index, which goes back to the beginning of the 20th century, about 37.8 percent of the CONUS was in moderate to extreme drought at the end of July, increasing about 5.1 percent from the 32.7 percent at the end of June.

Drought conditions at the end of the month, as depicted on the July 31st, 2018 USDM map, included the following core drought and abnormally dry areas:
-
A large area of abnormal dryness (D0) to moderate (D1) drought stretched from Oregon, Washington, and California in the West, across the southern and central Great Plains, to the Lower to Mid-Mississippi Valley. Severe (D2) drought was expanding in the Pacific Northwest, a large area of severe to exceptional (D4) drought covered the Southwest, and areas of severe to extreme (D3) drought stretched from Texas to the Lower and Mid-Mississippi Valley with a spot of exceptional drought in eastern Kansas. —
- According to the USDM, a little more than half (54.9 percent) of the West was experiencing moderate to exceptional drought at the end of July. The percent area of the West (from the Rockies to the West Coast) in moderate to extreme drought (based on the Palmer Drought Index) rapidly increased in December and continued to increase in January and February, growing from 21.5 percent at the end of October 2017 to 62.4 percent of the West at the end of February 2018. Above-normal precipitation improved conditions in California and Nevada in March, so the Palmer percent area in drought shrank to 50.2 percent by the end of March. April was wet in northern California and northwest Nevada, and Washington to the northern Rockies, and May was wet in Nevada to southern California, but extremely dry conditions occurred along the coast in May, especially in Oregon and Washington; California to Colorado were dry in June; and the Pacific Northwest to northern and central Rockies were dry in July. The dry conditions were coupled with unusual warmth in parts to much of the West during May, June, and July which increased evapotranspiration, thus exacerbating drought conditions. As a result, the Palmer Drought Index measure of drought area expanded to 70.4 percent of the West by the end of July.
- Even though beneficial monsoon rains fell in July, the D3-D4 areas in the Southwest are regions which have experienced the most severe precipitation deficits over the last several months to two years based on the Standardized Precipitation Index (maps for the last 2, 3, 6, 9, 12, and 24 months).
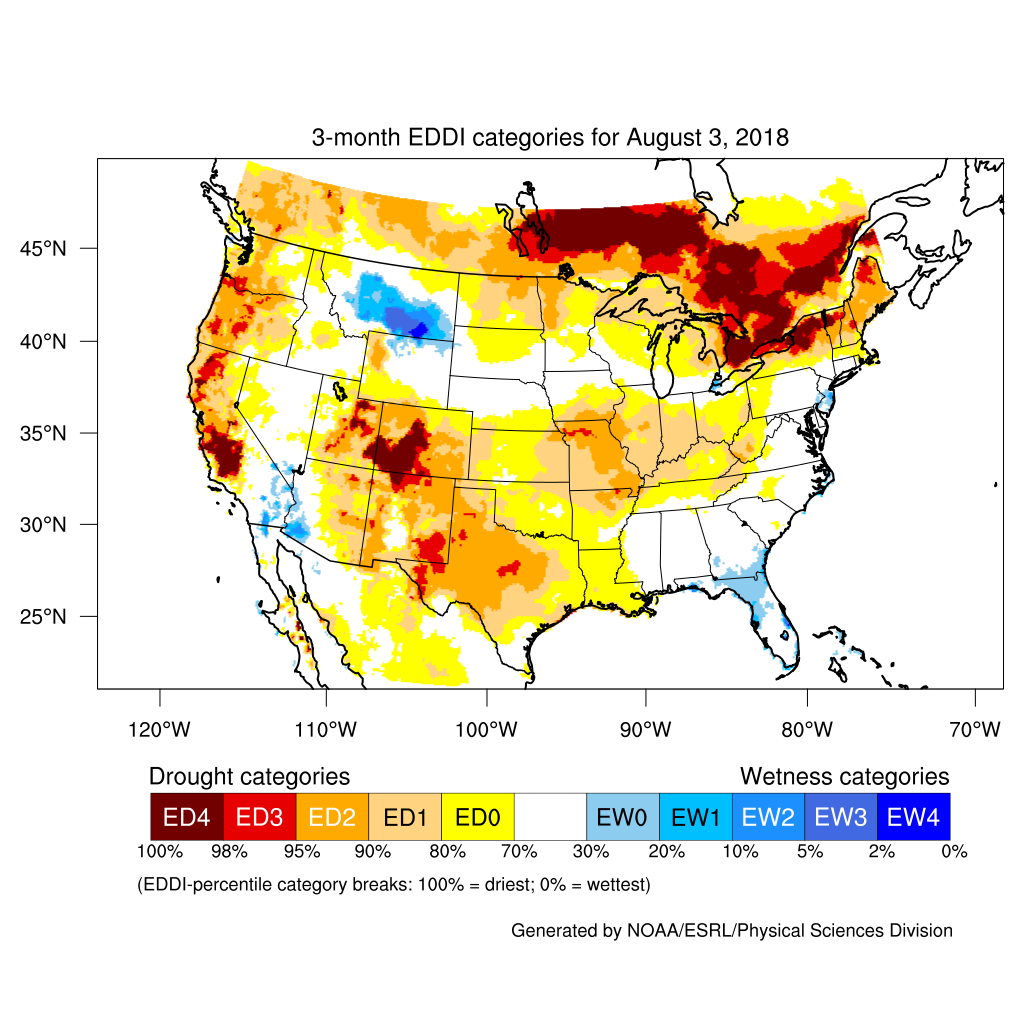
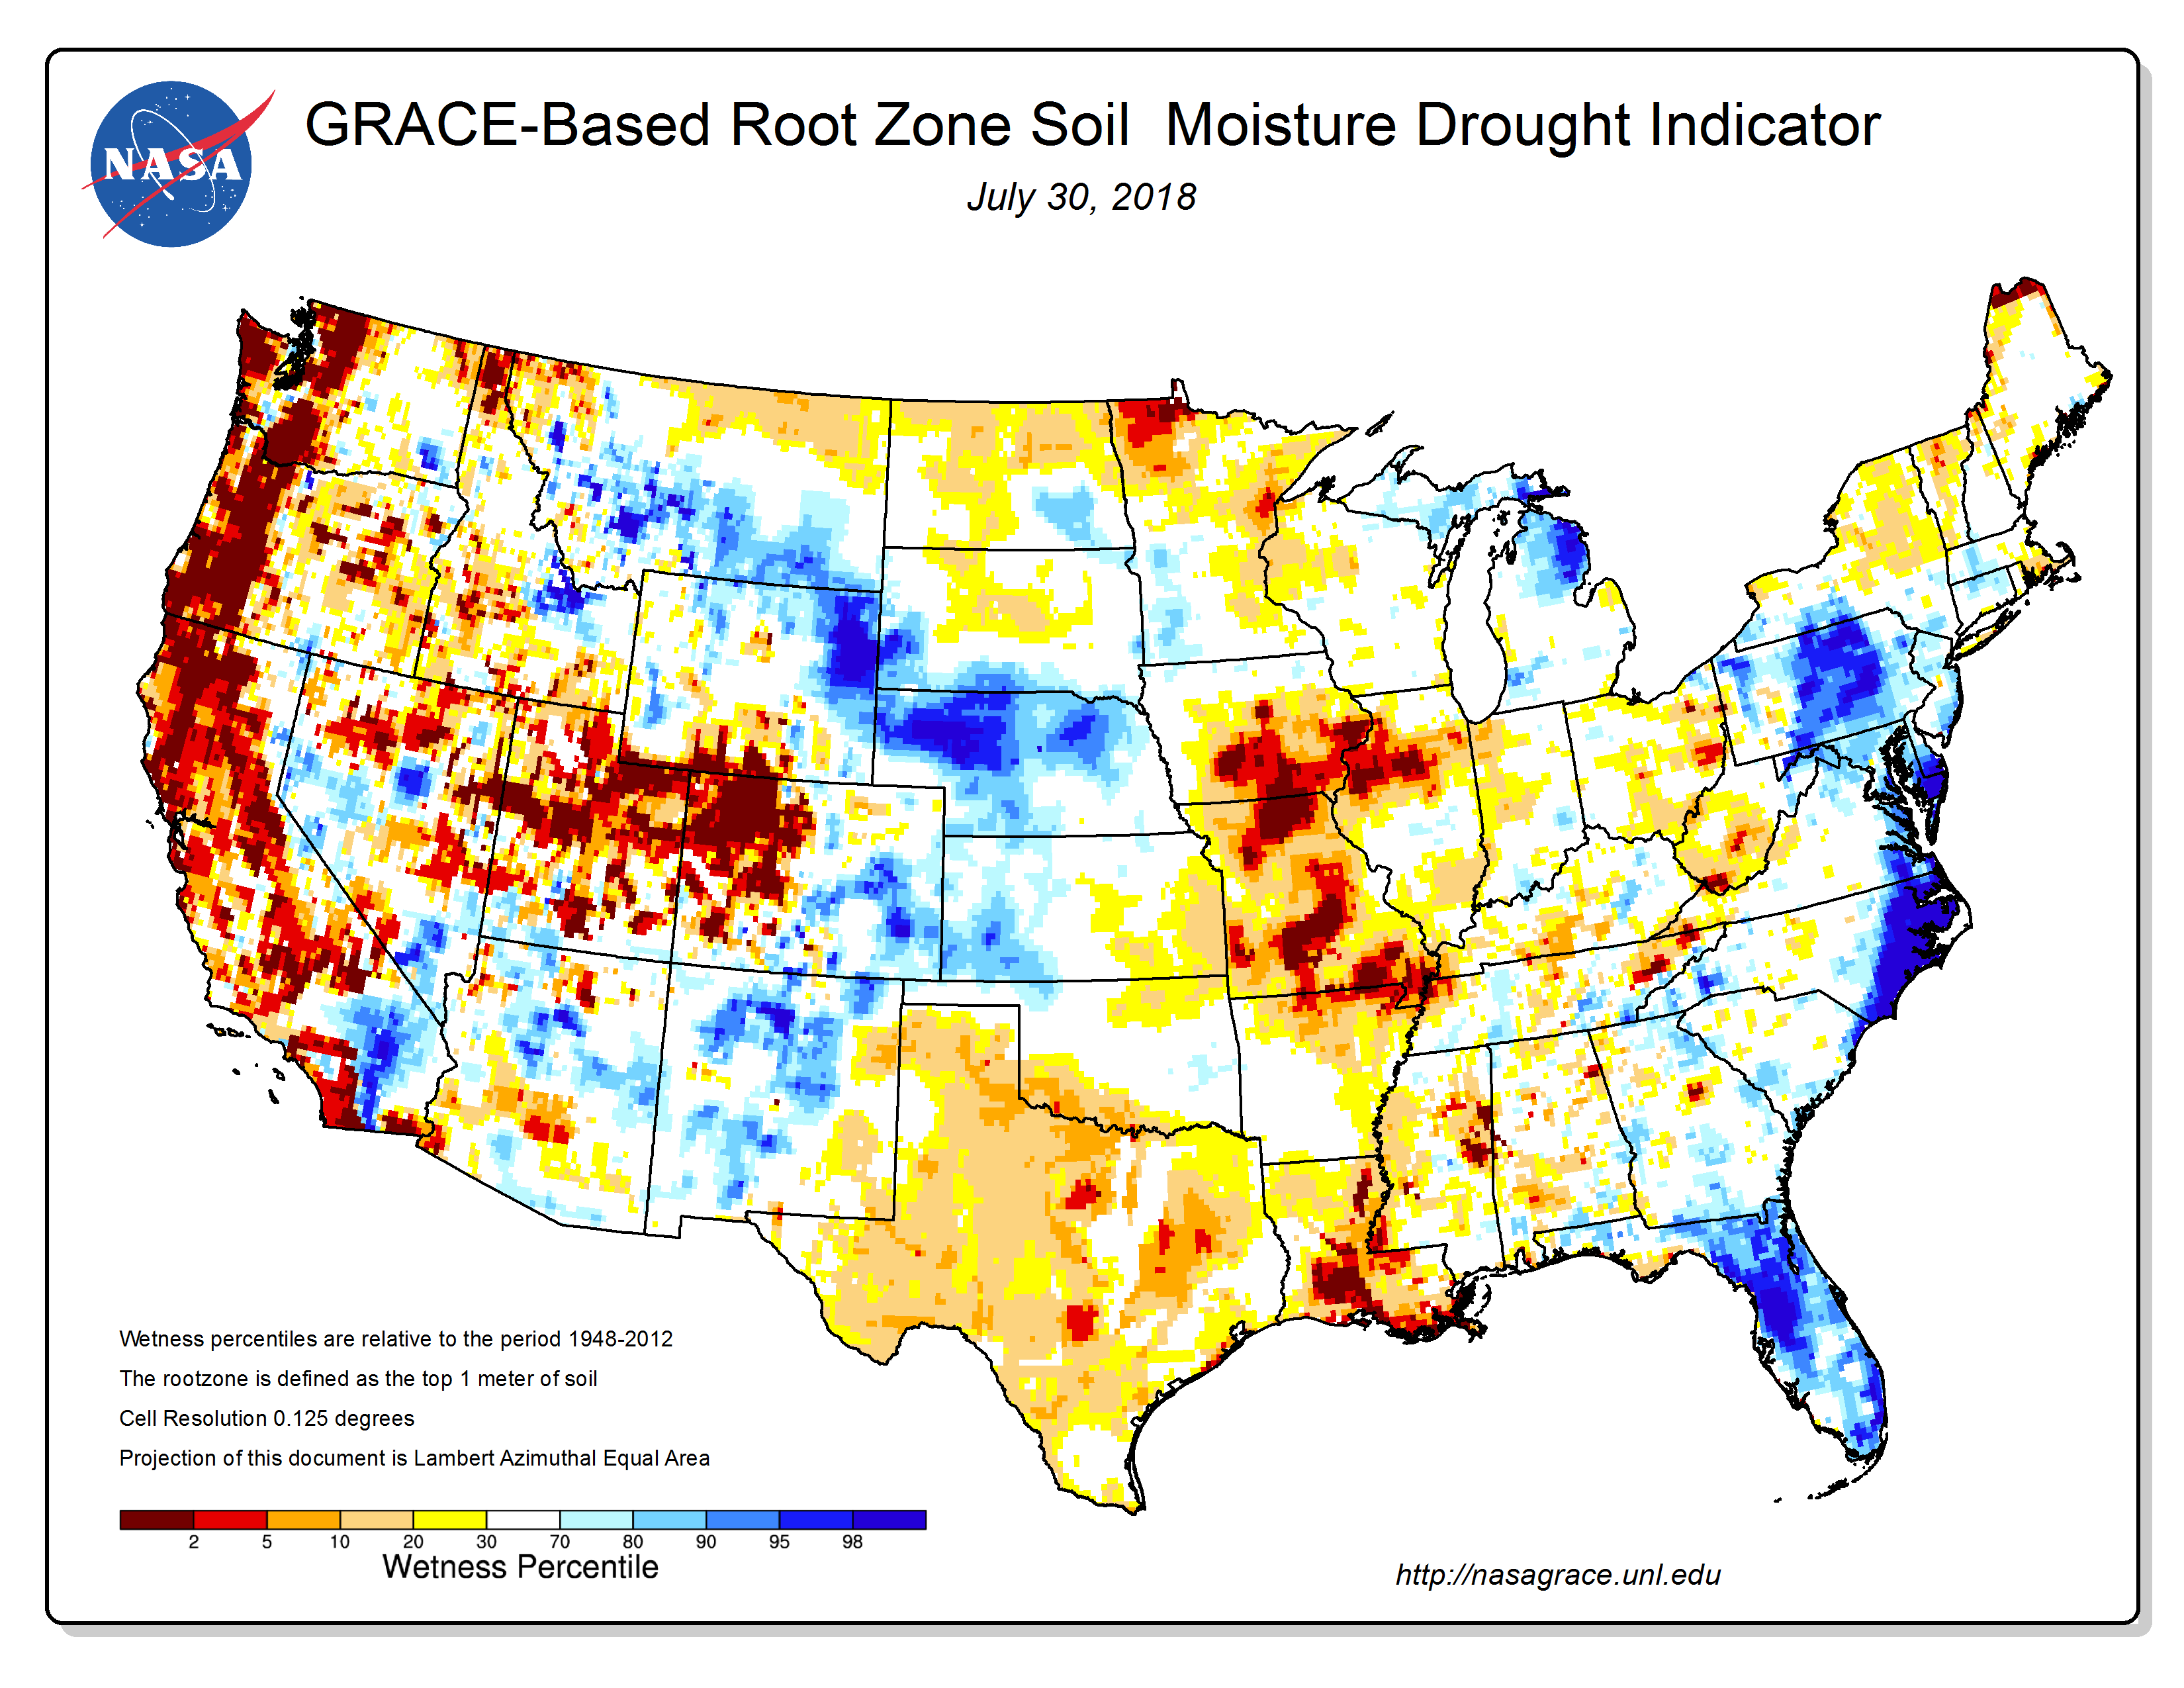
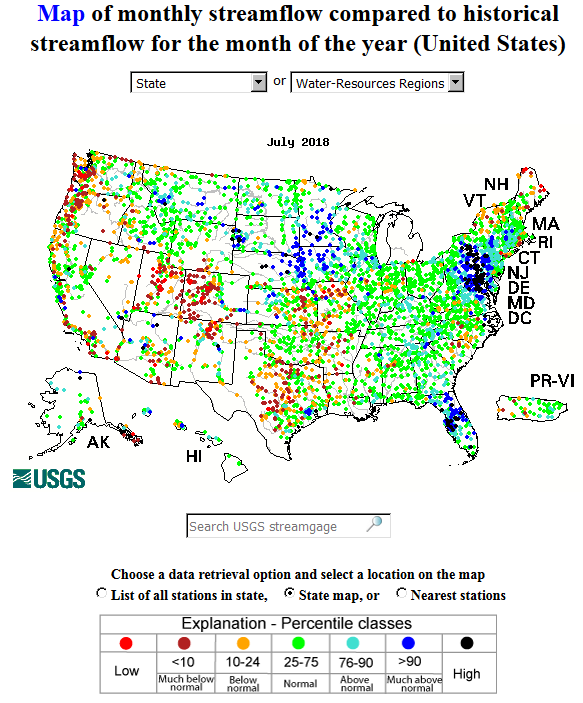
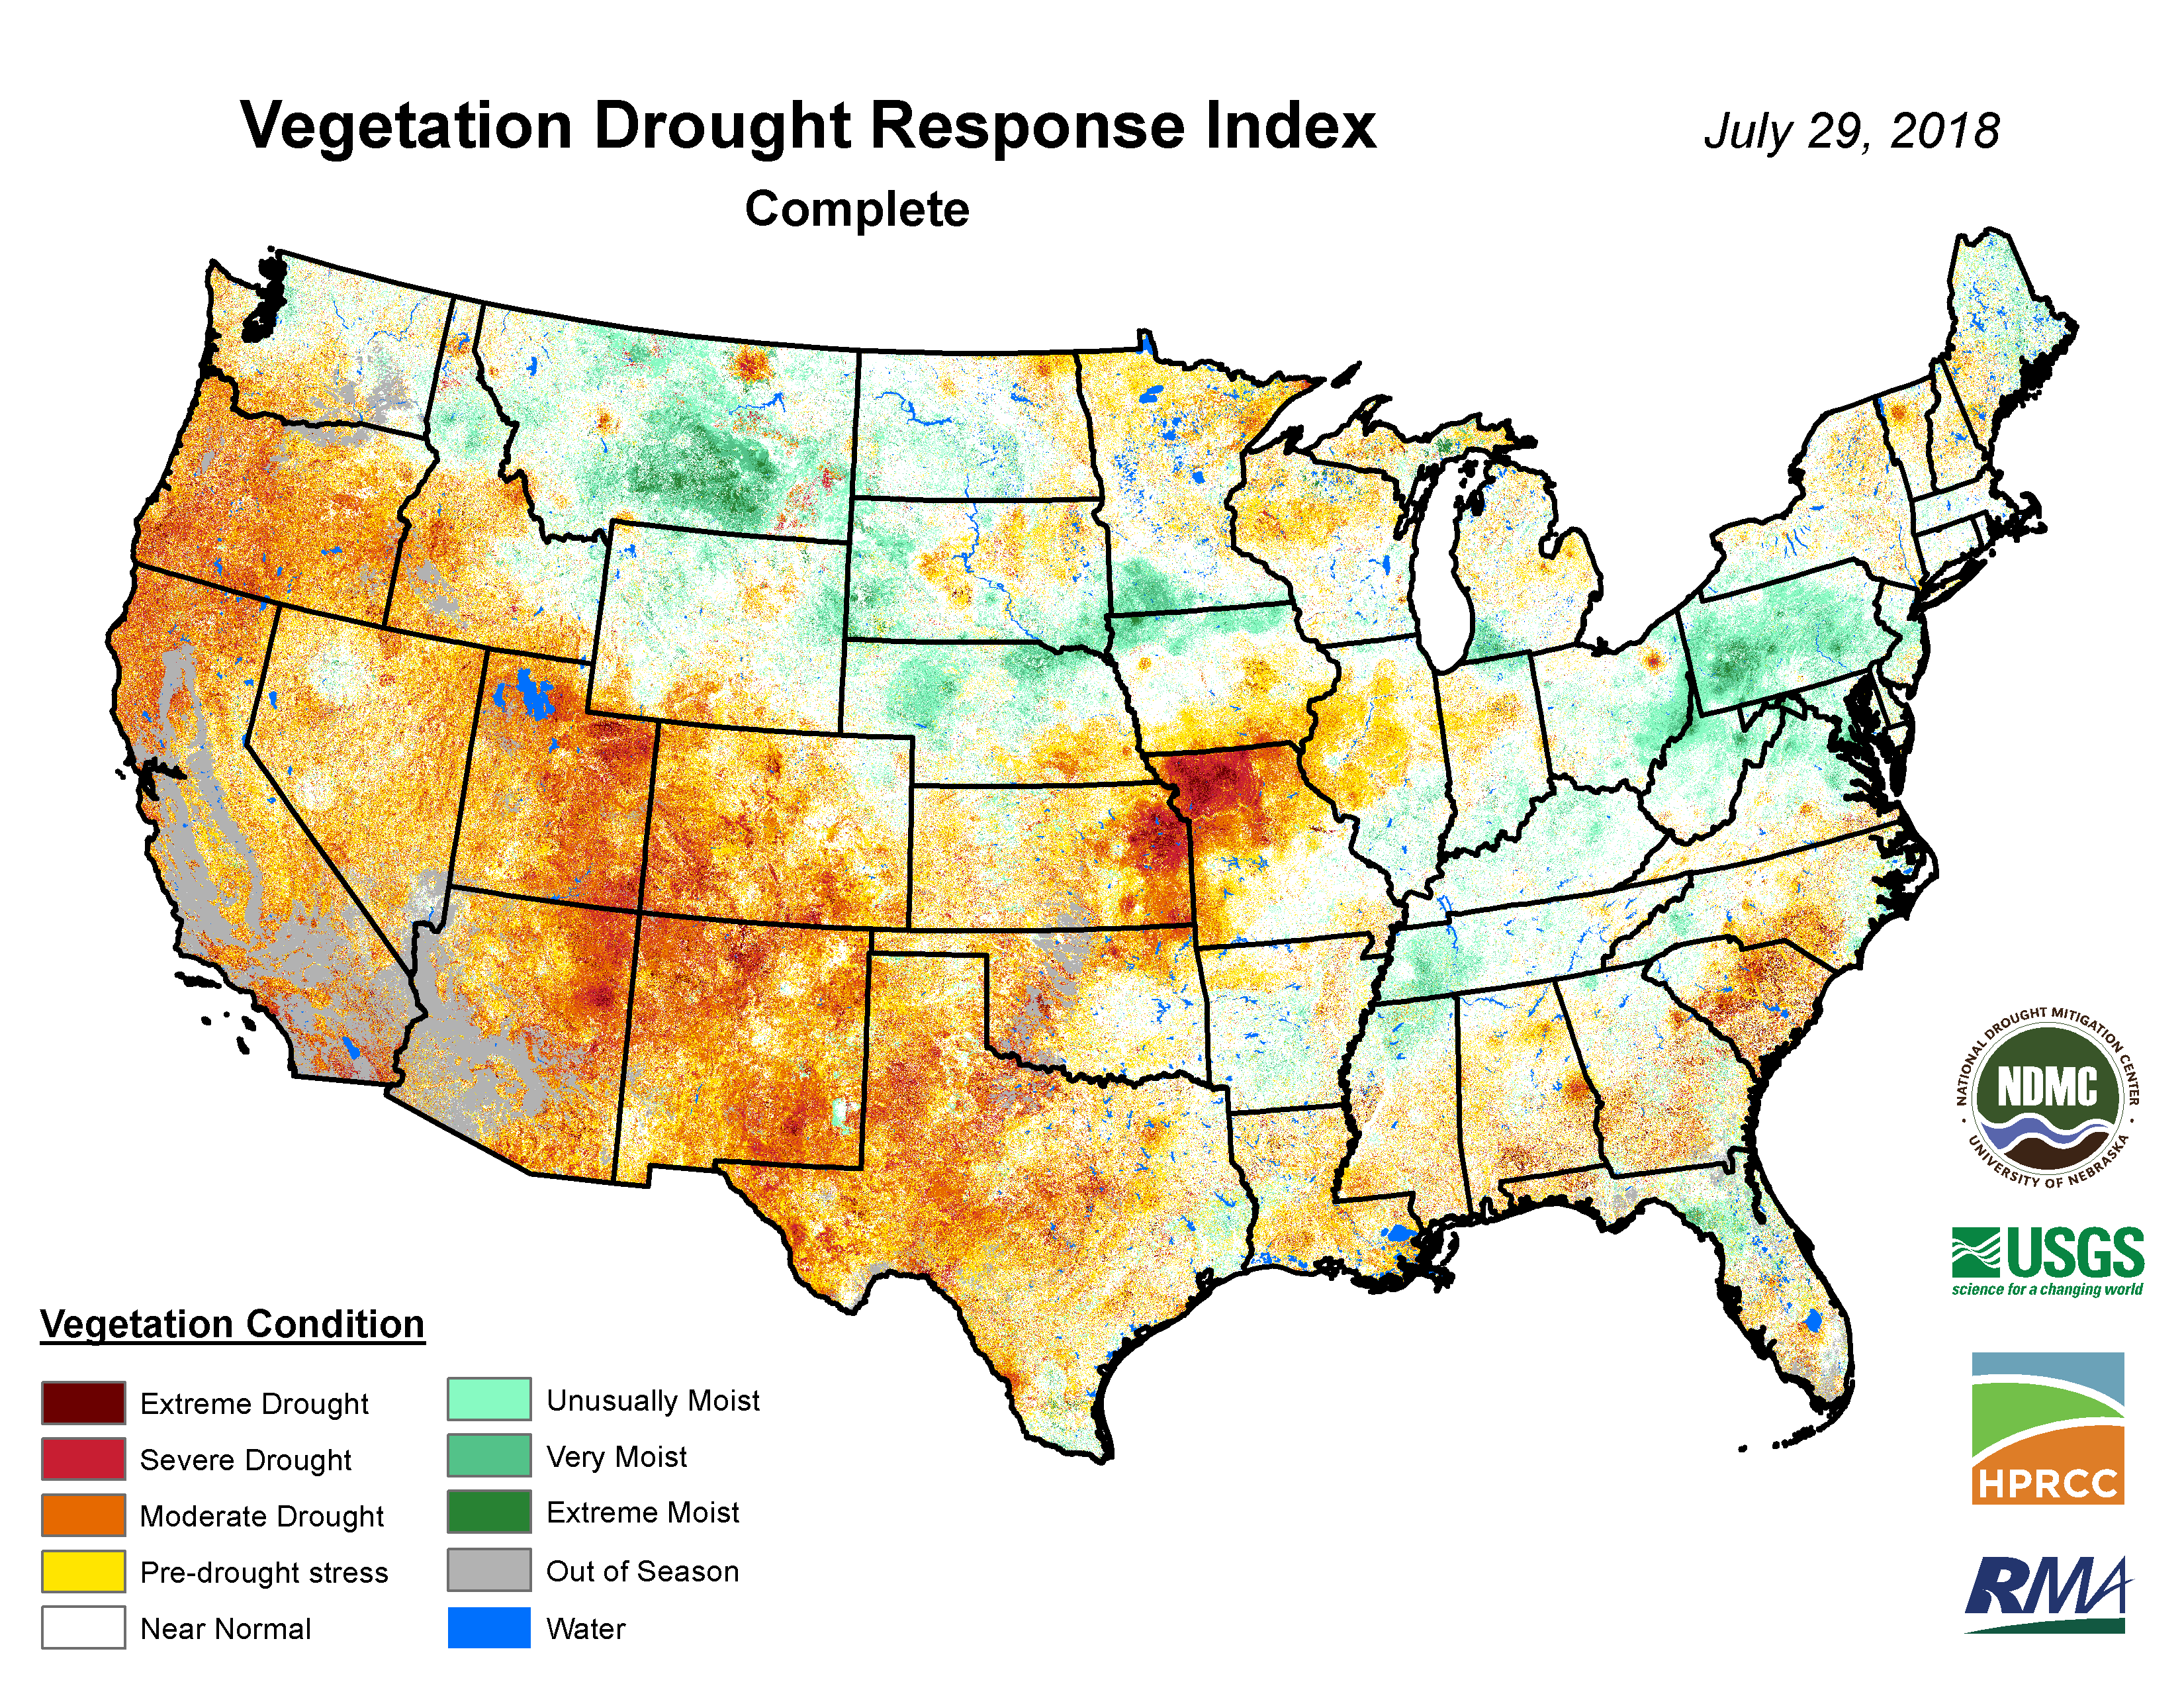
- Drought conditions were reflected in several indices and indicators, including evapotranspiration (EDDI), soil moisture (SMOS satellite observations, and CPC, Leaky Bucket, VIC, NASA GRACE, NLDAS top and total layer models), Crop Moisture Index (CMI maps for weeks 1, 2, 3, 4), streamflow, groundwater (NASA GRACE satellite-based estimates, USGS observations), the QuickDRI index, the satellite data-based VegDRI vegetation condition index, some reservoirs, and USGS number of rain days and consecutive dry days. July 30th U.S. Department of Agriculture (USDA) observations of soil moisture and pasture and rangeland condition revealed significant impacts in the West and South. Topsoils were short or very short of moisture (dry or very dry) across 67 percent of Arkansas, 75 percent of California, 35 percent of Colorado, 56 percent of Idaho, 57 percent of Louisiana, 52 percent of Mississippi, 75 percent of Missouri, 70 percent of Nevada, 74 percent of New Mexico, 84 percent of Oregon, 74 percent of Texas, and 63 percent of Utah. Subsoil moisture conditions were equally bad, with values as follows: 64 percent of Arkansas, 75 percent of California, 32 percent of Colorado, 52 percent of Idaho, 56 percent of Louisiana, 56 percent of Mississippi, 78 percent of Missouri, 60 percent of Nevada, 80 percent of New Mexico, 82 percent of Oregon, 78 percent of Texas, and 57 percent of Utah. Pasture and rangeland were in poor to very poor condition across 89 percent of Arizona, 35 percent of California, 46 percent of Colorado, 69 percent of Missouri, 35 percent of Nevada, 69 percent of New Mexico, 63 percent of Oregon, 50 percent of Texas, and 38 percent of Utah.
- Abnormal dryness to moderate drought continued in parts of the northern Plains and the High Plains of Montana. — Drought impacts were evident in several indices and indicators, including evapotranspiration (EDDI), soil moisture (SMOS satellite observations, and CPC, Leaky Bucket, VIC, NASA GRACE, NLDAS top and total layer models), Crop Moisture Index (CMI maps for weeks 1, 2, 3, 4), and the satellite data-based VegDRI vegetation condition index. According to USDA observations, topsoils were short or very short of moisture (dry or very dry) across 53 percent of Montana and 22 percent of North Dakota and South Dakota, and subsoils were dry to very dry across 46 percent of Montana, 23 percent of North Dakota, and 29 percent of South Dakota.
- Areas of abnormal dryness and moderate drought persisted in the Northeast. — Drought conditions were reflected in several indices and indicators, including evapotranspiration (EDDI), soil moisture (SMOS satellite observations, and CPC, Leaky Bucket, NASA GRACE, NLDAS top and total layer models), Crop Moisture Index (CMI maps for weeks 1, 2, 3, 4), streamflow, groundwater (NASA GRACE satellite-based estimates, USGS observations), the QuickDRI index, and the satellite data-based VegDRI vegetation condition index. According to July 30th USDA observations, topsoils were short or very short of moisture across 47 percent of Maine, 58 percent of New Hampshire, 24 percent of New York, 67 percent of Rhode Island, and 70 percent of Vermont. Subsoil moisture was short or very short across 36 percent of Delaware, 56 percent of Maine, 59 percent of New Hampshire, 36 percent of New York, and 66 percent of Vermont. Pasture and rangeland were in poor to very poor condition across 30 percent of Connecticut, 20 percent of Delaware, 23 percent of Maryland, 36 percent of New Hampshire, 27 percent of New York, 55 percent of Rhode Island, and 25 percent of Vermont.
- Abnormal dryness expanded and moderate drought developed in the Great Lakes. — Drought conditions were reflected in several indices and indicators, including evapotranspiration (EDDI), soil moisture (SMOS satellite observations, and NLDAS top and total layer models), Crop Moisture Index (CMI maps for weeks 1, 2, 3, 4), the QuickDRI index, and the satellite data-based VegDRI vegetation condition index. According to USDA observations, topsoils were short or very short of moisture across 27 percent of Illinois, 40 percent of Indiana, 49 percent of Michigan, 38 percent of Ohio, and 23 percent of Wisconsin. Subsoil moisture was short or very short across 30 percent of Illinois, 37 percent of Indiana, 59 percent of Michigan, 34 percent of Ohio, and 17 percent of Wisconsin.
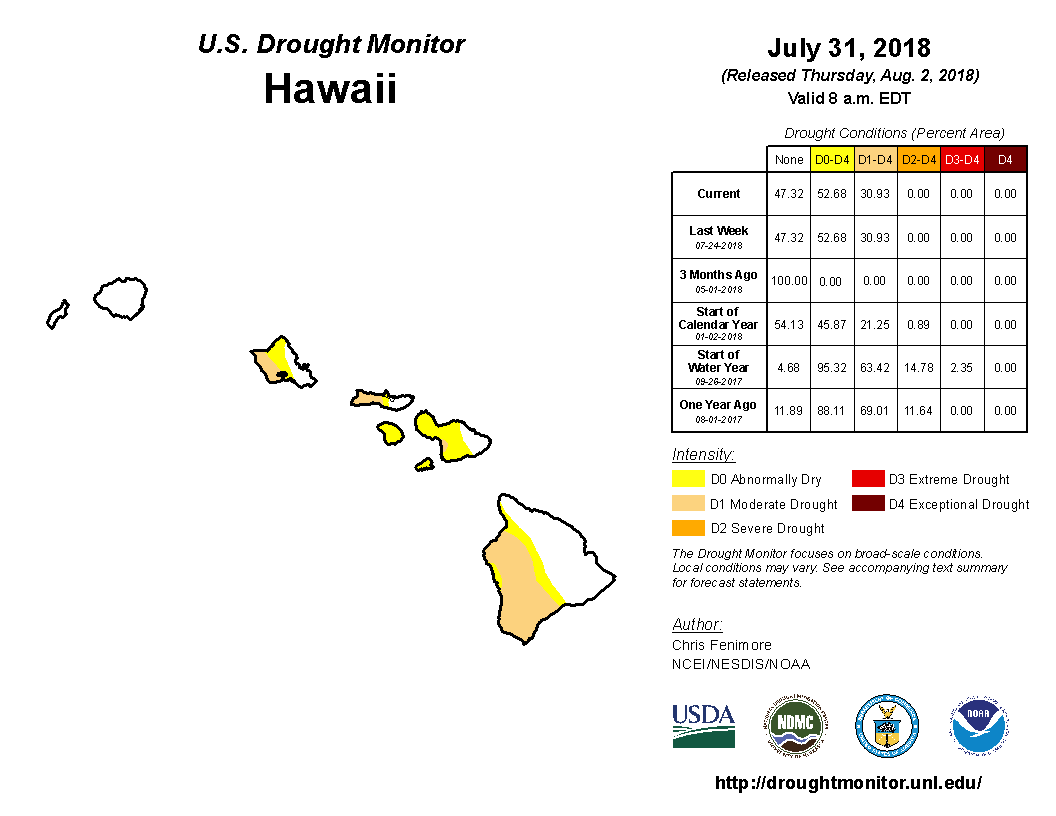
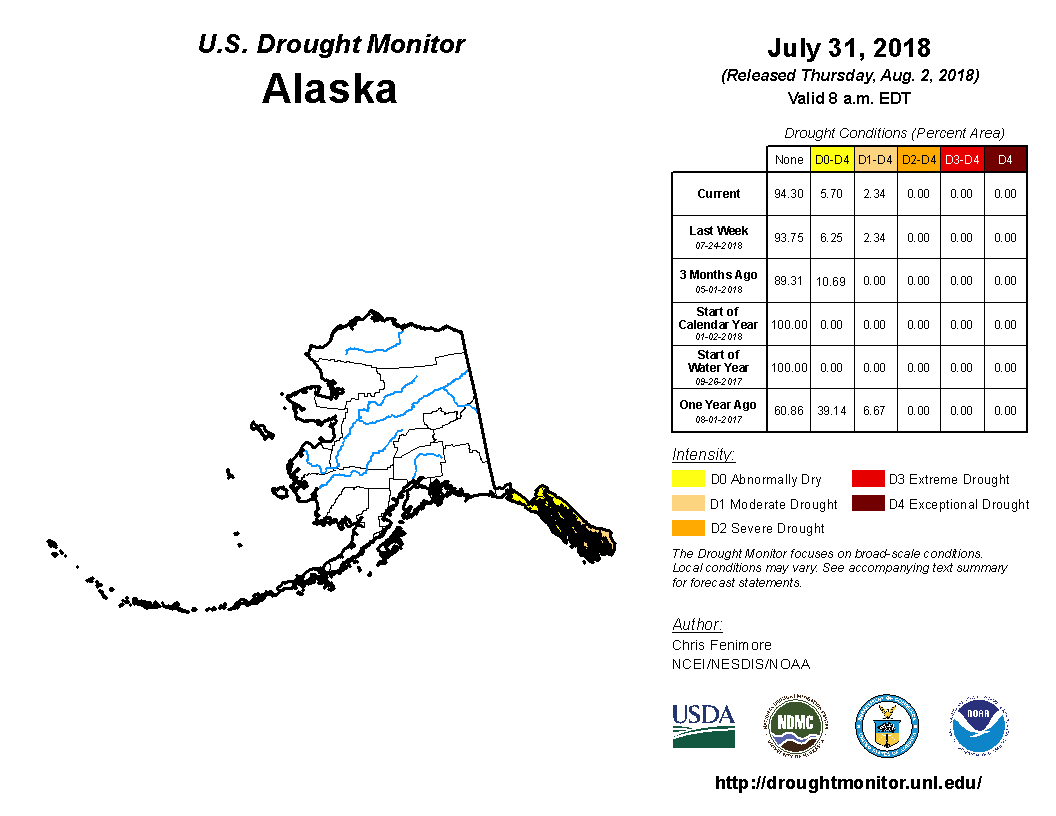
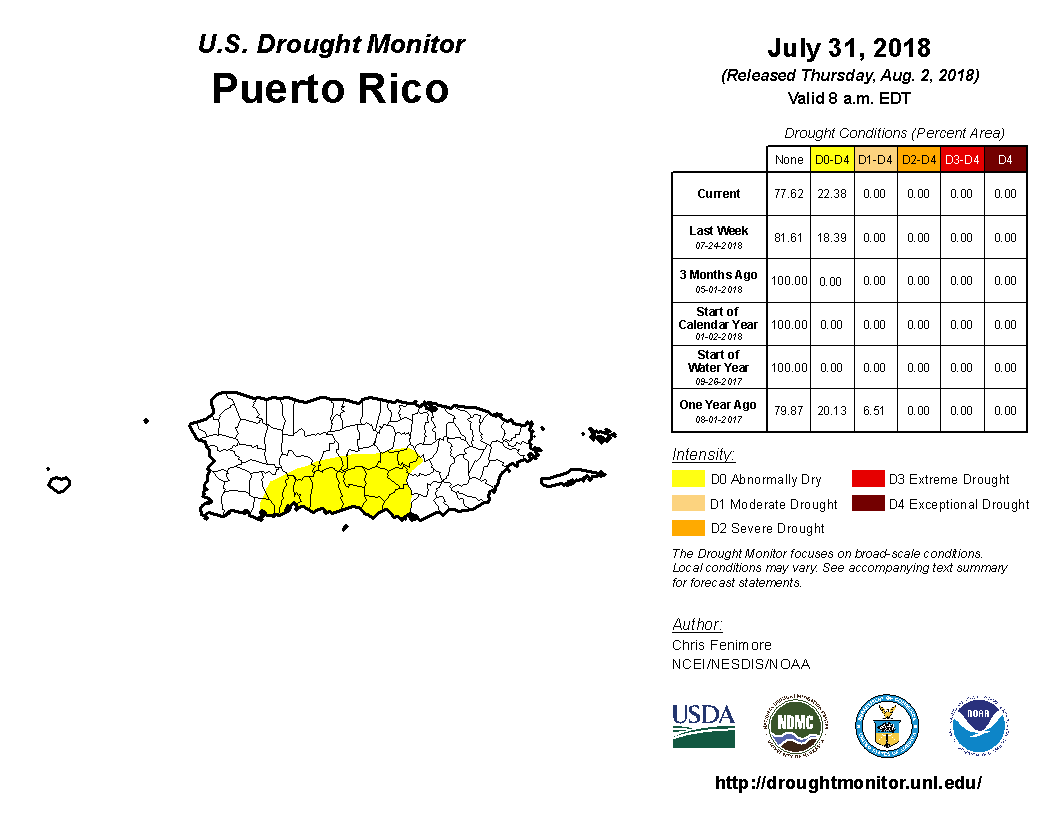
- Abnormal dryness continued or expanded and moderate drought developed in Hawaii and Alaska, while abnormal dryness continued in Puerto Rico. Low streamflow was observed in parts of Alaska and Puerto Rico.
Palmer Drought Index
The Palmer drought indices measure the balance between moisture demand (evapotranspiration driven by temperature) and moisture supply (precipitation). The Palmer Z Index depicts moisture conditions for the current month, while the Palmer Hydrological Drought Index (PHDI) and Palmer Drought Severity Index (PDSI) depict the current month's cumulative moisture conditions integrated over the last several months. While both the PDSI and PHDI indices show long-term moisture conditions, the PDSI depicts meteorological drought while the PHDI depicts hydrological drought. The PDSI map shows less severe and extensive drought (as well as wet spell conditions) in some parts of the country than the PHDI map because the meteorological conditions that produce drought and wet spell conditions are not as long-lasting as the hydrological impacts.
|
 |
Used together, the Palmer Z Index and PHDI maps show that short-term dry conditions continued from the southern Plains to Mississippi Valley, across much of the Pacific Northwest to central Rockies, over areas that were in drought at the end of June, expanding and intensifying long-term drought. Short-term dry conditions occurred in parts of the Great Lakes, reducing previous long-term wet conditions. Short-term wet conditions occurred over parts of the Southwest and in parts of the central to northern Plains, reducing the intensity of previous long-term dry conditions. Short-term wet conditions occurred in the Northeast, expanding and intensifying previous long-term wet conditions.
Standardized Precipitation Index
The Standardized Precipitation Index (SPI) measures moisture supply. The SPI maps here show the spatial extent of anomalously wet and dry areas at time scales ranging from 1 month to 24 months.
 |
 |
 |

The SPI maps illustrate how moisture conditions have varied considerably through time and space over the last two years. Dryness in the central Rockies can be seen at all time scales. Dryness in parts of the Pacific Northwest is evident from 1 to 12 months. California is dry at most time scales from 2 to 12 months. Parts of the Southwest are dry for the last 3 to 24 months, especially from 6 to 24 months. Parts to most of the southern Plains to Mississippi Valley are dry at the 1- to 12-month time scales, with the Mid-Mississippi Valley dry extending to 24 months. Scattered parts of the northern Plains to Upper Mississippi Valley are dry at every time scale. Parts of the Northeast and Great Lakes are dry at 1 to 3 months. A few parts of the Southeast have dryness at 1 to 2 months and 6 to 24 months.
 |
 |
 |
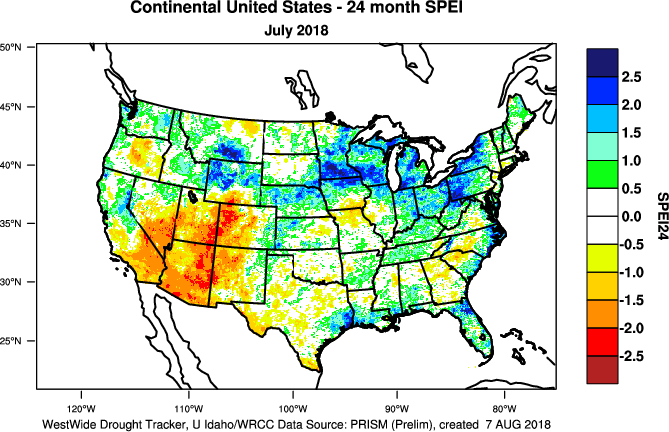
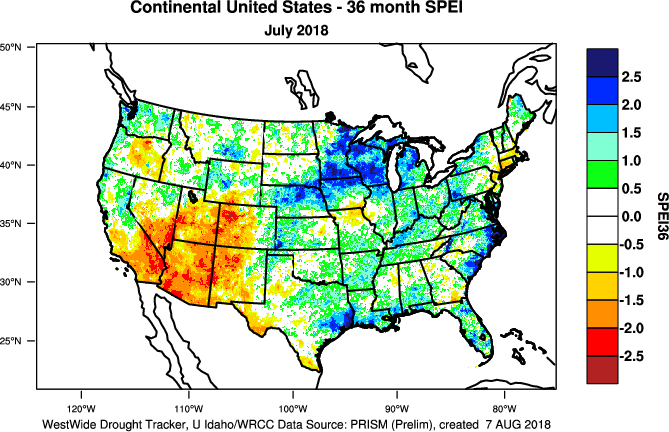
Standardized Precipitation Evapotranspiration Index
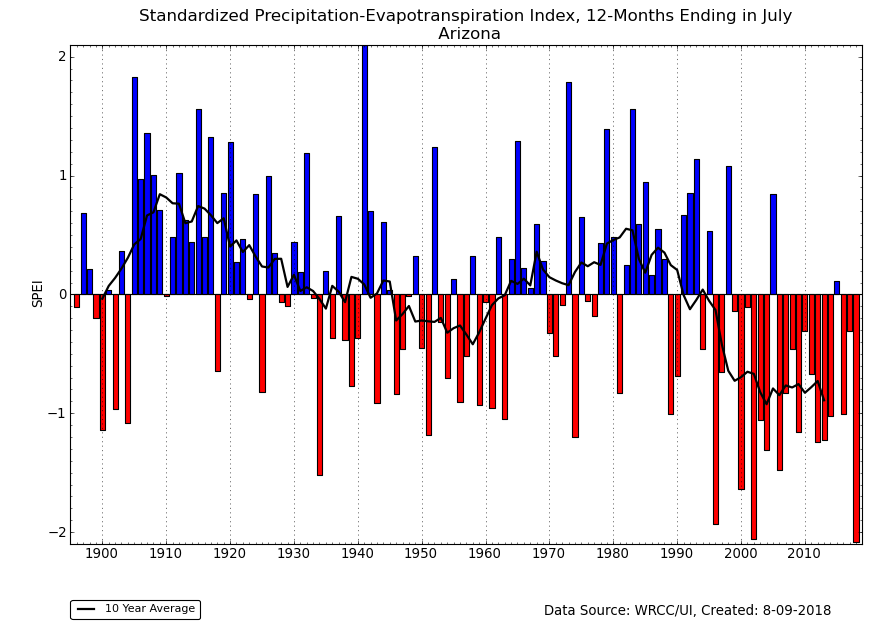
The SPI measures water supply (precipitation), while the SPEI (Standardized Precipitation Evapotranspiration Index) measures the combination of water supply (precipitation) and water demand (evapotranspiration as computed from temperature). Warmer temperatures tend to increase evapotranspiration, which generally makes droughts more intense.
 1-month SPEI for current month.
|
 1-month SPI for current month.
|
Temperatures during July 2018 were above normal across most of the West, with record warmth occurring in some areas. For areas that were drier than normal during July, this resulted in a more extreme SPEI compared to SPI.
Warmer-than-normal temperatures have persisted across much of the country for the last 12 months and longer. This has resulted in a more extreme SPEI compared to SPI for those regions which have had drier-than-normal weather (SPEI maps for last 3, 6, 12, 24, 36, 48, 60, 72 months) (SPI maps for last 3, 6, 12, 24, 36, 48, 60, 72 months), especially the Southwest. Arizona's 12-month SPEI for July 2018 ranked as the most extreme SPEI on record, compared to the 12-month SPI which indicated severe dryness but not record dry.
Regional Discussion

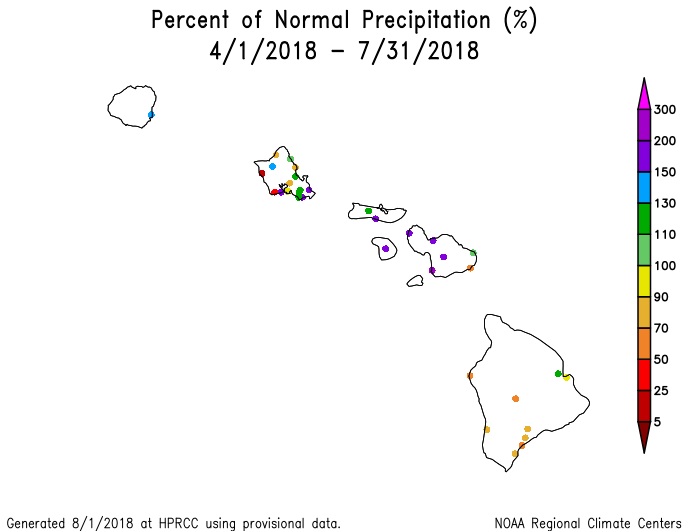
Map of percent of normal precipitation for Hawaii, May-July 2018.
July 2018 was drier than normal at most of the Hawaiian stations. The last 2 to 3 months have been predominantly drier than normal. Rain in April made the 4-month precipitation anomaly map wetter than normal at many stations, but most on the Big Island were still drier than normal. A mixed anomaly pattern with wet conditions dominating is evident at longer time scales (last 6, 7, 10, 12, 24, 36 months). Streamflow was mostly near to above normal. Moderate drought covered about a third (30.9 percent) of the state, and abnormal dryness expanded to about a half (52.7 percent) of Hawaii, as seen on the July 31st, 2018 USDM map.

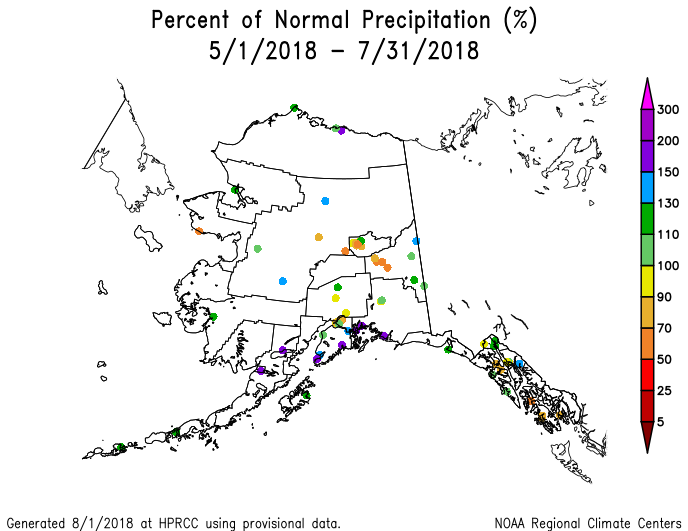
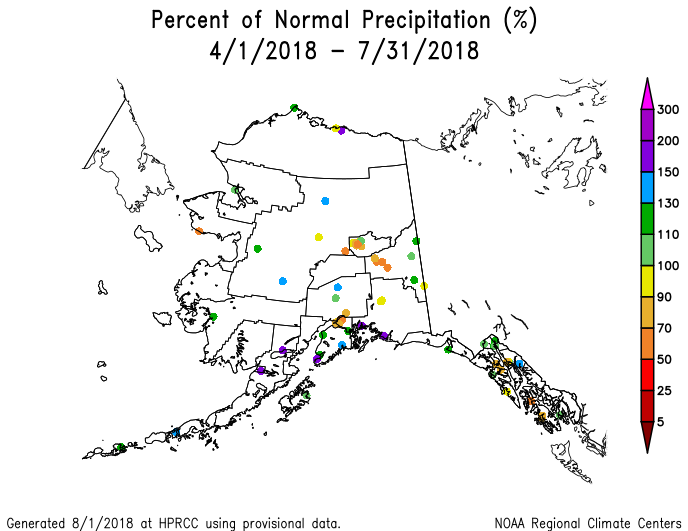
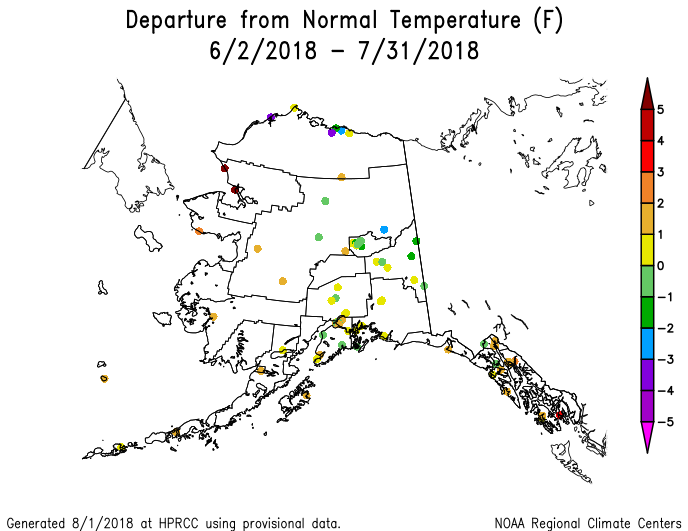
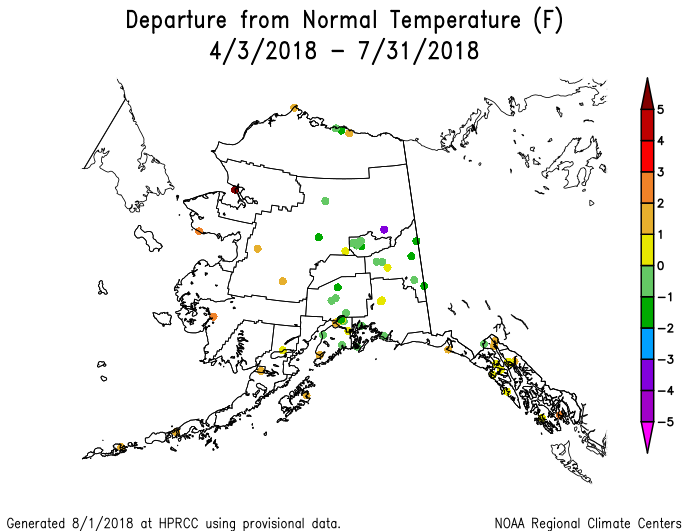
Alaska gridded precipitation rank map, July 2018.
July 2018 was wetter than normal in southwestern and north coastal areas of Alaska, but drier than normal across the rest of the state. The wetter-than-normal areas grew bigger at the 2- to 7-month time scales, but dryness was still evident at the west coastal, east central, and southeast areas. Wet conditions dominated at longer time scales, except in the panhandle and southern coastal areas. (Low elevation station precipitation anomaly maps for the last 1, 2, 3, 4, 6, 7, 10, 12, 24, 36 months.) (Divisional precipitation rank maps for the last 1, 3, 6, 7, 12 months.) (Gridded precipitation percentile maps for the last 1, 3, 7 months.) (Gridded percent of average precipitation maps for the last 1, 3, 6, 7 months.) Temperatures during July were warmer than average across the state, and record warm in the southern portions of the panhandle. Cooler-than-normal temperatures appeared in the north coastal and east central sections, with warmer-than-normal anomalies elsewhere, at the 2 to 3 month time scales. The colder-than-normal area expanded at 4 months, but shifted to the southern sections with warmer-than-normal temperatures in the north and west at the 6- and 7-month time scales. Warmer-than-normal temperatures covered almost the entire state at the 12-month time scale, with record warmth in the north. (Low elevation station temperature anomaly maps for the last 1, 2, 3, 4, 7, 10, 12 months.) (Divisional temperature rank maps for the last 1, 3, 6, 7, 12 months.) (Gridded temperature percentile maps for the last 1, 3, 7 months.) (Gridded temperature departure maps for the last 1, 3, 6, 7 months.) Streamflow was mostly near to above normal with some below-normal stream levels in the panhandle. The Leaky Bucket model suggested some lingering dryness in the soils in the panhandle, south central, and eastern sections. Moderate drought was introduced in the southern portions of the panhandle, with abnormally dry to moderate drought conditions covering about 6 percent of the state on the July 31st USDM map.

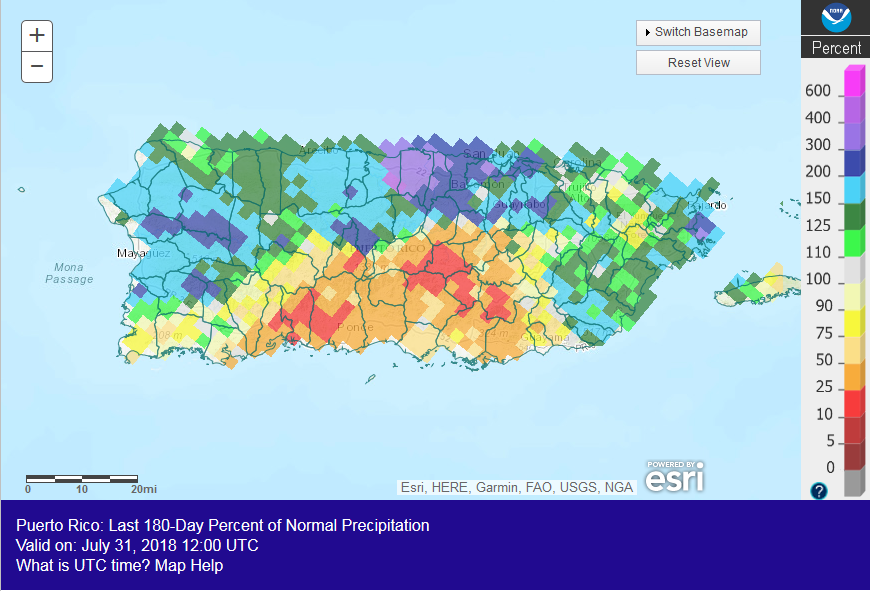
Puerto Rico percent of normal precipitation map, May-July 2018.
Puerto Rico: Puerto Rico was mostly drier than normal during July, with a couple small wetter-than-normal areas along the east and west coasts. Drier-than-normal conditions dominated the south-central area, with wetter-than-normal conditions to the north, west, and east, at longer time scales (last 2, 3, 6, 7, 10 months). Soils were dry in the south central region to southwest coast, and streamflow was mostly near normal except for some low streams in the west. As seen on the July 31st USDM map, abnormal dryness was limited to the south central areas and shrank to about a fourth (22.4 percent) of the island.
CONUS State Precipitation Ranks:

|

|
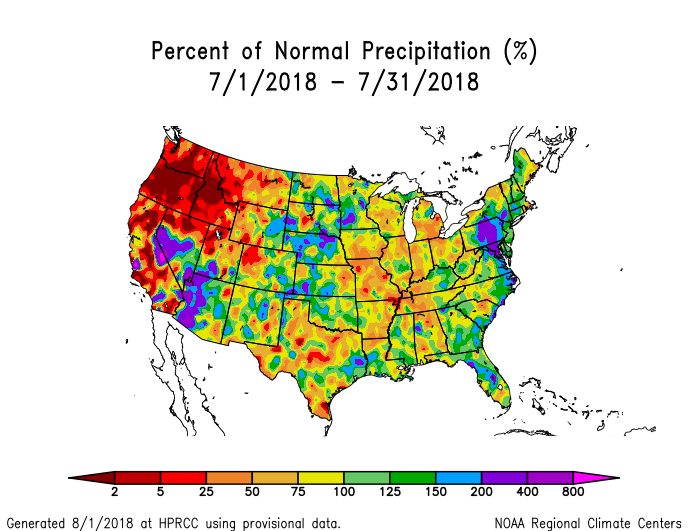
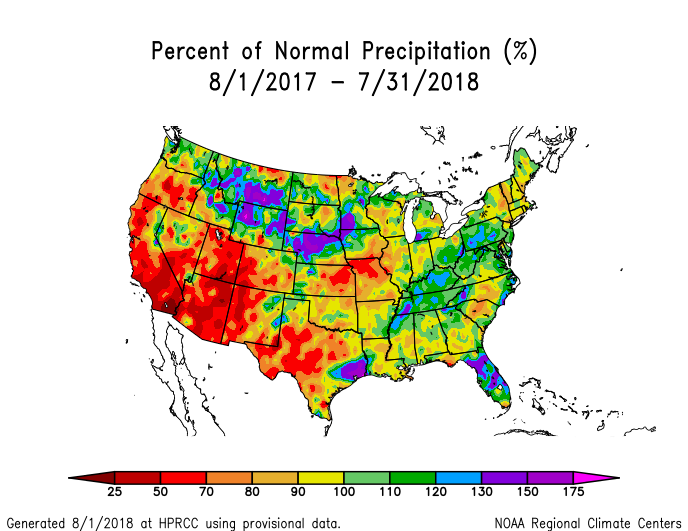
July 2018 was drier than normal across much of the West and from the southern Plains to Great Lakes, with locally record dry conditions in the West. On a statewide basis, 13 states ranked in the driest third of the 124-year historical record, with Idaho ranking in the top ten driest category at sixth driest.
|

|
May-July 2018 was drier than normal across much of the West, the southern Great Plains to Great Lakes, and much of the Northeast, with locally record dry conditions in the West. On a statewide basis, 13 states ranked in the driest third of the 124-year historical record, with Washington ranking sixth driest and Louisiana twelfth driest. The last five May-July periods were dry in Washington state.

|

|
The last six months (February-July) and year to date (January-July) were drier than normal in much of the West, from the southern Plains to Mid-Mississippi Valley, and parts of the northern Plains and Northeast. On a statewide basis, five states ranked in the driest third of the 124-year historical record for February-July and seven states ranked in the driest third of the historical record for January-July. Colorado had the twelfth driest January-July.

|
|
A similar pattern of dryness was seen for the last 12 months except it also included parts of the Southeast. The dry conditions were especially pronounced across the Southwest, Texas, and northeast Kansas to northwest Missouri. On a statewide basis, nine states ranked in the driest third of the 124-year historical record. Three states in the Southwest ranked in the top ten driest category, including Arizona (fourth driest), Utah (fifth driest), and Colorado (tenth driest). If not for small areas of above-normal precipitation falling in parts of the states, Kansas, Missouri, California, Nevada, New Mexico, and Texas could have reached the top ten driest category. Arizona has been drier than average for most of the last 20 years.
 Primary Corn and Soybean Belt precipitation, July, 1895-2018.
|
 Primary Corn and Soybean Belt precipitation, March-July, 1895-2018.
|
For the Primary Corn and Soybean agricultural belt during July 2018, temperatures were mostly near to cooler than normal and precipitation wetter than normal in the western regions and near to drier than normal elsewhere. The month ranked as the 56th warmest and 46th driest July, regionwide, in the 1895-2018 record.
March is the beginning of the growing season for the Primary Corn and Soybean agricultural belt. March-July 2018 ranked as the 60th driest and 43rd warmest March-July, regionwide, in the 1895-2018 record. March-July included some cold months mixed in with warm months. The last three months had some unusual warmth, not only for the region but nationwide. May-July 2018 ranked as the 48th wettest and fourth warmest such 3-month period on record for the Primary Corn and Soybean agricultural belt.
The prolonged below-normal precipitation has dried soils and inhibited crop growth in many states in the Plains and Southwest (as detailed earlier). According to July 30th statistics from the USDA, 39 percent of the topsoil and 39 percent of the subsoil was rated short or very short of moisture (dry or very dry) nationwide, 29 percent of the pasture and rangeland was rated in poor to very poor condition, and (only) nine percent of the corn crop was rated in poor to very poor condition. As of July 31st, drought was affecting eleven percent of corn production, 15 percent of soybean production, 29 percent of hay acreage, 28 percent of cattle inventory, 30 percent of winter wheat production, and four percent of spring wheat production. These are all higher than the statistics from a month ago.
NOAA Regional Climate Centers:
A more detailed drought discussion, provided by the NOAA Regional Climate Centers and others, can be found below.
As summarized by the High Plains Regional Climate Center, temperature and precipitation patterns varied across the High Plains in July, and the presence of extremes was no exception this month. Much of the region experienced relief from the heat, particularly in the eastern High Plains where temperatures were slightly below normal. In fact, the second half of July brought fall-like temperatures to areas of the Dakotas, Nebraska, and Kansas. However, the extreme heat continued in the western High Plains, providing no relief to drought-stricken areas of Colorado and southern Wyoming. Heavy rains provided drought relief to southwestern Kansas and portions of the Dakotas, but it also caused flooding in locations such as Brookings, South Dakota. Meanwhile, eastern Kansas, western Colorado, and southern Wyoming missed out on the rains, and drought impacts continued to mount. Streamflows were indicative of heavy rainfall or the lack thereof throughout the region, with high flows in portions of South Dakota and Nebraska, and low flows in areas of Colorado, Wyoming, and Kansas.
Several improvements and degradations in drought conditions occurred during the past month across the High Plains, according to the USDM. Overall, the area experiencing drought or abnormally dry conditions (D0-D4) decreased from 45 percent to 38 percent in the region. Conditions continued to improve in many areas of the Dakotas. Near normal to slightly below normal temperatures and pockets of heavy rainfall allowed for the removal of severe drought (D2) in both states, as well as a reduction in moderate drought (D1) and abnormally dry conditions (D0). Areas of southwestern Kansas and southeastern Colorado received some relief as well, resulting in a one-category reduction in drought severity in southeastern Colorado and the removal of drought in southwestern Kansas. Areas in drought that missed out on beneficial precipitation saw a deterioration of conditions. While temperatures were mostly normal to slightly below normal in the region for the month, it was quite warm across southern Wyoming and western Colorado, with departures of 3.0-5.0 degrees F (1.7-2.8 degrees C) above normal. Combined with persistent dryness, drought spread and intensified across this region. In western Colorado, wildfires continued to burn, and the recreation and tourism industry experienced revenue loss. Conditions also worsened in eastern Kansas where it was warmer and drier than normal. The Governor of Kansas expanded the number of counties in a drought emergency to 50, and 43 counties were authorized for emergency haying and grazing of Conservation Reserve Program lands.
July marked the approximate halfway point through the growing season and, for the most part, crops were faring well. Kansas was the exception where nearly one-quarter of the corn and soybean crops were in poor to very poor condition, according to the July 31st USDA's Weekly Weather and Crop Bulletin. Corn progress was well ahead of schedule due to the heat experienced during the late spring and early summer, and it is expected to mature early across much of the region this year. The winter wheat harvest was nearly wrapped up in Colorado and Kansas, and production was negatively impacted by a combination of drought and hailstorms. Pastureland was suffering in the two states, with 46 percent of pastureland in Colorado and 35 percent of pastureland in Kansas in poor to very poor condition. Throughout the course of the month, topsoil moisture declined in all High Plains states except Colorado. However, it was still faring worst in Colorado, with 35 percent of the state's topsoil moisture rated poor to very poor.
As explained by the Southern Regional Climate Center, temperatures and precipitation for the month of July varied spatially throughout the Southern region. Parts of western, southern, and central Texas received 5 percent or less of normal precipitation. Northern, northeastern, southern, western, and central Texas, northern and eastern Louisiana, northeastern, eastern, and southern Arkansas, northwestern, western, and southern Tennessee, and areas in northern and southwestern Mississippi received 50 percent or less of normal precipitation. In contrast, parts of western, southwestern, southern, and eastern Texas, western, northern, and southeastern Oklahoma, western, southern, and extreme southeastern Louisiana, western Arkansas, northwestern and southern Mississippi, and an area in southeastern Tennessee received 150 percent or more of normal precipitation. At the end of July and into August, extreme drought classifications were still present in southwestern, extreme northwestern, and southeastern Oklahoma, southwestern, northern, central, and eastern Texas, and northwestern Louisiana. Severe drought classifications were present throughout parts of northern, central, southwestern, and northeastern Texas, southwestern, southeastern, northwestern, and northeastern Oklahoma, southwestern Arkansas, and northwestern Louisiana. Moderate drought classification was present throughout parts of central, southern, and eastern Texas, western, southern, and northeastern Oklahoma, most of Arkansas, eastern and northwestern Louisiana, northwestern Tennessee, and a part of southwestern Mississippi.
As described by the Midwest Regional Climate Center, precipitation was below normal in July across most of the Midwest, and a hot first half of July and cooler second half led to slightly warmer-than-normal temperatures across the region. Regionwide, 3.24 inches (82 mm) fell, which was 80 percent of normal and ranked 36th driest on record (1895-2018). Minnesota (106 percent of normal) was the only state in the region with above normal precipitation. Every other state except Kentucky (93 percent of normal) and Missouri (57 percent of normal) had between 70 and 80 percent of normal precipitation.
Regionwide, abnormally dry conditions and drought more than doubled in July. Drought significantly worsened in Missouri during the month. On the July 3 USDM, 17 percent of Missouri was in Severe Drought. By the July 31 USDM, more than 32 percent of the state was in Severe Drought, with more than 17 percent in Extreme Drought. Agriculture was severely impacted, as cattle were being sold due to lack of feed, while crops were being abandoned. Meanwhile, flash drought rapidly developed in Michigan. Less than ten percent of the state was considered abnormally dry at the beginning of the month. By the end of the month, more than a quarter of the state in moderate drought with nearly 70 percent of the state abnormally dry.
As noted by the Southeast Regional Climate Center, precipitation was highly variable across the Southeast region during July, which is common during the summer. Monthly precipitation totals were 50 to 25 percent of normal across local areas of Alabama, portions of Georgia, and the central and western portions of Virginia and the Carolinas. In contrast, the wettest locations were found across portions of eastern Virginia, coastal areas of the Carolinas, north central Florida and local areas across the reminder of the region, where monthly precipitation totals were 150 to more than 300 percent of normal. Temperatures during July were near average (i.e. within 2 degree F [1.1 degrees C]) across most of the Southeast region, including Puerto Rico and the U.S. Virgin Islands. Drought conditions (D1 and greater) were not observed across the Southeast region for the second consecutive month, though small pockets of abnormal dryness (D0) persisted across the interior Carolinas. In addition, a swath of abnormally dry conditions remained across southern Puerto Rico during the month.
As explained by the Northeast Regional Climate Center, precipitation varied greatly throughout the region during the month. The Northeast received 5.44 inches (138.2 mm) of precipitation on average, which made this the 11th wettest July on record for the region. Three states experienced a drier-than-normal July, including Maine, Vermont, and Rhode Island. The average temperature for the Northeast for the month was 71.7 degrees F (22.1 degrees C), ranking this as the 14th warmest July on record for the region, with a departure of 2.1 degrees F (1.2 degrees C) above normal.
At the beginning of the month, 25 percent of the Northeast was abnormally dry, which included central New York and New England. Moderate drought was impacting six percent of the region in southern Vermont, New Hampshire, and Maine. By the middle of July, 12 percent of the Northeast was experiencing moderate drought conditions. During that time, 30 percent of the region was abnormally dry, and abnormal dryness spread briefly into southern New Jersey and part of the Mid Atlantic. Compared to the beginning of the month, conditions improved by the end of July, when 18 percent of the entire Northeast was abnormally dry and nine percent of the region was in moderate drought.
As summarized by the Western Regional Climate Center, above-normal temperatures were observed across much of the West this month, with several California and Nevada locations setting significant temperature records, and monsoon activity brought above-normal precipitation to the Southwest, while the Northwest and most of California remained dry, which is typical of July.
Anomalous high pressure over the West this month led to well above-normal temperatures across much of the region, with Fresno, CA, Elko, NV and Reno, NV setting records for all-time hottest calendar month. Many areas typically influenced by the North American Monsoon experienced near to above normal precipitation in July. Western Arizona, the southern portions of Utah and Nevada, and the eastern Sierra Nevada observed well above-normal precipitation. Some improvement in drought conditions was observed in Arizona and New Mexico on the USDM this month due to the monsoon rains. Drought expansion occurred in portions of the Pacific Northwest due to short-term hot and dry conditions combined with dryness during much of the winter and spring seasons. Many large and impactful fires occurred in the West this month. Persistent well above-normal temperatures and dry fuels have made firefighting efforts challenging in some areas. Smoke from the fires has reduced air quality throughout large areas of the West, with notable impacts in central and northern California, western Nevada, and southern Oregon.
Nearly all of Alaska observed warmer than normal temperatures in July, especially the Southeast. Juneau recorded its warmest July and warmest calendar month on record at an average temperature of 61.2 F (16.2 C), 4.3 F (4.3 C) above normal. The Panhandle was also unusually dry; Ketchikan logged its third driest July at 1.21 in (31 mm), 18% of normal. The dry weather extended into the Southeast mainland where Gulkana recorded 0.67 in (17 mm), 37% of normal. Above normal ocean temperatures were present this month in the Bering Sea, related in part to the unprecedented low sea ice during the past winter and spring. Reports have included incidences of dead Pollock washing ashore and unusually high mortality of sea birds and seal pups.
July is typically one of the driest months of the year across much of Hawaii. Most locations observed drier than normal conditions for July. For example, Honolulu reported 0.23 in (6 mm), 45% of normal. However, a few locations recorded above normal precipitation including Kona, on the Big Island, which observed 1.25 in (32 mm) of precipitation, 178% of normal.
Pacific Islands: The NOAA National Weather Service (NWS) offices, the Pacific ENSO Applications Climate Center (PEAC), and partners provided reports on conditions across the Pacific Islands.
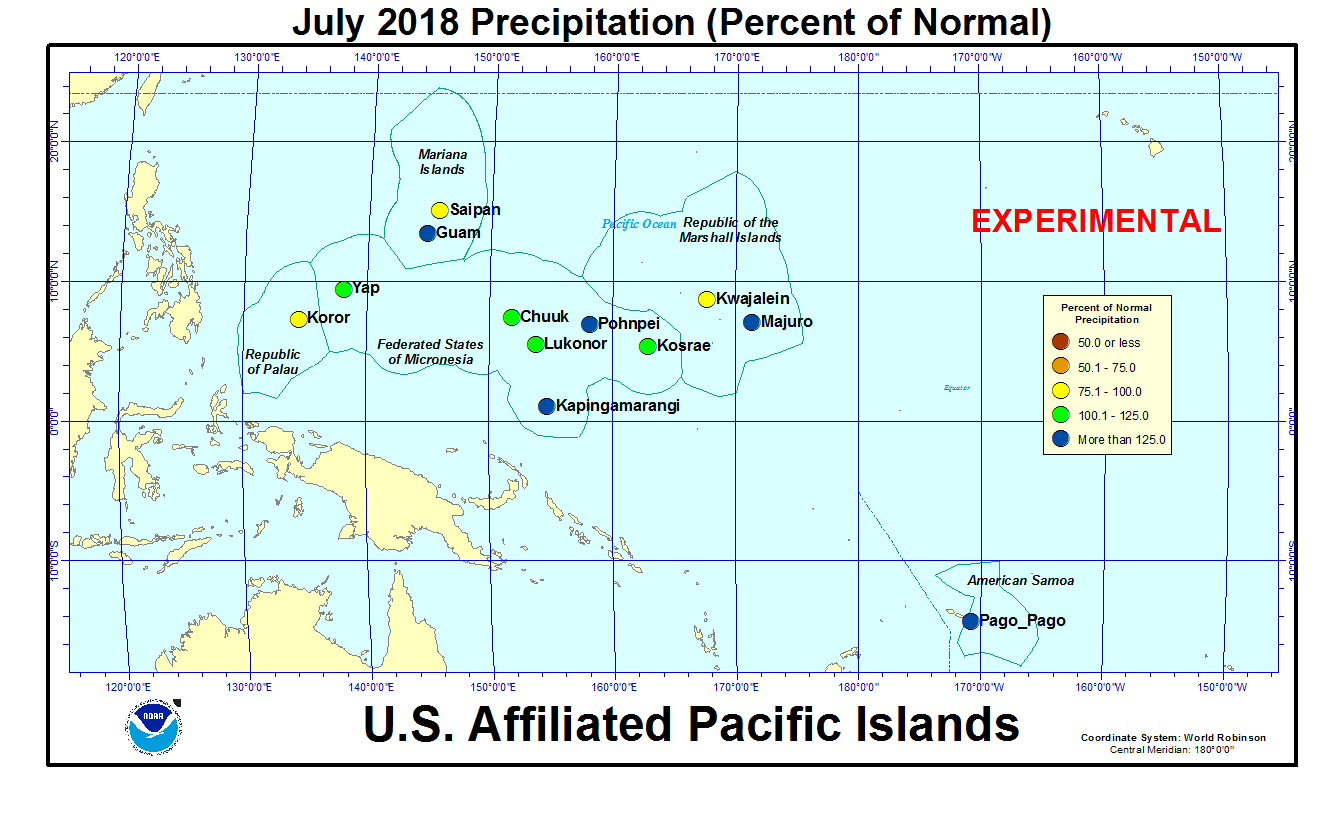
In the U.S. Affiliated Pacific Islands (USAPI) (maps — Federated States of Micronesia [FSM], Northern Mariana Islands, Marshall Islands [RMI], Republic of Palau, American Samoa, basinwide), July 2018 was drier than normal at Koror, Kwajalein, and Saipan, and wetter than normal at Chuuk, Guam, Kapingamarangi, Kosrae, Lukonor, Majuro, Pago Pago, Pohnpei, and Yap.
It was a relatively wet month in terms of drought, with rainfall amounts above the minimum thresholds (4 or 8 inches) required to meet most monthly water needs at all of the regularly-reporting stations. The 4- and 8-inch thresholds are important because, if monthly precipitation falls below the threshold, then water shortages or drought become a concern.
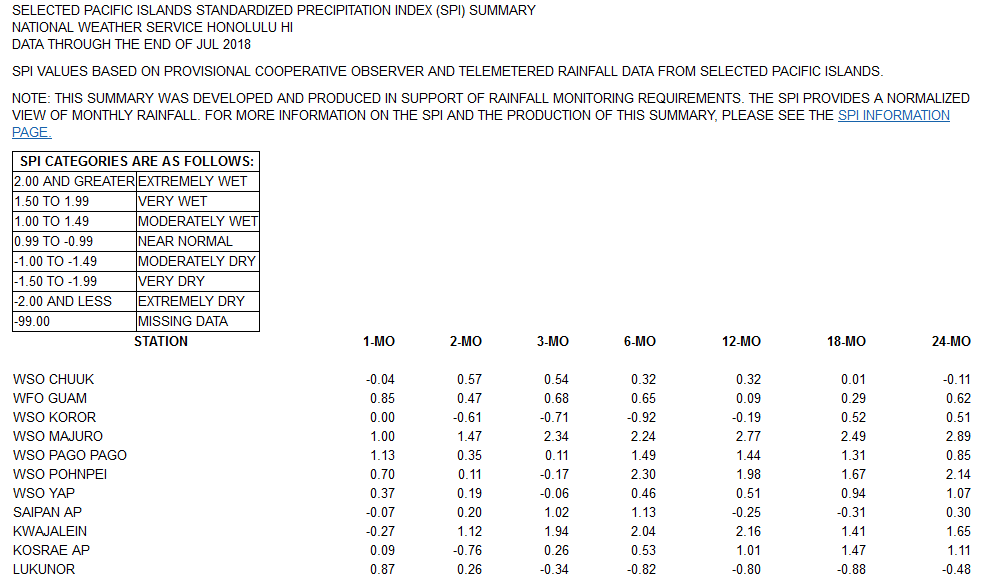
Lukonor had the eighth wettest July in a data record spanning 34 years, but dryness earlier in the year gave the station the sixth driest April-July and seventh driest January-July in 34 years of data. Similarly, Nukuoro had the sixth wettest July in 35 years, but sixth driest May-July and fifth driest March-July in 34 years of data. On the other hand, long-term wet conditions resulted in the wettest August-July on record at Pohnpei (out of 67 years of data), Kwajalein (66 years), Majuro (64 years), and Kapingamarangi (15 years).
As measured by percent of normal precipitation, Koror has been drier than normal in the short term (July and the last 3 months [May-July 2018]) as well as the long term (year to date [January-July] and last 12 months [August 2017-July 2018]). Lukonor was wetter than normal for July but drier than normal for the other three time scales. Kwajalein and Saipan were drier than normal for July but wetter than normal for the other three time scales. Guam was drier than normal for the last 12 months but wetter than normal for the other three time periods. Chuuk, Kapingamarangi, Kosrae, Majuro, Pago Pago, Pohnpei, and Yap were near to wetter than normal for all four time periods.
| Station Name | Aug 2017 | Sep 2017 | Oct 2017 | Nov 2017 | Dec 2017 | Jan 2018 | Feb 2018 | Mar 2018 | Apr 2018 | May 2018 | Jun 2018 | Jul 2018 | Aug- Jul |
|---|---|---|---|---|---|---|---|---|---|---|---|---|---|
| Chuuk | 91% | 110% | 127% | 105% | 120% | 99% | 175% | 131% | 45% | 124% | 143% | 107% | 107% |
| Guam NAS | 66% | 118% | 161% | 57% | 88% | 23% | 90% | 68% | 316% | 240% | 88% | 146% | 94% |
| Kapingamarangi | 41% | 92% | 72% | 64% | 420% | 95% | 222% | 171% | 127% | 92% | 67% | 142% | 118% |
| Koror | 104% | 161% | 118% | 84% | 160% | 82% | 105% | 37% | 113% | 92% | 66% | 87% | 93% |
| Kosrae | 93% | 155% | 143% | 168% | 123% | 100% | 147% | 181% | 105% | 136% | 74% | 106% | 107% |
| Kwajalein | 64% | 205% | 88% | 83% | 71% | 458% | 159% | 662% | 229% | 332% | 227% | 90% | 161% |
| Lukonor | 63% | 84% | 116% | 136% | 70% | 129% | 106% | 84% | 56% | 61% | 67% | 123% | 79% |
| Majuro | 111% | 187% | 143% | 76% | 172% | 204% | 120% | 343% | 189% | 216% | 151% | 142% | 160% |
| Pago Pago | 145% | 96% | 217% | 127% | 94% | 115% | 271% | 60% | 189% | 96% | 61% | 192% | 123% |
| Pohnpei | 55% | 122% | 81% | 95% | 130% | 167% | 219% | 440% | 102% | 85% | 92% | 130% | 132% |
| Saipan | 65% | 84% | 66% | 62% | 60% | 117% | 87% | 49% | 332% | 384% | 161% | 88% | 96% |
| Yap | 55% | 93% | 156% | 106% | 132% | 182% | 163% | 270% | 67% | 94% | 97% | 105% | 109% |
| Station Name | Aug 2017 | Sep 2017 | Oct 2017 | Nov 2017 | Dec 2017 | Jan 2018 | Feb 2018 | Mar 2018 | Apr 2018 | May 2018 | Jun 2018 | Jul 2018 | Aug- Jul |
|---|---|---|---|---|---|---|---|---|---|---|---|---|---|
| Chuuk | 11.65" | 12.92" | 14.64" | 11.15" | 13.52" | 10.01" | 12.70" | 10.86" | 5.60" | 14.01" | 16.67" | 12.77" | 146.5" |
| Guam NAS | 9.73" | 14.92" | 18.47" | 4.23" | 4.49" | 0.94" | 2.72" | 1.40" | 7.99" | 8.15" | 5.42" | 14.84" | 93.3" |
| Kapingamarangi | 3.35" | 9.13" | 5.93" | 5.95" | 41.30" | 8.71" | 20.59" | 19.60" | 17.39" | 11.08" | 9.17" | 20.15" | 172.35" |
| Koror | 13.98" | 18.90" | 14.03" | 9.55" | 17.89" | 8.38" | 9.03" | 2.75" | 8.25" | 10.91" | 11.60" | 16.19" | 141.46" |
| Kosrae | 13.23" | 22.02" | 15.65" | 23.21" | 19.85" | 16.62" | 19.03" | 29.00" | 18.45" | 24.16" | 10.77" | 15.83" | 227.82" |
| Kwajalein | 6.28" | 22.06" | 9.83" | 9.40" | 4.72" | 14.46" | 4.20" | 15.55" | 12.05" | 22.33" | 15.75" | 8.88" | 145.51" |
| Lukonor | 8.88" | 8.51" | 13.10" | 12.38" | 7.90" | 10.83" | 9.50" | 7.76" | 6.28" | 7.14" | 7.83" | 19.66" | 119.77" |
| Majuro | 13.00" | 20.93" | 18.21" | 10.27" | 19.59" | 15.76" | 8.29" | 22.54" | 17.79" | 21.81" | 16.62" | 15.88" | 200.69" |
| Pago Pago | 7.78" | 6.26" | 20.11" | 12.89" | 12.06" | 15.37" | 32.47" | 6.36" | 17.76" | 9.26" | 3.24" | 10.68" | 154.24" |
| Pohnpei | 7.82" | 15.27" | 12.31" | 14.13" | 20.86" | 22.03" | 20.94" | 57.92" | 18.80" | 16.91" | 13.58" | 20.11" | 240.68" |
| Saipan | 8.59" | 8.47" | 7.01" | 3.48" | 2.31" | 2.97" | 2.25" | 0.93" | 8.72" | 9.14" | 5.83" | 7.88" | 67.58" |
| Yap | 8.20" | 12.59" | 18.99" | 9.40" | 11.27" | 11.64" | 8.44" | 12.29" | 3.80" | 7.41" | 11.67" | 15.81" | 131.51" |
| Station Name | Aug 2017 | Sep 2017 | Oct 2017 | Nov 2017 | Dec 2017 | Jan 2018 | Feb 2018 | Mar 2018 | Apr 2018 | May 2018 | Jun 2018 | Jul 2018 | Aug- Jul |
|---|---|---|---|---|---|---|---|---|---|---|---|---|---|
| Chuuk | 12.86" | 11.71" | 11.51" | 10.61" | 11.25" | 10.10" | 7.25" | 8.32" | 12.47" | 11.30" | 11.66" | 11.98" | 136.77" |
| Guam NAS | 14.74" | 12.66" | 11.44" | 7.38" | 5.11" | 4.01" | 3.03" | 2.07" | 2.53" | 3.40" | 6.18" | 10.14" | 99.09" |
| Kapingamarangi | 8.13" | 9.93" | 8.19" | 9.27" | 9.84" | 9.15" | 9.27" | 11.43" | 13.64" | 12.08" | 13.78" | 14.15" | 145.85" |
| Koror | 13.50" | 11.77" | 11.84" | 11.39" | 11.16" | 10.18" | 8.56" | 7.44" | 7.32" | 11.83" | 17.48" | 18.53" | 152.90" |
| Kosrae | 14.22" | 14.22" | 10.94" | 13.83" | 16.11" | 16.67" | 12.93" | 16.06" | 17.51" | 17.75" | 14.64" | 14.91" | 213.87" |
| Kwajalein | 9.74" | 10.74" | 11.18" | 11.28" | 6.66" | 3.16" | 2.64" | 2.35" | 5.26" | 6.72" | 6.93" | 9.87" | 90.41" |
| Lukonor | 14.04" | 10.15" | 11.32" | 9.08" | 11.27" | 8.41" | 8.93" | 9.26" | 11.31" | 11.69" | 11.65" | 15.93" | 151.36" |
| Majuro | 11.69" | 11.17" | 12.73" | 13.44" | 11.39" | 7.74" | 6.88" | 6.58" | 9.42" | 10.11" | 11.01" | 11.17" | 125.25" |
| Pago Pago | 5.38" | 6.53" | 9.26" | 10.14" | 12.84" | 13.34" | 12.00" | 10.68" | 9.39" | 9.66" | 5.33" | 5.55" | 125.57" |
| Pohnpei | 14.26" | 12.55" | 15.27" | 14.83" | 16.08" | 13.18" | 9.55" | 13.17" | 18.41" | 19.96" | 14.81" | 15.43" | 182.36" |
| Saipan | 13.13" | 10.09" | 10.62" | 5.61" | 3.85" | 2.53" | 2.59" | 1.89" | 2.63" | 2.38" | 3.62" | 8.91" | 70.25" |
| Yap | 14.82" | 13.50" | 12.18" | 8.83" | 8.51" | 6.39" | 5.19" | 4.56" | 5.63" | 7.85" | 12.04" | 15.08" | 120.31" |
The following analysis of historical data for the USAPI stations in the Global Historical Climatology Network-Daily (GHCN-D) dataset, augmented with fill-in data from the 1981-2010 Normals, helps put the current data into historical perspective by computing ranks based on the period of record. The table below lists the precipitation ranks for July 2018, January-July 2018 (year to date), and August 2017-July 2018 (the last 12 months). Some stations have a long period of record and their dataset is fairly complete, while other stations have a shorter period of record and the dataset has some missing data.
Rank of 1 = driest.
| Station | Jul 2018 Rank |
Jul No. of Years |
Jan- Jul 2018 Rank |
Jan- Jul No. of Years |
Aug 2017- Jul 2018 Rank |
Aug- Jul No. of Years |
Period of Record |
| Jaluit | 12 | 35 | MSG | 35 | MSG | 33 | 1981-2018 |
| Koror | 32 | 68 | 14 | 67 | 24 | 67 | 1951-2018 |
| Woleai | 30 | 37 | 26 | 28 | 10 | 24 | 1968-2018 |
| Yap | 45 | 68 | 49 | 67 | 46 | 67 | 1951-2018 |
| Majuro | 55 | 65 | 64 | 64 | 64 | 64 | 1954-2018 |
| Mili | MSG | 33 | MSG | 33 | MSG | 31 | 1981-2018 |
| Ulithi | 23 | 36 | 19 | 34 | 23 | 33 | 1981-2018 |
| Ailinglapalap | 20 | 34 | 21 | 34 | 10 | 31 | 1981-2018 |
| Kosrae | 28 | 50 | 25 | 38 | 22 | 31 | 1954-2018 |
| Lukonor | 27 | 34 | 7 | 34 | 5 | 21 | 1981-2018 |
| Saipan | 18 | 38 | 37 | 37 | 11 | 29 | 1981-2018 |
| Pohnpei | 52 | 68 | 67 | 67 | 67 | 67 | 1951-2018 |
| Kwajalein | 25 | 67 | 66 | 66 | 66 | 66 | 1952-2018 |
| Kapingamarangi | 27 | 29 | 19 | 21 | 15 | 15 | 1962-2018 |
| Chuuk | 34 | 68 | 41 | 67 | 40 | 67 | 1951-2018 |
| Guam | 50 | 62 | 35 | 61 | 24 | 61 | 1957-2018 |
| Nukuoro | 30 | 35 | 11 | 34 | 22 | 33 | 1981-2018 |
| Pago Pago | 49 | 53 | 51 | 52 | 49 | 52 | 1966-2018 |
| Wotje | MSG | 34 | MSG | 34 | MSG | 31 | 1981-2018 |
| Utirik | 15 | 15 | 7 | 7 | 3 | 3 | 1985-2018 |


[top]
State/Regional/National Moisture Status
A detailed review of drought and moisture conditions is available for all contiguous U.S. states, the nine standard regions, and the nation (contiguous U.S.):
| northeast u. s. | east north central u. s. | central u. s. |
| southeast u. s. | west north central u. s. | south u. s. |
| southwest u. s. | northwest u. s. | west u. s. |
| Contiguous United States |
[top]
Contacts & Questions