|
Contents Of This Report: |
|
Please note that the values presented in this report are based on preliminary data. They will change when the final data are processed, but will not be replaced on these pages.
National Drought Overview
|
|
[top]
Detailed Drought Discussion
Overview
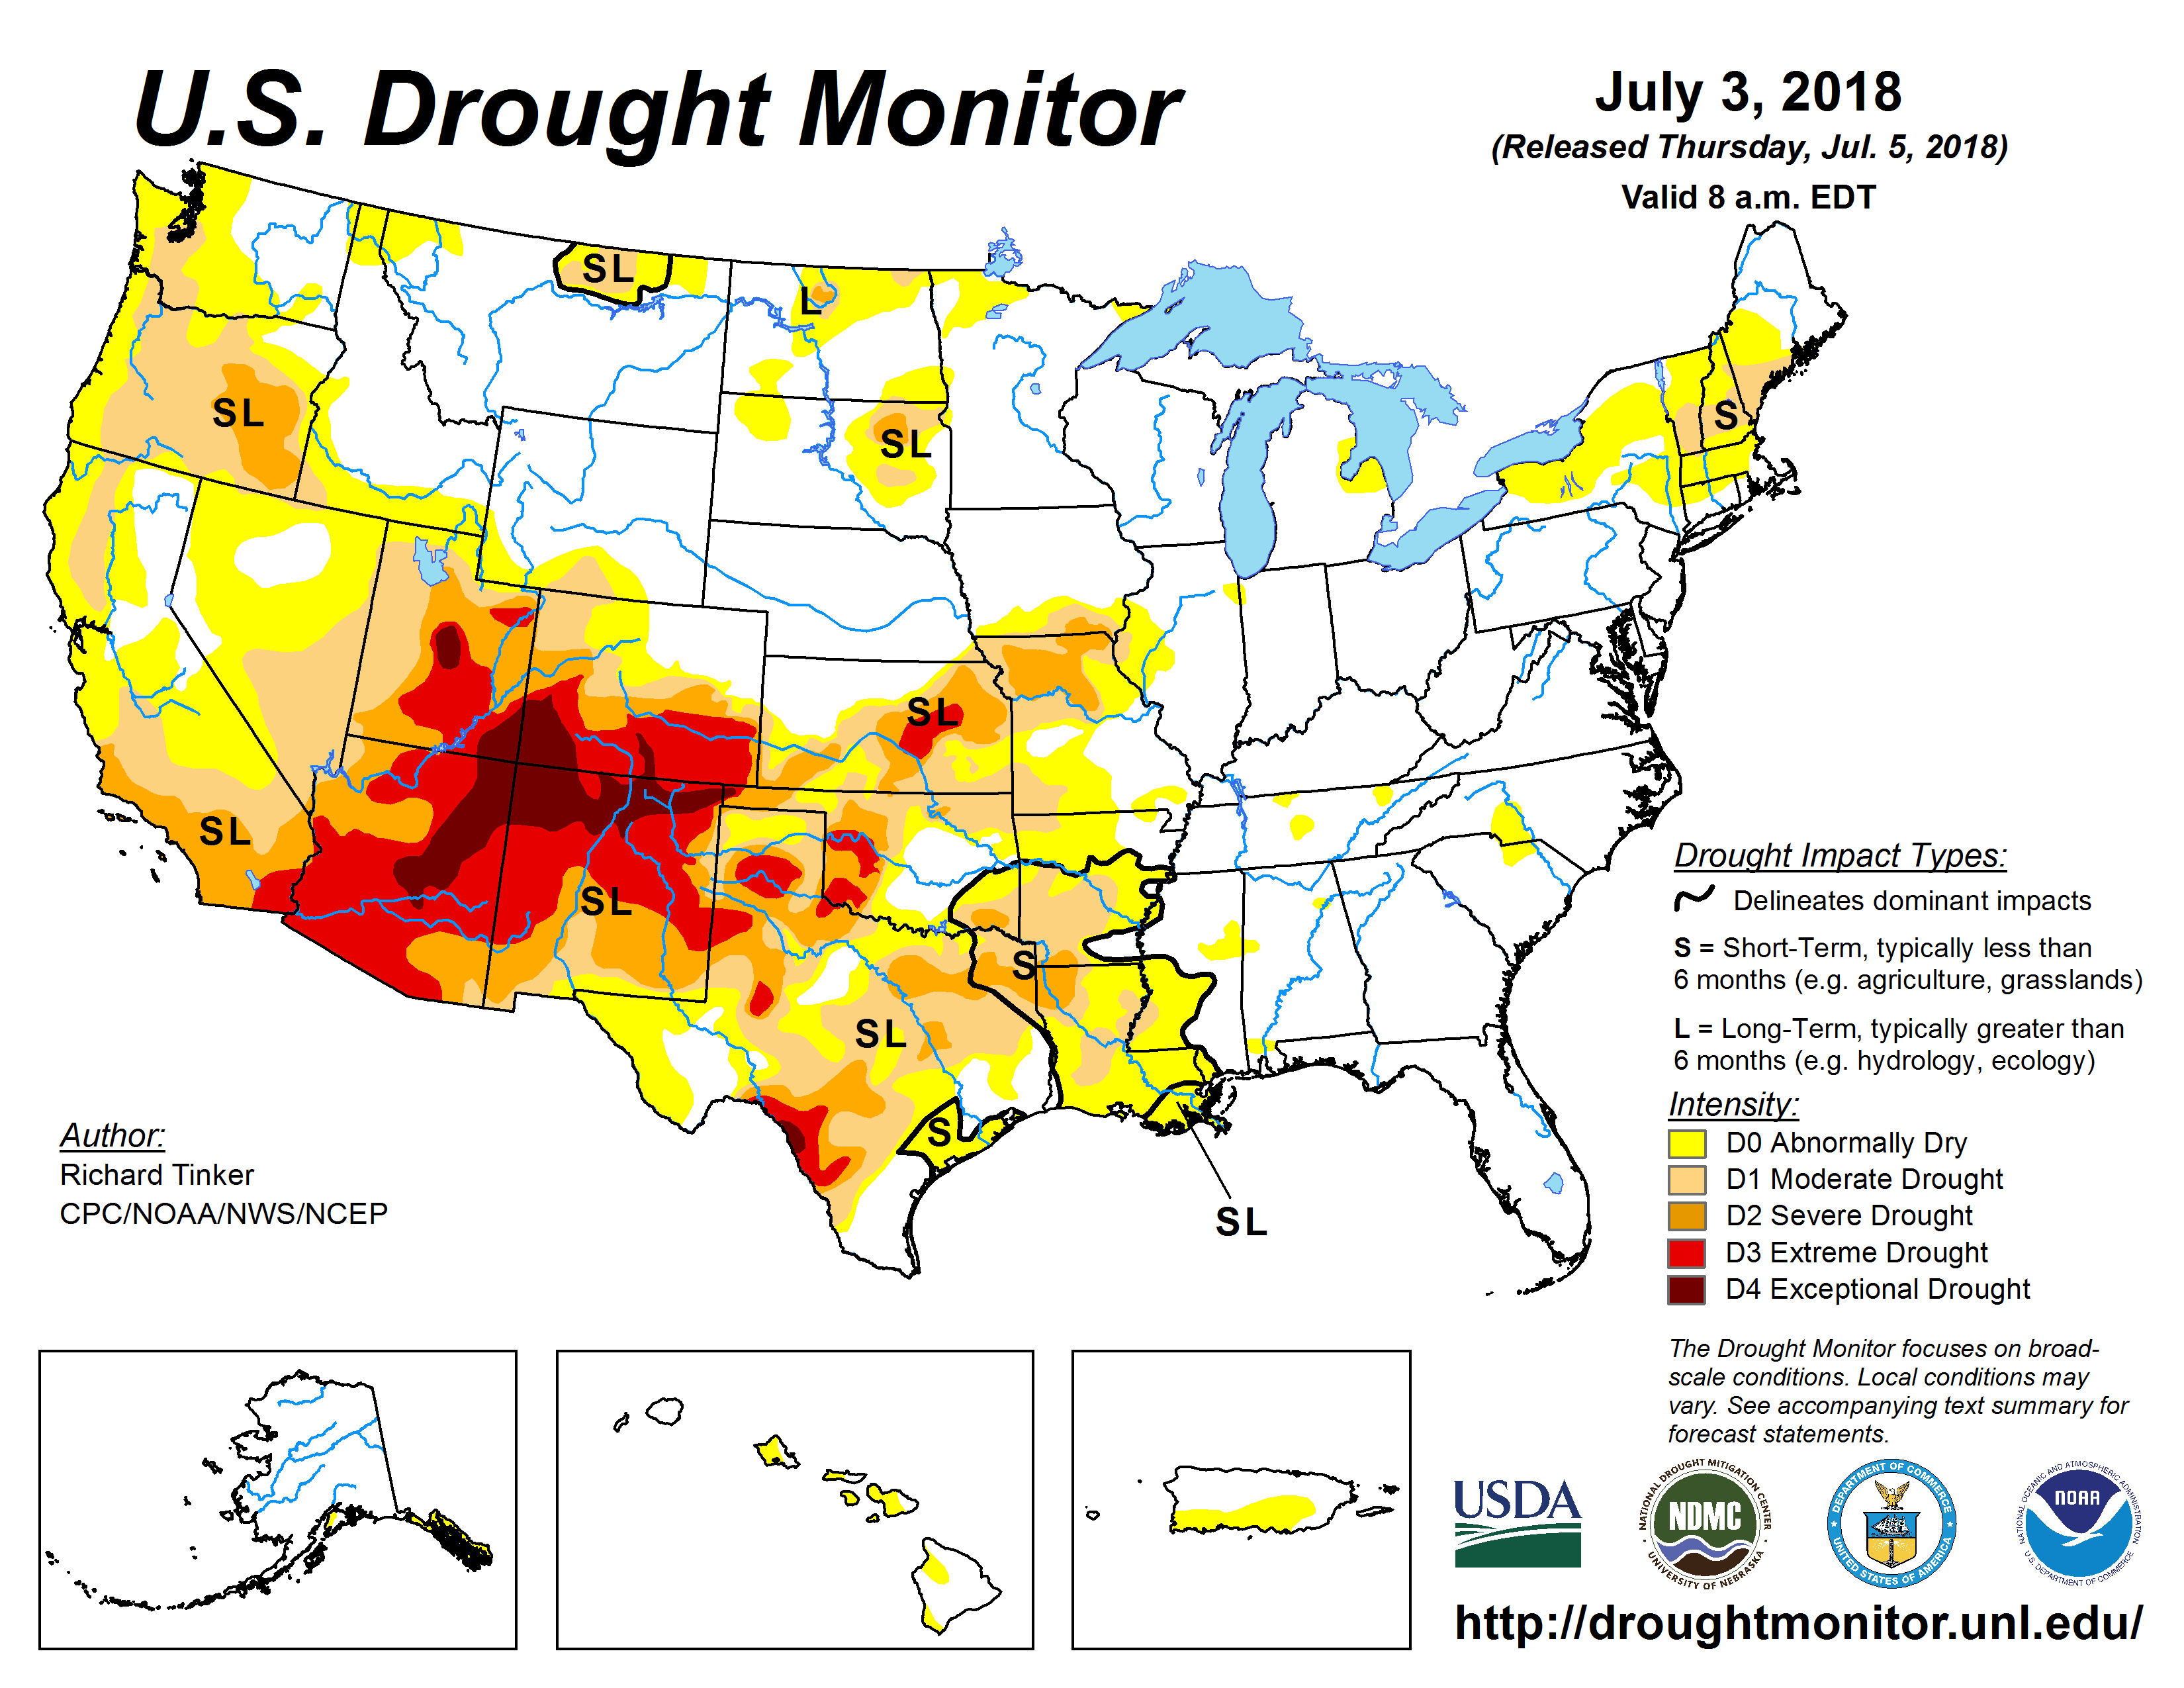
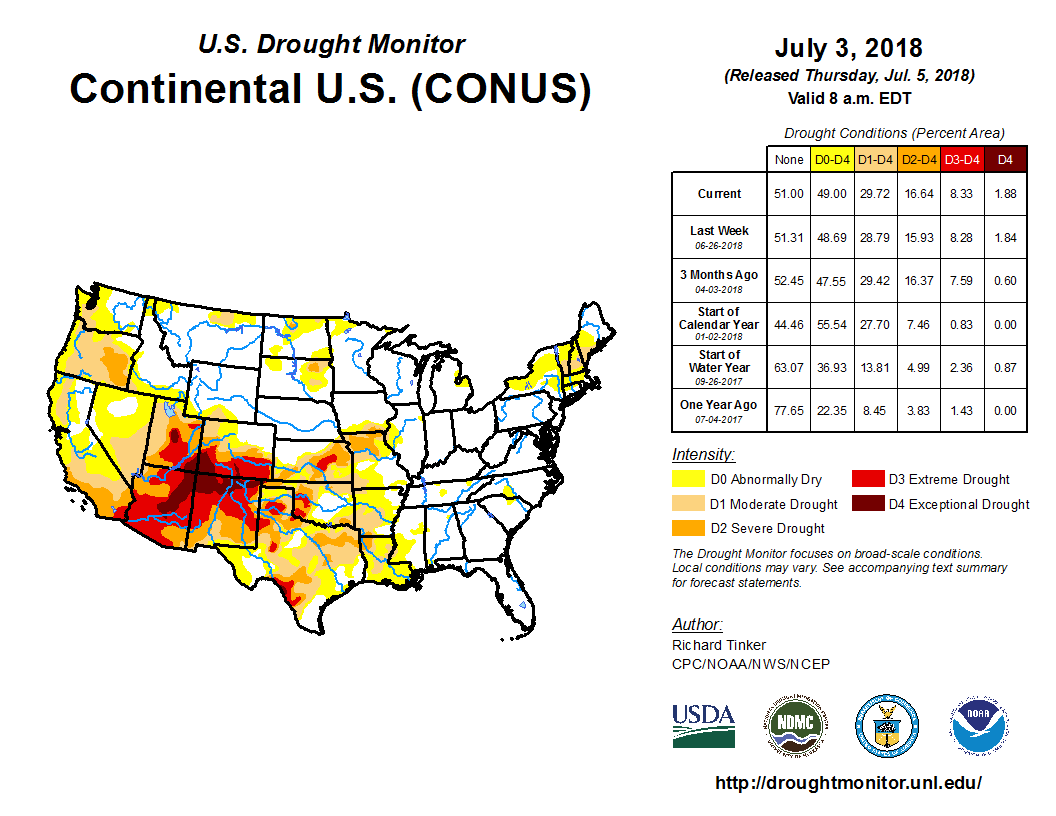
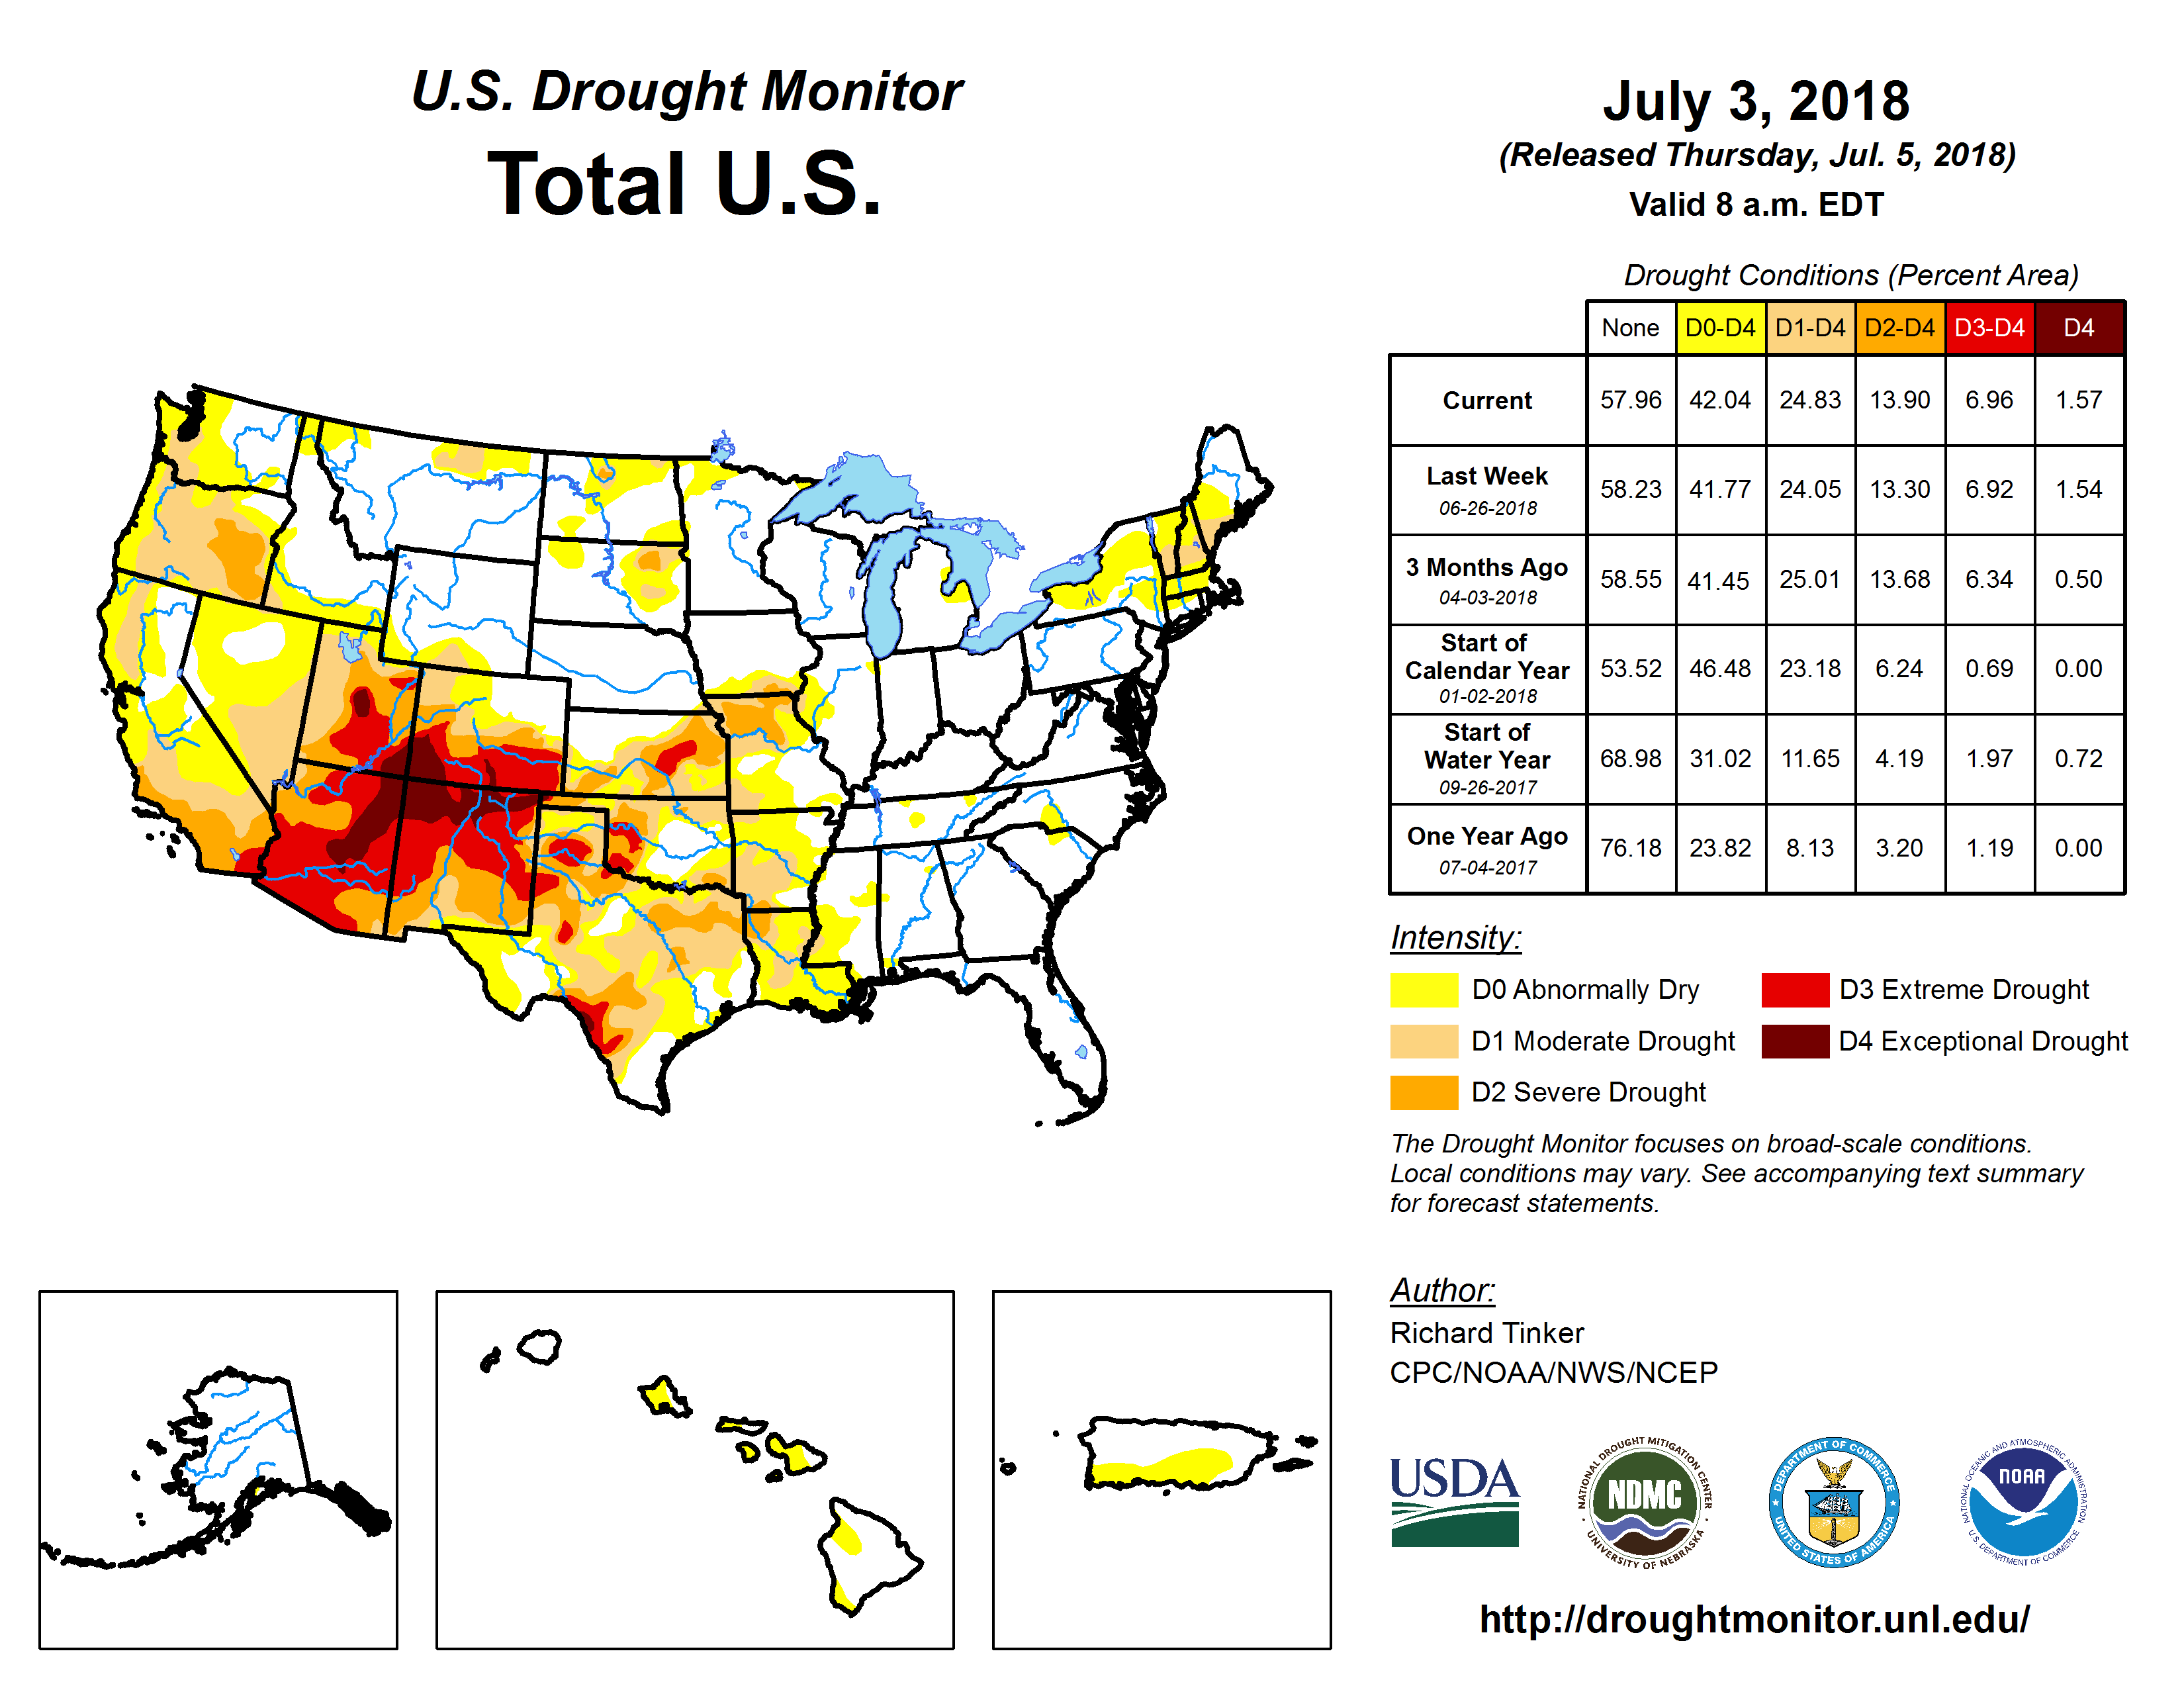
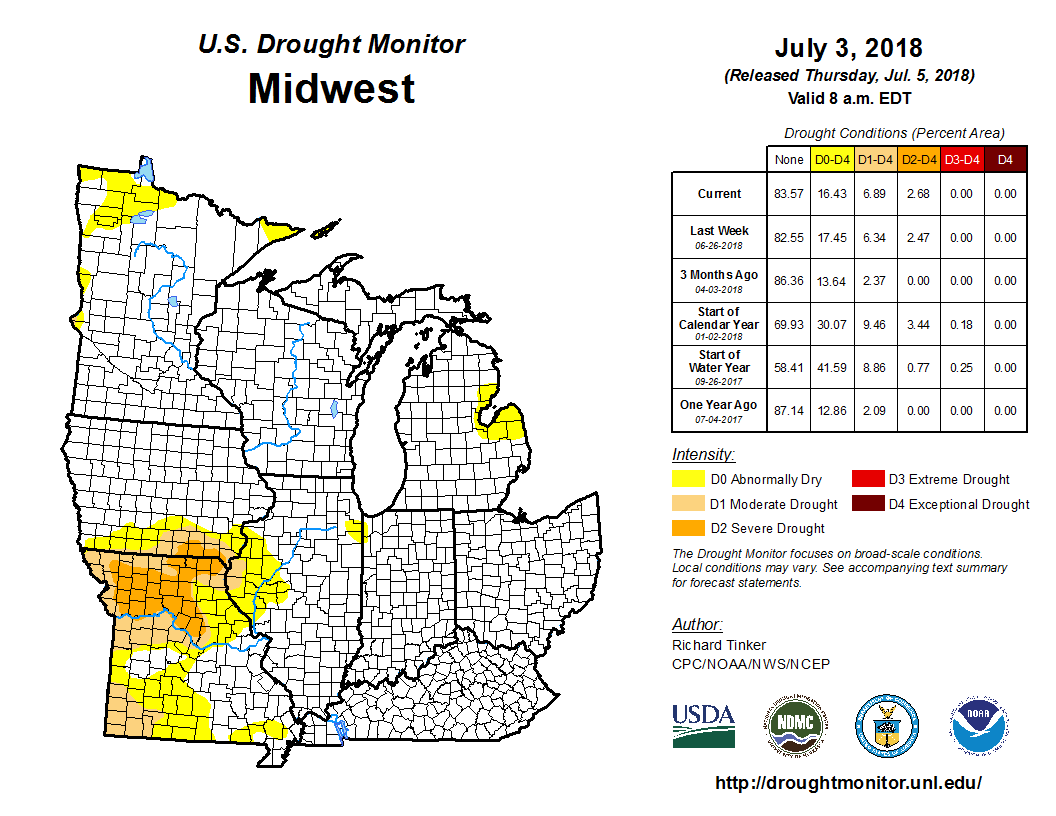
The U.S. Drought Monitor drought map valid July 3, 2018.
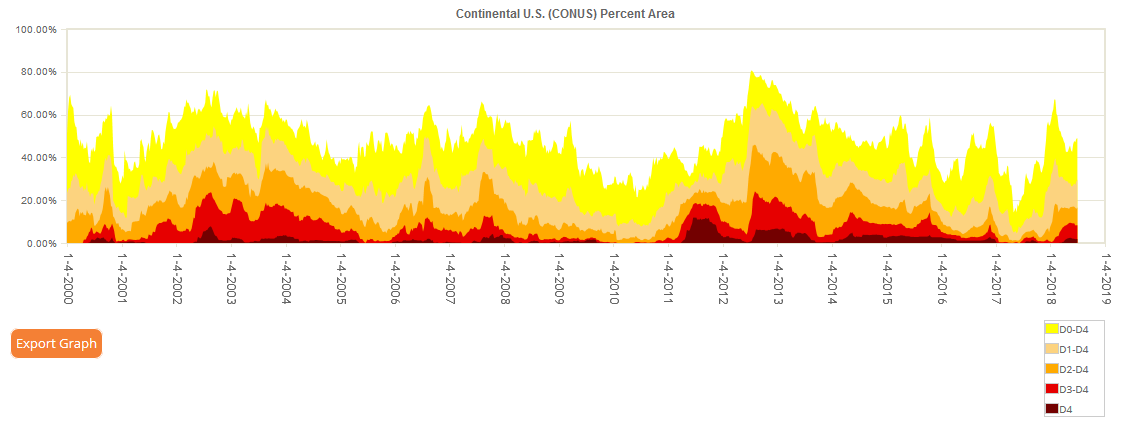
Like the last several months, the upper-level circulation pattern was quite active during June 2018 with ridge and trough patterns migrating through the jet stream flow over the CONUS. This activity occurred within a broadscale/long-wave ridge which dominated the overarching circulation over the CONUS. The ridge kept temperatures much warmer-than-normal across most of the country, with the excessive warmth increasing evapotranspiration in many places. Left to itself, the ridge would have given much of the CONUS a drier-than-normal month, but the frequent passage of the upper-level troughs and lows, in addition to moisture from the remnants of Hurricane Bud (over the Southwest) and a slow-moving low pressure system (over coastal Texas) at mid-month, gave several areas above-normal precipitation. The wet areas included parts of the Southwest, northern Rockies to Mid-Atlantic region, and coastal Texas. But the weather systems missed much of the West, southern Plains to Mid and Lower Mississippi Valley, and parts of the Great Lakes, Northeast, and Southeast. The dry conditions during June were a continuation of persistent dryness since October in the southern High Plains to Mid-Mississippi Valley, and for much of the last 12 to 24 months in the Four Corners States (Standardized Precipitation Index maps for the last 1, 2, 3, 6, 9, 12, 24 months). Drought and abnormal dryness expanded or intensified where the dry conditions continued, especially in the Far West, central Rockies, southern Plains to Lower and Mid-Mississippi Valley, Northeast, and in parts of Puerto Rico and Hawaii. Drought and abnormal dryness contracted in other parts of the Plains and parts of the Midwest. Expansion outweighed contraction this month, so the USDM-based national moderate-to-exceptional drought footprint across the CONUS expanded from 26.4 percent of the CONUS at the end of May to 29.7 percent of the CONUS at the end of June (from 22.1 percent to 24.8 percent for all of the U.S.). According to the Palmer Drought Index, which goes back to the beginning of the 20th century, about 34.7 percent of the CONUS was in moderate to extreme drought at the end of June, increasing about 2.5 percent from the 32.2 percent at the end of May.
Drought conditions at the end of the month, as depicted on the July 3rd, 2018 USDM map, included the following core drought and abnormally dry areas:
-
A large area of abnormal dryness (D0) to moderate (D1) drought stretched from Oregon, Washington, and California in the West, across the southern and central Great Plains, to the Lower to Mid-Mississippi Valley, with severe (D2) drought in eastern Oregon, severe to exceptional (D4) drought across the Four Corners States to Texas, Oklahoma, Kansas, and Missouri. —
- The percent area of the West (from the Rockies to the West Coast) in moderate to extreme drought (based on the Palmer Drought Index) rapidly increased in December and continued to increase in January and February, growing from 21.5 percent at the end of October to 62.4 percent of the West at the end of February. Above-normal precipitation improved conditions in California and Nevada in March, so the Palmer percent area in drought shrank to 50.2 percent by the end of March. April was wet in northern California and northwest Nevada, and Washington to the northern Rockies, and May was wet in Nevada to southern California, but extremely dry conditions occurred along the coast in May, especially in Oregon and Washington, California to Colorado were dry in June, and the last three months were quite dry in the Four Corners States. The dry conditions were coupled with unusual May and June warmth which increased evapotranspiration, thus exacerbating drought conditions, especially in the Southwest. As a result, the Palmer Drought Index measure of drought area expanded to 59.6 percent of the West by the end of June.
- The D3-D4 areas are regions which have experienced the most severe precipitation deficits over the last several months to two years based on the Standardized Precipitation Index (maps for the last 1, 2, 3, 6, 9, 12, and 24 months).
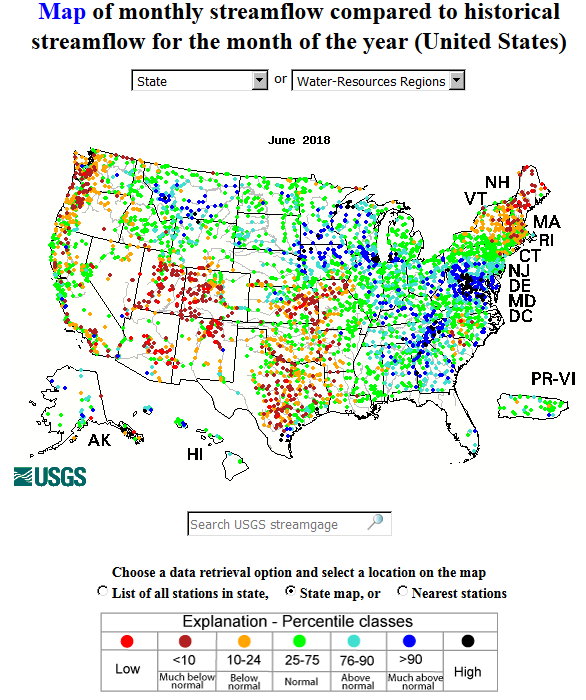
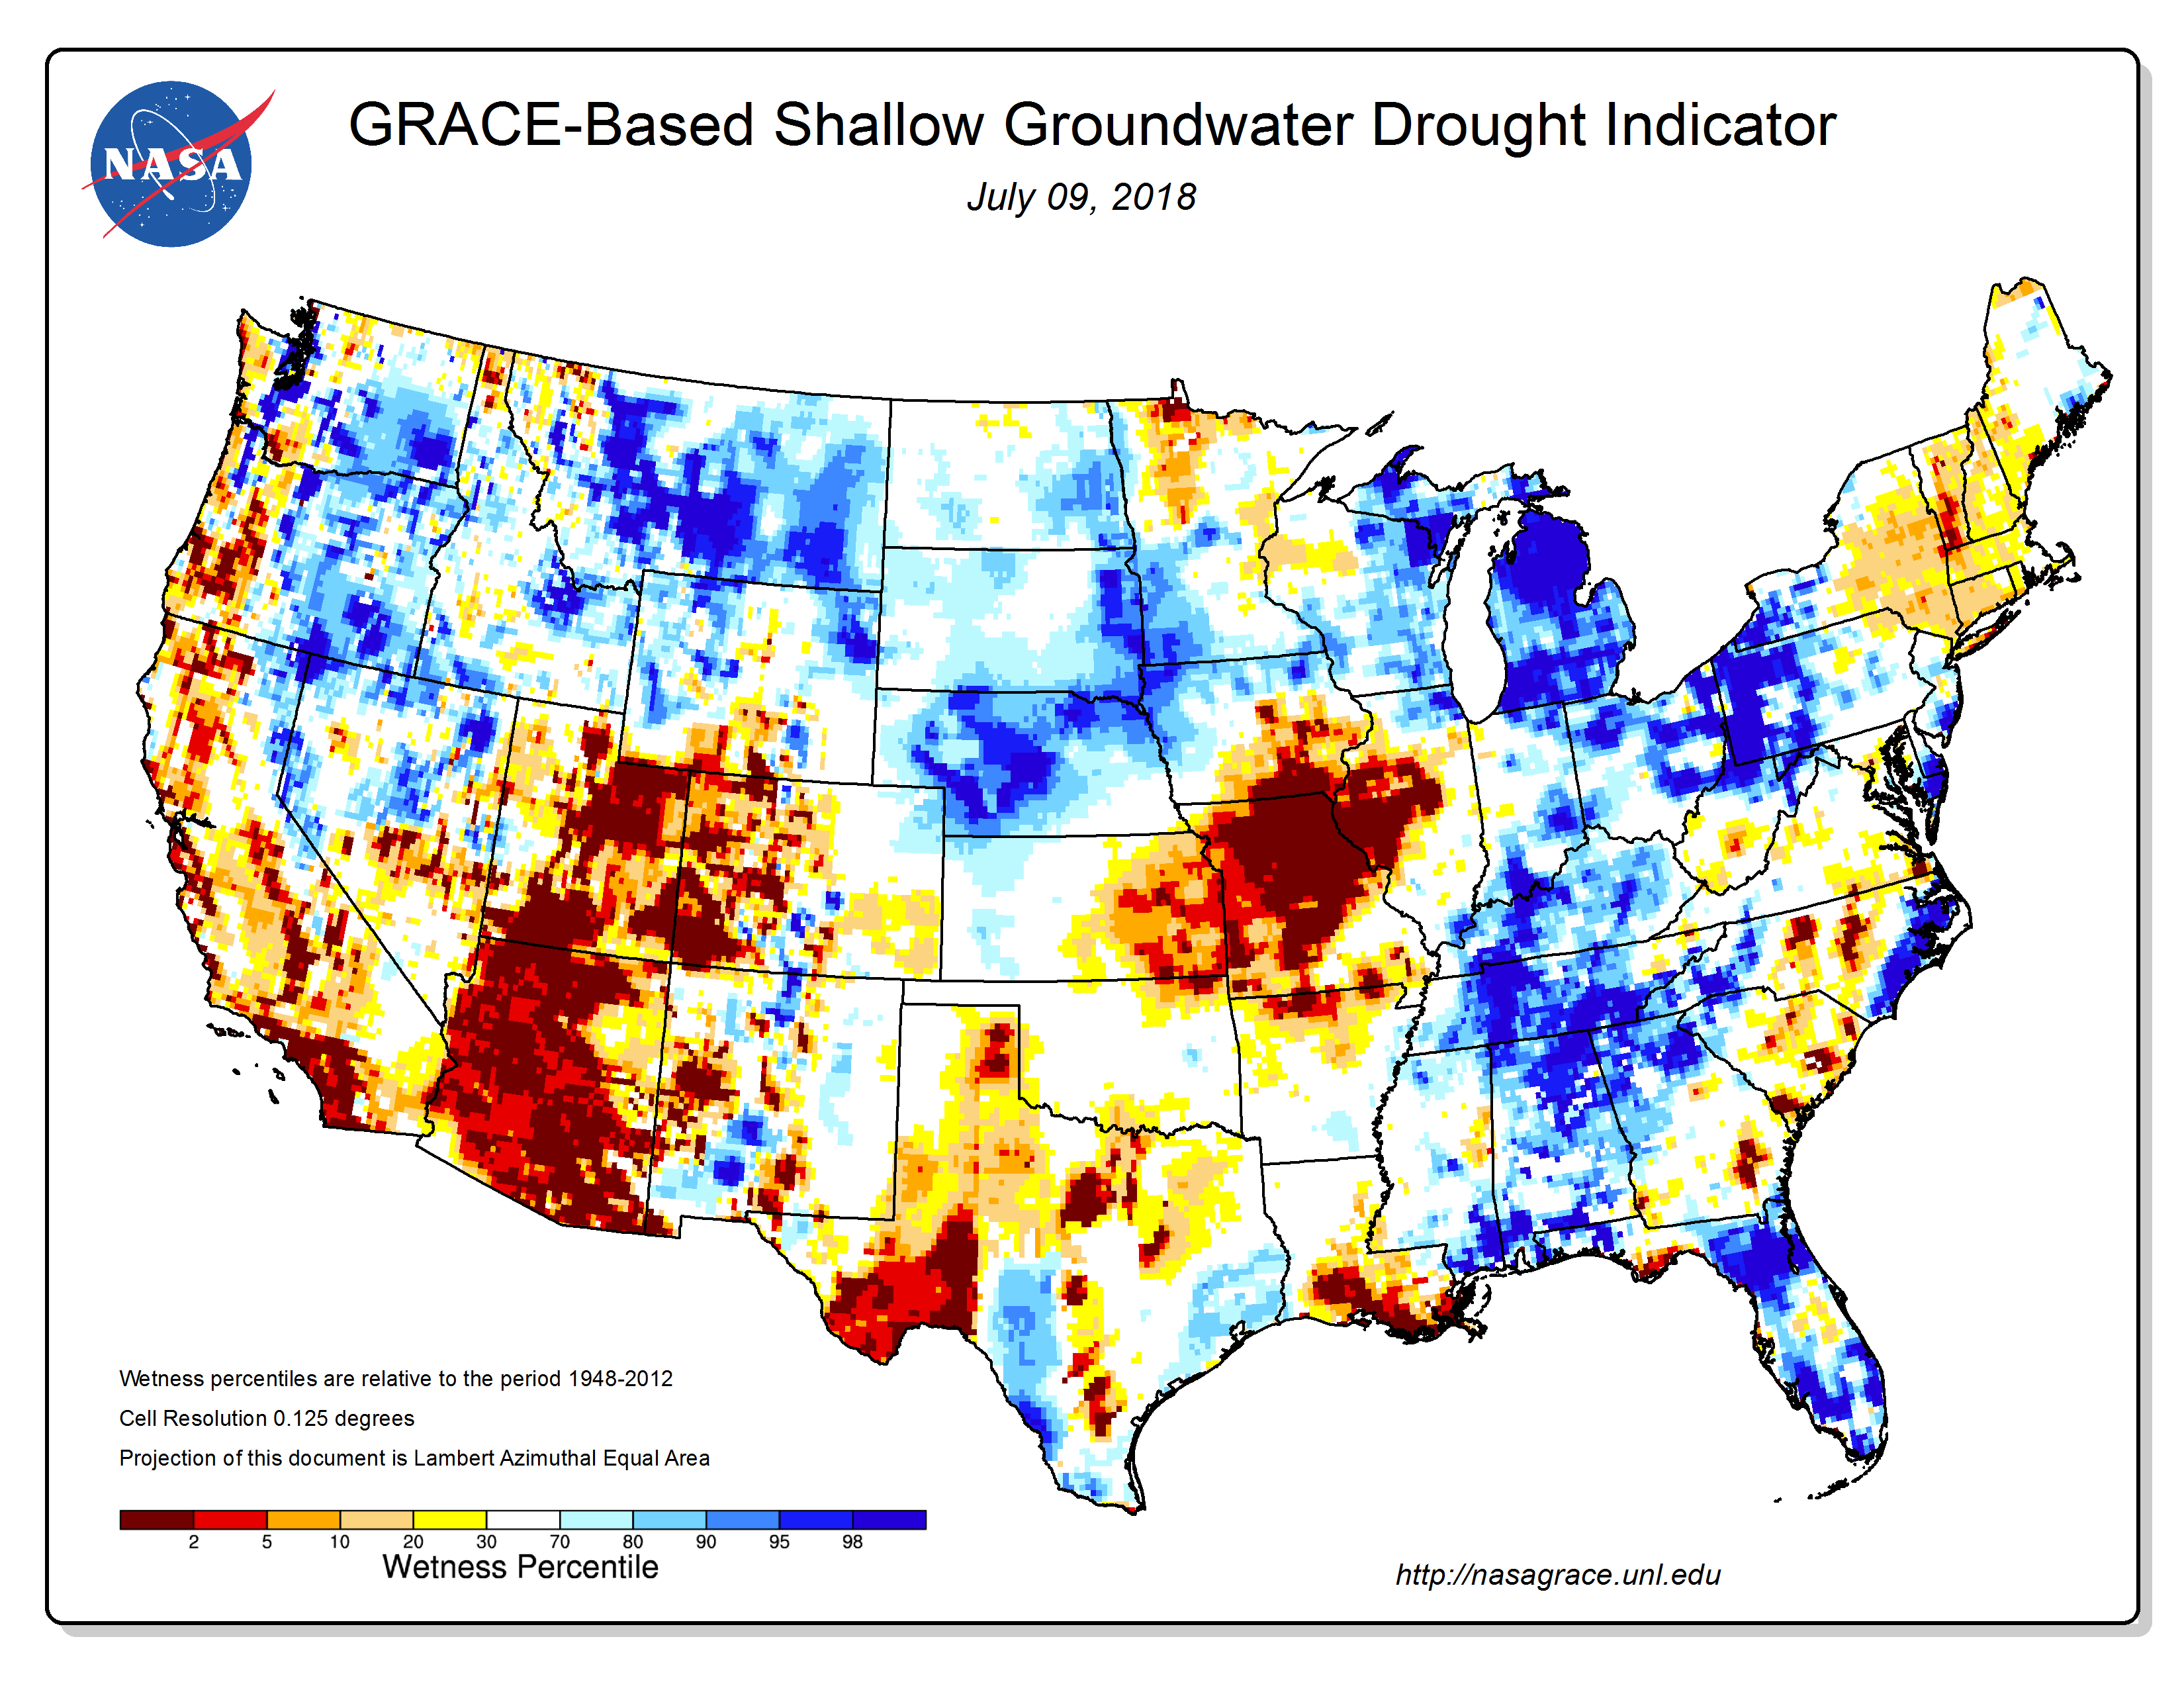
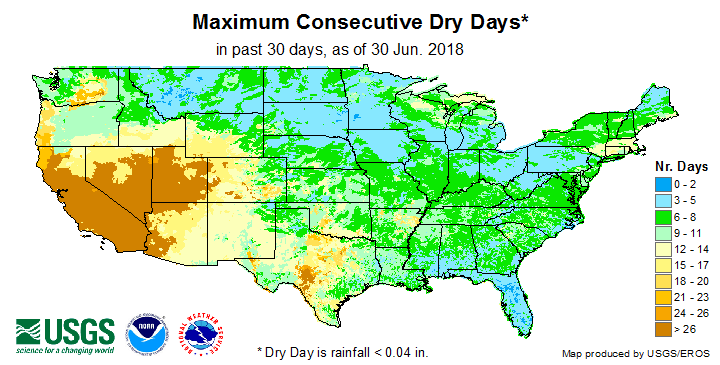
- Drought conditions were reflected in several indices and indicators, including evapotranspiration (EDDI), soil moisture (SMOS satellite observations, and CPC, Leaky Bucket, VIC, NASA GRACE, NLDAS top and total layer models), Crop Moisture Index (CMI maps for weeks 1, 2, 3, 4), streamflow, groundwater (NASA GRACE satellite-based estimates, USGS observations), the QuickDRI index, the satellite data-based VegDRI and VHI vegetation condition indices, some reservoirs, and USGS number of rain days and consecutive dry days. July 2nd U.S. Department of Agriculture (USDA) observations of soil moisture and pasture and rangeland condition revealed significant impacts in the West and South. Topsoils were short or very short of moisture (dry or very dry) across 53 percent of Arkansas, 80 percent of California, 40 percent of Colorado, 39 percent of Idaho, 54 percent of Louisiana, 38 percent of Mississippi, 52 percent of Missouri, 50 percent of Nevada, 85 percent of New Mexico, 74 percent of Oregon, 69 percent of Texas, and 60 percent of Utah. Subsoil moisture conditions were equally bad, with values as follows: 55 percent of Arkansas, 75 percent of California, 39 percent of Colorado, 39 percent of Idaho, 54 percent of Louisiana, 34 percent of Mississippi, 53 percent of Missouri, 40 percent of Nevada, 85 percent of New Mexico, 71 percent of Oregon, 71 percent of Texas, and 62 percent of Utah. Pasture and rangeland were in poor to very poor condition across 88 percent of Arizona, 40 percent of California, 51 percent of Colorado, 35 percent of Missouri, 30 percent of Nevada, 66 percent of New Mexico, 33 percent of Oregon, 40 percent of Texas, and 30 percent of Utah.
- Abnormal dryness to severe drought continued in parts of the northern Plains and the High Plains of Montana. — This status mainly reflected a combination of short-term (last 2, 3, to 6 months) and, especially for the Dakotas, long-term (last 9 to 12 months) precipitation deficits. Drought impacts were evident in several indices and indicators, including evapotranspiration (EDDI), soil moisture (SMOS satellite observations, and CPC, Leaky Bucket, VIC, NASA GRACE, NLDAS top and total layer models), Crop Moisture Index (CMI maps for weeks 1, 2, 3, 4), and the satellite data-based VegDRI vegetation condition index. According to USDA observations, topsoils were short or very short of moisture (dry or very dry) across only 17 percent of Montana, North Dakota, and South Dakota, but subsoils were dry to very dry across 24 percent of Montana, 32 percent of North Dakota, and 26 percent of South Dakota.
- Abnormal dryness expanded and moderate drought developed in the Northeast. — This status reflected dry conditions of the last 1 to 2 months. Drought conditions were reflected in several indices and indicators, including evapotranspiration (EDDI), soil moisture (SMOS satellite observations, and CPC, Leaky Bucket, VIC, NASA GRACE, NLDAS top and total layer models), streamflow, groundwater (NASA GRACE satellite-based estimates, USGS observations), and the QuickDRI index. According to USDA observations, topsoils were short or very short of moisture across 38 percent of Delaware, 20 percent of Maine, 23 percent of Maryland, 37 percent of Massachusetts, 32 percent of New Hampshire, 32 percent of New Jersey, 57 percent of New York, 22 percent of Rhode Island, and 45 percent of Vermont. Subsoil moisture was short or very short across 27 percent of Delaware, 30 percent of Maine, 49 percent of New Hampshire, 45 percent of New York, and 23 percent of Vermont.
- A few areas of abnormal dryness were present in the Great Lakes, Southeast, Alaska, Hawaii, and Puerto Rico. Low streamflow was observed in parts of Alaska, and dryness was reflected in the Southeast by several indicators, including: evapotranspiration (EDDI), soil moisture (SMOS satellite observations, and CPC, Leaky Bucket, NASA GRACE models), streamflow, groundwater (NASA GRACE satellite-based estimates, USGS observations), the QuickDRI index, and the satellite data-based VegDRI vegetation condition index.
Palmer Drought Index
The Palmer drought indices measure the balance between moisture demand (evapotranspiration driven by temperature) and moisture supply (precipitation). The Palmer Z Index depicts moisture conditions for the current month, while the Palmer Hydrological Drought Index (PHDI) and Palmer Drought Severity Index (PDSI) depict the current month's cumulative moisture conditions integrated over the last several months. While both the PDSI and PHDI indices show long-term moisture conditions, the PDSI depicts meteorological drought while the PHDI depicts hydrological drought. The PDSI map shows less severe and extensive drought (as well as wet spell conditions) in some parts of the country than the PHDI map because the meteorological conditions that produce drought and wet spell conditions are not as long-lasting as the hydrological impacts.
|
 |
Used together, the Palmer Z Index and PHDI maps show that short-term dry conditions continued in the Southwest and from the southern Plains to Mississippi Valley, and occurred in a few areas in the northern Plains and parts of the Carolinas, over areas that were in drought at the end of May, expanding and intensifying long-term drought. Short-term dry conditions occurred in parts of the Great Lakes to Northeast, reducing previous long-term wet conditions. Short-term wet conditions occurred from the central Plains to Mid-Atlantic region, expanding and intensifying previous long-term wet conditions.
Standardized Precipitation Index
The Standardized Precipitation Index (SPI) measures moisture supply. The SPI maps here show the spatial extent of anomalously wet and dry areas at time scales ranging from 1 month to 24 months.
 |
 |
 |
The SPI maps illustrate how moisture conditions have varied considerably through time and space over the last two years. Dryness across the Southwest is evident at all time scales. California is dry at most time scales from 1 to 12 months. Parts of the Pacific Northwest are dry for the last 1, 2, and 6 to 12 months. Parts to most of the southern Plains to Mississippi Valley are dry at the 1- to 12-month time scales. Parts of the northern Plains to Upper Mississippi Valley are dry at the 3- to 12-month time scales, with some dryness at 2 and 24 months. Much of the Northeast is dry at the 2-month time scale, with some areas dry at 1, 12, and 24 months. Part of the Great Lakes has dryness at the 1- to 2-month time scales. Parts of the Southeast are dry at 1 and 6 to 24 months.
 |
 |
 |
Standardized Precipitation Evapotranspiration Index
The SPI measures water supply (precipitation), while the SPEI (Standardized Precipitation Evapotranspiration Index) measures the combination of water supply (precipitation) and water demand (evapotranspiration as computed from temperature). Warmer temperatures tend to increase evapotranspiration, which generally makes droughts more intense.
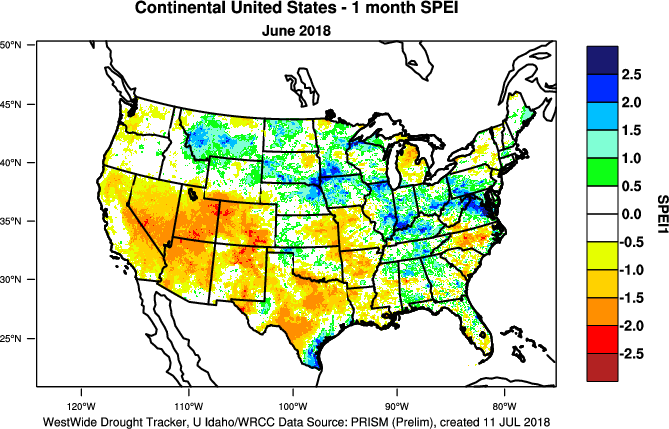 1-month SPEI for current month.
|
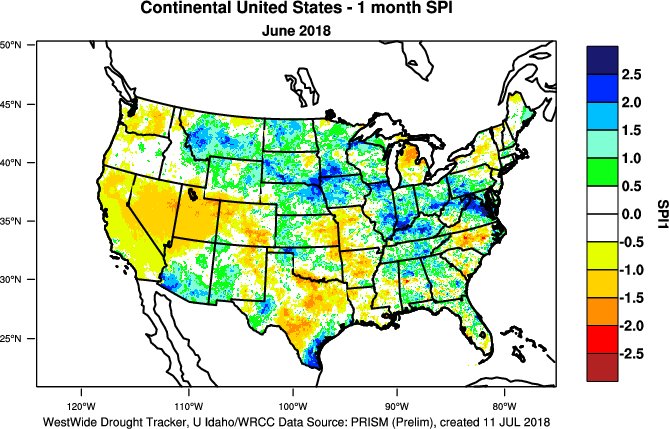 1-month SPI for current month.
|
Temperatures during June 2018 were above normal across a large part of the country, with record warmth occurring in parts of the Southwest and southern Plains. For areas that were drier than normal during June, this resulted in a more extreme SPEI compared to SPI.
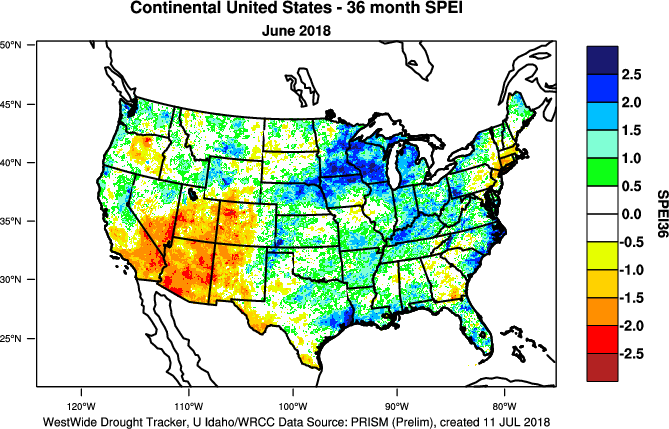
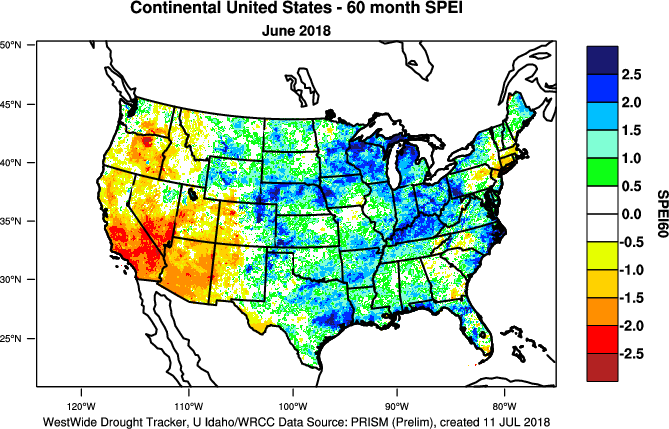
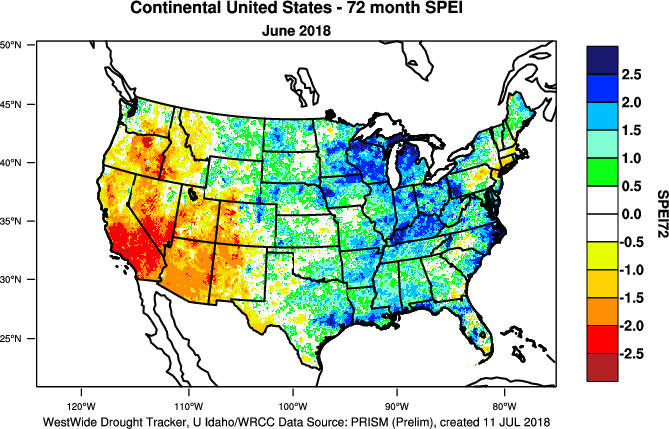 72-month SPEI for current month.
|
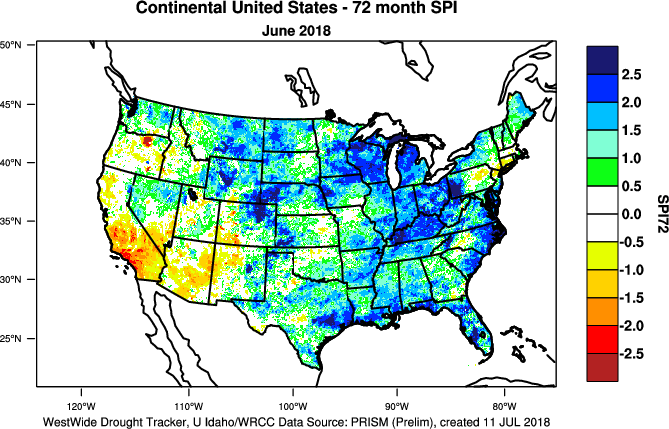 72-month SPI for current month.
|
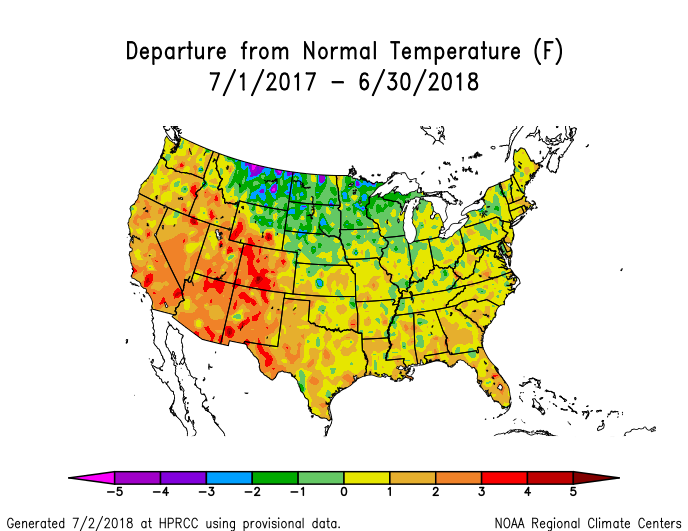
Warmer-than-normal temperatures have persisted across much of the country for the last 12 months and longer. This has resulted in a more extreme SPEI compared to SPI for those regions which have had drier-than-normal weather (SPEI maps for last 1, 2, 3, 4, 5, 6 years) (SPI maps for last 1, 2, 3, 4, 5, 6 years), especially the Southwest.
 California statewide temperature, July-June, 1895-2018.
|
 Arizona statewide temperature, July-June, 1895-2018.
|
 New Mexico statewide temperature, July-June, 1895-2018.
|
 California statewide precipitation, July-June, 1895-2018.
|
 Arizona statewide precipitation, July-June, 1895-2018.
|
 New Mexico statewide precipitation, July-June, 1895-2018.
|
As noted above, the Southwest states have seen persistently warm temperatures for the last 12 months and, in fact, most of the last 20 years. The last 12 months ranked as the warmest July-June in the 123-year record for Arizona and New Mexico, and second warmest for California. These persistently warm temperatures have increased the evaporative demand on the environment — on native vegetation as well as commercial and community water supplies — and worsened drought conditions when low precipitation occurs.
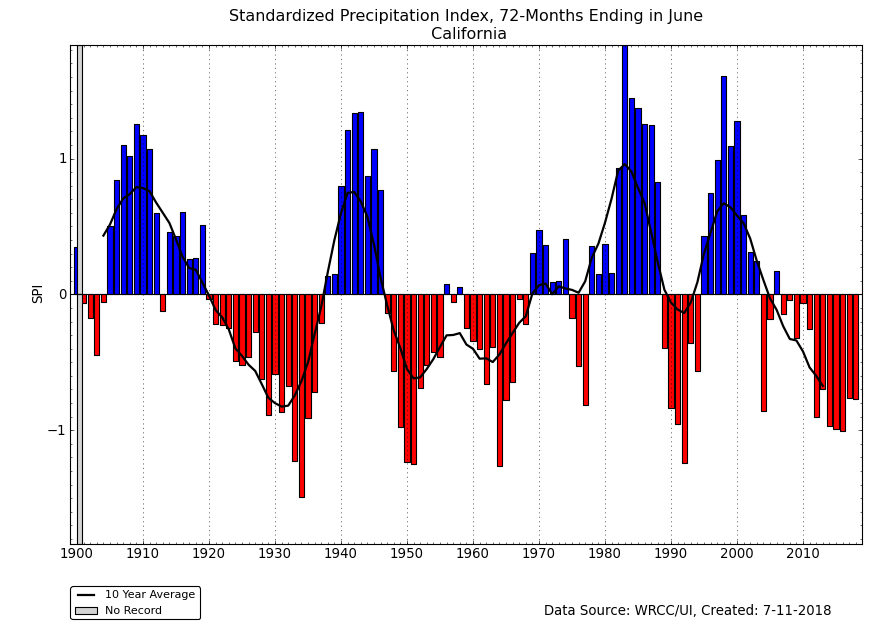
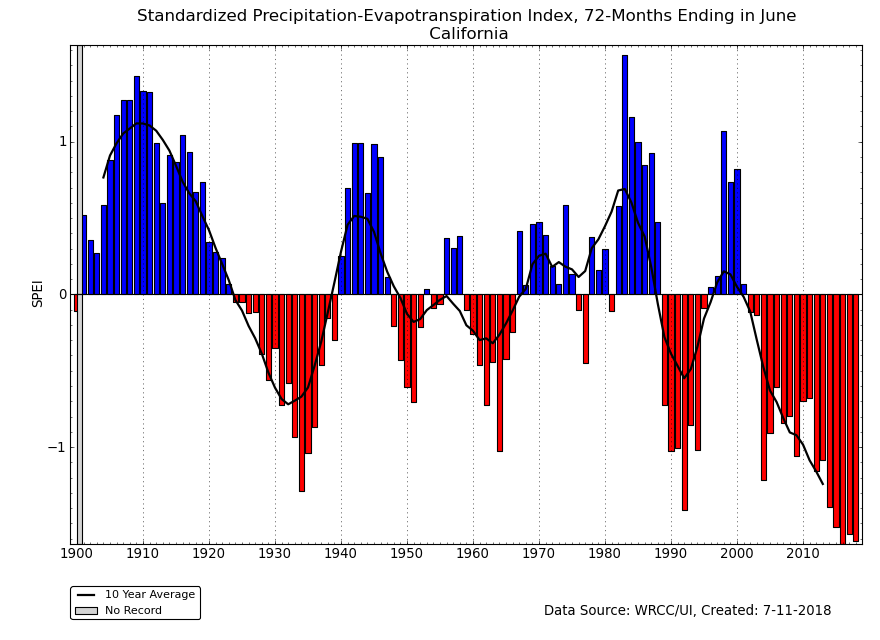 California 72-month SPEI, July-June, 1895-2018.
|
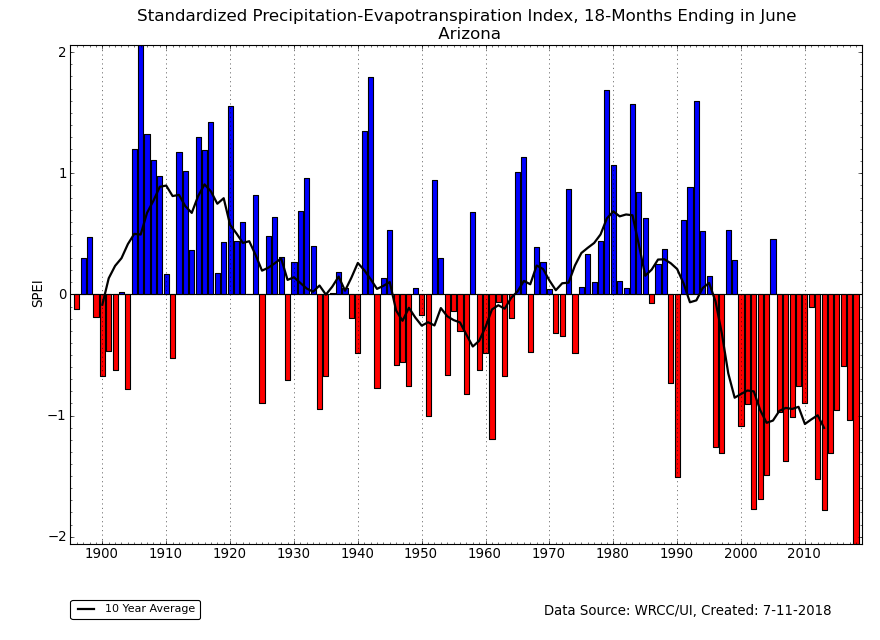
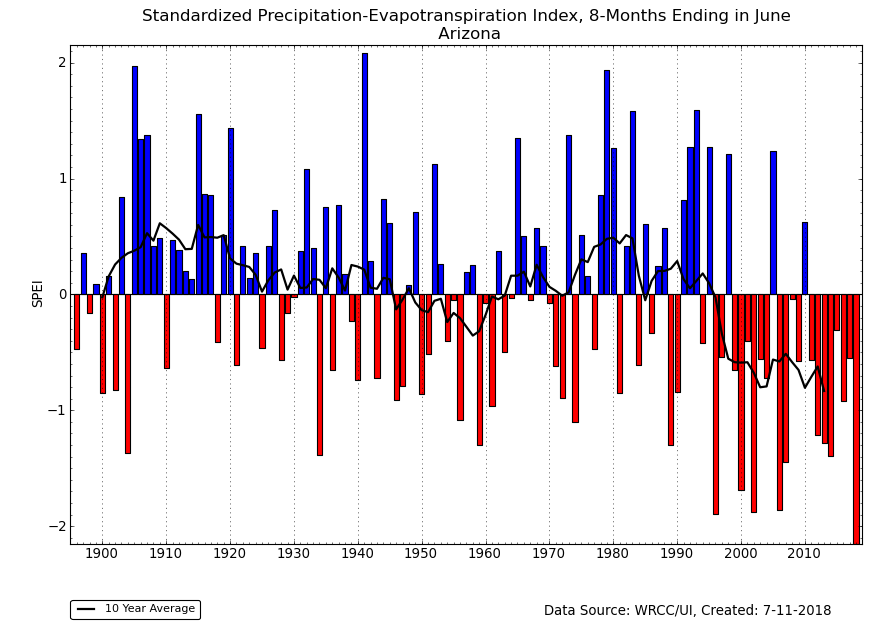
Arizona 18-month SPEI, 1895-2018.
|
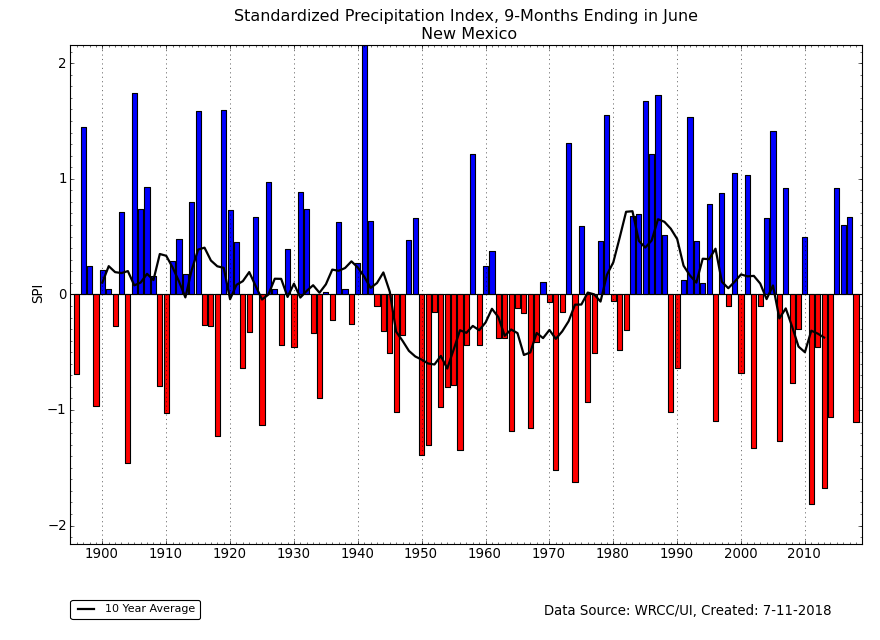
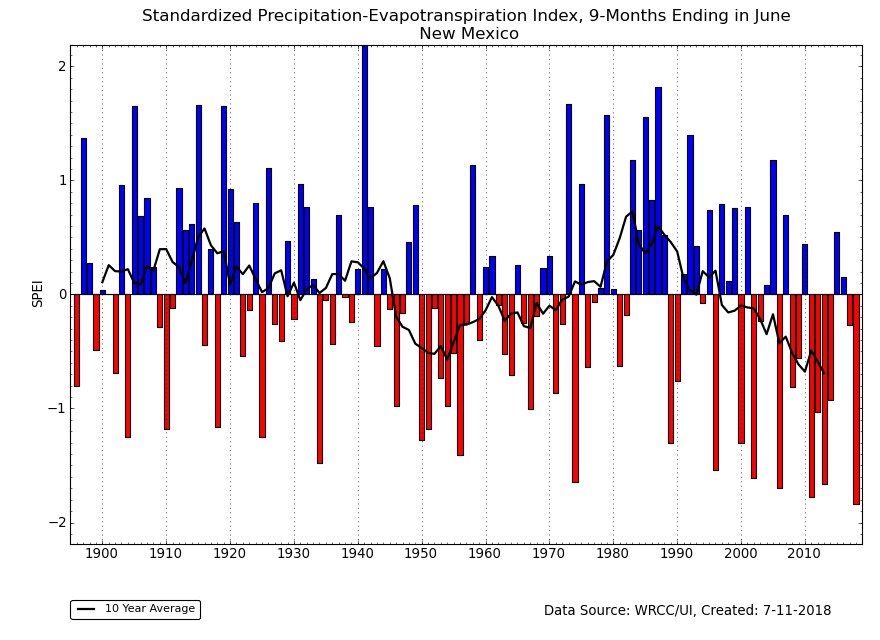 New Mexico 9-month SPEI, October-June, 1895-2018.
|
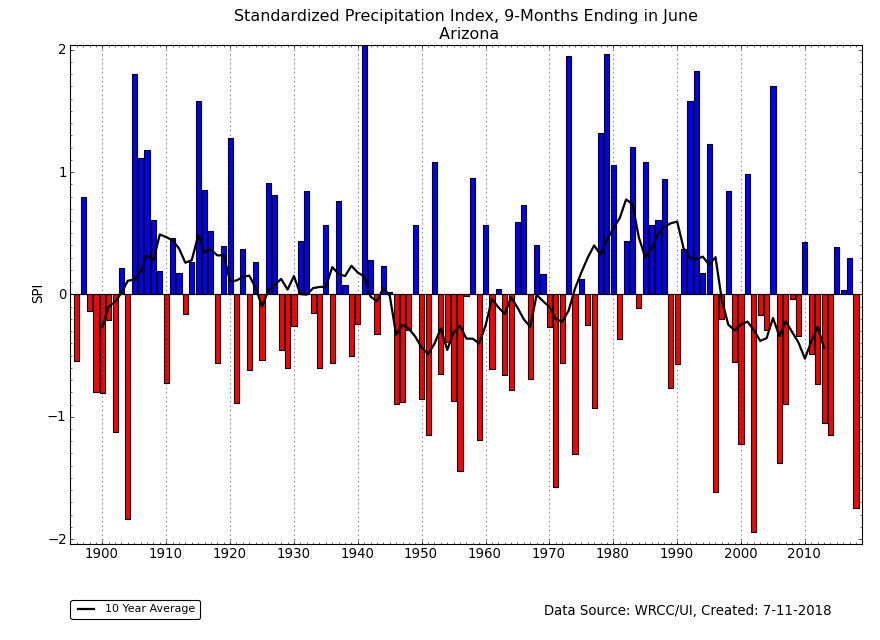
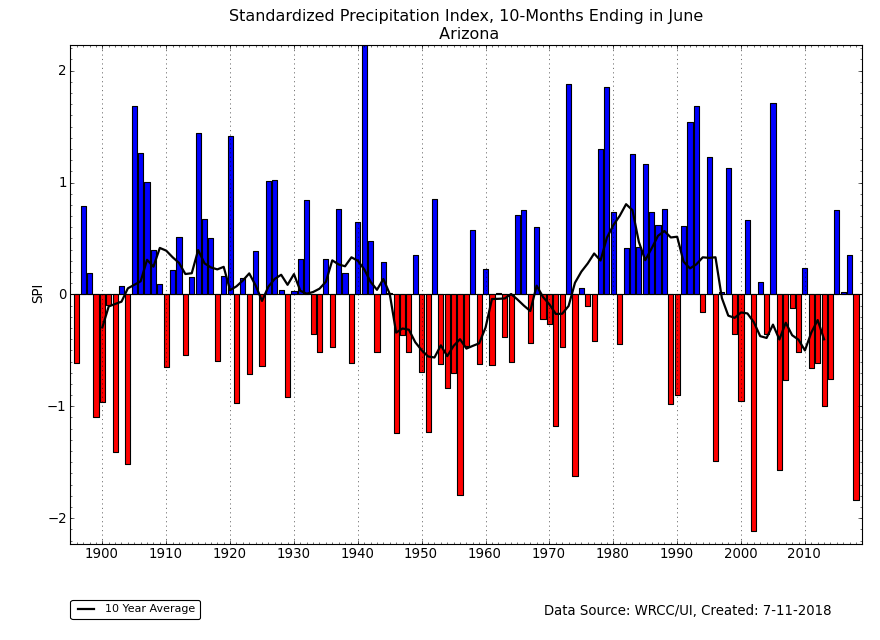
As a result, Arizona has had the driest SPEI in the 124-year record for the last 7, 8, 9, 10, 11, and even 18 months, compared to an SPI which was not record dry (SPI for last 7, 8, 9, 10, 11, and 18 months). New Mexico had the driest 9-month (October-June) SPEI compared to an SPI that was not even in the top ten driest category. Over the last six years, California's 72-month SPEI is the second driest on record compared to an SPI which is not even in the top ten driest category. In fact, the SPI indicates that many 6-year periods in the 1930s, 1940-50s, 1960s, and 1980-90s had less precipitation than the 2000s, illustrating the magnifying effect on drought that is caused by excessive heat.
Regional Discussion
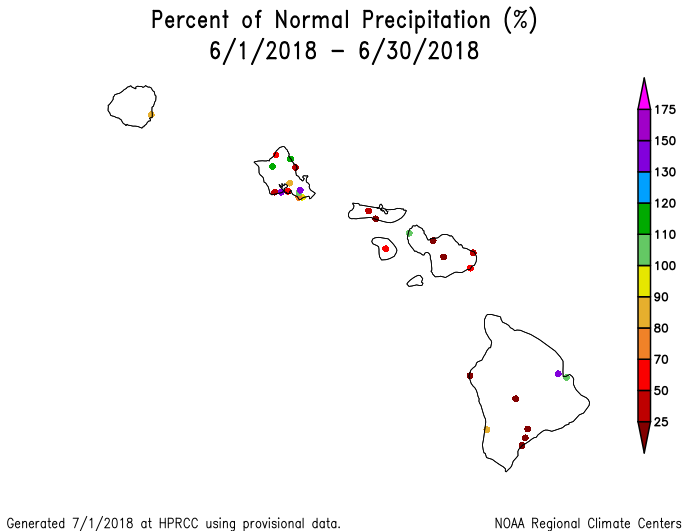
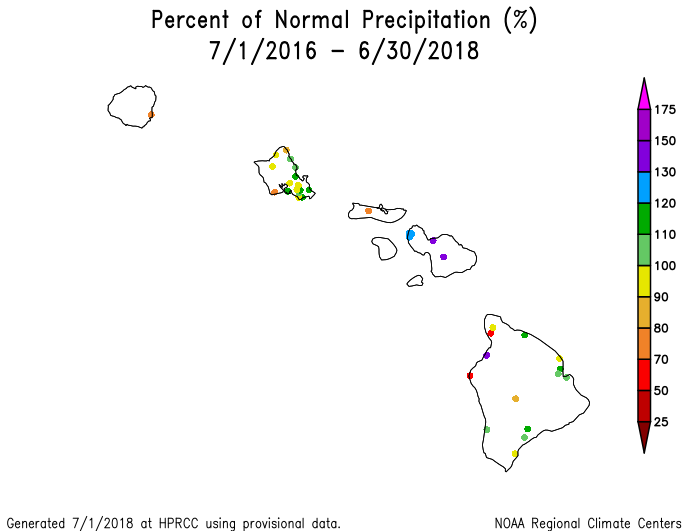
Map of percent of normal precipitation for Hawaii, June 2018.
June 2018 was drier than normal at most of the Hawaiian stations. A dry May resulted in drier-than-normal conditions across the islands for the last two months. But a wet April resulted in a mixed anomaly pattern for the last 3, 4, 6, 9, to 12 months. The precipitation pattern was mostly wetter than normal for the last 24 to 36 months. Streamflow was mostly near to above normal. Abnormal dryness expanded to about a third (31 percent) of the state, as seen on the July 3rd, 2018 USDM map.
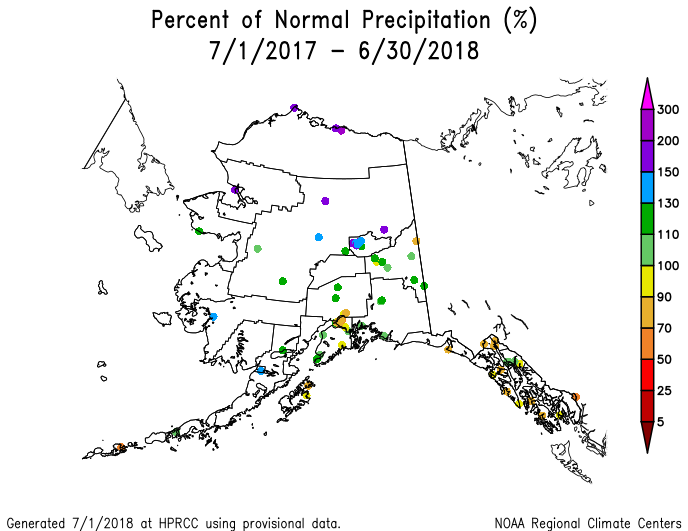
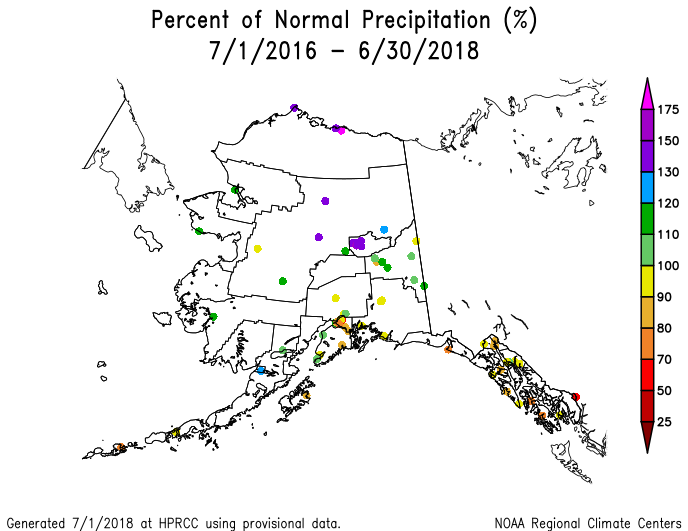
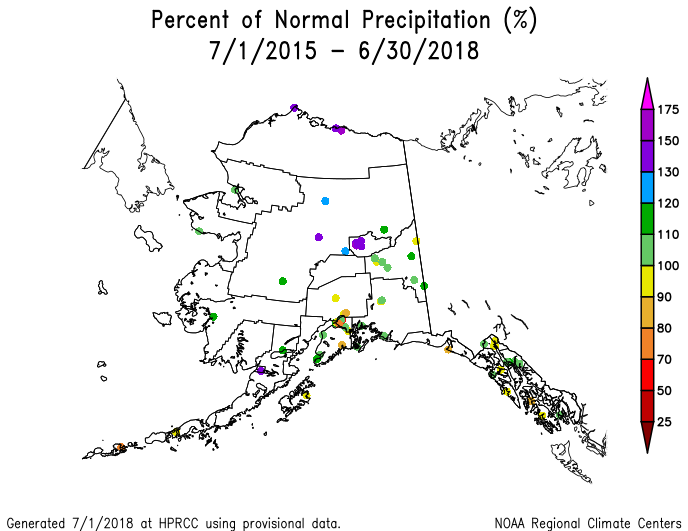
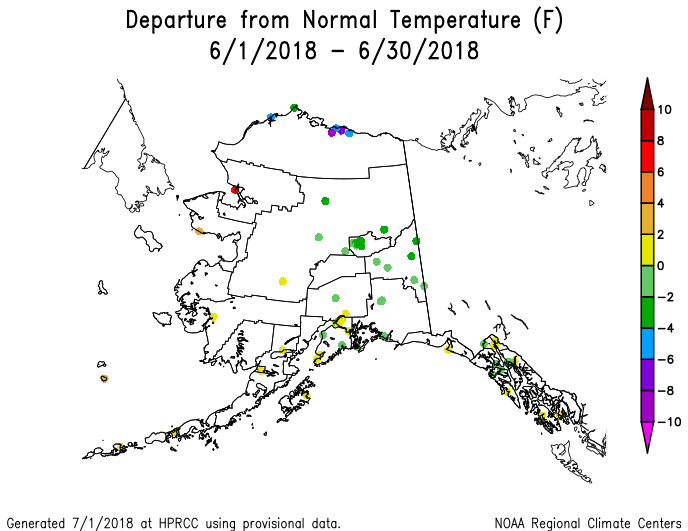
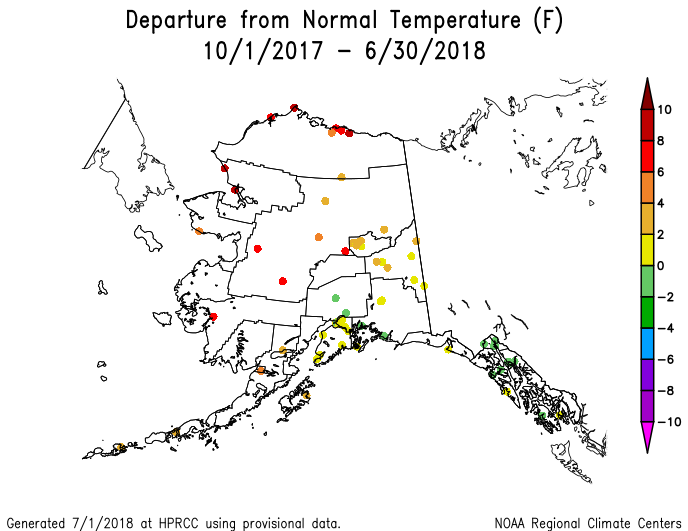
Alaska gridded precipitation rank map, January-June 2018.
June 2018 was wetter than normal in southwestern to central Alaska, drier than normal in parts of the northwest to north coastal areas and eastern sections, and had a mixed anomaly pattern in the panhandle. Precipitation was wetter than normal for most of the state for the last 2 to 24 months, except in the panhandle which became drier than normal. The last 36 months were mostly wetter than normal, except for a mixed anomaly pattern in the south. (Low elevation station precipitation anomaly maps for the last 1, 2, 3, 4, 6, 9, 12, 24, 36 months.) (Divisional precipitation rank maps for the last 1, 3, 6, 12 months.) (Gridded precipitation percentile maps for the last 1, 3, 6 months.) (Gridded percent of average precipitation maps for the last 1, 3, 6 months.) Temperatures during June were near to warmer than average in the west and south, and cooler than average in the north and eastern interior sections. This anomaly pattern held for the last 2 to 3 months, but warmer-than-normal temperatures began to dominate most of the state (except the southeast) by the last 6 months, with record warm conditions in the north for the last 12 months. (Low elevation station temperature anomaly maps for the last 1, 2, 3, 4, 6, 9, 12 months.) (Divisional temperature rank maps for the last 1, 3, 6, 12 months.) (Gridded temperature percentile maps for the last 1, 3, 6 months.) (Gridded temperature departure maps for the last 1, 3, 6 months.) Streamflow was mostly near to above normal with some below-normal stream levels in the panhandle and elsewhere in the south and east. The Leaky Bucket model suggested some lingering dryness in the soils in the south and eastern sections. Abnormally dry (D0) conditions expanded slightly to about 6 percent of the state on the July 3rd USDM map.
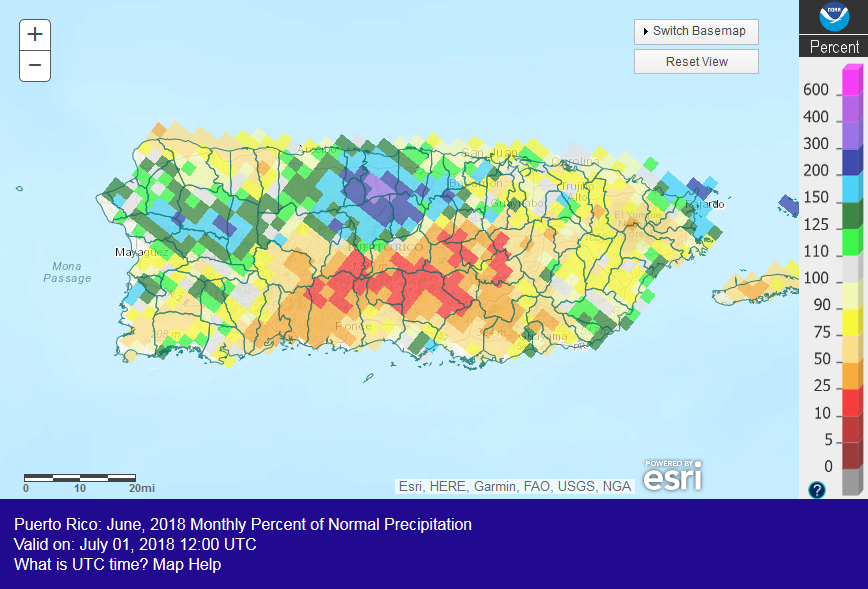
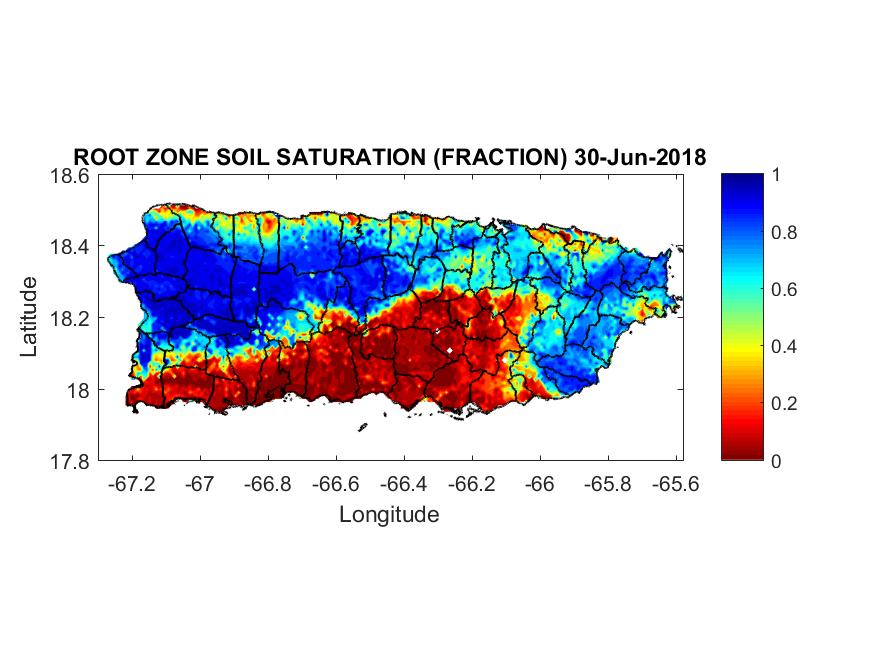
Puerto Rico percent of normal precipitation map, June 2018.
Puerto Rico: Puerto Rico was drier than normal in the south central and eastern sections during June, with some wetter-than-normal areas in the north and west. Drier-than-normal conditions dominated the south-central area, with wetter-than-normal conditions to the north, west, and east, at longer time scales (last 2, 3, 6, and 9 months). Soils were dry in the south central region to southwest coast, but streamflow was mostly near normal. It should be pointed out that the island still has not recovered from the damage to the weather observation network suffered during last year's hurricane season. As seen on the July 3rd USDM map, abnormal dryness was introduced in south central Puerto Rico to cover about a third (34 percent) of the island.
CONUS State Precipitation Ranks:
|
|
June 2018 was drier than normal across much of the West, from the southern Plains to Lower and Mid-Mississippi Valley, and parts of the Northeast and Southeast. On a statewide basis, eight states ranked in the driest third of the 124-year historical record, with Utah ranking in the top ten driest category at sixth driest.
|
|
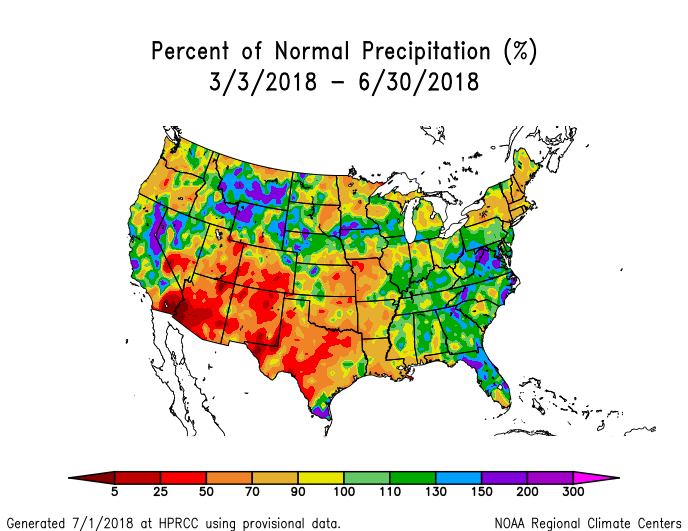
April-June 2018 was drier than normal across the Southwest, much of the Great Plains to Mississippi Valley, and parts of the Northeast. On a statewide basis, ten states ranked in the driest third of the 124-year historical record, with Texas ranking eleventh driest. It was record dry in parts of Texas and New Mexico.
|
|
January-June 2018 was drier than normal across much of the West, southern and central Plains to Mid-Mississippi Valley, parts of the northern Plains, and a few areas in the Southeast and Northeast. On a statewide basis, seven states ranked in the driest third of the 124-year historical record, with Colorado ranking eleventh driest.
|
|
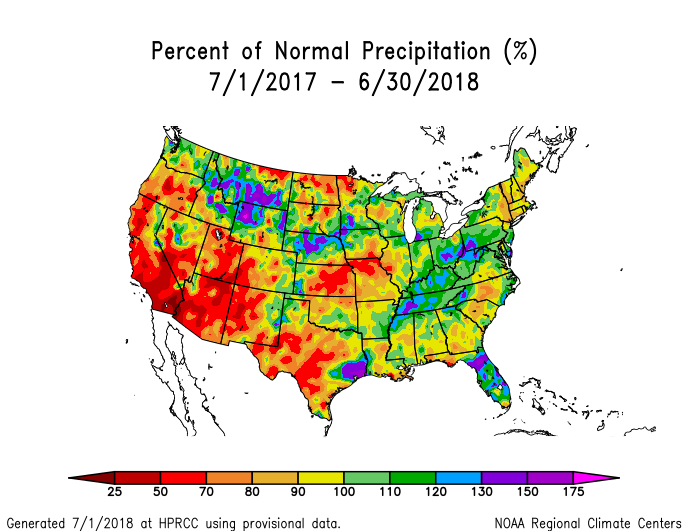
The dryness of the last 3 to 6 months extended to the last 12 months across much of the West and Plains to Mid-Mississippi Valley. It ws also drier than normal in the Southeast and Northeast. On a statewide basis, ten states ranked in the driest third of the 124-year historical record, with Arizona ranking seventh driest and Utah eleventh driest. If not for small areas of above-normal precipitation falling in parts of the states, Kansas, Missouri, California, Nevada, New Mexico, and Texas could have reached the top ten driest category.
 Primary Corn and Soybean Belt precipitation, June, 1895-2018.
|
 Primary Corn and Soybean Belt precipitation, March-June, 1895-2018.
|
For the Primary Corn and Soybean agricultural belt during June 2018, temperatures were warmer than normal and precipitation mostly wetter than normal. The month ranked as the ninth warmest and 18th wettest June, regionwide, in the 1895-2018 record. March is the beginning of the growing season for the Primary Corn and Soybean agricultural belt. March-June 2018 had a spatially variable pattern of precipitation and temperature anomalies. This 4-month period ranked as the 50th wettest and 39th warmest March-June, regionwide, in the 1895-2018 record.
The prolonged below-normal precipitation has dried soils and inhibited crop growth in many states in the Plains and Southwest (as detailed earlier). According to statistics from the USDA, 27 percent of the topsoil and 29 percent of the subsoil was rated short or very short of moisture (dry or very dry) nationwide, 34 percent of the winter wheat was rated in poor to very poor condition (with half of the crop harvested), 20 percent of the pasture and rangeland was rated in poor to very poor condition, and (only) 6 percent of the corn and soybeans was rated in poor to very poor condition. As of July 3rd, drought was affecting nine percent of corn production, 10 percent of soybean production, 24 percent of hay acreage, 26 percent of cattle inventory, 28 percent of winter wheat production, and three percent of spring wheat production.
NOAA Regional Climate Centers:
A more detailed drought discussion, provided by the NOAA Regional Climate Centers and others, can be found below.
As described by the High Plains Regional Climate Center, it was another warm month throughout the High Plains, as June temperatures averaged 3.0-6.0 degrees F (1.7-3.3 degrees C) above normal for much of the region. While corn and soybeans were faring well for the most part across the region, a continuation of excessive heat could impact yields and is something to watch throughout the summer.
Precipitation varied throughout the region during June, with record-breaking rainfall across portions of Nebraska and South Dakota, and dry conditions across much of Colorado, eastern Kansas, and the eastern Dakotas. The dryness caused drought to expand and intensify in the dry regions. Wildfires raged across southern Colorado where drought has been present. On the 1st, strong winds kicked up dirt and dust over dry areas of northeastern South Dakota and produced a dust storm, reducing visibilities and causing traffic issues and damage to vegetation. In the Plains, below-normal streamflows were common in areas where drought was present, including southeastern Colorado, central and eastern Kansas, and along the southern border of Nebraska.
Heavy rains improved drought conditions across the western Dakotas and northern and western Kansas during June, while eastern South Dakota, eastern Kansas, and portions of Colorado missed out and drought conditions worsened. The USDM indicated an overall improvement in drought conditions for the High Plains region during the past month, as areas experiencing drought (D1-D4) improved from 36 percent at the end of May to 26 percent in late June. One of the most notable improvements included the elimination of drought from much of the western Dakotas, an area that had been in drought since June 2017. While some lingering impacts justified the depiction of abnormally dry conditions (D0) on the USDM map, this area received approximately 130-150 percent of normal precipitation from April to June, allowing for gradual improvements. Portions of Kansas benefited from above-normal precipitation in June, as exceptional drought (D4) and severe drought (D3) were eliminated from southwestern Kansas, while moderate drought (D1) and D0 conditions were erased from the north-central part of the state. As for degradations, drought developed and intensified over northeastern South Dakota, which had below-normal precipitation in June. A similar situation occurred in eastern Kansas, as this area was dry while the western half of the state was wet. Drought intensified in western Colorado where water-year precipitation deficits continued to accumulate.
As explained by the Southern Regional Climate Center, June temperatures were above normal throughout most of the Southern region, while monthly total precipitation values varied spatially throughout the region. Parts of western, southwestern, and central Texas received 5 percent or less of normal precipitation. Western, southwestern, central, and eastern Texas, northwestern Louisiana, northwestern Arkansas, northeastern Oklahoma, and an area in central Mississippi received 25 percent or less of normal precipitation. In contrast, extreme southern Texas received 400 percent or more of normal precipitation. Parts of northern, western, southeastern and southern Texas, western Oklahoma, and southeastern Tennessee received 200-400 percent of normal precipitation.
At the end of June and into July, exceptional and extreme drought classifications were still present in extreme western Oklahoma and southwestern Texas. Extreme drought classifications were present in western Oklahoma and northern, central, and southeastern Texas. Severe drought classifications were present throughout parts of northern, central, and northeastern Texas, western and southeastern Oklahoma, southwestern Arkansas, and northwestern Louisiana. The moderate drought classification remained throughout parts of central, northern, and northeastern Texas. Moderate drought classification appeared in northern and southeastern Oklahoma, central, western, and southwestern Arkansas, central, northwestern, and northeastern Louisiana, and southwestern Mississippi. There were currently no drought conditions in Tennessee.
As summarized by the Midwest Regional Climate Center, June temperatures averaged 2.7 degrees F (1.5 C) above normal for June, ranking as the 13th warmest June on record for the Midwest. Precipitation was well above normal in June for much of the region. Michigan (89 percent of normal) in the northeast and Missouri (80 percent of normal) in the southwest were below normal, while the rest of the Midwest states were well above normal ranging from 123 percent of normal in Minnesota to 152 percent of normal in Iowa. Drought was largely limited to the Iowa-Missouri border at the beginning of the month, representing just under 4 percent of the region (less than 0.25 percent in severe drought). By the end of the month, the area in drought expanded to include much of northern Missouri and covered more than 6 percent of the region (nearly 3 percent in severe drought).
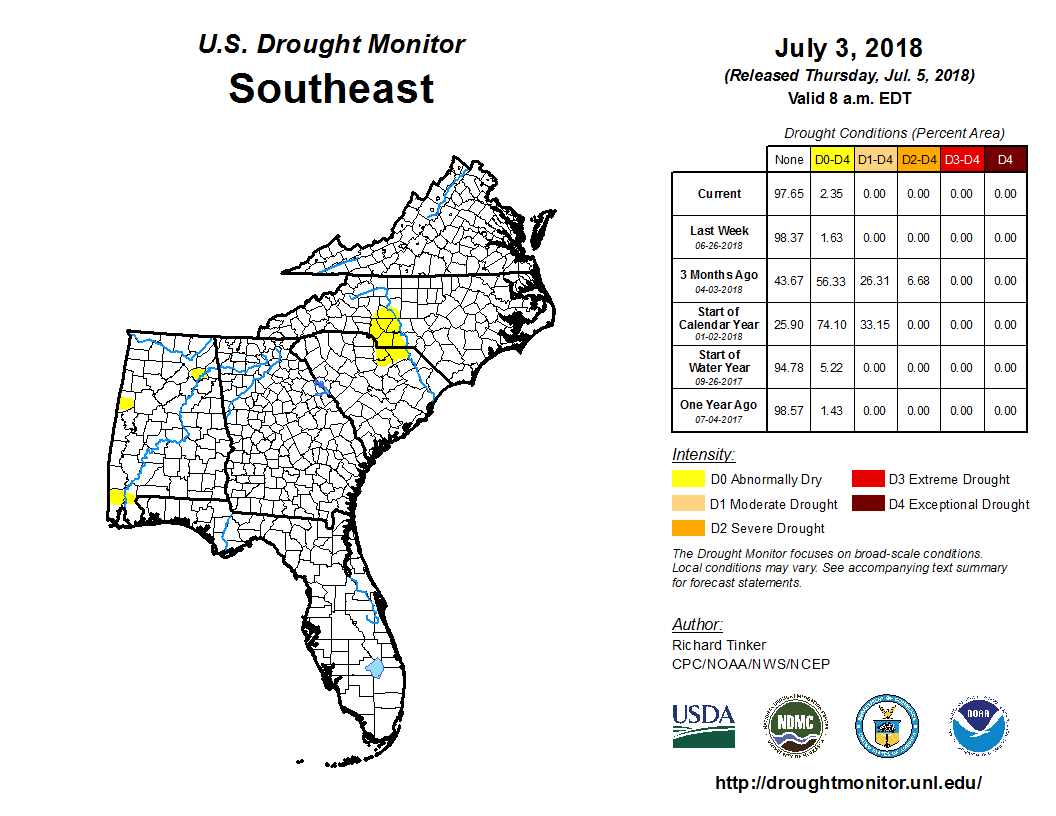
As noted by the Southeast Regional Climate Center, temperatures were above average across much of the Southeast region during June, and near average in Puerto Rico and the U.S. Virgin Islands. Precipitation was highly variable across the region during June, which is common during the summer. The driest locations were found across much of central North Carolina, as well as portions of southwestern Virginia, South Carolina, central Alabama, the coasts of central and southern Florida, and southwestern Puerto Rico. Monthly precipitation totals were 50 to less than 25 percent of normal in these areas. Magueyes Island, PR (1959-2018) tied its driest June on record, with no measurable rainfall during the month. Dunn 4 NW, NC (1963-2018) observed its driest June on record, with only 0.42 inches (10.7 mm) of precipitation. In contrast, the wettest locations were found across much of northern and eastern Virginia, as well as portions of eastern North Carolina, Georgia, Alabama, the Florida Peninsula, and north-central Puerto Rico.
Drought conditions (D1 and greater) were not observed across the Southeast region during June, but pockets of abnormal dryness (D0) persisted in portions of Alabama. In addition, a swath of abnormally dry conditions developed and expanded in coverage across southern Puerto Rico during the month. While heavy rainfall and flooding disrupted agricultural production during much of May, drier weather in June allowed farmers in parts of the region to resume planting crops, spraying herbicides, cutting hay, and harvesting small grains. However, persistent rainfall in some portions of the region (e.g., Florida, eastern North Carolina, northern and eastern Virginia) continued to delay these activities. Excessive heat, coupled with a lack of precipitation, stressed crop fields, livestock pastures, and hayfields in portions of Alabama, Georgia, and the Carolinas during the second half of the month.
As explained by the Northeast Regional Climate Center, the average temperature for the Northeast for the month of June was 64.8 degrees F (18.2 degrees C), which was 0.4 degrees F (0.2 degrees C) below normal, and precipitation was near normal for much of the region throughout the month. The Northeast received 4.27 inches (108.5 mm) of precipitation during June, which was 102 percent of normal. Maryland, Pennsylvania, and West Virginia recorded a wetter-than-normal June, whereas the nine other states in the region experienced a drier-than-normal month.
Dryness expanded throughout the month in New England. The USDM at the beginning of June listed New Hampshire as the only state in the Northeast that was abnormally dry. By the end of the month, 30 percent of the Northeast was abnormally dry, with moderate drought impacting six percent of the region, in the southern parts of Vermont, New Hampshire, and Maine. A water ban in Northampton, Massachusetts came into effect starting June 15 as a result of the increasingly dry conditions throughout the area. This also prompted over 75 Public Water Suppliers to enforce varying degrees of water bans in other locations throughout Massachusetts.
As summarized by the Western Regional Climate Center, the northern Intermountain West remained cooler than normal throughout June, while summer heat scorched the southwestern US with well-above-normal temperatures. Precipitation was well above normal in the northern Rockies, and, with the aid of tropical moisture, above-average precipitation briefly relieved localized regions across the drought stricken Southwest.
Several storms brought significant precipitation to the northern Rockies throughout the month of June. Areas located in central and eastern Idaho, central and western Montana, and western Wyoming all received well-above-normal precipitation. While to the south, extreme to exceptional drought continued to impact the Four Corners region throughout June. However, some relief was seen in eastern Arizona and western New Mexico as remnant moisture from Hurricane Bud was lifted through the Gulf of California and into the Four Corners region. For some locations, this event produced the first measurable precipitation since February, 2018. Tucson, AZ, for example, broke its streak of no measurable precipitation in 100+ days, with a two-day sum of 0.91 inch (23.11 mm) of rain between June 15th-16th. Meanwhile, the majority of California, Nevada, and Utah observed below-normal precipitation. This has aided in the production of 14 large wildfires spread across these three states burning a current total of 117,044 acres (18,075.3 ha).
In total, 32 large fires were burning across eight states in the West, including as far north as Washington and Oregon. Approximately 431,053 acres (174,440.96 ha) have burned to date from these fires. The fires have been fueled by the extremely dry brush across the region. Much of the Four Corners region continued to see extreme to exceptional drought with abnormally dry to severe drought conditions starting to extend into the Pacific Northwest.
After a cool and extended spring, June brought significant change to several locations across Alaska. The western half of Alaska observed warm, dry conditions, where more than 50 wildfires had been reported by mid-June in the western Alaskan interior. Eastern interior Alaska temperatures remained near normal to slightly below normal; however, precipitation was well below normal for the month of June. Fairbanks, AK, for instance, observed only 47 percent of normal precipitation. South central Alaska and the panhandle observed near normal temperatures; however, precipitation was well above normal in southcentral Alaska and below normal in the Alaskan Panhandle. For example, Valdez, AK, located in southcentral Alaska, observed monthly sum of 8.88 inches (225.55 mm) of rain; while Juneau, AK, located in the panhandle, observed a monthly sum of 3.07 inches (77.97 mm), narrowly reaching the 50th percentile.
In the eastern Pacific Ocean, Hawaii observed near-normal temperatures, with the exception of above-normal temperatures observed on the island of Molokai. In addition to the calm, warm weather, most of Hawaii observed well-below-normal precipitation. However, windward locations on the Big Island observed near-normal to above-normal precipitation.
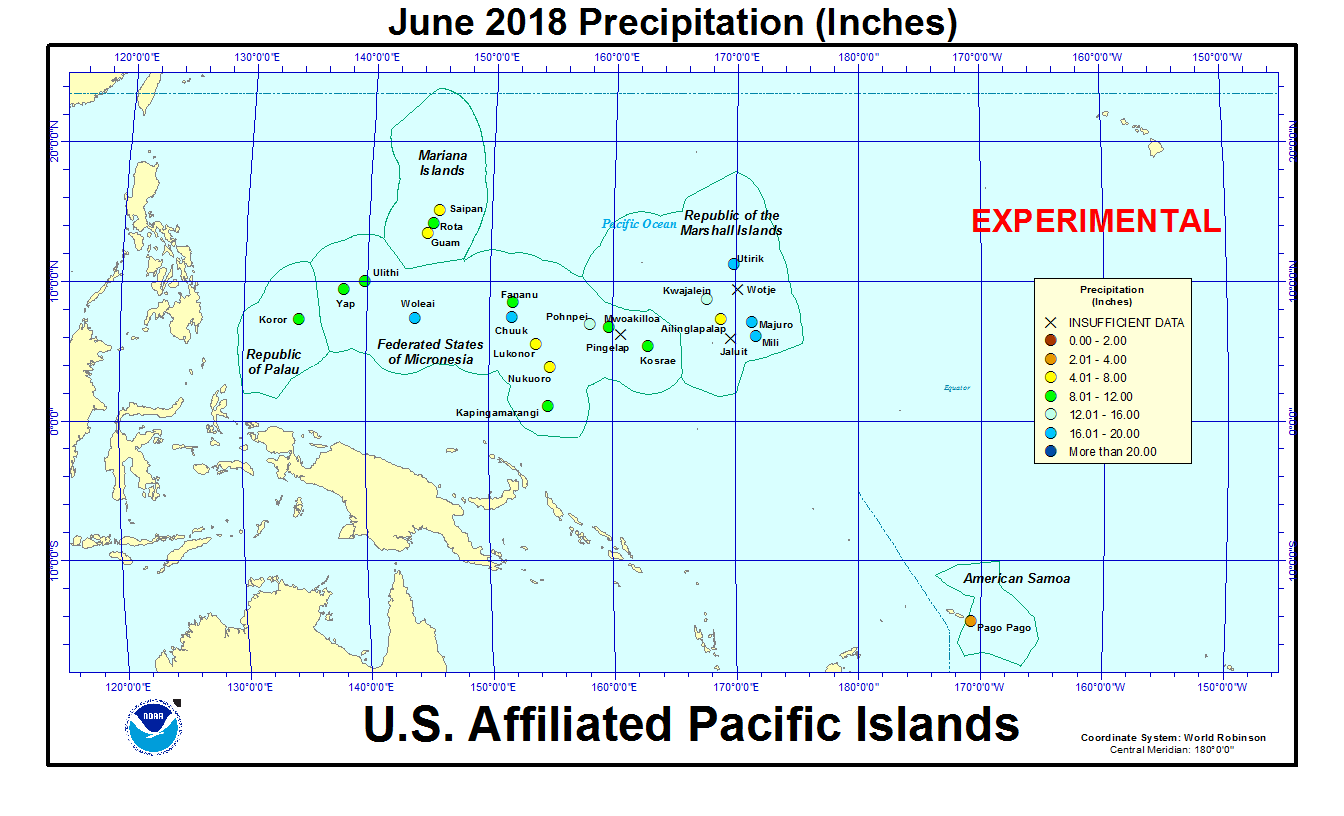
Pacific Islands: The NOAA National Weather Service (NWS) offices, the Pacific ENSO Applications Climate Center (PEAC), and partners provided reports on conditions across the Pacific Islands.
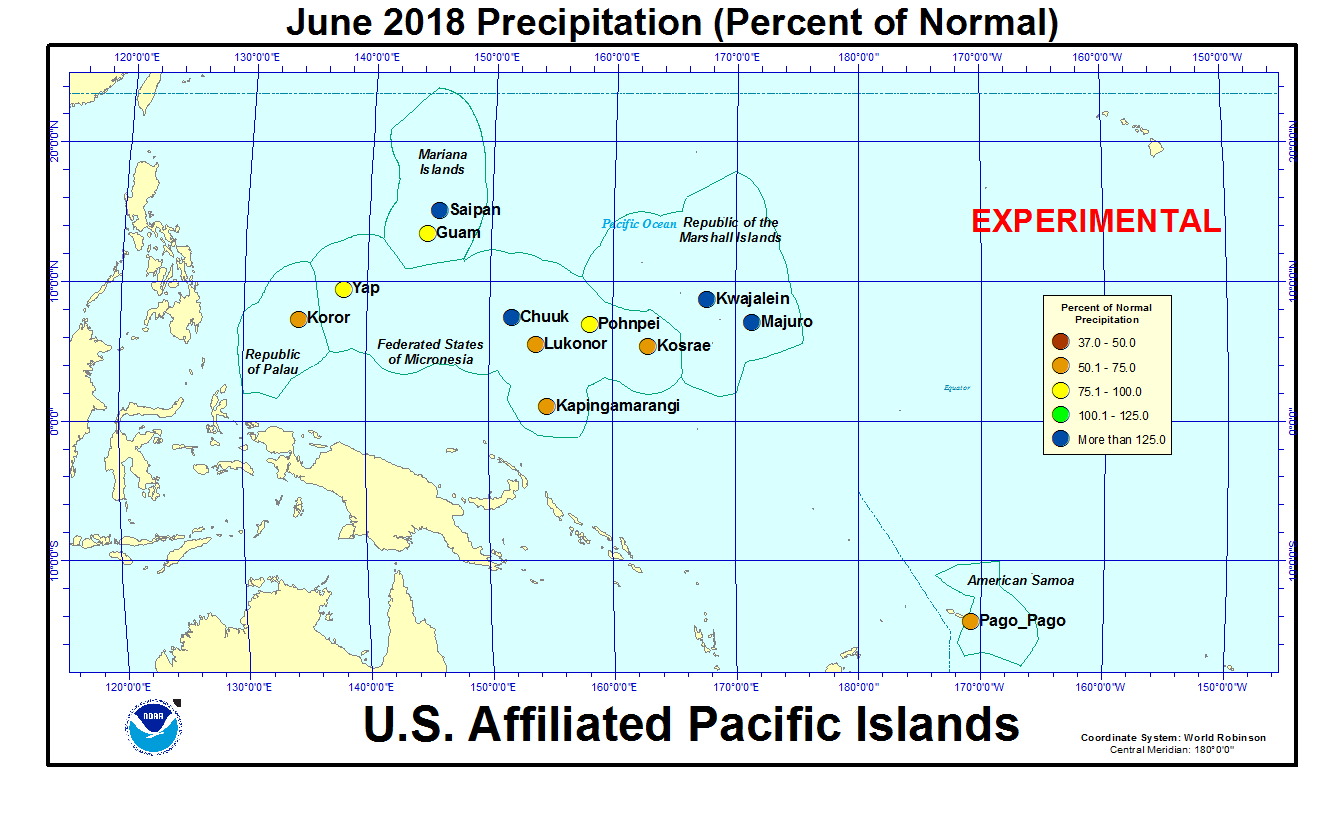
In the U.S. Affiliated Pacific Islands (USAPI) (maps — Federated States of Micronesia [FSM], Northern Mariana Islands, Marshall Islands [RMI], Republic of Palau, American Samoa, basinwide), June 2018 was drier than normal at Guam, Kapingamarangi, Koror, Kosrae, Lukonor, Pago Pago, Pohnpei, and Yap, and wetter than normal at Chuuk, Kwajalein, Majuro, and Saipan.
Rainfall amounts were below the minimum thresholds (4 or 8 inches) required to meet most monthly water needs at Lukonor and Nukuoro (in the FSM), Ailinglapalap (in the RMI), and Pago Pago (in American Samoa). June rainfall was above the monthly minimum thresholds at the rest of the regular reporting stations in Micronesia. The 4- and 8-inch thresholds are important because, if monthly precipitation falls below the threshold, then water shortages or drought become a concern.
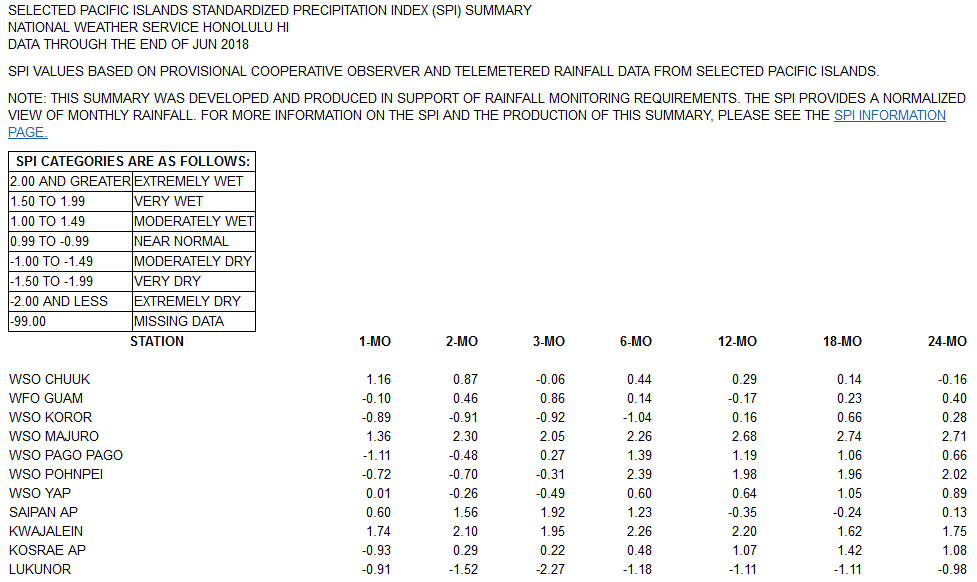
Pago Pago had the sixth driest June out of 53 years of data and Fananu the driest June (but out of only 6 years of data). Lukonor has been dry at many time scales, including fourth driest June (out of 34 years of data), second driest May-June and April-June (out of 34 years of data), and fifth driest July-June (21 years). Nukuoro had the third driest June out of 36 years of data, second driest May-June (35 years), and third driest April-June and March-June (35 years). Ulithi ranked sixth driest (out of 36 years of data) for May-June. Ailinglapalap ranked fifth driest for June (out of 35 years), fourth driest for May-June (35 years), and eighth driest July-June (32 years). On the other hand, June 2018 was the wettest June on record at Utirik (out of 14 years), and second wettest at Kwajalein (67 years) and Mili (34 years). The last 12 months were the wettest July-June on record for Pohnpei (67 years), Kwajalein (66 years), and Majuro (64 years).
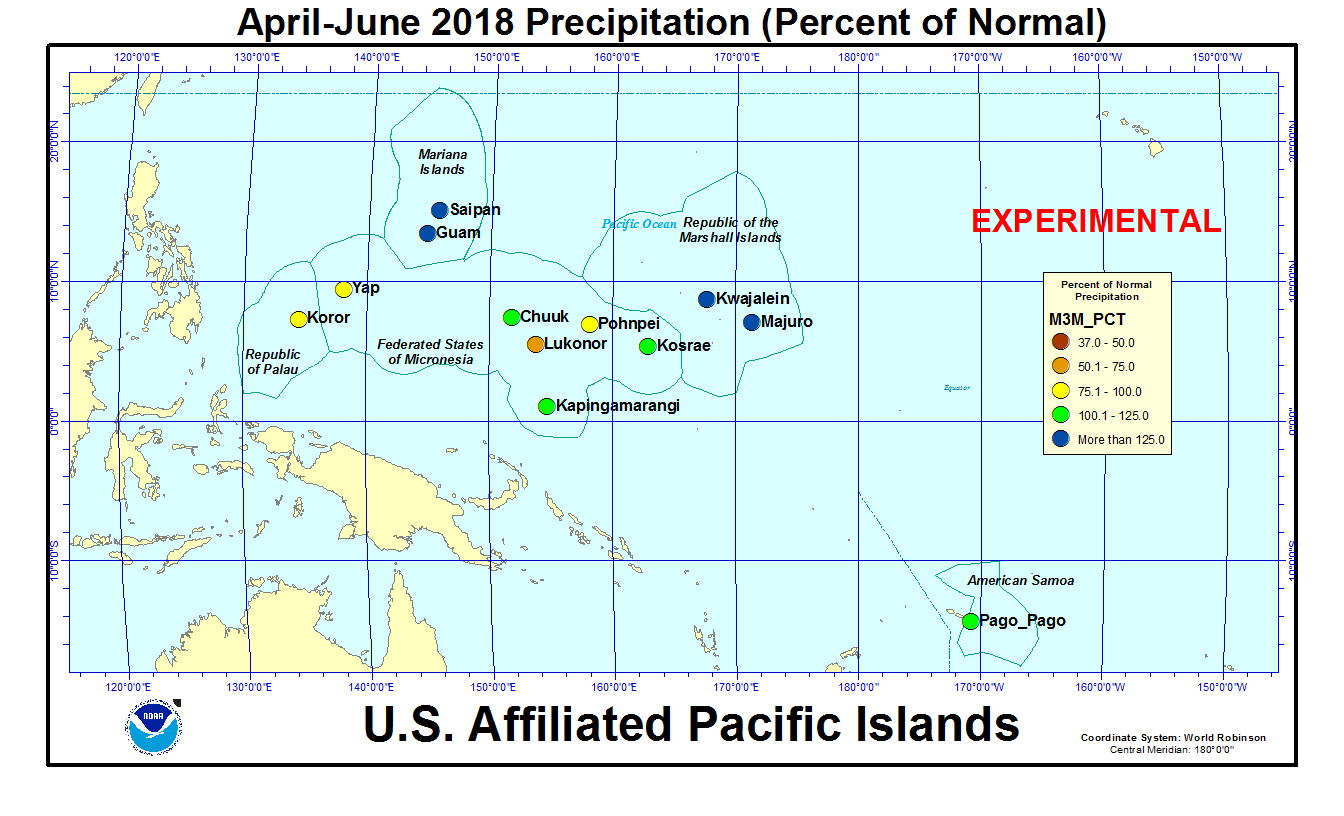
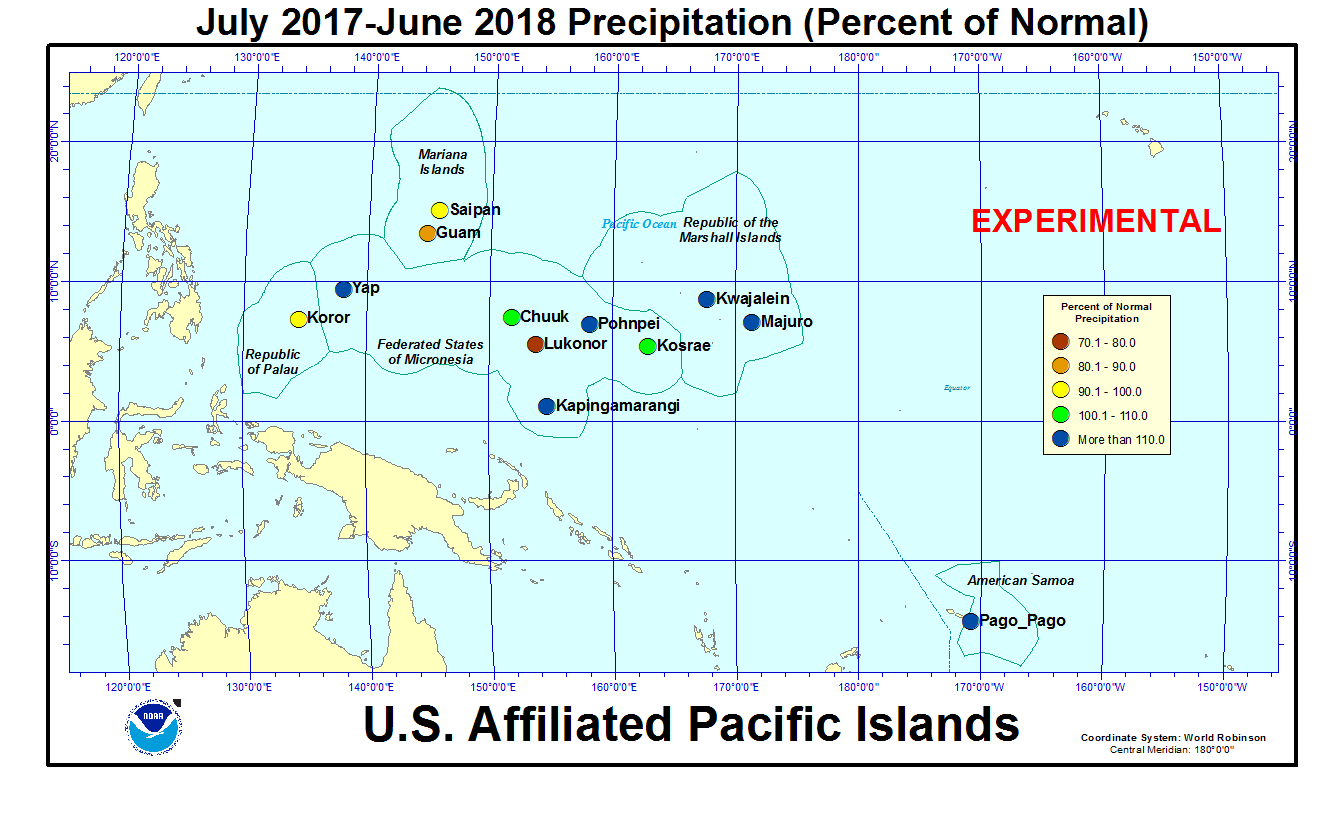
As measured by percent of normal precipitation, Koror and Lukonor have been drier than normal in the short term (June and the last 3 months [April-June 2018]) as well as the long term (year to date [January-June] and last 12 months [July 2017-June 2018]). Pohnpei and Yap were drier than normal in the short-term (June and April-June) but wetter than normal for the longer-term time scales (last 6 and 12 months). Guam was drier than normal for June and July-June, but wetter than normal for the other 2 time scales. Kapingamarangi, Kosrae, and Pago Pago were drier than normal for June, but near to wetter than normal for the other 3 time periods. Saipan was drier than normal for the long-term (July-June), but wetter than normal for the other 3 time periods. Chuuk, Kwajalein, and Majuro were near to wetter than normal at all 4 time scales.
| Station Name | Jul 2017 | Aug 2017 | Sep 2017 | Oct 2017 | Nov 2017 | Dec 2017 | Jan 2018 | Feb 2018 | Mar 2018 | Apr 2018 | May 2018 | Jun 2018 | Jul- Jun |
|---|---|---|---|---|---|---|---|---|---|---|---|---|---|
| Chuuk | 99% | 91% | 110% | 127% | 105% | 120% | 99% | 175% | 131% | 45% | 124% | 143% | 106% |
| Guam NAS | 97% | 66% | 118% | 161% | 57% | 88% | 23% | 90% | 68% | 316% | 240% | 88% | 89% |
| Kapingamarangi | 102% | 41% | 92% | 72% | 64% | 420% | 95% | 222% | 171% | 127% | 92% | 67% | 114% |
| Koror | 130% | 104% | 161% | 118% | 84% | 160% | 82% | 105% | 37% | 113% | 92% | 66% | 98% |
| Kosrae | 104% | 93% | 155% | 143% | 168% | 123% | 100% | 147% | 181% | 105% | 136% | 74% | 106% |
| Kwajalein | 70% | 64% | 205% | 88% | 83% | 71% | 458% | 159% | 662% | 229% | 332% | 227% | 159% |
| Lukonor | 103% | 63% | 84% | 116% | 136% | 70% | 129% | 106% | 84% | 56% | 61% | 67% | 77% |
| Majuro | 112% | 111% | 187% | 143% | 76% | 172% | 204% | 120% | 343% | 189% | 216% | 151% | 158% |
| Pago Pago | 84% | 145% | 96% | 217% | 127% | 94% | 115% | 271% | 60% | 189% | 96% | 61% | 118% |
| Pohnpei | 113% | 55% | 122% | 81% | 95% | 130% | 167% | 219% | 440% | 102% | 85% | 92% | 131% |
| Saipan | 72% | 65% | 84% | 66% | 62% | 60% | 117% | 87% | 49% | 332% | 384% | 161% | 94% |
| Yap | 121% | 55% | 93% | 156% | 106% | 132% | 182% | 163% | 270% | 67% | 94% | 97% | 111% |
| Station Name | Jul 2017 | Aug 2017 | Sep 2017 | Oct 2017 | Nov 2017 | Dec 2017 | Jan 2018 | Feb 2018 | Mar 2018 | Apr 2018 | May 2018 | Jun 2018 | Jul- Jun |
|---|---|---|---|---|---|---|---|---|---|---|---|---|---|
| Chuuk | 11.86" | 11.65" | 12.92" | 14.64" | 11.15" | 13.52" | 10.01" | 12.70" | 10.86" | 5.60" | 14.01" | 16.67" | 145.59" |
| Guam NAS | 9.86" | 9.73" | 14.92" | 18.47" | 4.23" | 4.49" | 0.94" | 2.72" | 1.40" | 7.99" | 8.15" | 5.42" | 88.32" |
| Kapingamarangi | 14.47" | 3.35" | 9.13" | 5.93" | 5.95" | 41.30" | 8.71" | 20.59" | 19.60" | 17.39" | 11.08" | 9.17" | 166.67" |
| Koror | 24.14" | 13.98" | 18.90" | 14.03" | 9.55" | 17.89" | 8.38" | 9.03" | 2.75" | 8.25" | 10.91" | 11.60" | 149.41" |
| Kosrae | 15.57" | 13.23" | 22.02" | 15.65" | 23.21" | 19.85" | 16.62" | 19.03" | 29.00" | 18.45" | 24.16" | 10.77" | 227.56" |
| Kwajalein | 6.91" | 6.28" | 22.06" | 9.83" | 9.40" | 4.72" | 14.46" | 4.20" | 15.55" | 12.05" | 22.33" | 15.75" | 143.54" |
| Lukonor | 16.47" | 8.88" | 8.51" | 13.10" | 12.38" | 7.90" | 10.83" | 9.50" | 7.76" | 6.28" | 7.14" | 7.83" | 116.58" |
| Majuro | 12.52" | 13.00" | 20.93" | 18.21" | 10.27" | 19.59" | 15.76" | 8.29" | 22.54" | 17.79" | 21.81" | 16.62" | 197.33" |
| Pago Pago | 4.66" | 7.78" | 6.26" | 20.11" | 12.89" | 12.06" | 15.37" | 32.47" | 6.36" | 17.76" | 9.26" | 3.24" | 148.22" |
| Pohnpei | 17.45" | 7.82" | 15.27" | 12.31" | 14.13" | 20.86" | 22.03" | 20.94" | 57.92" | 18.80" | 16.91" | 13.58" | 238.02" |
| Saipan | 6.45" | 8.59" | 8.47" | 7.01" | 3.48" | 2.31" | 2.97" | 2.25" | 0.93" | 8.72" | 9.14" | 5.83" | 66.15" |
| Yap | 18.27" | 8.20" | 12.59" | 18.99" | 9.40" | 11.27" | 11.64" | 8.44" | 12.29" | 3.80" | 7.41" | 11.67" | 133.97" |
| Station Name | Jul 2017 | Aug 2017 | Sep 2017 | Oct 2017 | Nov 2017 | Dec 2017 | Jan 2018 | Feb 2018 | Mar 2018 | Apr 2018 | May 2018 | Jun 2018 | Jul- Jun |
|---|---|---|---|---|---|---|---|---|---|---|---|---|---|
| Chuuk | 11.98" | 12.86" | 11.71" | 11.51" | 10.61" | 11.25" | 10.10" | 7.25" | 8.32" | 12.47" | 11.30" | 11.66" | 136.77" |
| Guam NAS | 10.14" | 14.74" | 12.66" | 11.44" | 7.38" | 5.11" | 4.01" | 3.03" | 2.07" | 2.53" | 3.40" | 6.18" | 99.09" |
| Kapingamarangi | 14.15" | 8.13" | 9.93" | 8.19" | 9.27" | 9.84" | 9.15" | 9.27" | 11.43" | 13.64" | 12.08" | 13.78" | 145.85" |
| Koror | 18.53" | 13.50" | 11.77" | 11.84" | 11.39" | 11.16" | 10.18" | 8.56" | 7.44" | 7.32" | 11.83" | 17.48" | 152.90" |
| Kosrae | 14.91" | 14.22" | 14.22" | 10.94" | 13.83" | 16.11" | 16.67" | 12.93" | 16.06" | 17.51" | 17.75" | 14.64" | 213.87" |
| Kwajalein | 9.87" | 9.74" | 10.74" | 11.18" | 11.28" | 6.66" | 3.16" | 2.64" | 2.35" | 5.26" | 6.72" | 6.93" | 90.41" |
| Lukonor | 15.93" | 14.04" | 10.15" | 11.32" | 9.08" | 11.27" | 8.41" | 8.93" | 9.26" | 11.31" | 11.69" | 11.65" | 151.36" |
| Majuro | 11.17" | 11.69" | 11.17" | 12.73" | 13.44" | 11.39" | 7.74" | 6.88" | 6.58" | 9.42" | 10.11" | 11.01" | 125.25" |
| Pago Pago | 5.55" | 5.38" | 6.53" | 9.26" | 10.14" | 12.84" | 13.34" | 12.00" | 10.68" | 9.39" | 9.66" | 5.33" | 125.57" |
| Pohnpei | 15.43" | 14.26" | 12.55" | 15.27" | 14.83" | 16.08" | 13.18" | 9.55" | 13.17" | 18.41" | 19.96" | 14.81" | 182.36" |
| Saipan | 8.91" | 13.13" | 10.09" | 10.62" | 5.61" | 3.85" | 2.53" | 2.59" | 1.89" | 2.63" | 2.38" | 3.62" | 70.25" |
| Yap | 15.08" | 14.82" | 13.50" | 12.18" | 8.83" | 8.51" | 6.39" | 5.19" | 4.56" | 5.63" | 7.85" | 12.04" | 120.31" |
The following analysis of historical data for the USAPI stations in the Global Historical Climatology Network-Daily (GHCN-D) dataset, augmented with fill-in data from the 1981-2010 Normals, helps put the current data into historical perspective by computing ranks based on the period of record. The table below lists the precipitation ranks for June 2018, January-June 2018 (last 6 months), and July 2017-June 2018 (the last 12 months). Some stations have a long period of record and their dataset is fairly complete, while other stations have a shorter period of record and the dataset has some missing data.
Rank of 1 = driest.
| Station | Jun 2018 Rank |
Jun No. of Years |
Jan- Jun 2018 Rank |
Jan- Jun No. of Years |
Jul 2017- Jun 2018 Rank |
Jul- Jun No. of Years |
Period of Record |
| Jaluit | MSG | 35 | MSG | 35 | MSG | 33 | 1981-2018 |
| Koror | 13 | 67 | 13 | 67 | 29 | 67 | 1951-2018 |
| Woleai | 32 | 36 | 22 | 28 | 10 | 21 | 1968-2018 |
| Yap | 36 | 67 | 47 | 67 | 48 | 67 | 1951-2018 |
| Majuro | 62 | 65 | 64 | 64 | 64 | 64 | 1954-2018 |
| Mili | 33 | 34 | 30 | 34 | MSG | 31 | 1981-2018 |
| Ulithi | 10 | 36 | 16 | 34 | 25 | 33 | 1981-2018 |
| Ailinglapalap | 5 | 35 | 20 | 35 | 8 | 32 | 1981-2018 |
| Kosrae | 9 | 51 | 26 | 40 | 24 | 32 | 1954-2018 |
| Lukonor | 4 | 34 | 4 | 34 | 5 | 21 | 1981-2018 |
| Saipan | 31 | 38 | 37 | 37 | 10 | 29 | 1981-2018 |
| Pohnpei | 17 | 67 | 67 | 67 | 67 | 67 | 1951-2018 |
| Kwajalein | 66 | 67 | 66 | 66 | 66 | 66 | 1952-2018 |
| Kapingamarangi | 10 | 28 | 18 | 22 | 14 | 15 | 1962-2018 |
| Chuuk | 60 | 67 | 45 | 67 | 37 | 67 | 1951-2018 |
| Guam | 23 | 62 | 32 | 61 | 17 | 61 | 1957-2018 |
| Nukuoro | 3 | 36 | 8 | 35 | 20 | 33 | 1981-2018 |
| Pago Pago | 6 | 53 | 49 | 52 | 46 | 52 | 1966-2018 |
| Wotje | MSG | 35 | MSG | 35 | MSG | 32 | 1981-2018 |
| Utirik | 14 | 14 | 8 | 8 | 4 | 4 | 1985-2018 |

[top]
State/Regional/National Moisture Status
A detailed review of drought and moisture conditions is available for all contiguous U.S. states, the nine standard regions, and the nation (contiguous U.S.):
| northeast u. s. | east north central u. s. | central u. s. |
| southeast u. s. | west north central u. s. | south u. s. |
| southwest u. s. | northwest u. s. | west u. s. |
| Contiguous United States |
[top]
Contacts & Questions