Use the form below to select from a collection of monthly summaries recapping climate-related occurrences on both a global and national scale.
Drought ReportApril 2018
|
Contents Of This Report: |


|
Please note that the values presented in this report are based on preliminary data. They will change when the final data are processed, but will not be replaced on these pages.
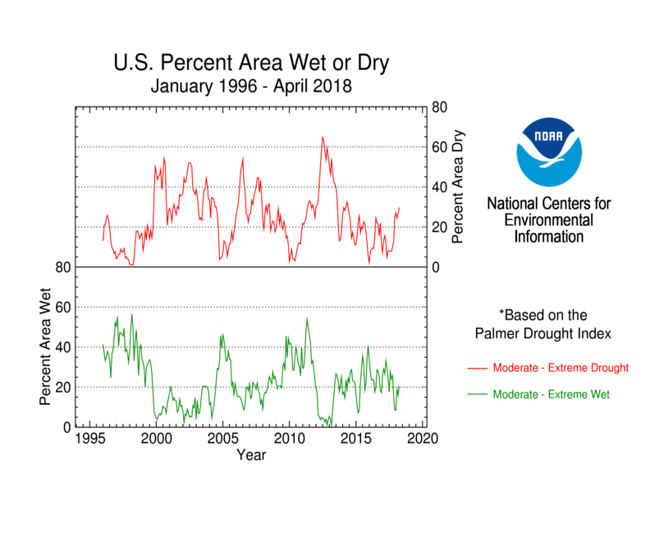
National Drought Overview
|
|
[top]
Detailed Drought Discussion
Overview
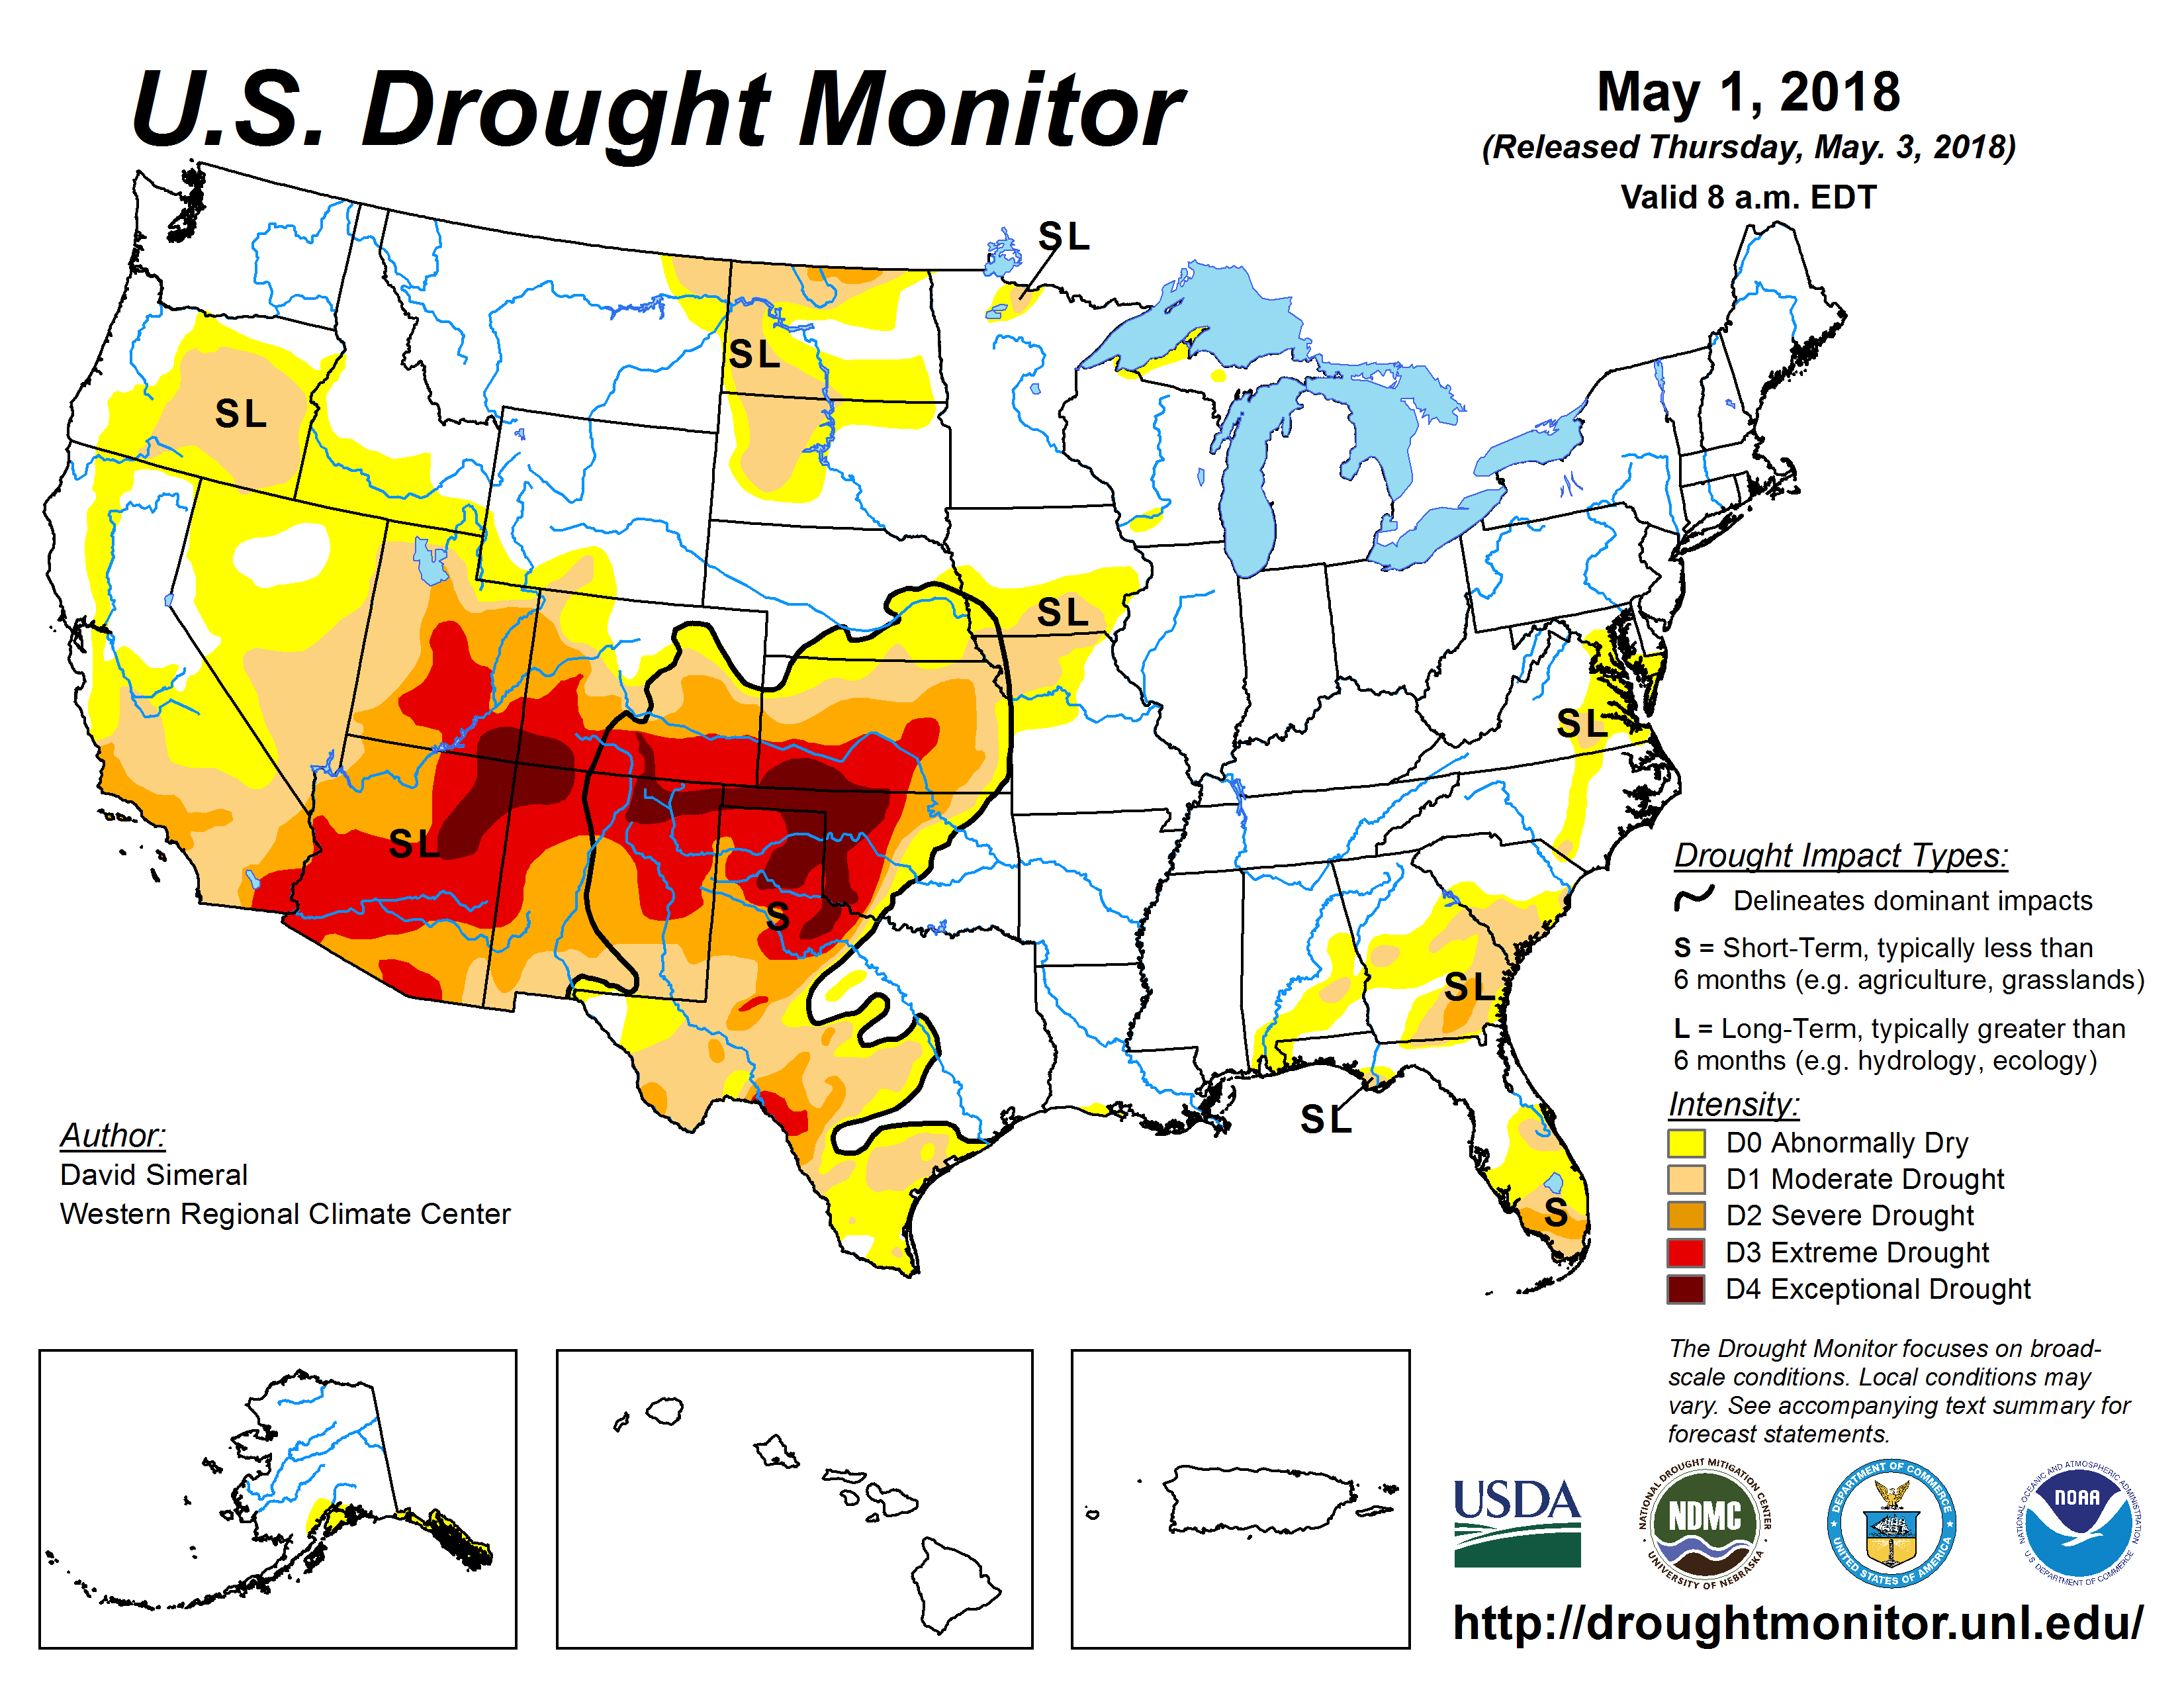
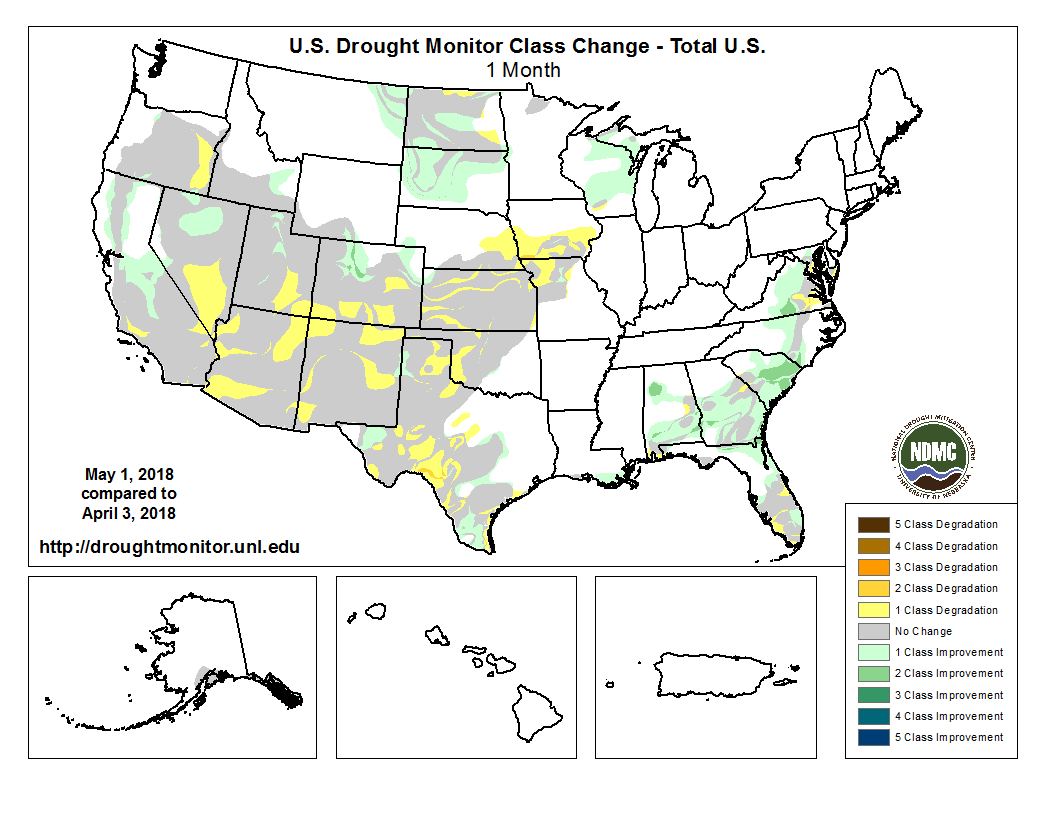
The U.S. Drought Monitor drought map valid May 1, 2018.
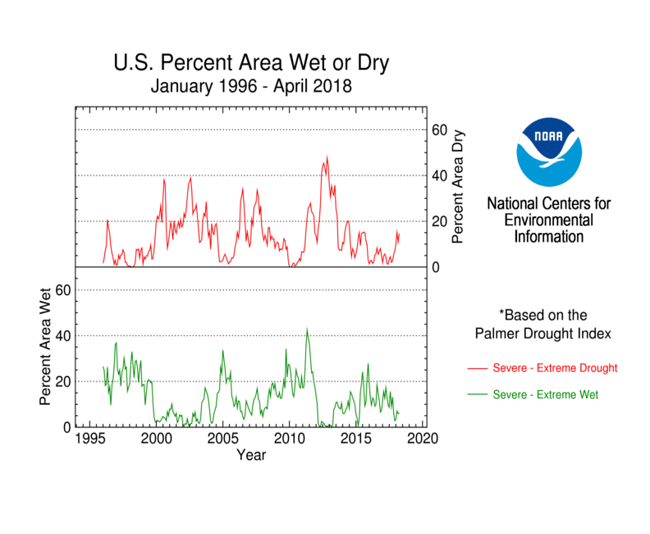
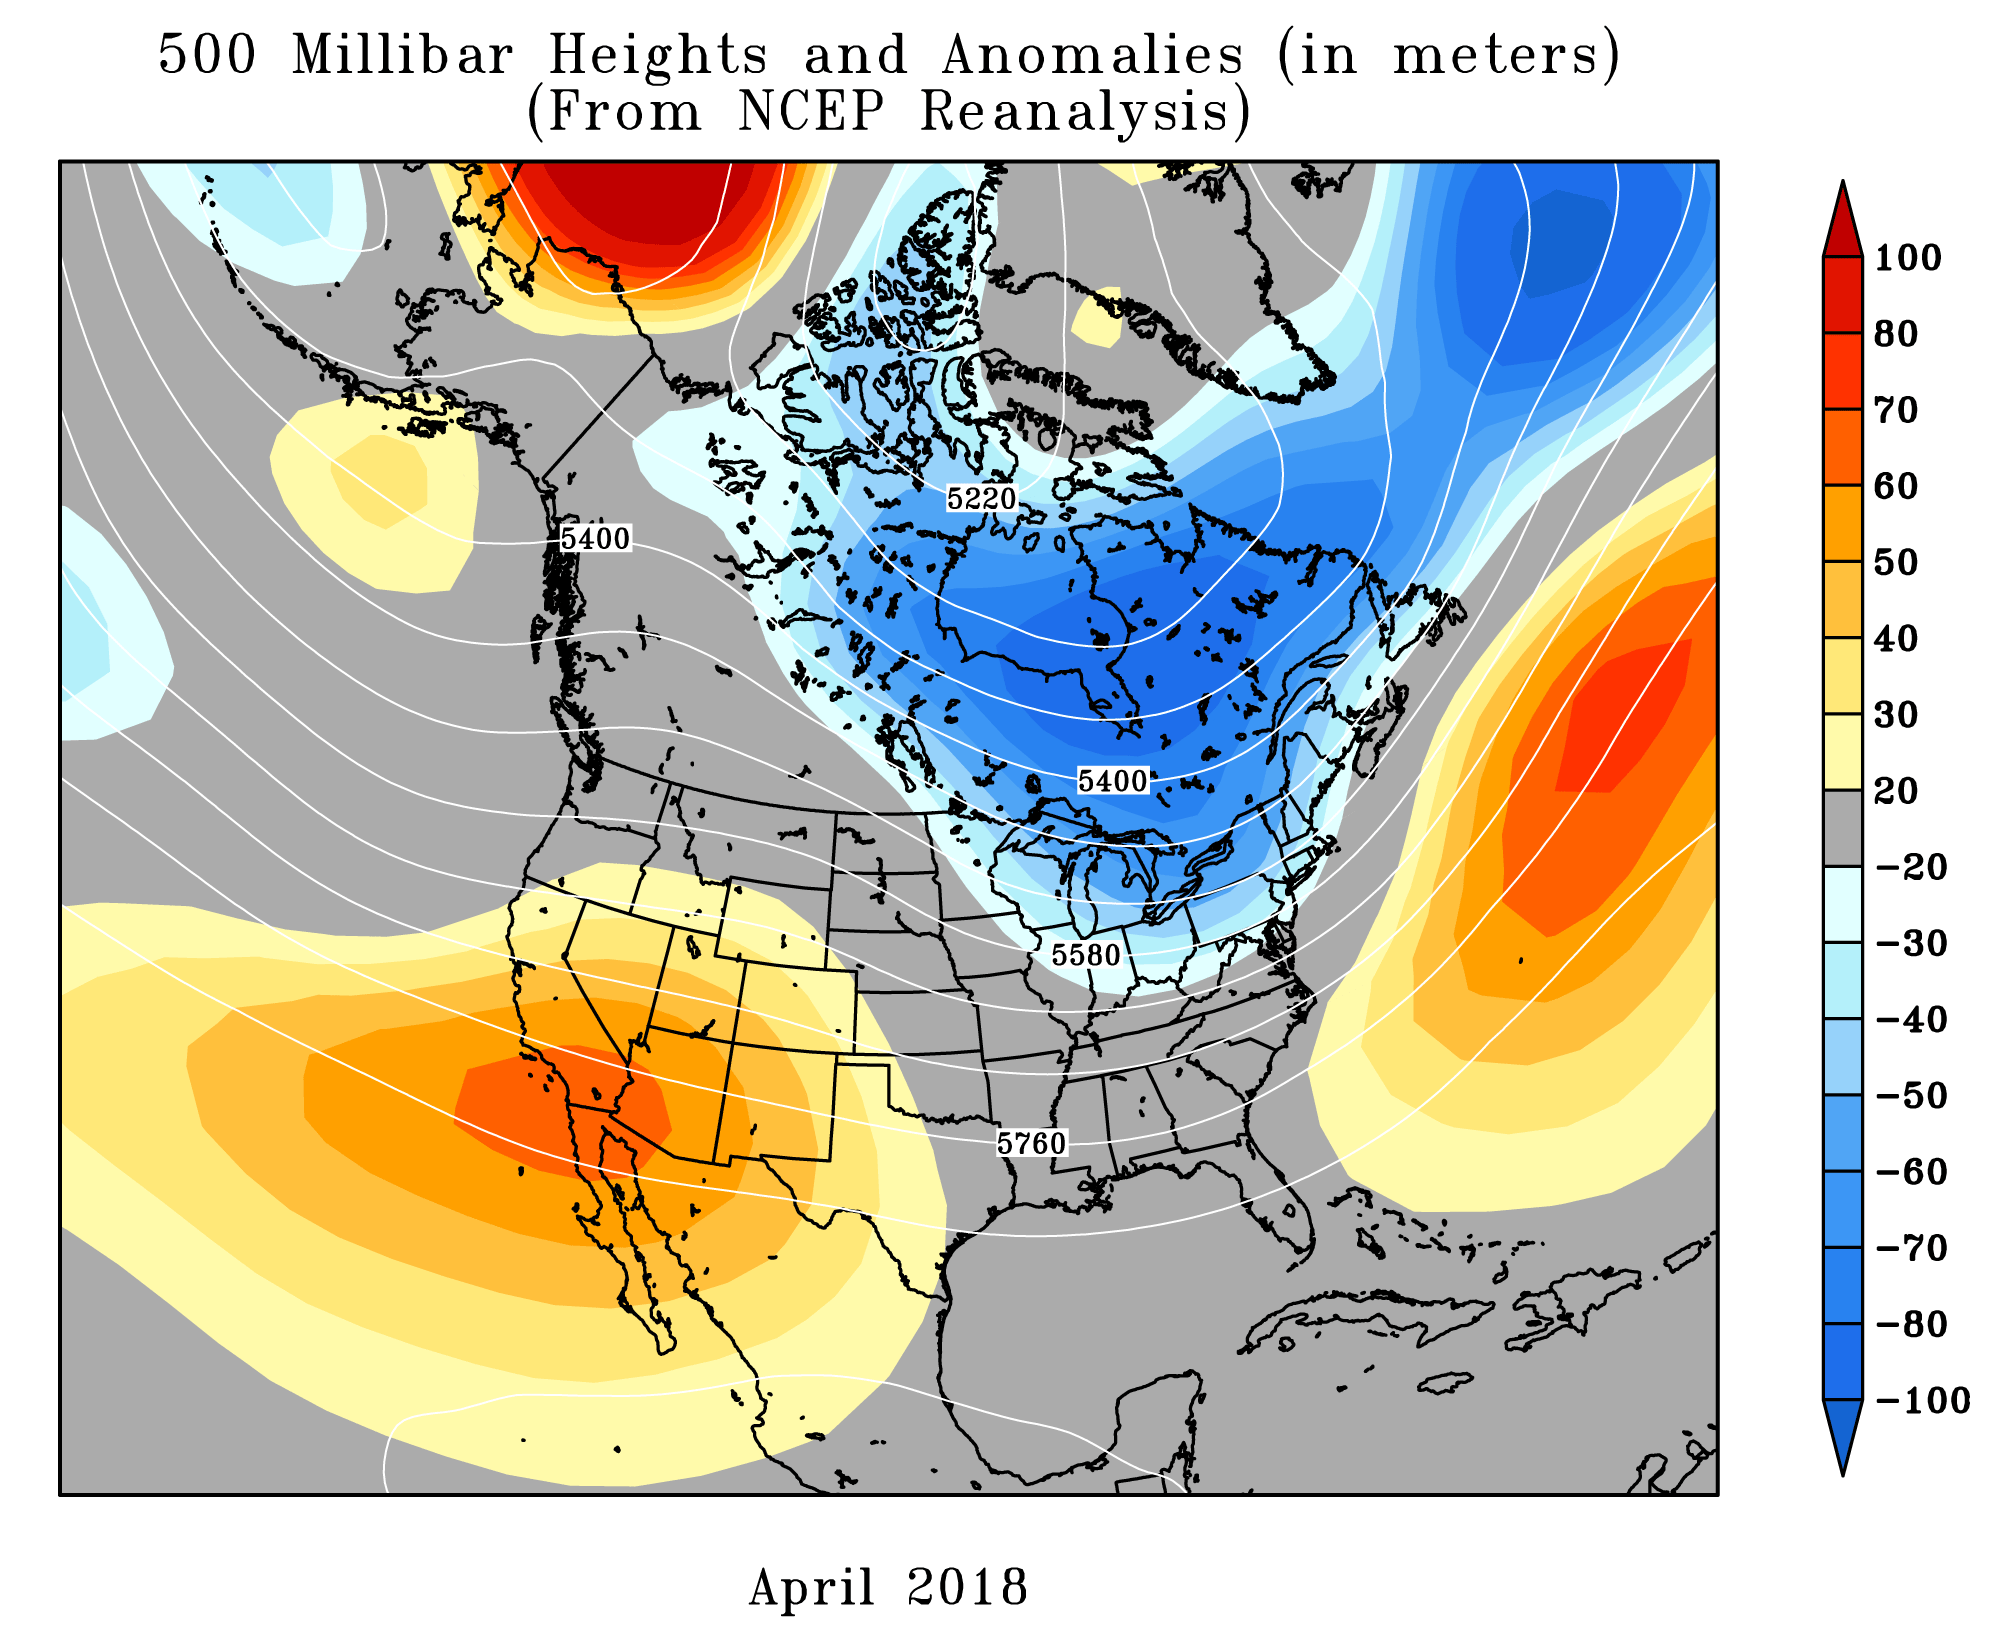
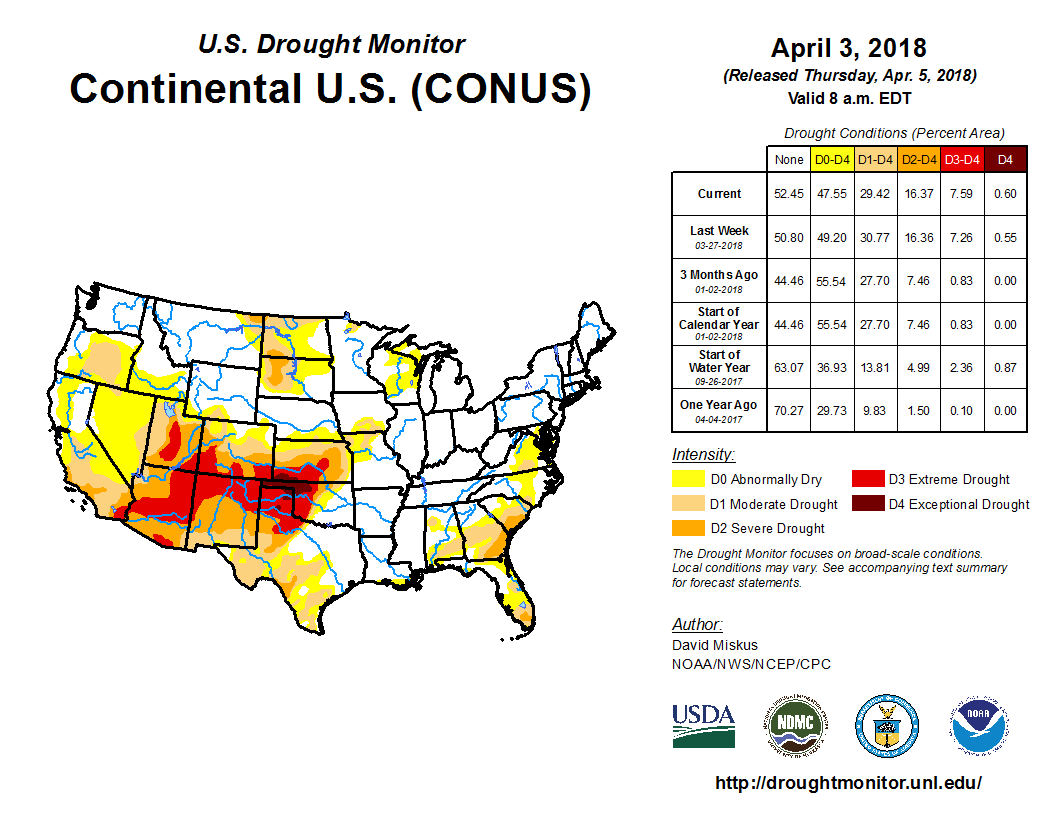
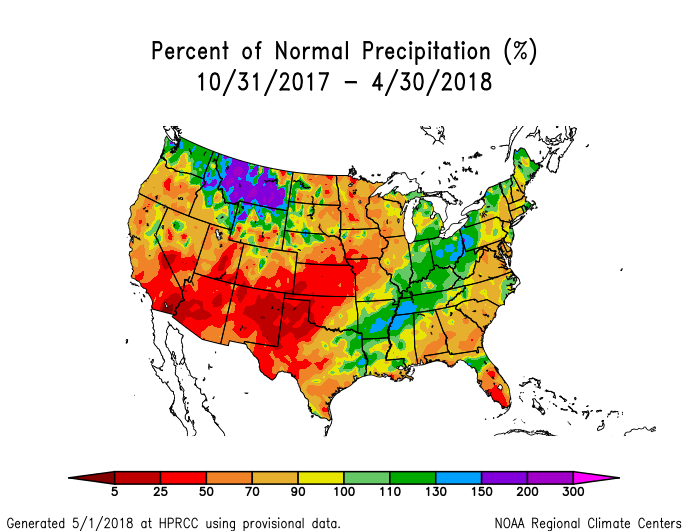
Like the last several months, the upper-level circulation pattern was quite active during April 2018 with ridge and trough patterns migrating through the jet stream flow over the CONUS. The monthly averaged circulation pattern ended up consisting of a slight long-wave ridge in the West and trough in the East, with colder-than-normal temperatures across most of the CONUS east of the Rockies and warmer-than-normal temperatures temperatures in the Southwest. The upper-level lows and troughs, and their associated surface lows and frontal systems, brought above-normal precipitation to parts of the Far West and northern Rockies to northern High Plains, and across the Lower Mississippi Valley to Appalachians, and along the East Coast. But the westerly flow dried out the Pacific systems as the crossed the coastal mountain ranges, resulting in drier-than-normal conditions across the Southwest to interior West, most of the Great Plains, and Mid- to Upper Mississippi Valley. The dry conditions during April were a continuation of persistent dryness since October in the southern High Plains to central Plains, and for much of the last 12 months in the Four Corners States (Standardized Precipitation Index maps for the last 1, 2, 3, 6, 9, 12 months). Drought and abnormal dryness contracted in the Far West and Southeast where April precipitation was above normal, and in the northern Plains where the last few months have seen improving moisture conditions. But drought and abnormal dryness expanded or intensified where the dry conditions continued, especially from the Southwest and southern Plains to Mid-Mississippi Valley. Contraction outweighed expansion again this month, but just barely, so the USDM-based national moderate-to-exceptional drought footprint across the CONUS shrank from 29.4 percent of the CONUS at the end of March to 28.6 percent of the CONUS at the end of April (from 25.0 percent to 23.9 percent for all of the U.S.). According to the Palmer Drought Index, which goes back to the beginning of the 20th century, about 29.8 percent of the CONUS was in moderate to extreme drought at the end of April, increasing about 3.1 percent from the 26.7 percent at the end of March.

Drought conditions at the end of the month, as depicted on the May 1st, 2018 USDM map, included the following core drought and abnormally dry areas:
-
A large area of abnormal dryness (D0) to severe (D2) drought stretched from Oregon and California in the West to the southern and central Great Plains, with extreme (D3) to exceptional (D4) drought across the Four Corners States to Texas, Oklahoma, and Kansas. —
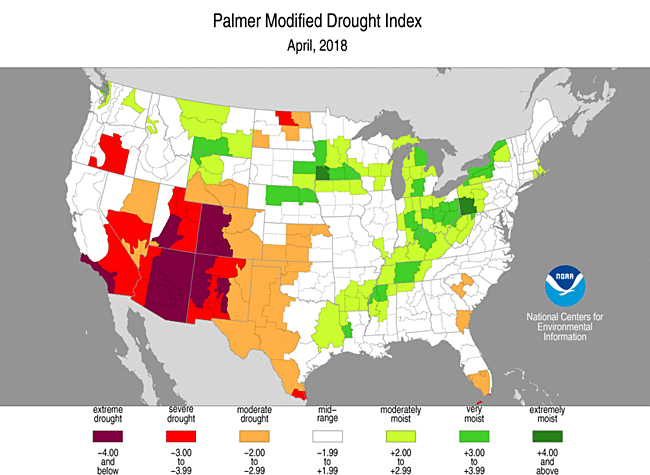
- The percent area of the West (from the Rockies to the West Coast) in moderate to extreme drought (based on the Palmer Drought Index) rapidly increased in December and continued to increase in January and February, growing from 21.5 percent at the end of October to 62.4 percent of the West at the end of February. Above-normal precipitation improved conditions in California and Nevada in March, so the Palmer percent area in drought shrank to 50.7 percent by the end of March. April was wet in northern California and northwest Nevada, and Washington to the northern Rockies, but extremely dry conditions across the rest of the West, especially the Southwest, expanded the drought area to 54.0 percent by the end of April.
- The D3-D4 areas are regions which have experienced the most severe precipitation deficits over the last six months based on the Standardized Precipitation Index (maps for the last 1, 2, 3, 6 months), and for some parts, the last 9 to 12 months.
- Abnormal dryness to severe drought continued in the northern Plains and the High Plains of Montana. — This status mainly reflected long-term precipitation deficits (last 6 to 12 months).
- Abnormal dryness to severe drought lingered in the Southeast, and abnormal dryness to moderate drought (D1) lingered in the Mid-Atlantic states.
- Abnormal dryness and moderate drought expanded in parts of the Midwest (Iowa-Missouri), while abnormal dryness contracted in other parts (western Great Lakes).
- Moderate drought was eliminated in the Alaska panhandle, but abnormal dryness continued there and in south central Alaska.
Hawaii and Puerto Rico continued free of drought and abnormal dryness on the USDM map.
Palmer Drought Index
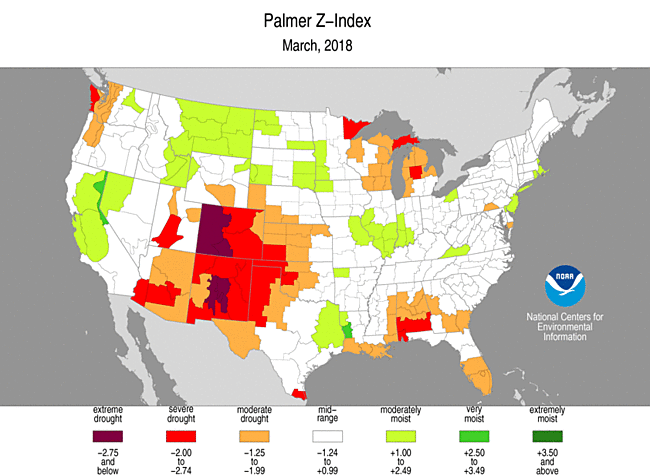
The Palmer drought indices measure the balance between moisture demand (evapotranspiration driven by temperature) and moisture supply (precipitation). The Palmer Z Index depicts moisture conditions for the current month, while the Palmer Hydrological Drought Index (PHDI) and Palmer Drought Severity Index (PDSI) depict the current month's cumulative moisture conditions integrated over the last several months. While both the PDSI and PHDI indices show long-term moisture conditions, the PDSI depicts meteorological drought while the PHDI depicts hydrological drought. The PDSI map shows less severe and extensive drought (as well as wet spell conditions) in some parts of the country than the PHDI map because the meteorological conditions that produce drought and wet spell conditions are not as long-lasting as the hydrological impacts.
|
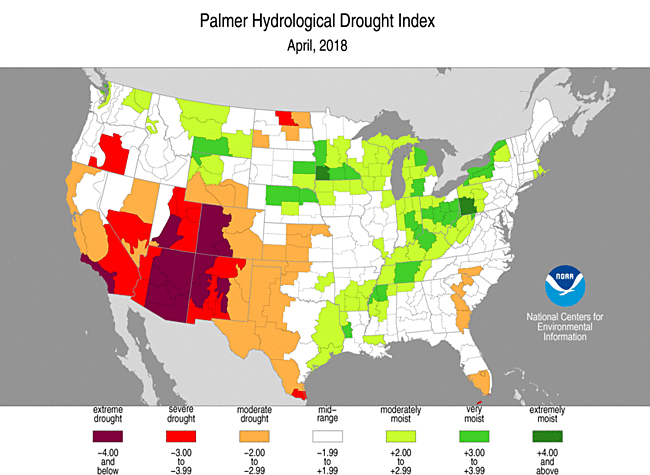 |
Used together, the Palmer Z Index and PHDI maps show that short-term dry conditions continued across the Southwest to southern Plains, expanding and intensifying previous long-term drought. Short-term dry conditions occurred in parts of the northern Plains, expanding previous long-term drought. Short-term wet conditions occurred in the Pacific Northwest and northern California, as well as parts of the Southeast, shrinking previous long-term drought.
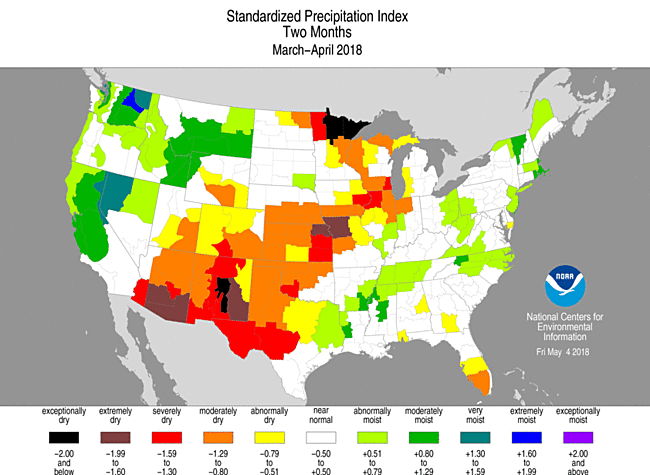
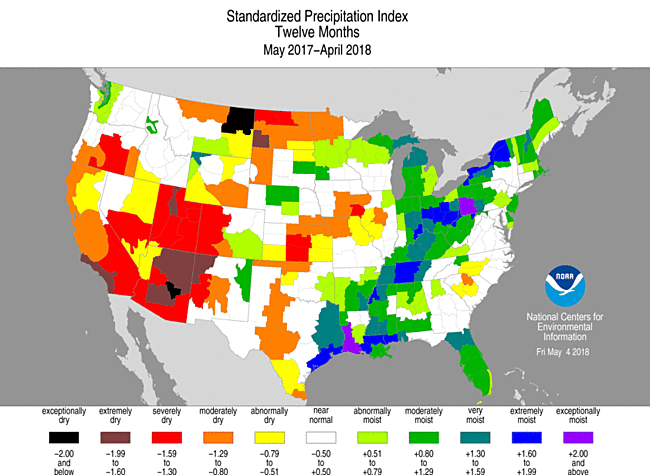
Standardized Precipitation Index
The Standardized Precipitation Index (SPI) measures moisture supply. The SPI maps here show the spatial extent of anomalously wet and dry areas at time scales ranging from 1 month to 24 months.
 |
 |
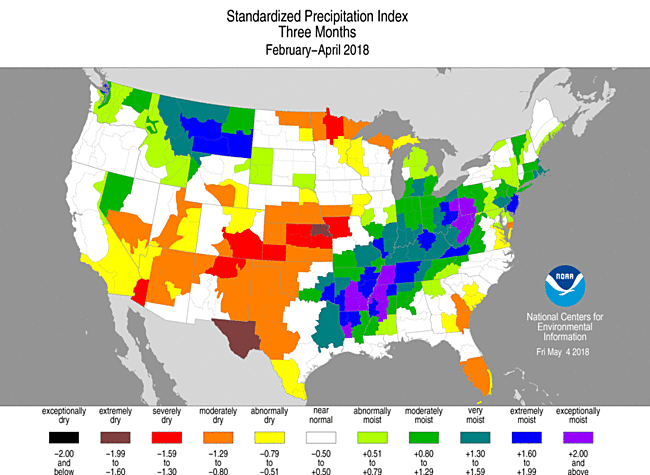 |

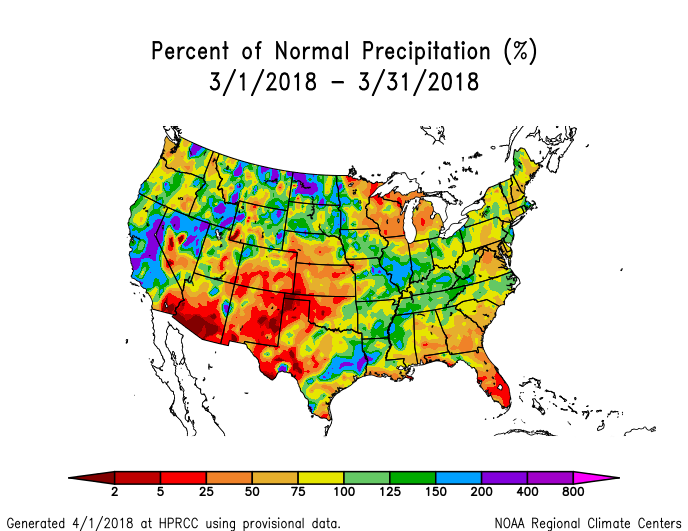
The SPI maps illustrate how moisture conditions have varied considerably through time and space over the last two years. Dryness across the southern and central Plains to the Southwest is evident on the 1- to 6-month maps, from the Southwest to California and Oregon on the 9- to 12-month maps, and in parts of the Southwest (Four Corners States) at 24 months. Parts of the southern Plains and central Plains to Mid-Mississippi Valley are dry at 9 to 12 months. Dryness can be seen in the northern Plains at every time scale from 1 month to 24 months. The western parts of the Midwest (Iowa to the western Great Lakes) have some degree of dryness at 1 to 2 months and 6 to 12 months. Some areas of dryness are evident in the Southeast and Mid-Atlantic regions at 2 to 12 months, with widespread dryness in the Southeast at 6 and 24 months. Parts of the Northeast show dryness at 6, 9, and 24 months.
 |
 |
 |
Regional Discussion

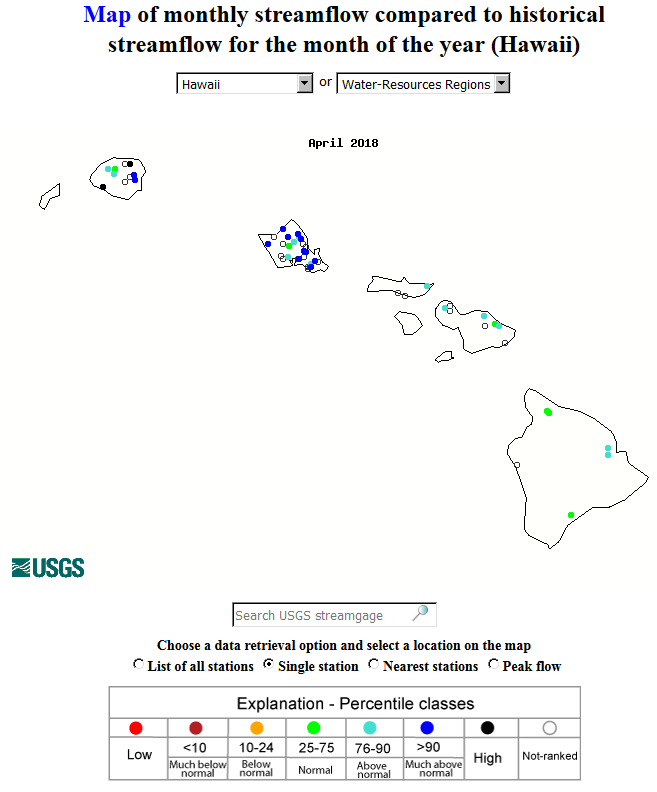
Map of percent of normal precipitation for Hawaii, April 2018.
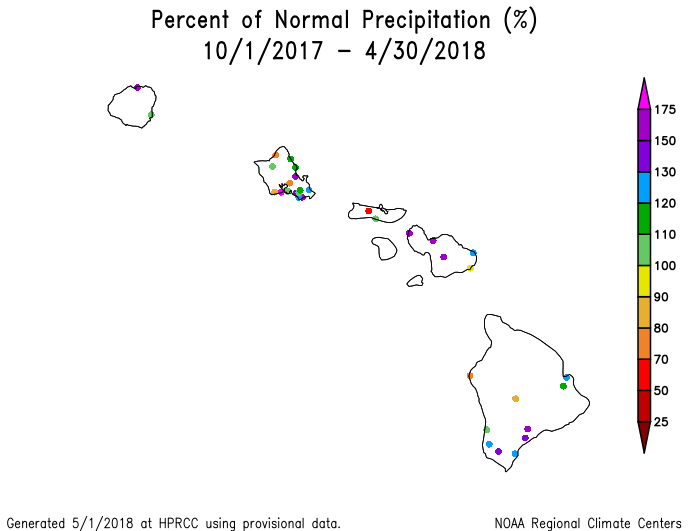
April 2018 was wetter than normal at most of the Hawaiian stations. The month was so wet that a wetter-than-normal signal dominated for most of the time periods (last 2, 3, 4, 6, 7, 10, 12, 24, and 36 months). Dryness was evident at some stations at the longer time scales (last 24 and 36 months). Streamflow was mostly near to above normal. Abnormal dryness and drought were absent from the state, as seen on the May 1st, 2018 USDM map.

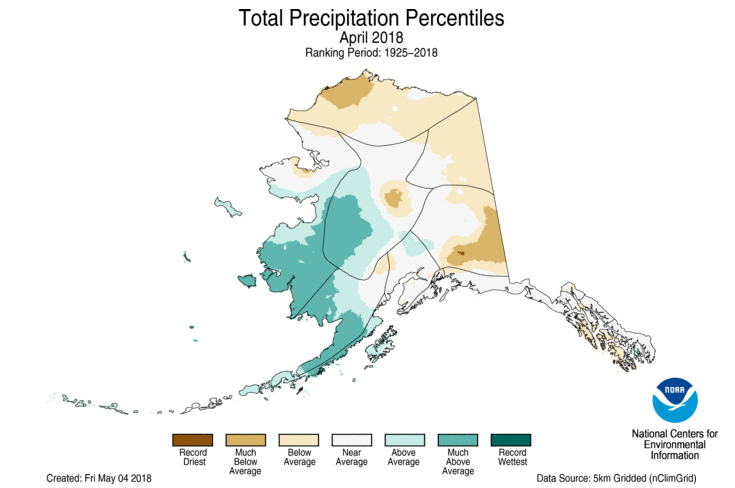
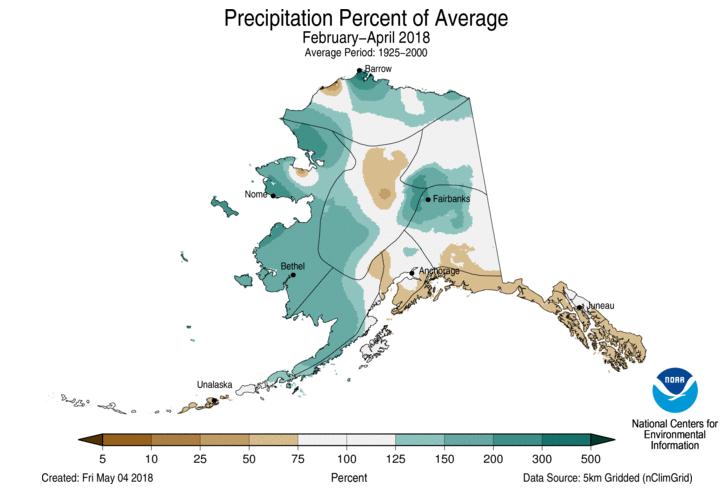
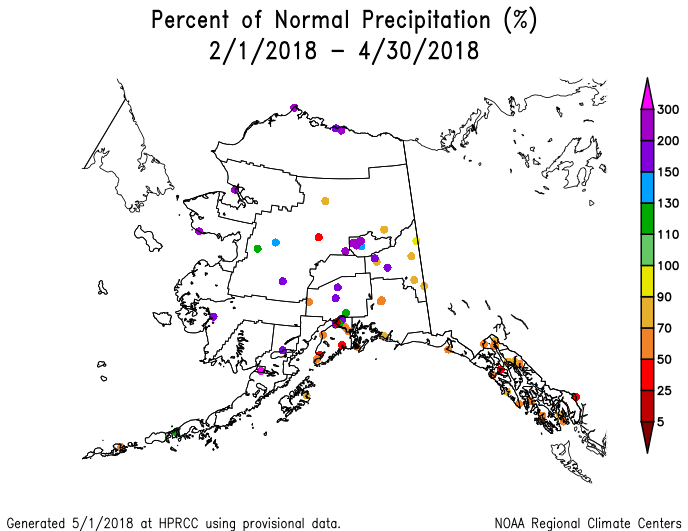
Alaska gridded precipitation rank map, February-April 2018.
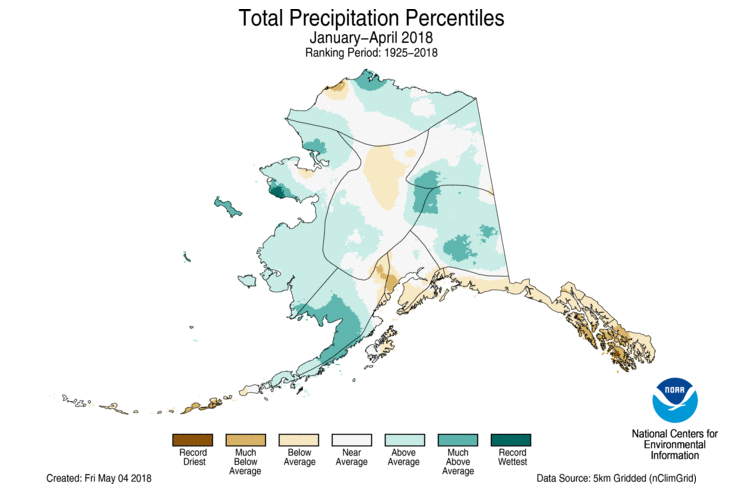
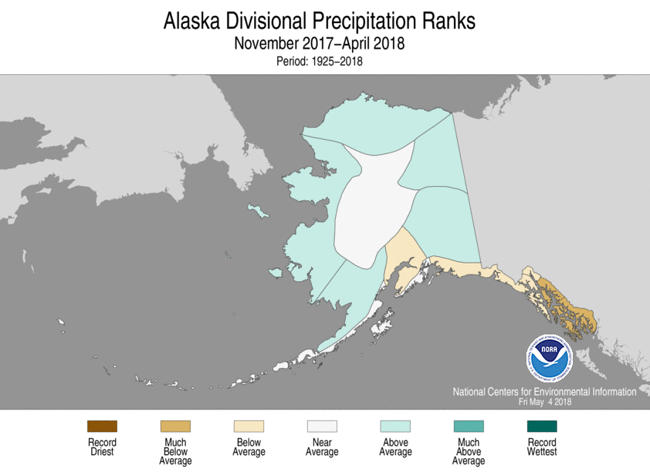
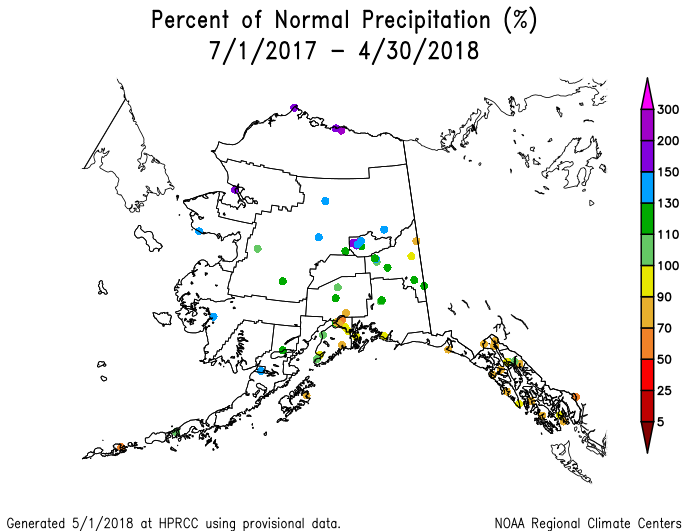
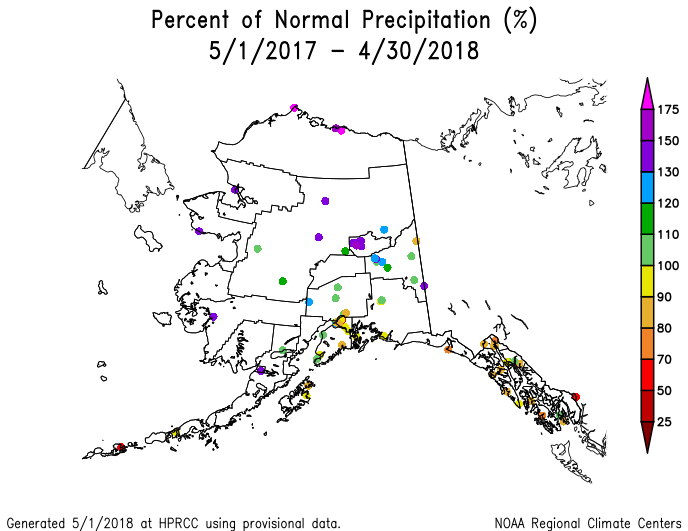
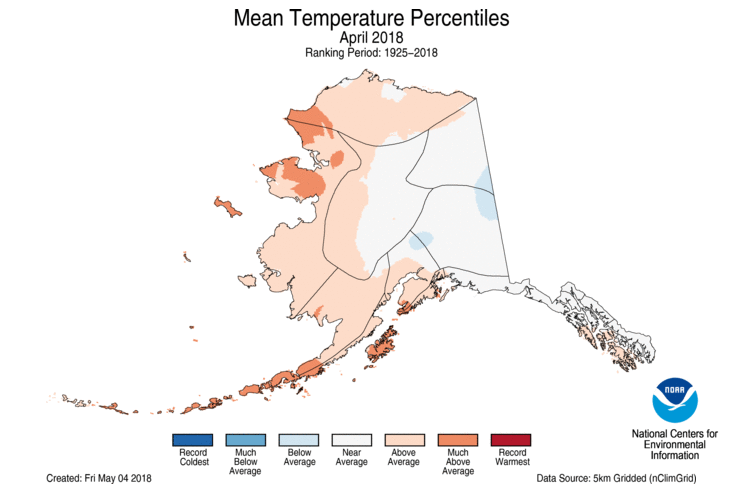
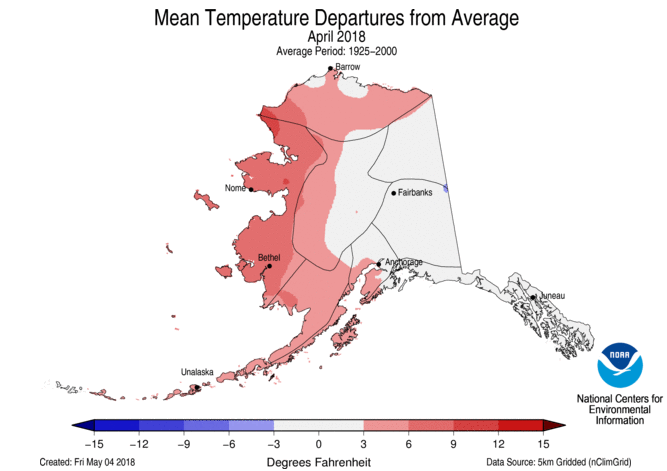
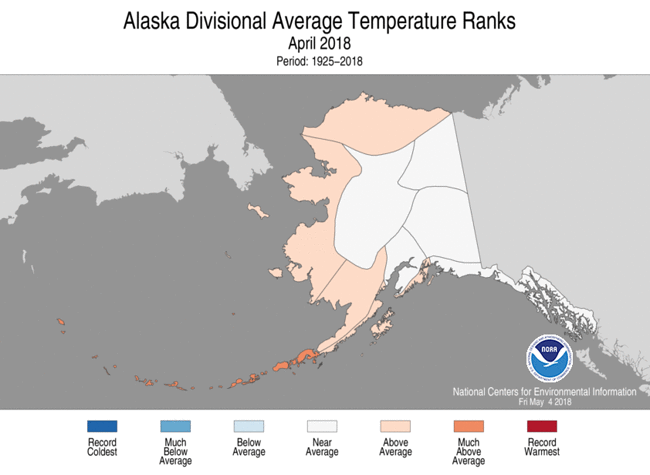
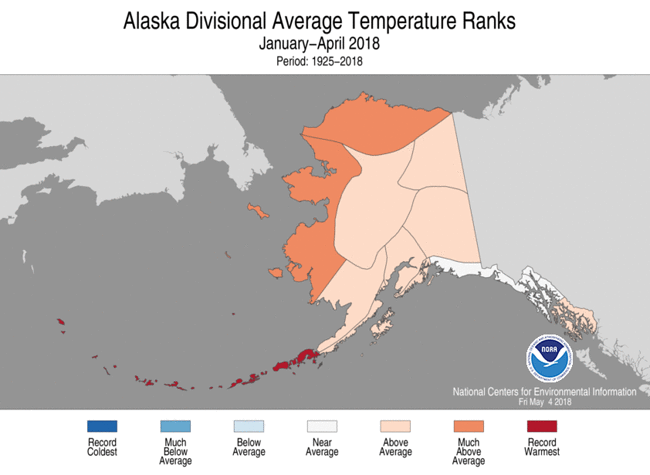
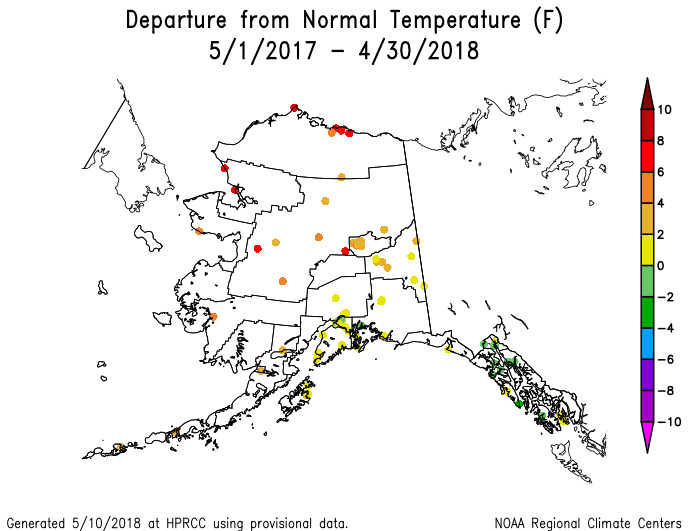
April 2018 was drier than normal in the northern and eastern interior sections of Alaska and wetter than normal in the southwest (climate division, gridded percentile, gridded percent of average, low elevation station, Leaky Bucket model precipitation percentile maps). A pattern of dryness was evident in the panhandle to south central coastal and some interior locations at the 2-month, 3-month (climate division, gridded percentile, gridded percent of average, low elevation station maps), 4-month (climate division, gridded percentile, gridded percent of average, low elevation station maps), 6-month (climate division, gridded percent of average, low elevation station maps), and 7-month (low elevation station and high elevation [SNOTEL] station and basin maps) time scales. The dryness was confined more to the panhandle and south central coastal locations at longer time scales (last 10, 12 [climate division and low elevation station maps], 24, 36 months). Temperatures during April were warmer than normal in the west and near to cooler than normal in the eastern interior and panhandle locations (low elevation station, gridded temperature percentile, gridded departure from average, divisional, Leaky Bucket model temperature percentile maps). The southeast was cooler than normal, with the rest of the state warmer than normal, at the 2-month time scale. A similar pattern continued at the 3-month (low elevation station, gridded temperature percentile, gridded departure from average, divisional maps), 4-month (low elevation station, gridded temperature percentile, gridded departure from average, divisional maps), 6-month (gridded departure from average, divisional maps), 7-month, and 12-month (low elevation station, divisional maps) time scales, except the western and northern warm anomalies were greater and the southeast near- to cooler-than-normal area got smaller. Snow pack and snow water content were below normal at the stations and in the basins in the panhandle and southern coastal regions, but above normal to the north. Streamflow was mostly near to above normal. The Leaky Bucket model suggested a drying trend for the soils in the south and eastern sections. There were reports of some water supply (reservoir) concerns continuing in the panhandle. Moderate drought (D1) was removed from the panhandle, but abnormally dry (D0) conditions continued in the panhandle and south central regions, on the May 1st USDM map.
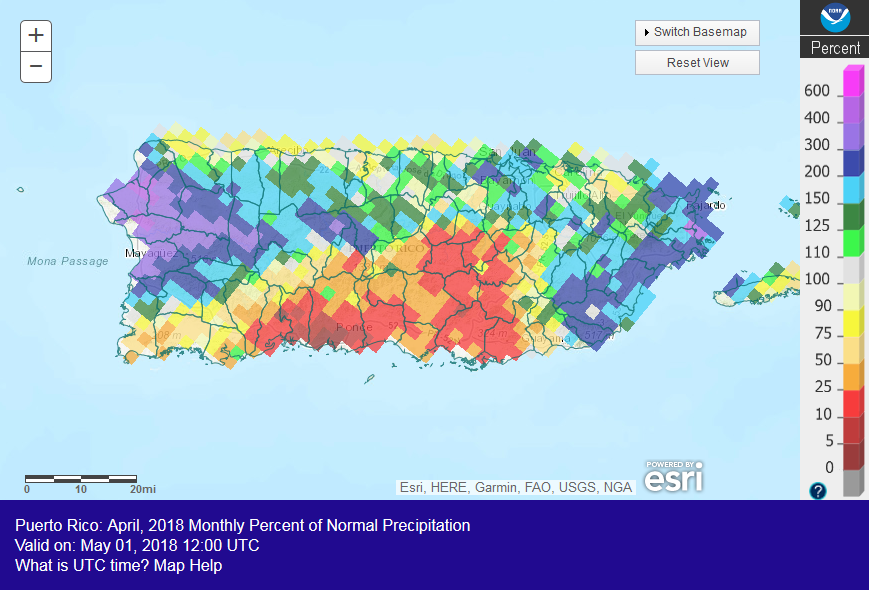
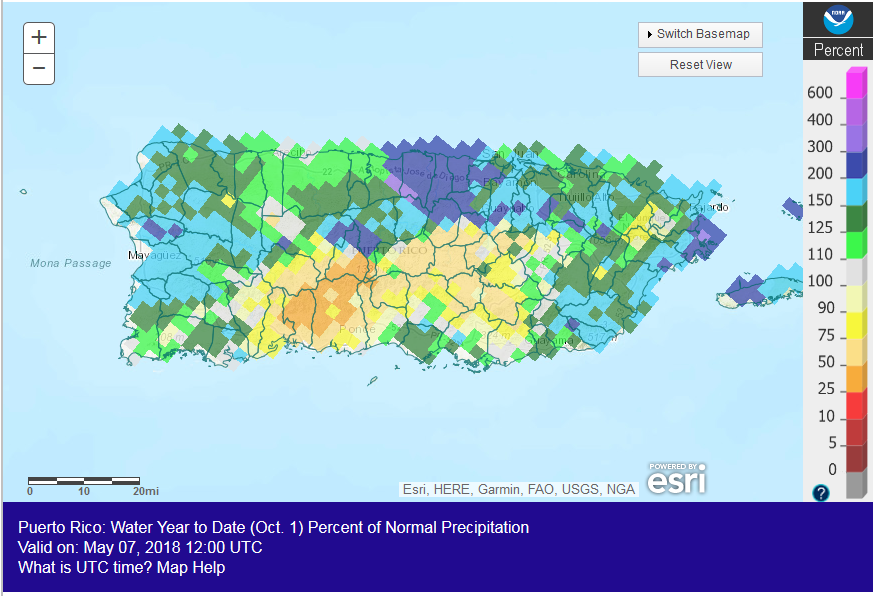
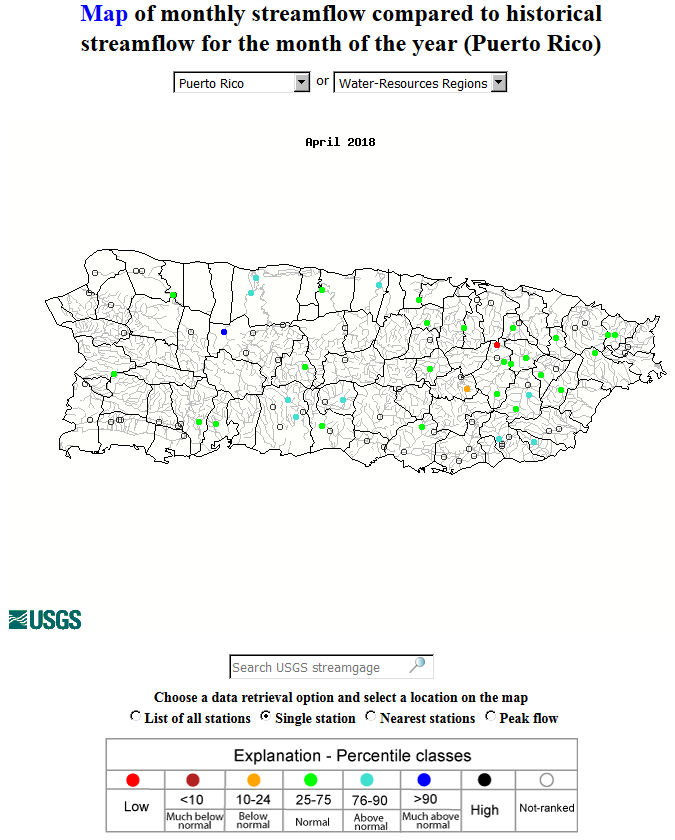
Puerto Rico percent of normal precipitation map, April 2018.
Puerto Rico: Puerto Rico was drier than normal in the south central sections, and wetter than normal across the rest of the island, during April. This pattern was evident for the last 2, 3, 4, 6, and 7 months, although the south central dry area became less dry at 7 months. Soils were a little dry in the south central region to southwest coast, but streamflow was mostly near normal. As seen on the May 1st USDM map, Puerto Rico was free of drought and abnormal dryness.
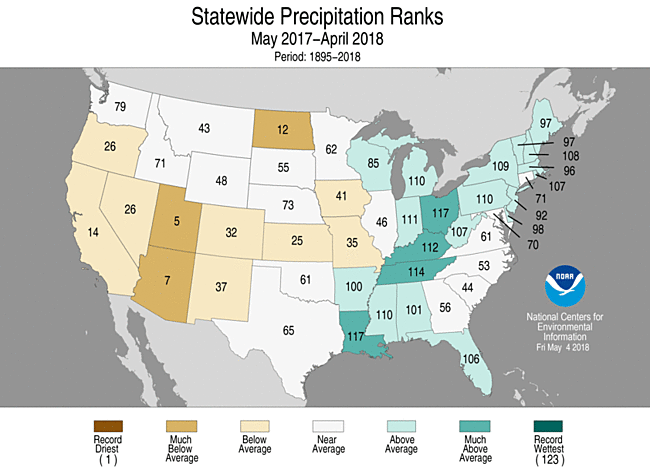
CONUS State Precipitation Ranks:

|

|
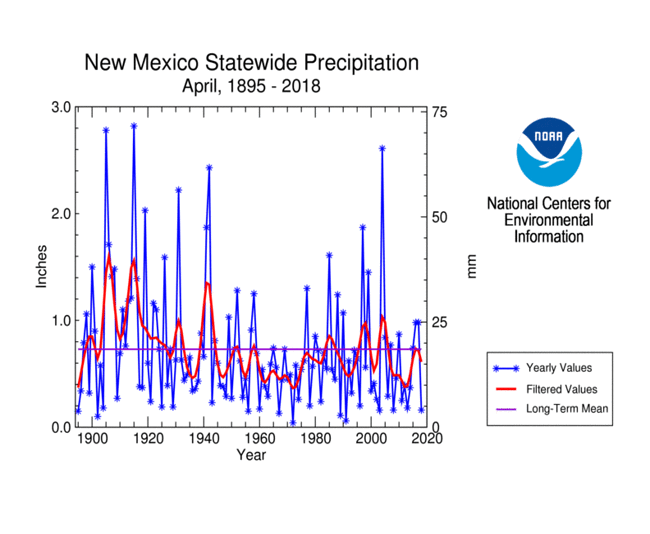
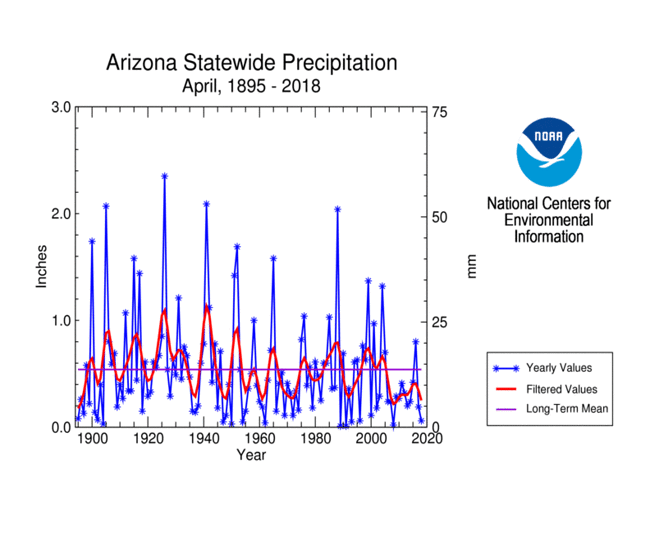
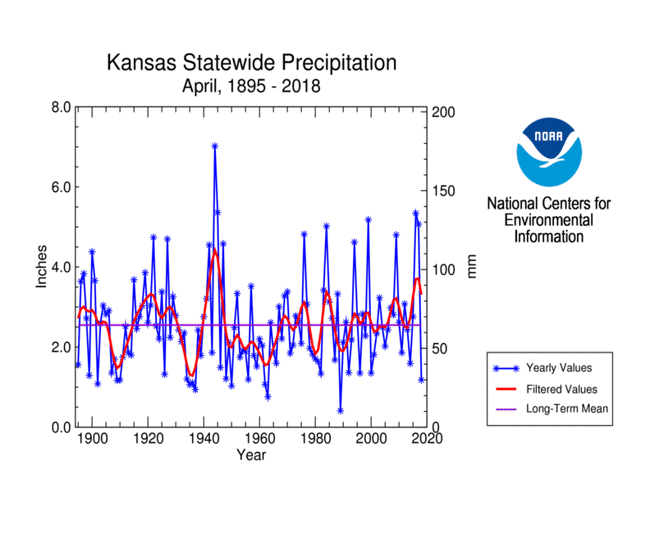
April 2018 was drier than normal across much of the Southwest, Great Plains, and Mid- to Upper Mississippi Valley. On a statewide basis, 13 states ranked in the driest third of the 124-year historical record, with four ranking in the top ten driest category — New Mexico (eighth driest), Arizona (tenth driest), Kansas (tenth driest), and Missouri (tenth driest). Minnesota was close, at 12th driest.

|

|
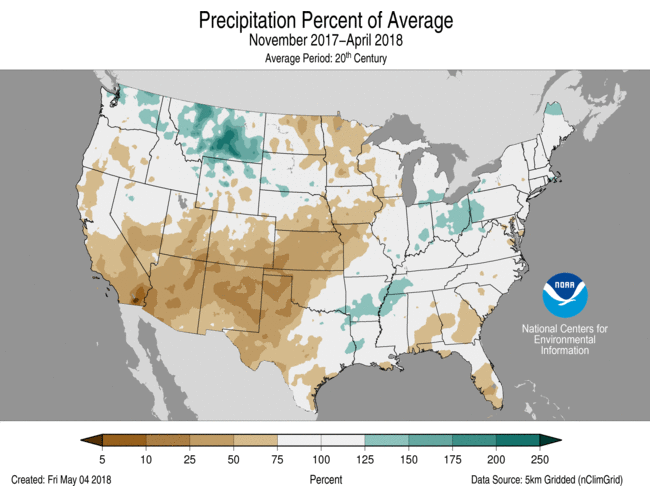
February-April 2018 was drier than normal across much of the same area (Southwest, Great Plains, and Mid- to Upper Mississippi Valley) as well as the coastal Southeast. On a statewide basis, eight states from the Southwest to Upper Mississippi Valley ranked in the driest third of the 124-year historical record, but wet conditions across parts of the states prevented any southeastern states from falling in that category. Kansas (ninth driest) was the only state to fall in the top ten driest category.
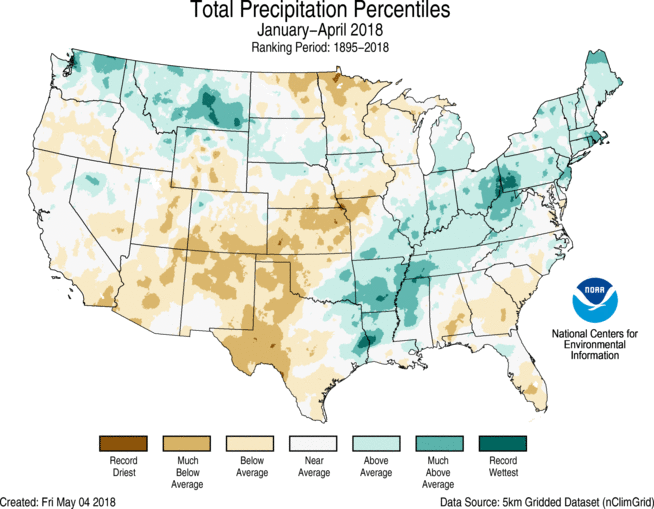
A similar precipitation anomaly pattern was evident for January-April 2018 with nine states ranking in the driest third of the 124-year historical record, including two in the Southeast. Again, Kansas was the only state to fall in the top ten driest category, ranking tenth driest.

|
|
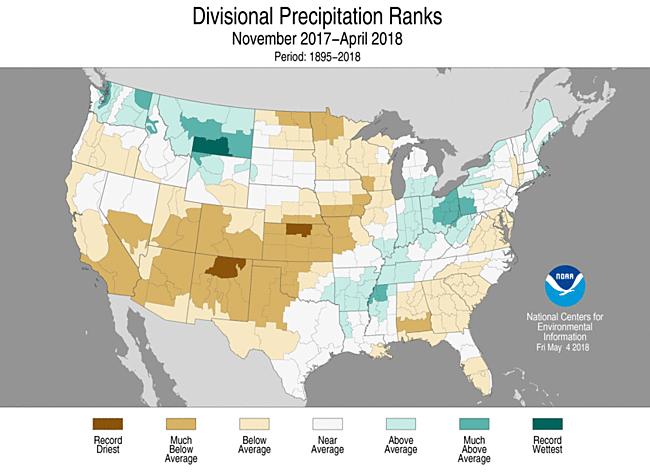
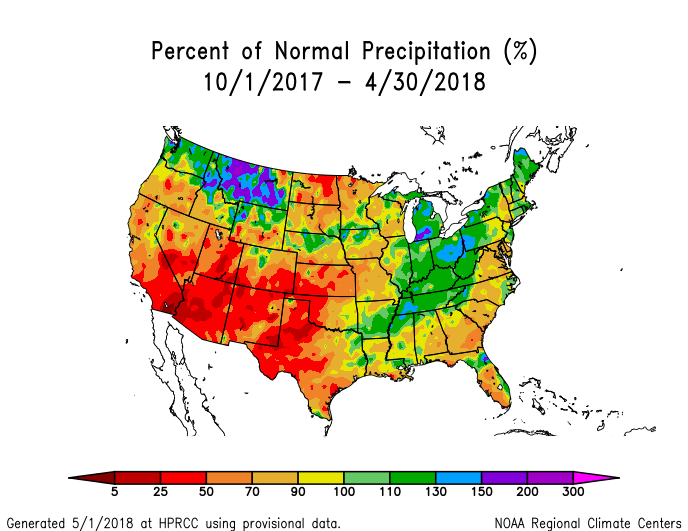
November 2017-April 2018 was dry across much of the West, Great Plains, Mid- to Upper Mississippi Valley, Southeast, and East Coast. Twenty-two states ranked in the driest third of the historical record, with five states (Kansas at second driest, New Mexico and Utah third driest, Colorado at fifth driest, and Arizona at sixth driest) in the top ten driest category.

|

|
|

|
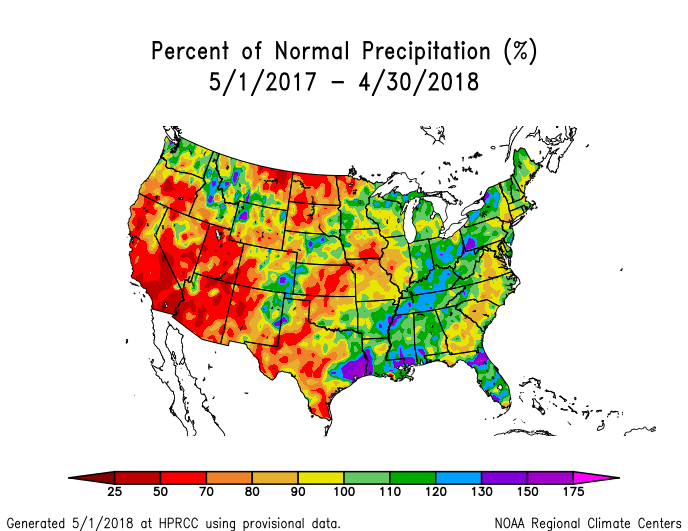
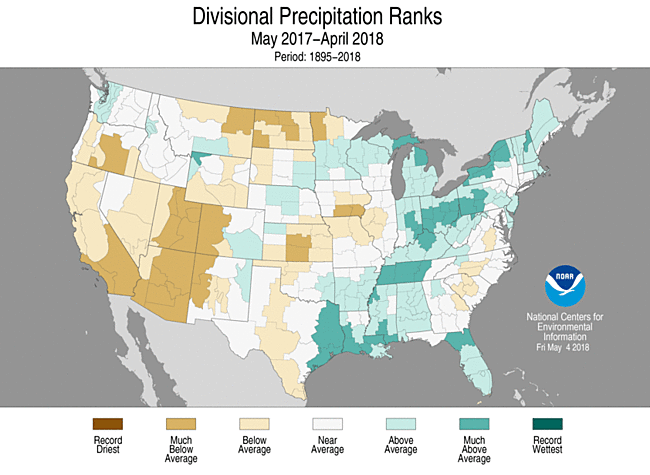
The last 12 months (May 2017-April 2018) were notably dry across much of the West and and Great Plains, with dryness in parts of the Mid-Mississippi Valley, and Southeast to Mid-Atlantic region. Eleven states ranked in the driest third of the historical record, with two in the top ten category — Utah (fifth driest) and Arizona (seventh driest). North Dakota was close at twelfth driest.
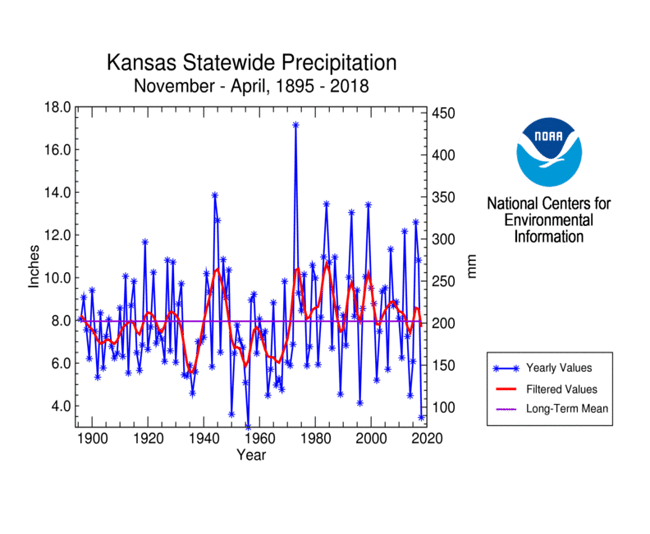
 Primary Hard Red Winter Wheat Belt precipitation, April, 1895-2018.
|
 Primary Hard Red Winter Wheat Belt precipitation, October-April, 1895-2018.
|
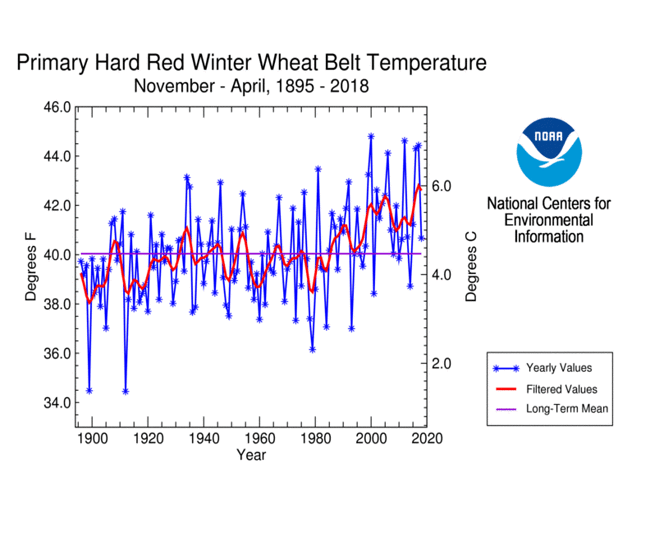
| April 2018 was drier and colder than normal in the Primary Hard Red Winter Wheat agricultural belt. The month ranked as the 13th driest and fifth coldest April, regionwide, in the 1895-2018 record. October marks the beginning of the growing season for the Primary Hard Red Winter Wheat belt. October 2017-April 2018 was drier than normal across most of the agricultural belt and warmer than normal in the south and cooler than normal in the north, ranking as the seventh driest and 41st warmest October-April, regionwide. Precipitation in early October masked the extreme dryness that occurred since then, as seen by November 2017-April 2018 ranking fourth driest in the historical record. Also of interest is the noticeable overall warming trend (as shown by the red filtered curve on the temperature graph) during the last 30 years. |
 Primary Hard Red Winter Wheat Belt precipitation, November-April, 1895-2018.
|
 Primary Corn and Soybean Belt precipitation, April, 1895-2018.
|
 Primary Corn and Soybean Belt temperature, March-April, 1895-2018.
|
April 2018 was mostly drier and colder than normal for the Primary Corn and Soybean agricultural belt. The month ranked as the 34th driest and second coldest April, regionwide, in the 1895-2018 record. March is the beginning of the growing season for the Primary Corn and Soybean agricultural belt. March-April 2018 was near to drier than normal across most of the region with some wetness in the south, and cooler than normal. March-April ranked as the 47th driest and 11th coldest March-April, regionwide, in the 1895-2018 record.
The prolonged below-normal precipitation has dried soils and inhibited crop growth in many states in the Plains and Southwest. According to statistics from the U.S. Department of Agriculture (USDA), 26 percent of the topsoil and 27 percent of the subsoil was rated short or very short of moisture (dry or very dry) nationwide, and 37 percent of the winter wheat was rated in poor to very poor condition. Conditions were much worse on a state by state basis, especially in the Southwest, southern to central Plains, and Southeast:
Percentage of winter wheat and pasture and rangeland in poor to very poor condition, and percentage of topsoil and subsoil moisture short to very short (dry to very dry), based on April 30, 2018 USDA reports.
| State | Topsoil Moisture | Subsoil Moisture | Winter Wheat | Pasture/Rangeland |
| Colorado | 53% | 43% | 20% | 44% |
| Florida | 38% | 33% | — | 15% |
| Georgia | 14% | 20% | — | 6% |
| Kansas | 59% | 65% | 50% | — |
| Montana | 16% | 30% | 10% | 32% |
| New Mexico | 90% | 89% | — | 52% |
| North Dakota | 45% | 50% | — | — |
| Oklahoma | 47% | 54% | 66% | 34% |
| Oregon | 21% | 36% | 6% | 19% |
| South Dakota | 12% | 29% | 15% | — |
| Texas | 67% | 64% | 61% | 36% |
| Utah | 45% | 52% | — | 19% |
NOAA Regional Climate Centers:
A more detailed drought discussion, provided by the NOAA Regional Climate Centers and others, can be found below.
As described by the High Plains Regional Climate Center, April brought a wide variety of hazards to the High Plains, including record cold, blizzards, wildfires, and dust storms. The cold and wet conditions negatively impacted calving and lambing, especially in South Dakota, and losses are still being determined. Additionally, planting was delayed across the Northern and Central Plains as soils were slow to warm up. Despite impressive snowfall totals, April precipitation was below normal in most locations. While heavy snows improved drought conditions across the Northern Plains, drought continued to spread and intensify throughout Colorado and Kansas where precipitation deficits have been accumulating since October. Wildfires burned across these states, as well as others in the Southern Plains where historically extreme fire conditions were present.
Precipitation ranged from 50-70 percent of normal across a large portion of the region. The driest areas included much of North Dakota and eastern Nebraska where less than 25 percent of normal precipitation fell. Precipitation deficits tend to accumulate quickly during the spring season and should be watched as we head into the late spring and summer, which is typically the wettest time of year.
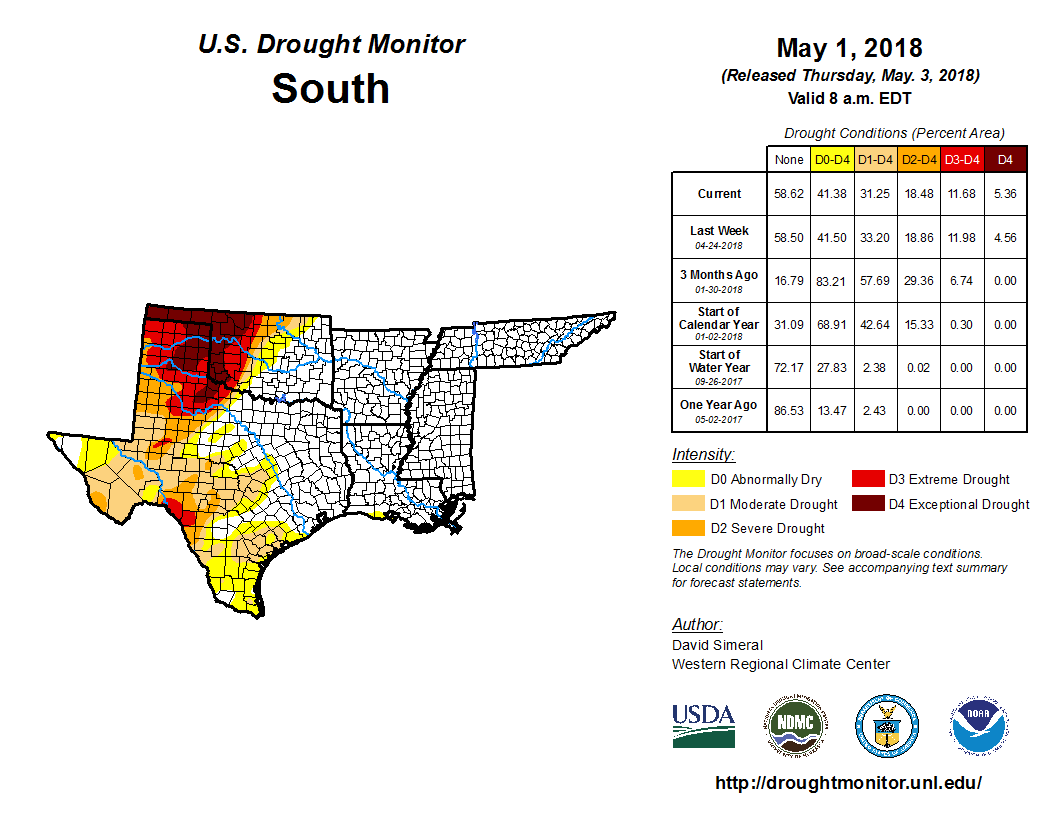
Drought conditions improved in the Dakotas but worsened in parts of Colorado and Kansas during April. A late-spring winter storm brought record-breaking snowfall to portions of the Northern Plains, which alleviated drought conditions. According to the USDM, the area experiencing drought decreased from 49 percent to 39 percent in North Dakota, and from 36 percent to 19 percent in South Dakota. The area in severe drought (D2) was removed, while moderate drought (D1) and abnormally dry (D0) conditions were vastly reduced. According to the South Dakota State Climatologist, stock ponds have filled up from snowmelt, and this April moisture bodes well for grasses and forage production later in the season. But it was another dry month for drought-stricken areas of Colorado and Kansas, causing conditions to worsen. Storms brought some relief to northern Colorado, while southern Colorado and much of Kansas remained dry. Exceptional drought (D4) was expanded in southern Kansas and introduced to southwestern Colorado. Extreme drought (D3) expanded to encompass all of southern Colorado, and D3 conditions reached into central Kansas as well. As for impacts, below-normal runoff is expected in western Colorado due to the lack of snow this season. The primary agricultural impacts to the Southern Plains have been on cattle, hay, and winter wheat. Unprecedented fire conditions were present across portions of Colorado, Kansas, New Mexico, Oklahoma, and Texas, and high winds caused fires to spread quickly, burning thousands of acres.
As explained by the Southern Regional Climate Center, April temperatures were below normal throughout most of the Southern region and precipitation values for the month varied spatially throughout the region. Parts of southeastern Mississippi and extreme eastern Tennessee received 200-300 percent of normal precipitation. Central and eastern Tennessee, southeastern Arkansas, southeastern Louisiana, and parts of southern, central, and northwestern Mississippi received 150-200 percent of normal precipitation. In contrast, parts of northern, central, and western Texas received 5 percent or less of normal precipitation. Areas of northern, western, central, and southern Texas, southwest and northeastern Oklahoma, and north and northwestern Arkansas received 50 percent or less of normal precipitation. In April, the exceptional drought classification expanded in western Oklahoma and northern Texas. Extreme drought classification appeared in southwest Texas. The severe drought classification remained through parts of north-central Oklahoma, and central, northern and western Texas. The moderate drought classification remains throughout parts of western, central, northern, and southeast Texas. Drought conditions improved from moderate to abnormally dry conditions in southern Texas. There are currently no drought conditions in Arkansas, Louisiana, Mississippi, and Tennessee.
As summarized by the Midwest Regional Climate Center, temperatures were well below normal in April. Monthly precipitation was generally below normal in the western half of the region and near or above normal in the eastern half. Drought expanded slightly in April. Small areas of northern Minnesota, southern Iowa, and northern Missouri were in moderate drought at the beginning of April. The area of moderate drought along the Iowa-Missouri border expanded by the end of the month increasing the percentage of the Midwest in drought from 2 percent to 4 percent. Areas of the region classified as abnormally dry, but not in drought, decreased during the month, particularly in Wisconsin. The abnormally dry percentage dropped from just over 10 percent of the Midwest to under 6 percent in April.
As noted by the Southeast Regional Climate Center, temperatures ranged from well below average to average across much of the Southeast region during April, but above-average temperatures were observed in central and southern Florida. Precipitation was near normal to well above normal across much of the region. Monthly precipitation totals ranged from 150 to more than 300 percent of normal in broad portions of every state and northwestern Puerto Rico. Unusual dryness was found across portions of southwestern Florida and the U.S. Virgin Islands, where monthly precipitation totals were 50 to as low as 25 percent of normal.
Significant drought improvement occurred across much of the Southeast during the month, as above-normal precipitation reduced the coverage of moderate-to-severe (D1-D2) drought conditions from 26 percent on April 3rd to 14 percent on May 1st. Moderate drought was eliminated from the District of Columbia and was almost completely removed from Alabama. The greatest drought improvement occurred in South Carolina and Georgia, where the coverage of moderate-to-severe drought fell 27 and 23 percentage points, respectively. By the end of the month, severe drought was eliminated from South Carolina and covered only a small portion of southeastern Georgia. In contrast, severe drought developed and expanded across portions of southern Florida due to persistent dryness during the month. Cooler-than-normal air and soil temperatures, coupled with frequent rainfall in some areas, continued to delay the planting and early growth of row crops (e.g., corn, cotton, peanuts, soybeans, and tobacco) across much of the region. While above-average temperatures and much-needed rainfall improved pasture conditions across the Florida Peninsula, persistent coolness slowed the growth and green-up of livestock pastures in other parts of the region. Overgrazed pastures were reported in northern and southwestern Virginia, with livestock producers having to provide unusually large supplemental feedings for this late into the growing season.
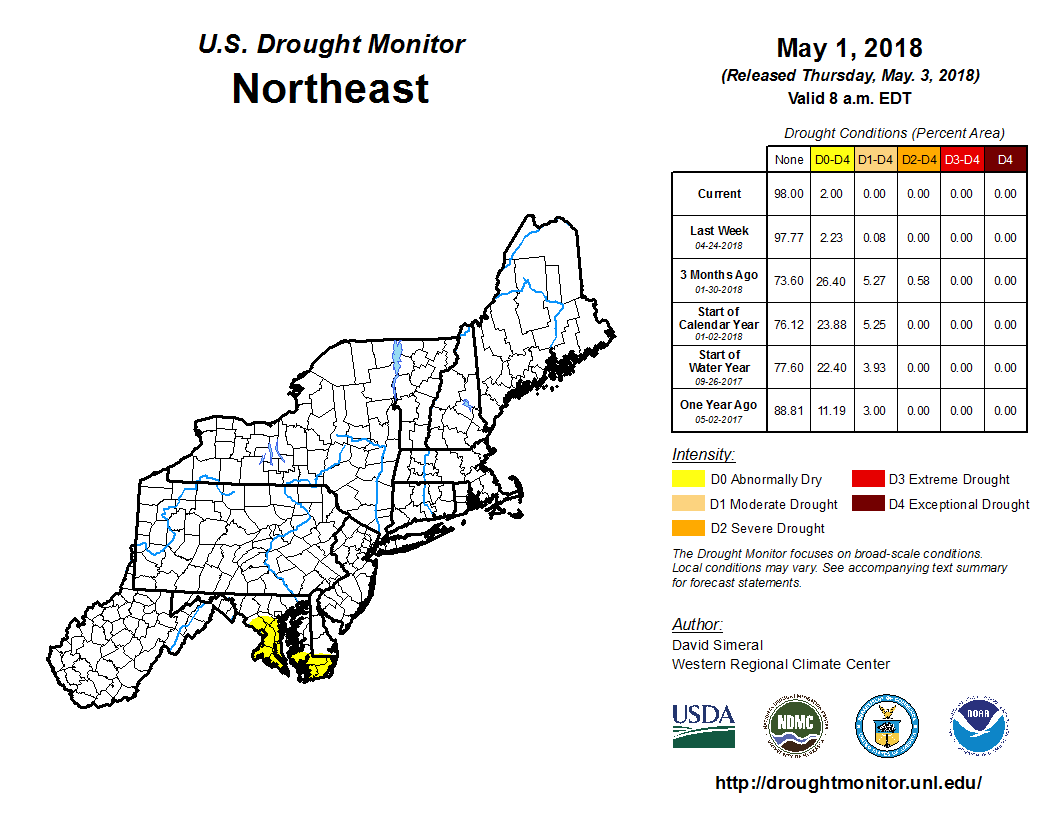
As explained by the Northeast Regional Climate Center, April 2018 ranked as the sixth coldest April on record for the region. The Northeast received 4.20 inches (106.7 mm) of precipitation, which was 115 percent of normal for the month of April. Dry conditions have persisted in a small region of the Northeast during the month. Only 1 percent of the entire Northeast was experiencing abnormally dry conditions at the beginning of the month, increasing slightly to 2 percent of the region by the end of April. At the beginning of the month, 23 percent of Maryland was experiencing abnormally dry conditions and two percent of the state was under moderate drought. Abnormal dryness increased in Maryland throughout the month and by the end of April, 41 percent of the state was abnormally dry and one percent was in moderate drought.
As summarized by the Western Regional Climate Center, a few storm systems impacted the West this month bringing well above normal precipitation to portions of the Northwest, western Great Basin, and Intermountain West. Little to no precipitation was observed along the southern tier of the region. Temperatures were above normal throughout the Southwest and cooler than normal across the northern tier of the region.
Precipitation was well below normal across the southern tier of the region, with many locations receiving no measurable precipitation. Los Angeles reported 0.02 in (0.5 mm), just 2% of normal for April. This ranks as the 18th driest April in this station's 142-year record. Phoenix, Arizona, and Albuquerque, New Mexico, reported no measurable precipitation. Normal April precipitation is 0.28 in (7 mm) at Phoenix and 0.61 in (15 mm) at Albuquerque. There are 21 other years with no measurable April precipitation in Phoenix's 86-year record and 16 such years in Albuquerque's 128-year record. Due to dry conditions, above normal temperatures, and lack of snowpack, drought conditions degraded this month in many areas of the Southwest. Changes were most notable in southern Nevada, the Four Corners region, and in New Mexico. The percentage of extreme to exceptional drought conditions by area in the Four Corners states is: 48% of Arizona, 46% of New Mexico, 28% of Utah, and 31% of Colorado.
Temperatures were near normal across much of Alaska, though much warmer than normal in the western part of the state. Kotzebue reported an average April temperature of 21.3 F (-5.9 C), 8 F (4.4 C) above normal. This was the 12th warmest since records began in 1897. Precipitation was variable across the state, with drier than normal conditions dominating around the Fairbanks region and above normal observed in the southwestern portion of the state. Fairbanks measured 0.15 in (4 mm), 48% of normal. In contrast, King Salmon received 2.06 in (52 mm), 212% of normal and the 8th wettest April since records began in 1917. Further south, Hawaii experienced very active weather throughout the month. April precipitation totals were near to well above normal across the state. On Kauai, Lihue logged 5.7 in (145 mm) of precipitation, 253% of normal and the 6th wettest since records began in 1950. On Maui, Kula reported 5.38 in (137 mm), 361% of normal and the 3rd wettest in a 41-year record.
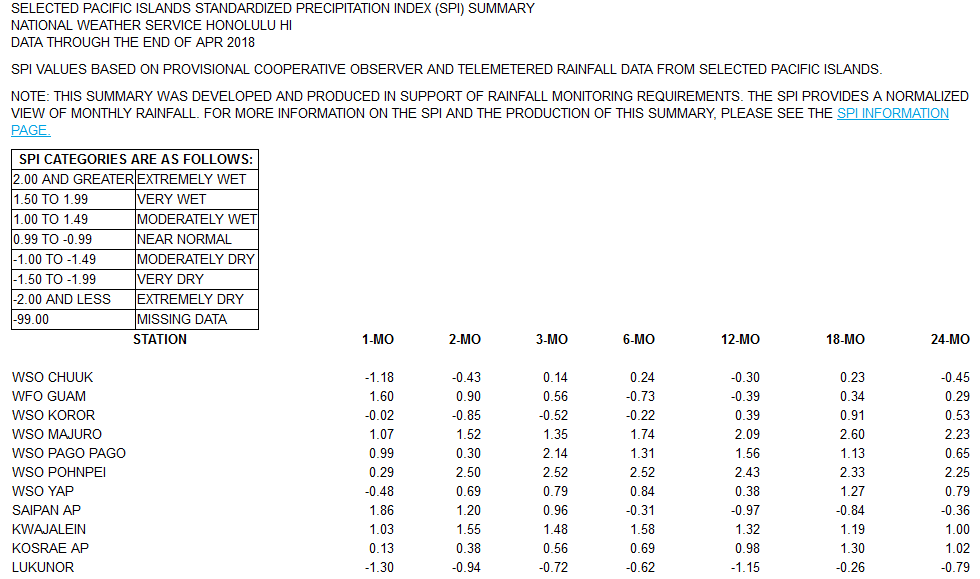
Pacific Islands: The NOAA National Weather Service (NWS) offices, the Pacific ENSO Applications Climate Center (PEAC), and partners provided reports on conditions across the Pacific Islands.
In the U.S. Affiliated Pacific Islands (USAPI) (maps — Federated States of Micronesia [FSM], Northern Mariana Islands, Marshall Islands [RMI], Republic of Palau, American Samoa, basinwide), April 2018 was drier than normal at Chuuk, Lukonor, and Yap, and wetter than normal at Guam, Saipan, Koror, Kapingamarangi, Pohnpei, Kosrae, Kwajalein, Majuro, and Pago Pago.
Rainfall amounts were below the minimum thresholds (4 or 8 inches) required to meet most monthly water needs at Chuuk and Yap (in the FSM). They were below the minimum threshold (but just by an inch or two) at Lukonor and Ulithi (in the FSM) and Jaluit and Utirik (in the RMI). April rainfall was above the monthly minimum thresholds at the rest of the regular reporting stations in Micronesia. The 4- and 8-inch thresholds are important because, if monthly precipitation falls below the threshold, then water shortages or drought become a concern.
Beneficial rain fell across the Marianas this month and continued to fall across the Marshall Islands. Significant dryness developed in the northern Marshall Islands in December 2016 and in the last 5 months in the Marianas Islands. The rains of the last couple months have been enough to relieve drought stress in these areas, but dry conditions developed or continued in parts of the FSM, especially in western Yap State. The National Weather Service office on Guam issued revised Drought Information Statements on April 18 and April 26 discussing the improving conditions.
Even though current conditions are wet, the dryness that developed in the Marianas and Marshalls is still evident at longer time scales. The last 12 months (May 2016-April 2017) was the third driest May-April for Saipan (based on 29 years of data), third driest for Lukonor (21 years), seventh driest for Ailinglapalap (32 years), and second driest for Jaluit (33 years).
As measured by percent of normal precipitation, Lukonor has been drier than normal in the short term (April, the last 3 months [February-April 2018], and the year-to-date [January-April]) as well as the long term (last 12 months [May 2017-April 2018]). Kapingamarangi, Kosrae, Kwajalein, Majuro, Pago Pago, and Pohnpei were near to wetter than normal in the short term and long term. Chuuk was drier than normal for April and the year to date, but near normal for the other two time periods. Koror was wetter than normal for April, but near to drier than normal for the other three time periods. Guam was wetter than normal for April and the last three months, but drier than normal for the year to date and last 12 months. Yap was drier than normal for April, but wetter than normal for the other three time periods. Saipan was wetter than normal in the short term, but drier than normal in the long term.
Pacific Islands Precipitation Statistics
| Station Name | May 2017 | Jun 2017 | Jul 2017 | Aug 2017 | Sep 2017 | Oct 2017 | Nov 2017 | Dec 2017 | Jan 2018 | Feb 2018 | Mar 2018 | Apr 2018 | May-Apr |
|---|---|---|---|---|---|---|---|---|---|---|---|---|---|
| Chuuk | 83% | 73% | 99% | 91% | 110% | 127% | 105% | 120% | 99% | 175% | 131% | 45% | 97% |
| Guam | 56% | 136% | 97% | 66% | 118% | 161% | 57% | 88% | 23% | 90% | 68% | 316% | 86% |
| Kapingamarangi | 114% | 81% | 102% | 41% | 92% | 72% | 64% | 420% | 95% | 222% | 171% | 127% | 117% |
| Airai Palau | 107% | 89% | 130% | 104% | 161% | 118% | 84% | 160% | 82% | 105% | 37% | 113% | 101% |
| Kosrae | 115% | 80% | 104% | 93% | 155% | 143% | 168% | 123% | 100% | 147% | 181% | 105% | 105% |
| Kwajalein | 77% | 156% | 70% | 64% | 205% | 88% | 83% | 71% | 458% | 159% | 662% | 229% | 134% |
| Lukunor | 80% | 60% | 103% | 63% | 84% | 116% | 136% | 70% | 129% | 106% | 84% | 56% | 78% |
| Majuro | 49% | 118% | 112% | 111% | 187% | 143% | 76% | 172% | 204% | 120% | 343% | 189% | 141% |
| Pago Pago | 240% | 93% | 84% | 145% | 96% | 217% | 127% | 94% | 115% | 271% | 60% | 189% | 131% |
| Pohnpei | 92% | 141% | 113% | 55% | 122% | 81% | 95% | 130% | 167% | 219% | 440% | 102% | 135% |
| Saipan | 66% | 128% | 72% | 65% | 84% | 66% | 62% | 60% | 117% | 87% | 49% | 332% | 82% |
| Yap | 69% | 68% | 121% | 55% | 93% | 156% | 106% | 132% | 182% | 163% | 270% | 67% | 107% |
The following analysis of historical data for the USAPI stations in the Global Historical Climatology Network-Daily (GHCN-D) dataset, augmented with fill-in data from the 1981-2010 Normals, helps put the current data into historical perspective by computing ranks based on the period of record. The table below lists the precipitation ranks for April 2018, November 2017-April 2018 (last 6 months), and May 2017-April 2018 (the last 12 months). Some stations have a long period of record and their dataset is fairly complete, while other stations have a shorter period of record and the dataset has some missing data.
Rank of 1 = driest.
| Station | Apr 2018 Rank |
Apr No. of Years |
Nov 2017- Apr 2018 Rank |
Nov- Apr No. of Years |
May 2017- Apr 2018 Rank |
May- Apr No. of Years |
Period of Record |
| Jaluit | 10 | 35 | 15 | 33 | 2 | 33 | 1981-2018 |
| Koror | 36 | 67 | 22 | 67 | 39 | 66 | 1951-2018 |
| Woleai | 26 | 39 | 19 | 29 | 9 | 21 | 1968-2018 |
| Yap | 21 | 67 | 53 | 67 | 40 | 66 | 1951-2018 |
| Majuro | 57 | 64 | 63 | 64 | 63 | 63 | 1954-2018 |
| Mili | 32 | 34 | 31 | 32 | MSG | 31 | 1981-2018 |
| Ulithi | 30 | 37 | 31 | 34 | 20 | 34 | 1981-2018 |
| Ailinglapalap | 22 | 35 | 21 | 33 | 7 | 32 | 1981-2018 |
| Kosrae | 23 | 48 | 28 | 38 | 23 | 31 | 1954-2018 |
| Lukonor | 6 | 34 | 10 | 33 | 3 | 21 | 1981-2018 |
| Saipan | 38 | 38 | 15 | 29 | 3 | 29 | 1981-2018 |
| Pohnpei | 38 | 67 | 67 | 67 | 66 | 66 | 1951-2018 |
| Kwajalein | 53 | 66 | 64 | 66 | 62 | 65 | 1952-2018 |
| Kapingamarangi | 21 | 26 | 21 | 21 | 12 | 13 | 1962-2018 |
| Chuuk | 8 | 67 | 35 | 67 | 21 | 66 | 1951-2018 |
| Guam | 55 | 62 | 10 | 61 | 12 | 61 | 1957-2018 |
| Nukuoro | 8 | 35 | 19 | 33 | 30 | 32 | 1981-2018 |
| Pago Pago | 44 | 53 | 48 | 52 | 49 | 52 | 1966-2018 |
| Wotje | 35 | 35 | 30 | 32 | 29 | 32 | 1981-2018 |
| Utirik | 16 | 17 | 6 | 7 | 1 | 3 | 1985-2018 |


[top]
State/Regional/National Moisture Status
A detailed review of drought and moisture conditions is available for all contiguous U.S. states, the nine standard regions, and the nation (contiguous U.S.):
| northeast u. s. | east north central u. s. | central u. s. |
| southeast u. s. | west north central u. s. | south u. s. |
| southwest u. s. | northwest u. s. | west u. s. |
| Contiguous United States |
[top]
Contacts & Questions