|
Contents Of This Report: |


|
Please note that the values presented in this report are based on preliminary data. They will change when the final data are processed, but will not be replaced on these pages.
National Drought Overview
|
|
[top]
Detailed Drought Discussion
Overview
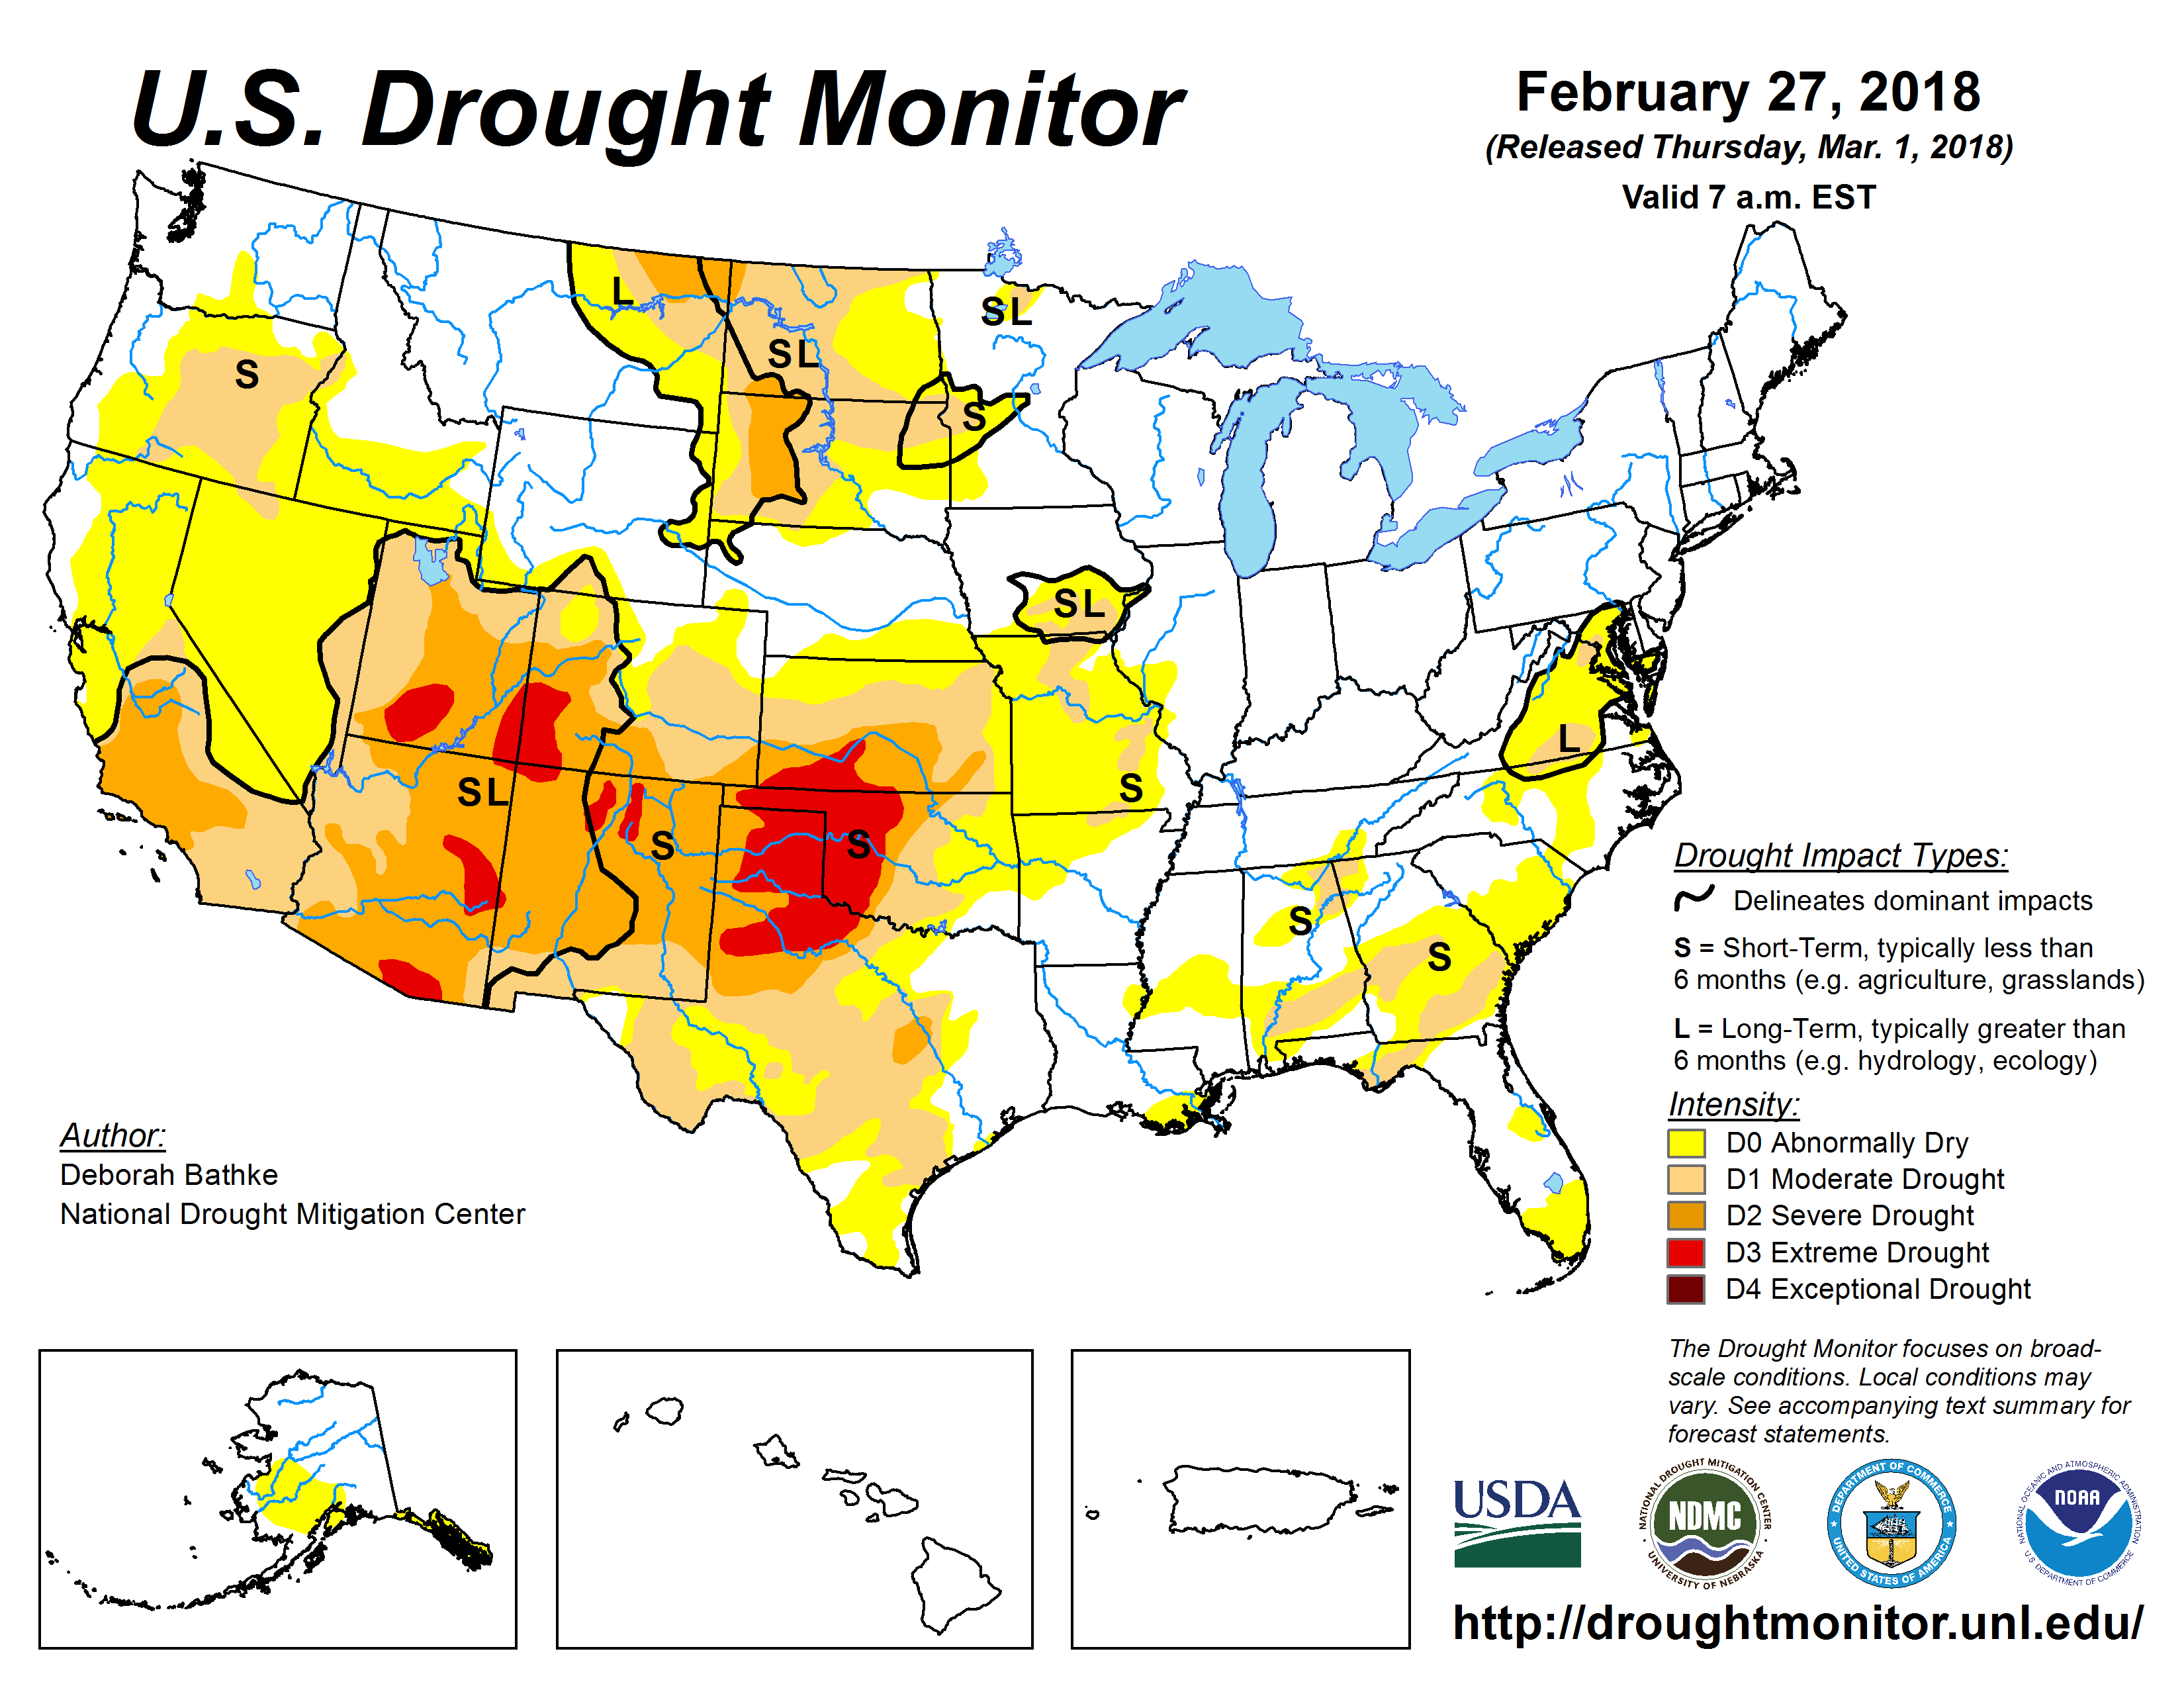
The U.S. Drought Monitor drought map valid February 27, 2018.
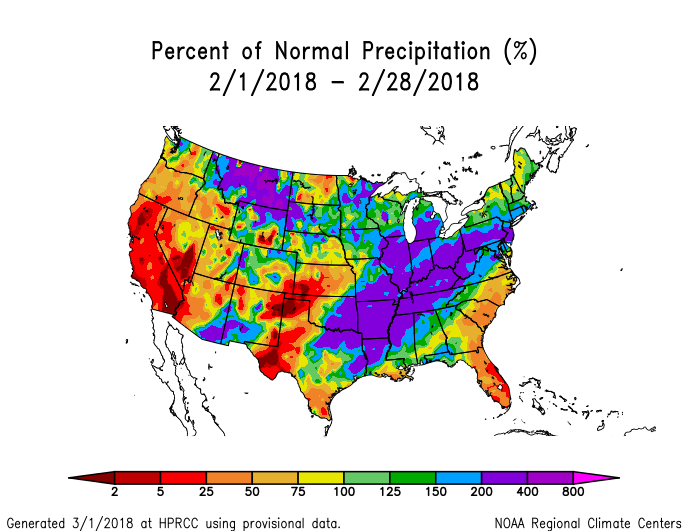
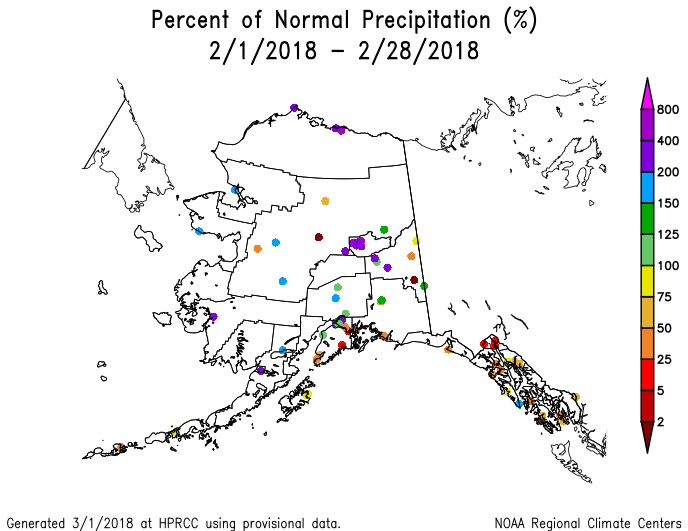
The atmospheric circulation during February 2018 shifted from a long-wave ridge/trough pattern to a trough/ridge pattern. But the circulation maintained a vigorous westerly component throughout this transition, with several upper-level short-wave troughs and lows, and their associated Pacific weather systems, moving through the upper-level flow. The weather systems brought above-normal precipitation to the northern Rockies and most of the northern Plains, parts of the central to southern Rockies, and most of the country from eastern Texas and eastern Oklahoma, across the Mississippi and Ohio River Valleys, to the Northeast. Pacific moisture gave Hawaii a wet month, and a southerly flow in the upper levels guided Pacific systems to Alaska, giving much of the state above-normal precipitation. But the weather systems consistently missed other parts of the country, with the month ending up drier than normal across much of the West, from the southern High Plains to central Plains, along the coastal Southeast, in parts of the northern Plains, and in southeast Alaska. The dry conditions during February were a continuation of persistent dryness since October in the southern High Plains to central Plains and for much of the last 12 months in California to the Four Corners States (Standardized Precipitation Index maps for the last 1, 2, 3, 6, 9, 12 months). Drought and abnormal dryness contracted where the heavy February precipitation fell but expanded or intensified where the dryness continued. Contraction outweighed expansion this month, so the USDM-based national moderate-to-exceptional drought footprint across the CONUS shrank from 38.4 percent of the CONUS at the end of January to 31.3 percent of the CONUS at the end of February (from 32.1 percent to 26.2 percent for all of the U.S.). According to the Palmer Drought Index, which goes back to the beginning of the 20th century, about 24.2 percent of the CONUS was in moderate to extreme drought at the end of February, decreasing about 2.9 percent from the 27.1 percent at the end of January.
Drought conditions at the end of the month, as depicted on the February 27th, 2018 USDM map, included the following core drought and abnormally dry areas:
-
A large area of abnormal dryness (D0) to extreme (D3) drought stretched from Oregon and California in the West to the southern and central Great Plains. The core drought areas were in southern California, the Four Corners States, and the Texas and Oklahoma panhandles to southwestern Kansas. —
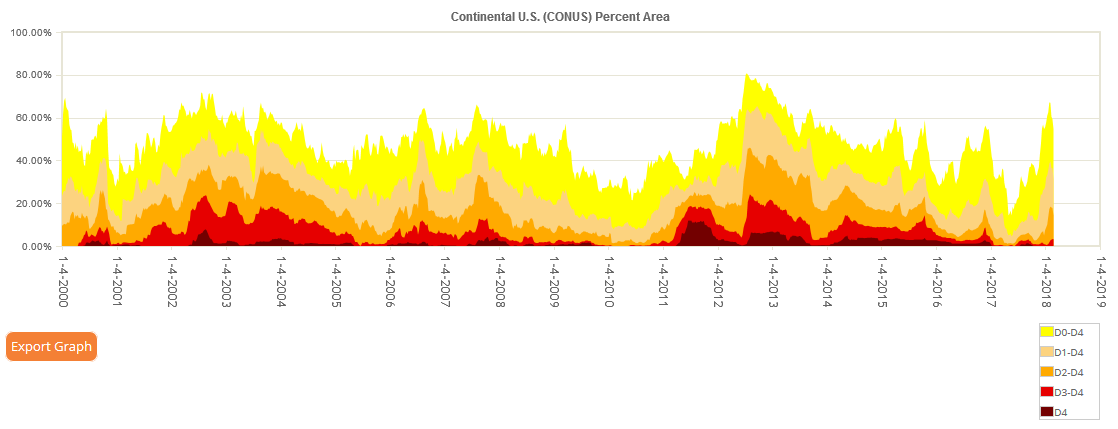
- The percent area of the West (from the Rockies to the West Coast) in moderate to extreme drought (based on the Palmer Drought Index) rapidly increased in December and continued to increase in January and February, growing over the last five months from 21.5 percent at the end of October to 62.4 percent of the West at the end of February.
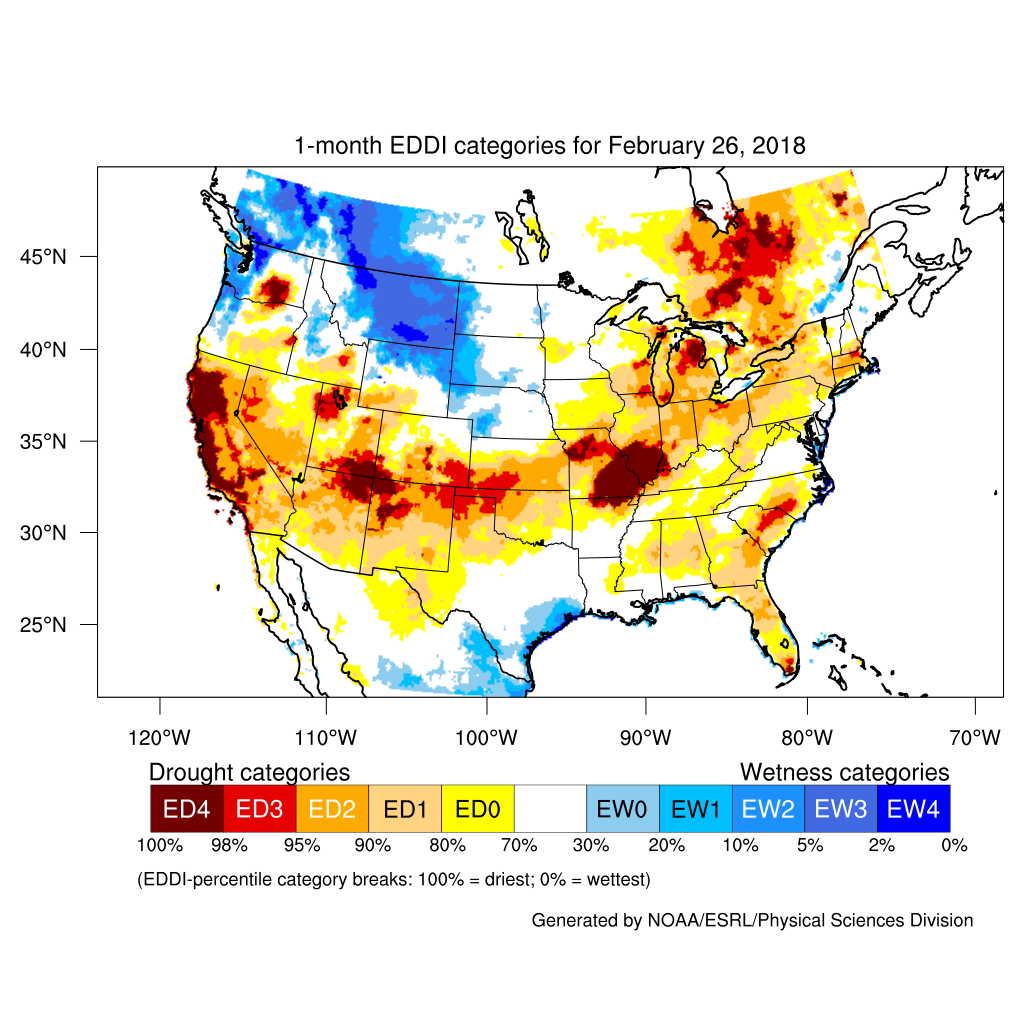
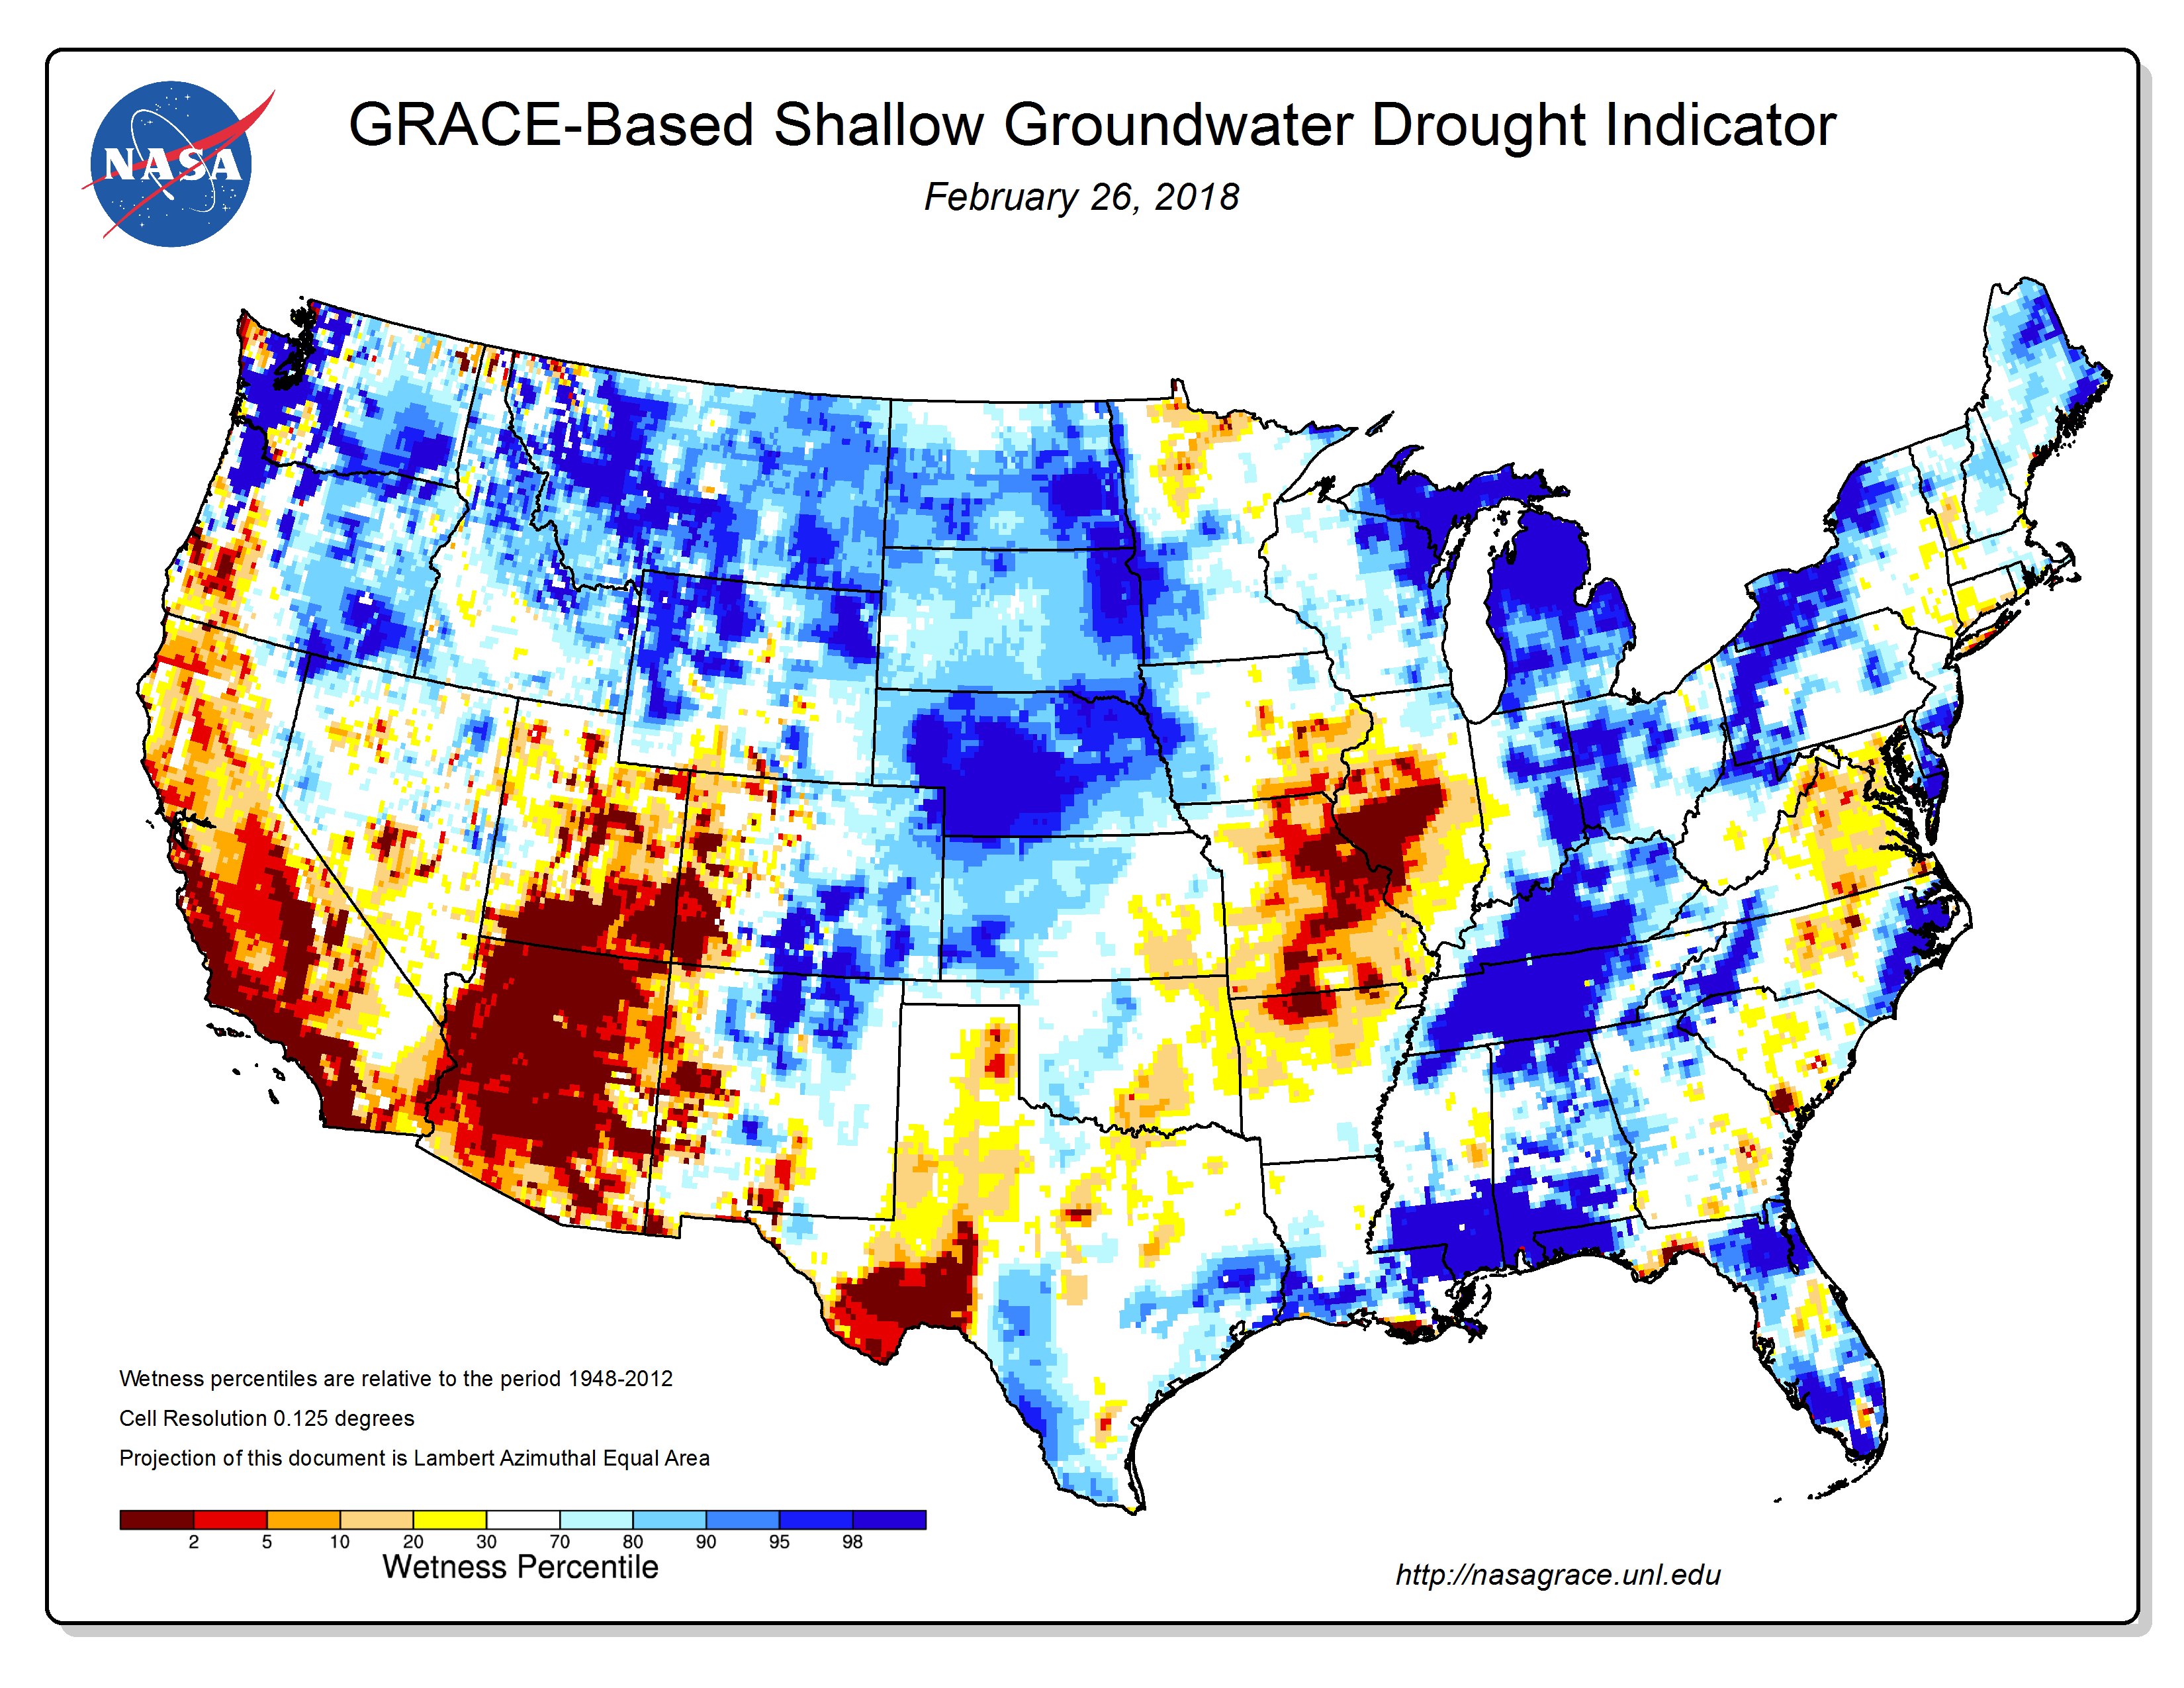
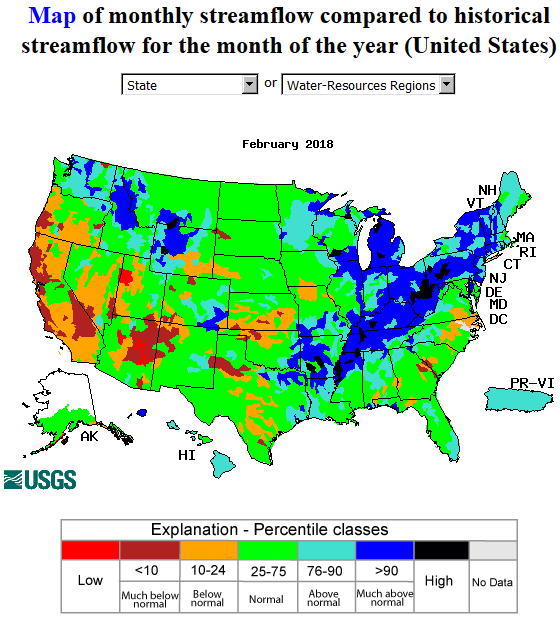
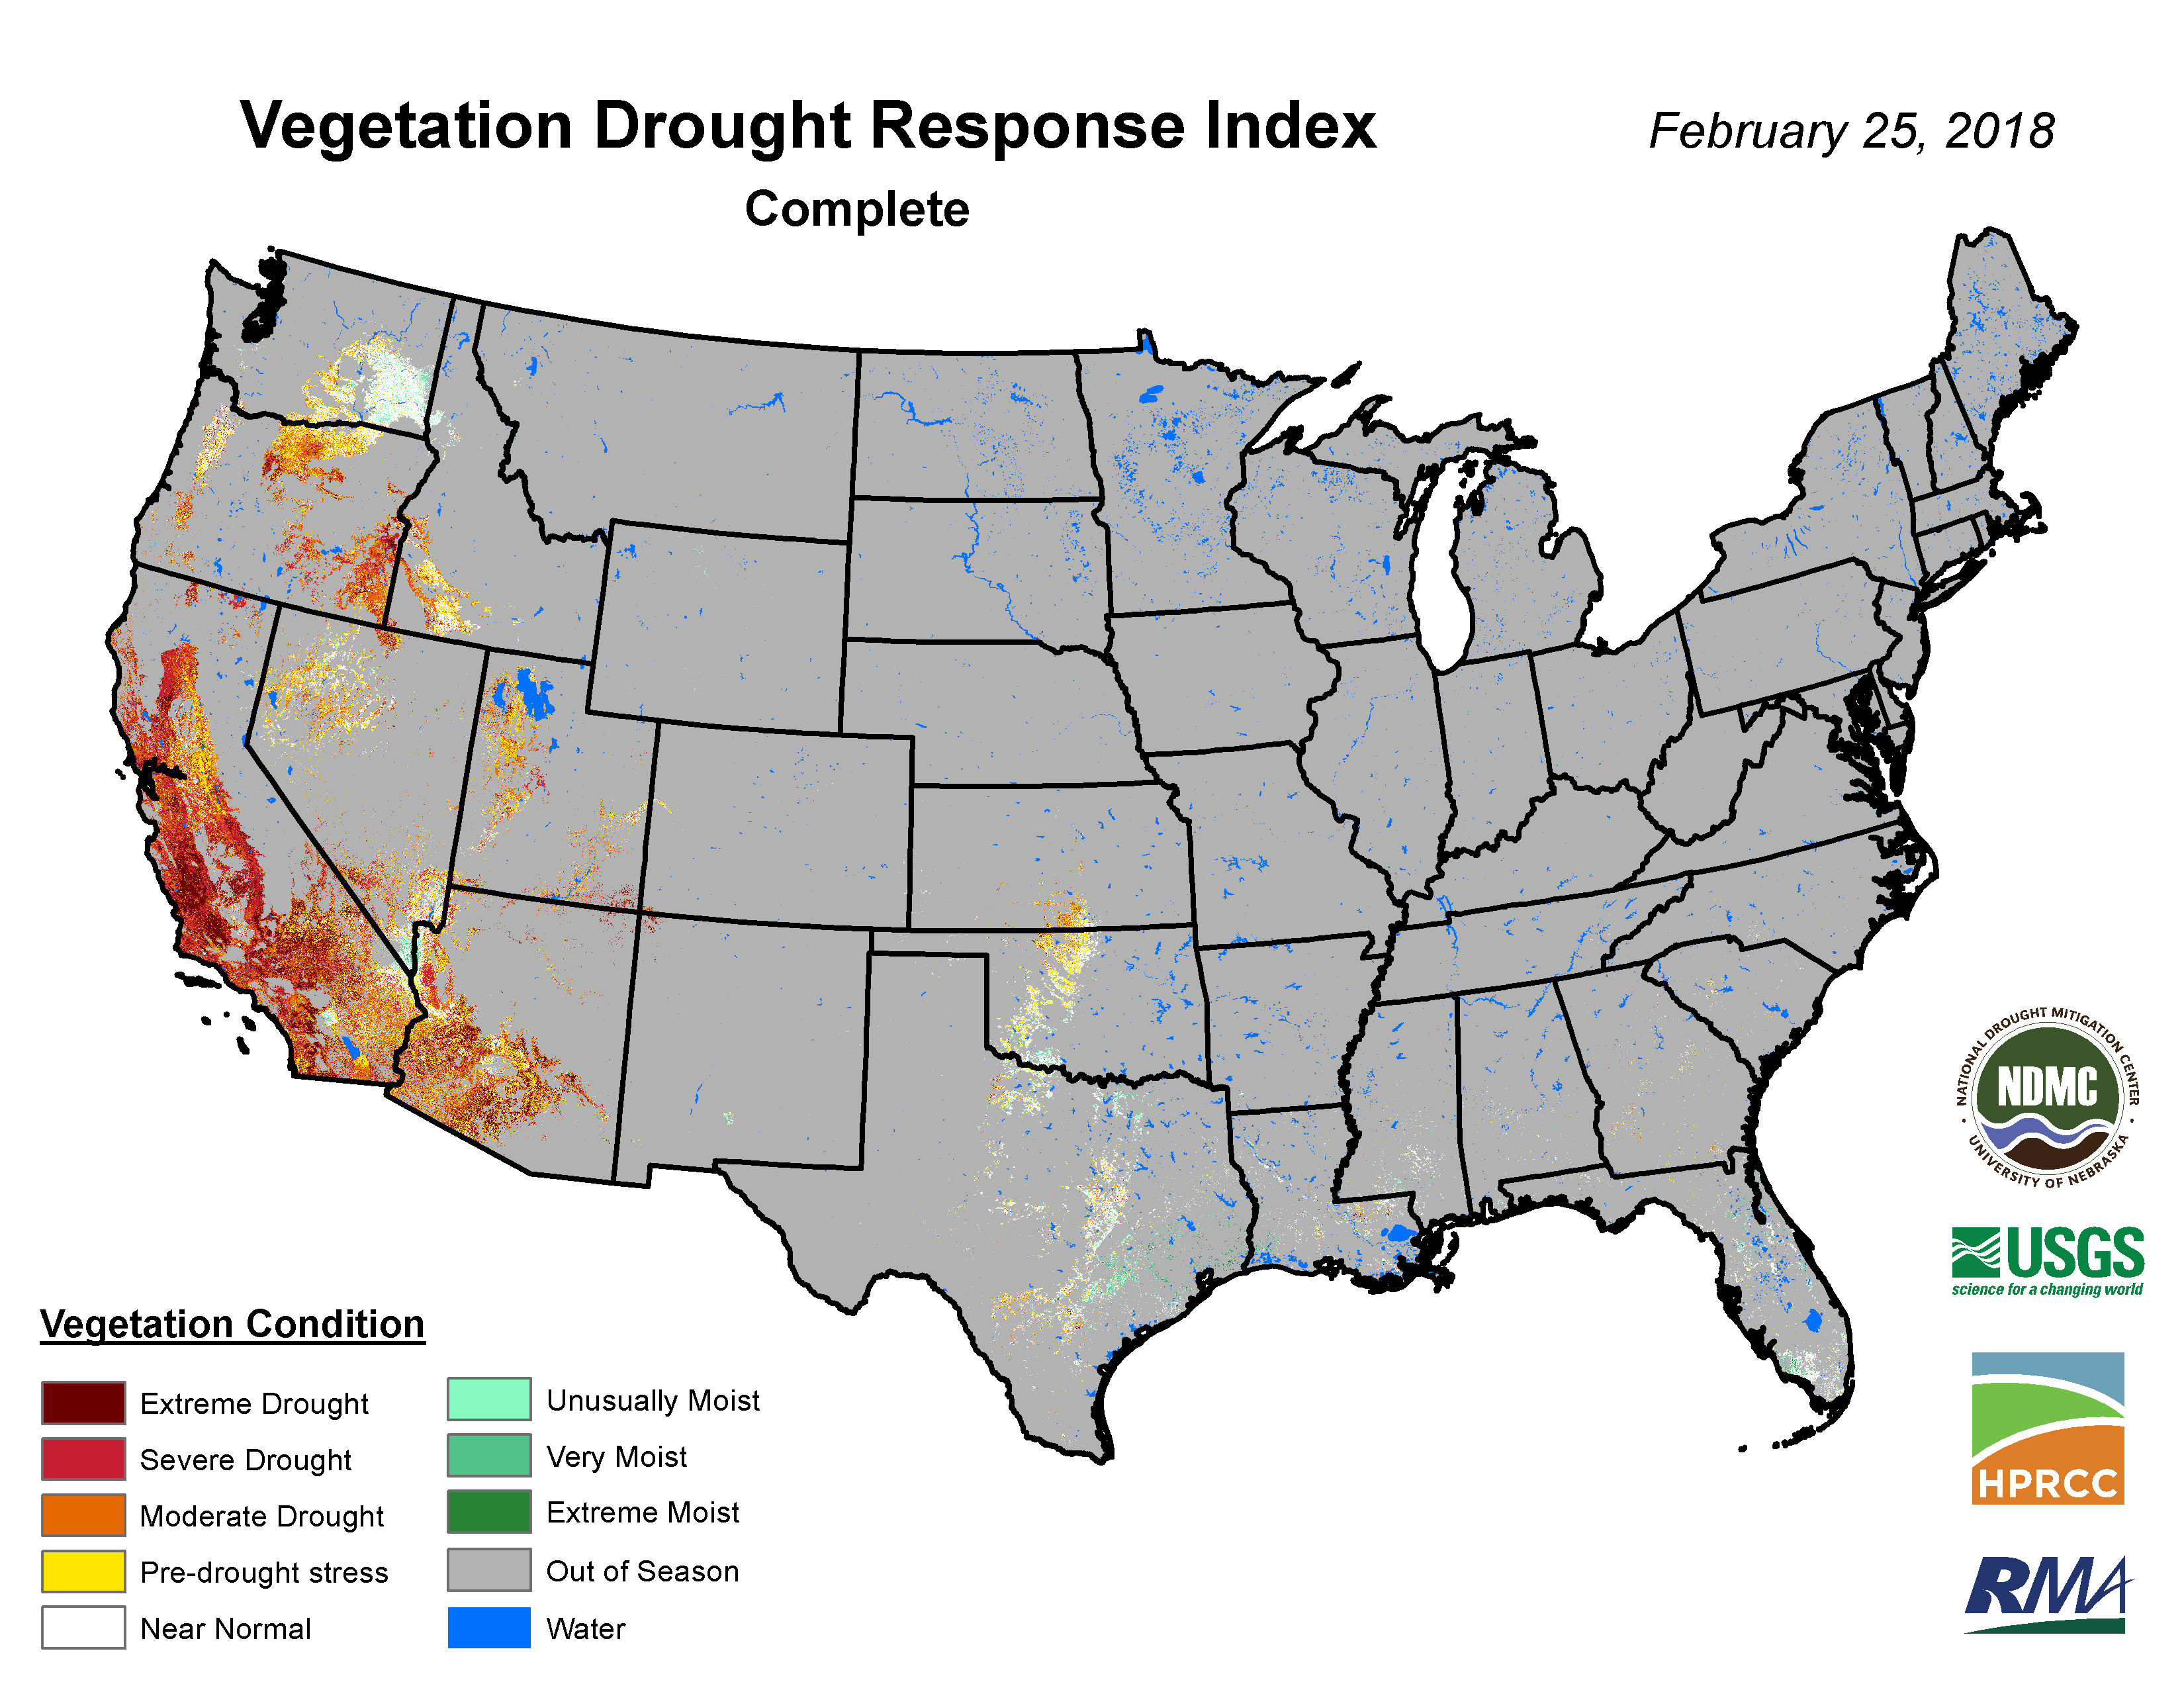
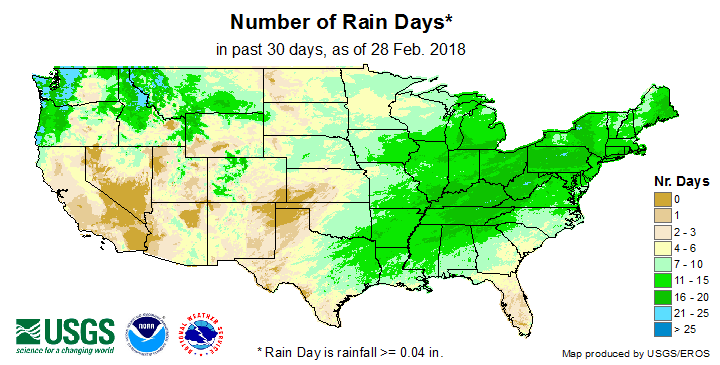
- The drought conditions were reflected in indices for evapotranspiration (EDDI), mountain snow water content and snowpack, groundwater (USGS observations, NASA GRACE model), streamflow, soil moisture (SMOS satellite observations, and CPC, Leaky Bucket, VIC, NASA GRACE, NLDAS top and total layer models), the QuickDRI index, the satellite data-based VegDRI index, some reservoirs, and USGS number of rain days and consecutive dry days.
- Abnormal dryness to severe (D2) drought continued in the northern Plains and the High Plains of Montana. — This status mainly reflected long-term precipitation deficits (last 9 to 12 months), but also dryness in the short term (last 2 to 3 months) and indices for soil moisture (CPC, Leaky Bucket, VIC, NLDAS top and total layer models) and USGS number of rain days and consecutive dry days.
- The heavy rains contracted drought and abnormal dryness across the Mississippi Valley, but abnormal dryness and moderate (D1) drought lingered in parts of the Mid-Mississippi Valley. — These conditions were reflected in indices for evapotranspiration (EDDI) and somewhat in groundwater (USGS observations, NASA GRACE model) and soil moisture (CPC, Leaky Bucket, NLDAS top and total layer models).
- Abnormal dryness and moderate drought lingered in the Southeast to Mid-Atlantic states. — These conditions were reflected in indices for evapotranspiration (EDDI), groundwater (USGS observations, NASA GRACE model), streamflow, soil moisture (SMOS satellite observations, and CPC, Leaky Bucket, VIC, NASA GRACE, NLDAS top and total layer models), the QuickDRI index, and USGS number of rain days and consecutive dry days.
- Abnormal dryness continued in Alaska, reflecting below-normal precipitation over the last one to six months as well as low snowpack and mountain snow water content, especially in the southern to southeastern sections.
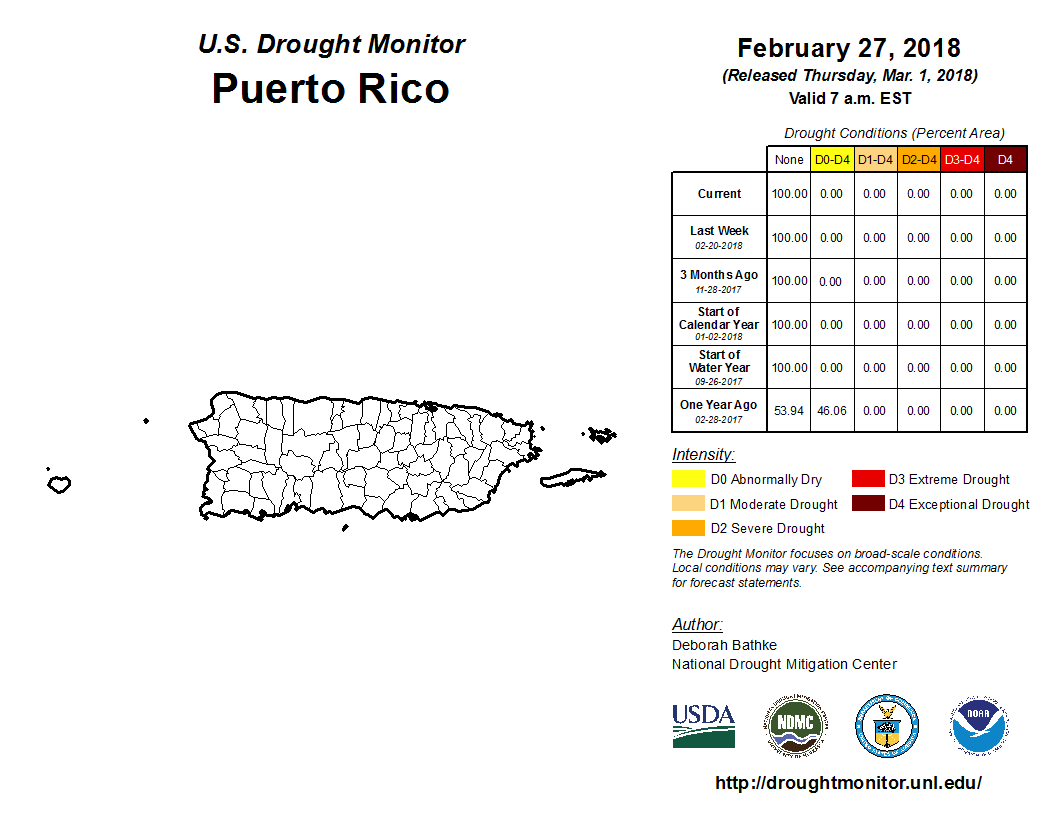
Drought and abnormal dryness were eliminated from Hawaii this month, and there was no drought or abnormal dryness in Puerto Rico.
Palmer Drought Index
The Palmer drought indices measure the balance between moisture demand (evapotranspiration driven by temperature) and moisture supply (precipitation). The Palmer Z Index depicts moisture conditions for the current month, while the Palmer Hydrological Drought Index (PHDI) and Palmer Drought Severity Index (PDSI) depict the current month's cumulative moisture conditions integrated over the last several months. While both the PDSI and PHDI indices show long-term moisture conditions, the PDSI depicts meteorological drought while the PHDI depicts hydrological drought. The PDSI map shows less severe and extensive drought (as well as wet spell conditions) in parts of the country than the PHDI map because the meteorological conditions that produce drought and wet spell conditions are not as long-lasting as the hydrological impacts.
|
 |
Used together, the Palmer Z Index and PHDI maps show that short-term dry conditions occurred across much of the West and into the southern to central High Plains, expanding and intensifying previous long-term drought. Short-term dry conditions occurred across the coastal Southeast, maintaining and (in Georgia) expanding previous long-term drought. Short-term wet conditions occurred in the High Plains of Montana and northern Rockies, shrinking previous long-term drought in southeast Montana and expanding long-term wet conditions in northwest Wyoming. Extremely wet short-term conditions occurred from eastern Texas and eastern Oklahoma to parts of the Northeast, shrinking or eliminating previous long-term drought (in the Mississippi Valley and parts of the Northeast) and laying down the foundation for long-term wet conditions.
Standardized Precipitation Index
The Standardized Precipitation Index (SPI) measures moisture supply. The SPI maps here show the spatial extent of anomalously wet and dry areas at time scales ranging from 1 month to 24 months.
 |
 |
 |

The SPI maps illustrate how moisture conditions have varied considerably through time and space over the last two years. Dryness across much of the West is evident on the 1-month to 12-month maps, and in the Southwest at all time scales. Montana is wet at the 1- to 6-month time scales, but dry in the east at 9 and 12 months. Dryness occurs in parts of the northern Plains for the last 2 to 6 months and last 24 months, and is widespread at the 9- to 12-month time scales. The southern Plains (from eastern New Mexico and western Texas to Kansas) is dry at the 1- to 3-month time scales. Other parts of Texas are dry at 6 months. The central Plains to Mid-Mississippi Valley is dry at 6 to 9 months. Parts of the coastal Southeast to Mid-Atlantic region are dry at all time scales, with the dryness extending into southern New England at 24 months. Much of the region from eastern Texas and eastern Oklahoma to parts of the Great Lakes and Northeast are wet for most of all time periods. Parts of the Pacific Northwest are wet at 12-24 months, and northern California is wet at the 24-month time period.
 |
 |
 |
Regional Discussion

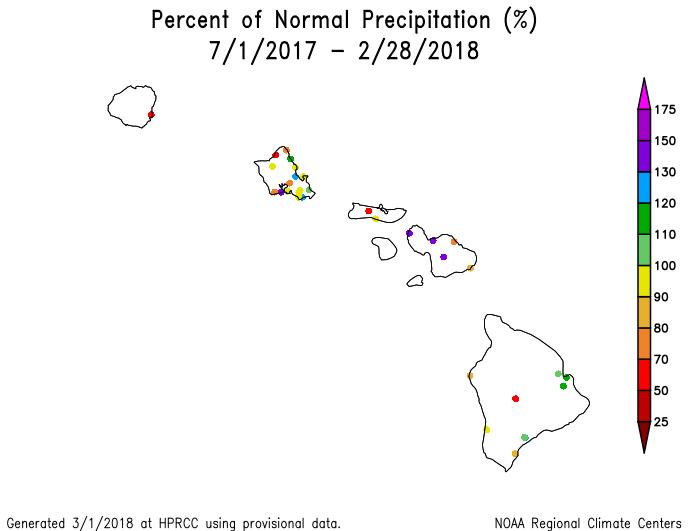
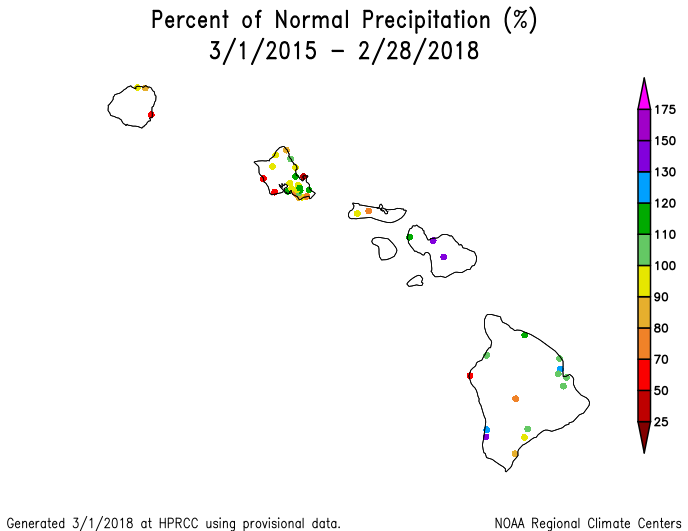
Map of percent of normal precipitation for Hawaii, February 2018.
February 2018 was wetter than normal across almost all of the Hawaiian Islands. A few areas of dryness were evident amidst the wetness at longer time scales (last 2, 3, 5, 6, 8, 11 months). Dryness was more evident at the 12-, 24-, and 36-month time scales. Streamflow was mostly near to above normal. The unusual wetness during February was enough to eliminate abnormal dryness and drought from the state, as seen on the February 27th, 2018 USDM map.
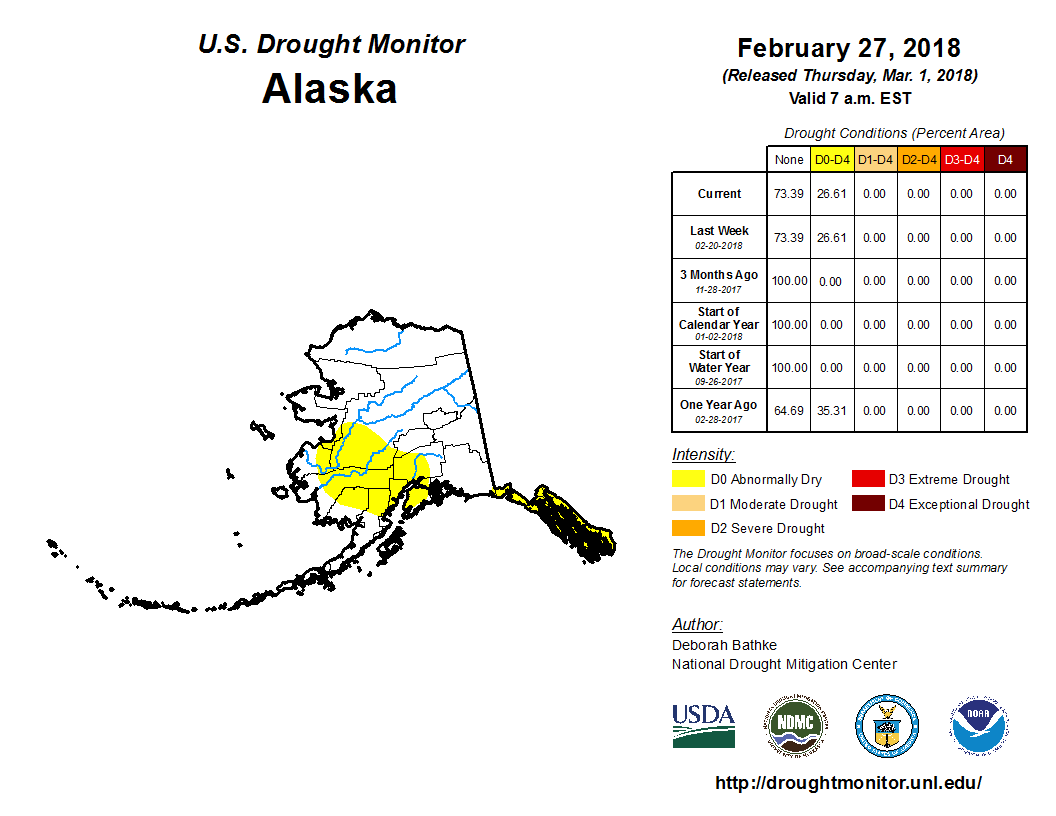
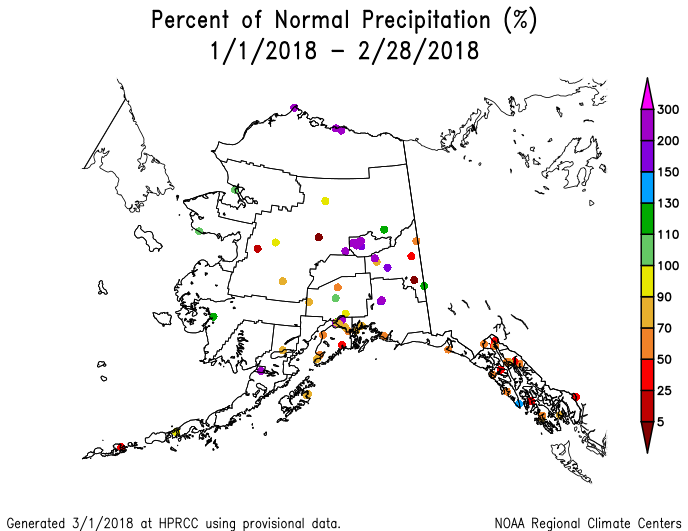
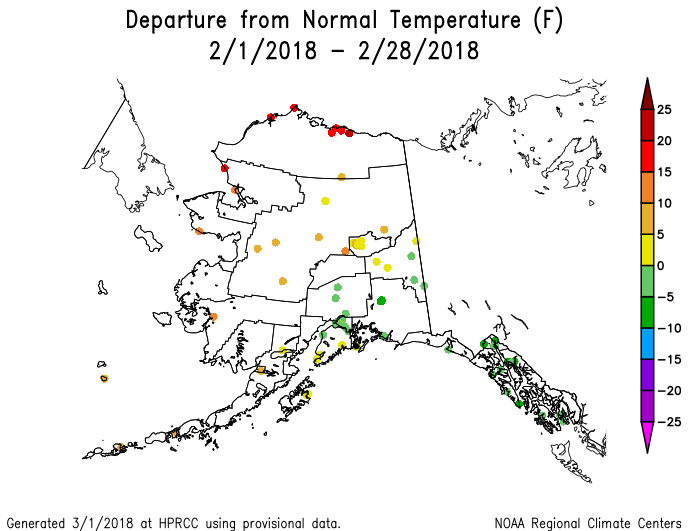
February 2018 was drier than normal across south central Alaska and in the Alaskan panhandle but wetter than normal across most of the rest of the state (climate division, gridded percentile, low elevation station, high elevation [SNOTEL] station maps). Dryness was more widespread across the south and in the interior west for the last 2 (climate division, gridded percentile, low elevation station maps) and 5 (low elevation station, SNOTEL basin maps) months. For the last 3 months (climate division, gridded percentile, low elevation station maps), dryness was focused in the panhandle, interior west, and interior southeast regions. The panhandle was dry, but wetter-than-normal conditions dominated most of the rest of the state for the last 6 (climate division and low elevation station maps), 8, 11, and 12 (climate division, low elevation station maps) months. Dryness was widespread across the south central to panhandle regions for the last 24 months, but wet conditions generally dominated at 36 months. Temperatures were warmer than normal across most of the state, but near to cooler than normal in the southeast, during February (low elevation station, gridded percentile, divisional maps) and the last 2 (low elevation station, gridded percentile, divisional maps), 3 (low elevation station, gridded percentile, divisional maps), 5, 6, and 12 (low elevation station, divisional maps) months. Snow pack and snow water content were below normal at the stations and in the basins in the panhandle and southern coastal regions, but above normal to the north. Streamflow in the south was mostly above normal. An area of abnormally dry (D0) conditions persisted in the panhandle and southwest to south central regions on the February 27th USDM map.
National Weather Service precipitation anomaly maps were not available for Puerto Rico this month. February was wetter than normal at San Juan. Streamflow was mostly above normal across the island. As seen on the February 27th, 2018 USDM map, Puerto Rico was free of drought and abnormal dryness.
CONUS State Precipitation Ranks:

|

|
February 2018 was drier than normal across much of the West, the southern High Plains to central Plains, and coastal Southeast. But there were enough areas of near- to above-normal precipitation mixed in with the below-normal areas that, on a statewide basis, only seven states ranked in the driest third of the 124-year historical record with only one (California at third driest) in the top ten driest category.

|

|
January-February 2018 was drier than normal across much of the West, Great Plains, and Southeast, with record dry conditions occurring in and near the Texas panhandle. Nine states ranked in the driest third of the historical record.

|
|
Dryness was more widespread during the winter (December 2017-February 2018). Sixteen states in the West, Plains, and Southeast ranked in the driest third of the historical record, with four states (California at second driest, Nevada and Utah at eighth driest, and Kansas at tenth driest) in the top ten driest category.
 |
 |
 |
Parts of the West and southern High Plains were record dry during the winter. The dryness was especially pronounced and widespread from northeast New Mexico to southwest Kansas. On a climate division basis, the Oklahoma Panhandle (climate division 1) and Southwest Kansas (climate division 7) both had a record dry December-February. The dry conditions in the southern High Plains actually date back to the middle of October 2017. November 2017-February 2018 was record dry for the Oklahoma Panhandle, Southwest Kansas, and the Texas panhandle (climate division 1, the High Plains climate division).
|
|
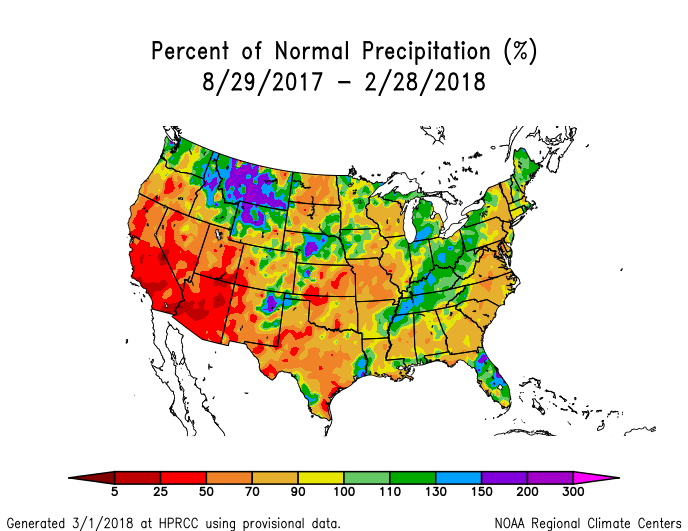
September 2017-February 2018 was dry across most of the West and Plains as well as much of the Mississippi Valley and the coastal Southeast to southern parts of the Northeast. Eighteen states ranked in the driest third of the historical record, with four states (Arizona at third driest, California at fifth driest, Utah at sixth driest, and Nevada at tenth driest) in the top ten driest category.

|

|
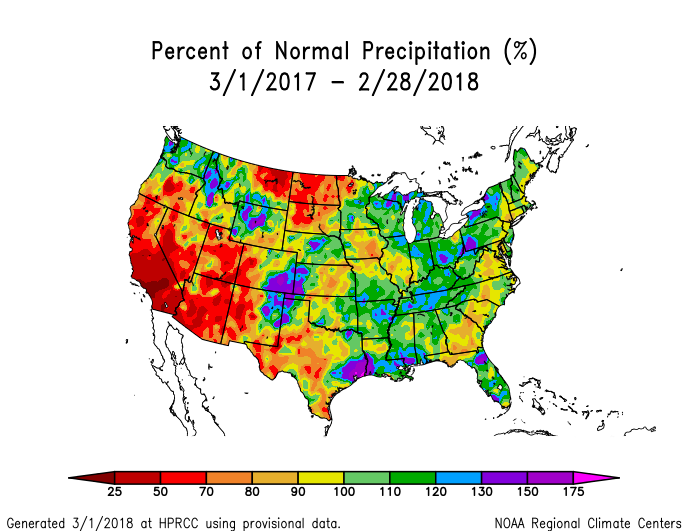
The last 12 months (March 2017-February 2018) were notably dry across much of the West and northern Plains, with dryness in parts of the central to southern Plains, Mid-Mississippi Valley, and coastal Southeast. Five states ranked in the driest third of the historical record, with three states (Arizona at sixth driest, California at eighth driest, and North Dakota at seventh driest) in the top ten driest category. Parts of southern California were record dry.
 Primary Hard Red Winter Wheat Belt precipitation, February, 1895-2018.
|
 Primary Hard Red Winter Wheat Belt precipitation, October-February, 1895-2018.
|

February 2018 was drier than normal in the core of the Primary Hard Red Winter Wheat agricultural belt and not quite as dry, or even a little wet, along the edges of the region, with temperatures near to cooler than normal. The month ranked as the 47th driest and 45th coolest February, regionwide, in the 1895-2018 record.
October marks the beginning of the growing season for the Primary Hard Red Winter Wheat belt. October 2017-February 2018 was drier than normal and warmer than normal across most of the agricultural belt, ranking as the 23rd driest and 31st warmest October-February, regionwide. Precipitation in early October masked the extreme dryness that occurred since then, as seen by November 2017-February 2018 ranking fifth driest in the historical record.
The prolonged below-normal precipitation has dried soils and inhibited crop growth in many states in the Plains. According to statistics from the U.S. Department of Agriculture (USDA), the percentage of topsoil moisture rated short to very short (dry to very dry) at the end of February was 74 percent in Kansas, 50 percent in Oklahoma, 88 percent in New Mexico, 12 percent in Arizona, and 64 percent in Colorado. The percentage of subsoil moisture rated short to very short was 71 percent in Kansas, 73 percent in Oklahoma, 84 percent in New Mexico, 15 percent in Arizona, and 46 percent in Colorado. The percentage of winter wheat rated in poor to very poor condition was 49 percent in Kansas, 78 percent in Oklahoma, 73 percent in Texas, 74 percent in New Mexico, and 27 percent in Colorado. The percentage of pasture and rangeland rated in poor to very poor condition was 48 percent in Oklahoma, 44 percent in Texas, 61 percent in Arizona, and 36 percent in Colorado.
NOAA Regional Climate Centers:
A more detailed drought discussion, provided by the NOAA Regional Climate Centers and others, can be found below.
As described by the High Plains Regional Climate Center, February was cold for most of the High Plains region and dryness continued throughout Kansas and parts of Colorado, causing drought to intensify. In Colorado, snows helped to reduce seasonal snowfall deficits, but these amounts were not enough to improve conditions. This resulted in drought intensification in the southwestern portion of the state. Mounting precipitation deficits in Kansas caused drought to further spread and intensify across the state. Topsoil moisture and winter wheat conditions were not faring well in Kansas at the end of February. According to the U.S. Department of Agriculture Weekly Weather and Crop Bulletin, 76 percent of the topsoil was rated short to very short, and 50 percent of the winter wheat was rated poor to very poor condition. In the Dakotas, where drought has been present in some areas since late spring 2017, producers are preparing for a possible second consecutive year of drought. For instance, the North Dakota State Water Commissioner's Office authorized another $500,000 to be used for the Livestock Water Assistance Program, and the state will assist in hauling feed earlier and in higher quantity this year compared to last year. In western South Dakota, the primary concerns were low stock ponds, poor winter wheat conditions, and increased fire activity.
Tt was quite dry in February throughout North Dakota, Kansas, and southeastern Colorado. The driest area was southwestern Kansas, which received less than 5 percent of normal precipitation. Several top 10 records for driest February were set in this area. For instance, Garden City tied multiple years for its driest February on record, while Liberal tied several years for its 4th driest. While snowfall was scarce in some of these locations, the lack of snowfall was not record-breaking for the month of February.
As for winter precipitation, northern and southern areas of the High Plains were dry, while the central part of the region was wet. Drier conditions were in place across North Dakota and northeastern South Dakota, as well as throughout southern Wyoming and much of Colorado and Kansas, where little precipitation fell during the winter. Southern and western Kansas was hit the hardest, with the following locations setting records for a top 10 driest or least snowiest winter: Salina (2nd driest), Wichita (3rd driest and 5th least snowiest), and Dodge City (5th driest and 5th least snowiest). Colorado snowpack improved slightly over the month in some locations but remained well below normal.
Both improvements and degradations in drought conditions occurred across the High Plains in February, according to the USDM. Overall, the area experiencing abnormal dryness or drought (D0-D4) decreased from 78 percent to 69 percent, thanks to wet conditions across central portions of the region. However, drought intensified in the southern High Plains. Drought conditions continued to worsen in parts of Colorado and Kansas, which have been drier than normal since the fall. The snowpack situation in southwestern Colorado was dire, and conditions warranted the introduction of extreme drought (D3) into the area. Much of Kansas missed out on precipitation in February that would have improved the drought situation. As a result, moderate drought (D1), severe drought (D2), and D3 conditions spread across the state. The drought situation left producers very concerned about available moisture as winter wheat emerges from dormancy. Another concern is the potential for above-normal spring fire activity, particularly across western North Dakota and western and southern Kansas. On the other hand, beneficial precipitation helped to improve drought conditions across southwestern Nebraska, southeastern Wyoming, and northeastern Colorado. D1 was removed from southwestern Nebraska and northeastern Colorado, as well as abnormal dryness (D0) in southeastern Wyoming. These areas received welcomed snowfall during the early part of February.
As explained by the Southern Regional Climate Center, precipitation for the month of February varied spatially throughout the Southern region, and temperatures had a defined gradient across the region. Parts of western Oklahoma and northern and southwestern Texas received 5 percent or less of normal precipitation. Parts of northern, western, central, and southern Texas, northwestern Oklahoma, and extreme southeastern Louisiana received 5-50 percent of normal precipitation.
Over the month of February 2018, extreme drought conditions expanded throughout parts of western Oklahoma and northern Texas. Severe drought conditions remained present in central Oklahoma, and northern and central Texas. Moderate drought conditions expanded throughout southern, central, and western Texas, and central and northeastern Oklahoma. Southeastern Tennessee, central Mississippi, northeastern and extreme southeastern Louisiana, northern Arkansas, eastern Oklahoma, and western, northern, central, and southern Texas are classified as abnormally dry. In contrast, conditions improved from extreme to no drought in central Arkansas.
As summarized by the Midwest Regional Climate Center, February precipitation set a new record for the Midwest with more than double the normal February total, while February temperatures ranged from as much as 8 degrees F (4 C) below normal in the northwestern parts of the region to as much as 8 degrees F (4 C) above normal in the southeastern portions of the region. Drought intensified in the first half of the month in Missouri, reaching extreme levels across about 5 percent of the state, the largest expanse of extreme drought in the state since 2012. The heavy rains in the latter half of the month led to improvements in conditions and all extreme and severe drought was removed from Missouri by the end of the month. The lack of any severe drought in the region last occurred briefly in October of last year. Overall drought coverage fell to under 5 percent of the region in late February marking the smallest footprint for Midwest drought since last July.
As noted by the Southeast Regional Climate Center, the Southeast region observed its warmest February since records began in 1895. Precipitation was well above normal in northern and western portions of the Southeast during February, while southern and eastern portions of the region recorded well-below-normal precipitation. The driest locations were found across much of the Florida Peninsula, as well as portions of east-central and southeastern Georgia, the southern half of South Carolina, eastern North Carolina, and southeastern Virginia. Monthly precipitation totals ranged from 50 to less than 5 percent of normal in these areas. It was unusually wet in Puerto Rico and St. Thomas in the U.S. Virgin Islands.
Significant drought improvement occurred across the Southeast during February, with only 13 percent of the region remaining in moderate (D1) drought at the end of the month. Well-above-normal precipitation during the first half of the month eliminated severe-to-extreme (D2-D3) drought coverage from the region, including over 46 percent of Alabama, 22 percent of Georgia, all of the Florida Panhandle, and the Washington, D.C. metropolitan area. By the end of February, South Carolina was the only drought-free (i.e., less than D1) state in the Southeast, but the coverage of moderate drought fell below 30 percent in the other five states across the region. Predominantly warm, wet weather during the month was beneficial for the growth and green-up of small grains, pastures, and hayfields across much of the region, allowing some livestock producers to reduce supplemental feeding for their cattle. However, pastures in central and southern Florida remained stressed by a lack of precipitation.
As explained by the Northeast Regional Climate Center, February 2018 was wet and warm for the Northeast, ranking as the third warmest and seventh wettest February regionwide. At the beginning of February, 21 percent of the Northeast was abnormally dry, particularly northern New Jersey, along with eastern New York and part of Pennsylvania. Five percent of the region was moderately dry, mainly in eastern Pennsylvania and parts of Maryland and about one percent of the region was experiencing a severe drought, in central Maryland. The wetter-than-normal conditions throughout the month drastically improved the drought conditions, leaving just 2 percent of the Northeast under abnormally dry conditions and a small area of moderate drought in Maryland.
As summarized by the Western Regional Climate Center, temperatures across much of the West didn't stray too far from normal during February 2018. February produced well above normal precipitation in the interior Northwest including Montana and northern Idaho. Wet conditions were also found in southern Arizona and New Mexico. Strong high pressure persisted for much of the month near the West Coast or further north in the Gulf of Alaska leading to well below normal precipitation in California, Nevada, and Oregon. Temperatures were slightly to much above normal in the Southwest and well below normal in Montana and northeast Wyoming.
California was dry throughout the month. Whiskeytown Reservoir, in northern California logged 0.02 in (0.51), 0.18% of normal, setting a new record as the driest February dating back to 1960. Shasta Dam, California came in as the 2nd driest with 0.13 in (3.3 mm), 1% of normal, with records beginning in 1943. Western Nevada also experienced a dry February; Reno recorded 0.20 in (5 mm) of precipitation, 20% of normal and Tonopah received 0.05 in (1.27 mm), 10% of normal. Across California, the Great Basin, Utah, Arizona and New Mexico, snowpack remains in poor shape due to warm and dry conditions with most basins indicating less than 50% of median snow water equivalent. Most of Washington, northern Idaho, Montana, and northern Wyoming have a solid snowpack at greater than 100% of median with some basins in Montana and Wyoming over 150% of median. The lack of snow throughout February caused downhill and cross-country ski areas to close early, or fail to open for the season. On February 21 the Yosemite Ski and Snowboard Area in the Sierra Nevada issued a statement saying there is not enough snow to open the resort during the 2017-18 season. The resort is offering refunds or vouchers for 2018-19 season passes to all pass holders. Throughout February, Royal Gorge Cross Country Ski Area near Lake Tahoe, the largest cross-country resort in North America, was unable to open due to a lack of snow. Shasta Ski Park in northern California had to temporarily close due to a lack of snow and warm weather. Ski Apache on Sierra Blanca Mountain in New Mexico has only recorded 37 inches of snow for the season and a local business says sales are down 75%.
Since the start of February, drought has expanded on the USDM map by one category in many Western states, with 46% of the region (excluding Alaska and Hawaii) in drought and 3% of the region in extreme drought (D3). This D3 region includes parts of Utah, Colorado, New Mexico, and Arizona. Some parts of northern Montana saw a two-category improvement in drought conditions, completely removing all drought status, due to the exceptionally wet month.
In Alaska, temperatures were far above normal in the north and slightly below normal in the south and southeast. Barrow saw only the second ever above zero monthly average at 4 F (-15.6 C), 18.2 F (10.1 C) above normal and the 2nd warmest on record back to 1902. Most of Hawaii saw a wet and stormy pattern that persisted for much of the month resulting in above-normal precipitation across the entire island chain. In Honolulu, 9.42 in (239 mm) of rain, 332% of normal, fell resulting in the 3rd wettest February on record back to 1950. Hana, Maui, received 9.51 in (242 mm), 194% of normal.
Pacific Islands: The NOAA National Weather Service (NWS) offices, the Pacific ENSO Applications Climate Center (PEAC), and partners provided reports on conditions across the Pacific Islands.
In the U.S. Affiliated Pacific Islands (USAPI) (maps — Federated States of Micronesia [FSM], Northern Mariana Islands, Marshall Islands [RMI], Republic of Palau, American Samoa, basinwide), February 2018 was drier than normal at Guam and Saipan, and wetter than normal at Chuuk, Kapingamarangi, Koror, Kosrae, Kwajalein, Lukonor, Majuro, Pago Pago, Pohnpei, and Yap.
Rainfall amounts were below the minimum thresholds (4 or 8 inches) required to meet most monthly water needs at Guam, Rota, and Saipan (in the Marianas); Dugor, Fananu, Maap, North Fanif, Pingelap, Rumung, Tamil, Ulithi, and Woleai (in the FSM); and Ailinglapalap, Kwajalein, Mili, Utirik, and Wotje (in the RMI). February rainfall was above the monthly minimum thresholds at the rest of the regular reporting stations in Micronesia. The 4- and 8-inch thresholds are important because, if monthly precipitation falls below the threshold, then water shortages or drought become a concern. In many of the cases where the rainfall was below the monthly minimum threshold, it was above normal. This is because February is the dry season for most of the stations in Micronesia and normals are low.
Significant dryness developed in the northern Marshall Islands in December 2016, with 8 of the last 15 months each having less than 2 inches at Utirik, 12 had less than 8 inches, and 2 months were missing; that equates to just one month having more than 8 inches (November 2017 had 9.29 inches). At Wotje, 5 of the last 15 months had less than 2 inches each, and 12 had less than 8 inches, with only 3 (June, September, and November 2017) having more than 8 inches. Eight inches is the monthly minimum in the RMI. Jaluit recorded 10.46 inches of rain in November 2017, 9.30 inches in December, 7.80 inches in January 2018, and 8.15 inches in February 2018, but still had the second driest April-February and May-February out of 33 years of data. Ailinglapalap had the fifth driest May-February out of 32 years of data.
Dryness has developed in the last 4 months in the Marianas Islands. Guam had the driest January in their 1957-2018 record. Even though 2.72 inches of rain was recorded in February, which ranked 20th driest, Guam still had the driest November-February on record. Rota and Saipan have each had less than 4 inches (the monthly minimum in the Marianas) of rain for November and December 2017 and January and February 2018; March, April, and May 2017 were also each dry at Saipan. Each of the time periods from March-February through May-February, and August-February through October-February ranked as the second driest (out of 29 or 30 years of data) for Saipan. In the FSM, Lukonor had the fourth driest May-February out of 21 years of data. The National Weather Service office on Guam issued a revised Drought Information Statement on February 21, then updated it on March 7, warning of developing impacts from drought in the Marianas and northern Marshall Islands. Moderate drought impacts have developed on the Marianas, including browning vegetation and some grass fires, low streamflows on Guam, and some springs drying up on Saipan.
As measured by percent of normal precipitation, Guam and Saipan have been drier than normal in the short term (February, the year-to-date [January-February], and the last 3 months [December 2017-February 2018]) as well as the long term (last 12 months [March 2017-February 2018]). Lukonor was drier than normal for the last 3 months and last 12 months, but near to wetter than normal for February and January-February. Koror was drier than normal for January-February, but near to wetter than normal for the other 3 time periods. Chuuk, Kapingamarangi, Kosrae, Kwajalein, Majuro, Pago Pago, Pohnpei, and Yap were near to wetter than normal at all 4 time scales.
| Station Name | Mar 2017 | Apr 2017 | May 2017 | Jun 2017 | Jul 2017 | Aug 2017 | Sep 2017 | Oct 2017 | Nov 2017 | Dec 2017 | Jan 2018 | Feb 2018 | Mar- Feb |
|---|---|---|---|---|---|---|---|---|---|---|---|---|---|
| Chuuk | 189% | 60% | 83% | 73% | 99% | 91% | 110% | 127% | 105% | 120% | 99% | 175% | 102% |
| Guam NAS | 256% | 340% | 56% | 136% | 97% | 66% | 118% | 161% | 57% | 88% | 23% | 90% | 90% |
| Kapingamarangi | 126% | 159% | 114% | 81% | 102% | 41% | 92% | 72% | 64% | 420% | 95% | 222% | 117% |
| Koror | 245% | 76% | 107% | 89% | 130% | 104% | 161% | 118% | 84% | 160% | 82% | 105% | 110% |
| Kosrae | 150% | 112% | 115% | 80% | 104% | 93% | 155% | 143% | 168% | 123% | 100% | 147% | 103% |
| Kwajalein | 46% | 65% | 77% | 156% | 70% | 64% | 205% | 88% | 83% | 71% | 458% | 159% | 109% |
| Lukonor | 160% | 85% | 80% | 60% | 103% | 63% | 84% | 116% | 136% | 70% | 129% | 106% | 85% |
| Majuro | 199% | 110% | 49% | 118% | 112% | 111% | 187% | 143% | 76% | 172% | 204% | 120% | 128% |
| Pago Pago | 52% | 87% | 240% | 93% | 84% | 145% | 96% | 217% | 127% | 94% | 115% | 271% | 122% |
| Pohnpei | 115% | 96% | 92% | 141% | 113% | 55% | 122% | 81% | 95% | 130% | 167% | 219% | 111% |
| Saipan | 108% | 115% | 66% | 128% | 72% | 65% | 84% | 66% | 62% | 60% | 117% | 87% | 75% |
| Yap | 205% | 110% | 69% | 68% | 121% | 55% | 93% | 156% | 106% | 132% | 182% | 163% | 106% |
| Station Name | Mar 2017 | Apr 2017 | May 2017 | Jun 2017 | Jul 2017 | Aug 2017 | Sep 2017 | Oct 2017 | Nov 2017 | Dec 2017 | Jan 2018 | Feb 2018 | Mar- Feb |
|---|---|---|---|---|---|---|---|---|---|---|---|---|---|
| Chuuk | 15.74" | 7.51" | 9.40" | 8.50" | 11.86" | 11.65" | 12.92" | 14.64" | 11.15" | 13.52" | 10.01" | 12.70" | 139.6" |
| Guam NAS | 5.30" | 8.60" | 1.89" | 8.40" | 9.86" | 9.73" | 14.92" | 18.47" | 4.23" | 4.49" | 0.94" | 2.72" | 89.55" |
| Kapingamarangi | 14.44" | 21.70" | 13.75" | 11.15" | 14.47" | 3.35" | 9.13" | 5.93" | 5.95" | 41.30" | 8.71" | 20.59" | 170.47" |
| Koror | 18.26" | 5.54" | 12.61" | 15.53" | 24.14" | 13.98" | 18.90" | 14.03" | 9.55" | 17.89" | 8.38" | 9.03" | 167.84" |
| Kosrae | 24.16" | 19.62" | 20.34" | 11.73" | 15.57" | 13.23" | 22.02" | 15.65" | 23.21" | 19.85" | 16.62" | 19.03" | 221.03" |
| Kwajalein | 1.07" | 3.44" | 5.20" | 10.80" | 6.91" | 6.28" | 22.06" | 9.83" | 9.40" | 4.72" | 14.46" | 4.20" | 98.37" |
| Lukonor | 14.83" | 9.61" | 9.41" | 6.97" | 16.47" | 8.88" | 8.51" | 13.10" | 12.38" | 7.90" | 10.83" | 9.50" | 128.39" |
| Majuro | 13.07" | 10.36" | 4.93" | 13.03" | 12.52" | 13.00" | 20.93" | 18.21" | 10.27" | 19.59" | 15.76" | 8.29" | 159.96" |
| Pago Pago | 5.60" | 8.14" | 23.23" | 4.94" | 4.66" | 7.78" | 6.26" | 20.11" | 12.89" | 12.06" | 15.37" | 32.47" | 153.51" |
| Pohnpei | 15.16" | 17.68" | 18.45" | 20.85" | 17.45" | 7.82" | 15.27" | 12.31" | 14.13" | 20.86" | 22.03" | 20.94" | 202.95" |
| Saipan | 2.04" | 3.02" | 1.58" | 4.63" | 6.45" | 8.59" | 8.47" | 7.01" | 3.48" | 2.31" | 2.97" | 2.25" | 52.8" |
| Yap | 9.35" | 6.19" | 5.40" | 8.16" | 18.27" | 8.20" | 12.59" | 18.99" | 9.40" | 11.27" | 11.64" | 8.44" | 127.9" |
| Station Name | Mar 2017 | Apr 2017 | May 2017 | Jun 2017 | Jul 2017 | Aug 2017 | Sep 2017 | Oct 2017 | Nov 2017 | Dec 2017 | Jan 2018 | Feb 2018 | Mar- Feb |
|---|---|---|---|---|---|---|---|---|---|---|---|---|---|
| Chuuk | 8.32" | 12.47" | 11.30" | 11.66" | 11.98" | 12.86" | 11.71" | 11.51" | 10.61" | 11.25" | 10.10" | 7.25" | 136.77" |
| Guam NAS | 2.07" | 2.53" | 3.40" | 6.18" | 10.14" | 14.74" | 12.66" | 11.44" | 7.38" | 5.11" | 4.01" | 3.03" | 99.09" |
| Kapingamarangi | 11.43" | 13.64" | 12.08" | 13.78" | 14.15" | 8.13" | 9.93" | 8.19" | 9.27" | 9.84" | 9.15" | 9.27" | 145.85" |
| Koror | 7.44" | 7.32" | 11.83" | 17.48" | 18.53" | 13.50" | 11.77" | 11.84" | 11.39" | 11.16" | 10.18" | 8.56" | 152.90" |
| Kosrae | 16.06" | 17.51" | 17.75" | 14.64" | 14.91" | 14.22" | 14.22" | 10.94" | 13.83" | 16.11" | 16.67" | 12.93" | 213.87" |
| Kwajalein | 2.35" | 5.26" | 6.72" | 6.93" | 9.87" | 9.74" | 10.74" | 11.18" | 11.28" | 6.66" | 3.16" | 2.64" | 90.41" |
| Lukonor | 9.26" | 11.31" | 11.69" | 11.65" | 15.93" | 14.04" | 10.15" | 11.32" | 9.08" | 11.27" | 8.41" | 8.93" | 151.36" |
| Majuro | 6.58" | 9.42" | 10.11" | 11.01" | 11.17" | 11.69" | 11.17" | 12.73" | 13.44" | 11.39" | 7.74" | 6.88" | 125.25" |
| Pago Pago | 10.68" | 9.39" | 9.66" | 5.33" | 5.55" | 5.38" | 6.53" | 9.26" | 10.14" | 12.84" | 13.34" | 12.00" | 125.57" |
| Pohnpei | 13.17" | 18.41" | 19.96" | 14.81" | 15.43" | 14.26" | 12.55" | 15.27" | 14.83" | 16.08" | 13.18" | 9.55" | 182.36" |
| Saipan | 1.89" | 2.63" | 2.38" | 3.62" | 8.91" | 13.13" | 10.09" | 10.62" | 5.61" | 3.85" | 2.53" | 2.59" | 70.25" |
| Yap | 4.56" | 5.63" | 7.85" | 12.04" | 15.08" | 14.82" | 13.50" | 12.18" | 8.83" | 8.51" | 6.39" | 5.19" | 120.31" |
The following analysis of historical data for the USAPI stations in the Global Historical Climatology Network-Daily (GHCN-D) dataset, augmented with fill-in data from the 1981-2010 Normals, helps put the current data into historical perspective by computing ranks based on the period of record. The table below lists the precipitation ranks for February 2018, September 2017-February 2018 (last 6 months), and March 2017-February 2018 (the last 12 months). Some stations have a long period of record and their dataset is fairly complete, while other stations have a shorter period of record and the dataset has some missing data.
Rank of 1 = driest.
| Station | Feb 2018 Rank |
Feb No. of Years |
Sep 2017- Feb 2018 Rank |
Sep- Feb No. of Years |
Mar 2017- Feb 2018 Rank |
Mar- Feb No. of Years |
Period of Record |
| Jaluit | 27 | 35 | 7 | 33 | 3 | 33 | 1981-2018 |
| Koror | 38 | 67 | 49 | 67 | 55 | 66 | 1951-2018 |
| Woleai | 11 | 34 | 14 | 29 | 9 | 22 | 1968-2018 |
| Yap | 53 | 67 | 53 | 67 | 43 | 66 | 1951-2018 |
| Majuro | 40 | 64 | 62 | 64 | 56 | 63 | 1954-2018 |
| Mili | 17 | 34 | MSG | 31 | MSG | 31 | 1981-2018 |
| Ulithi | 21 | 36 | 33 | 34 | MSG | 33 | 1981-2018 |
| Ailinglapalap | 18 | 35 | 19 | 33 | 8 | 32 | 1981-2018 |
| Kosrae | 39 | 52 | 27 | 34 | 20 | 29 | 1954-2018 |
| Lukonor | 23 | 34 | 17 | 32 | 10 | 21 | 1981-2018 |
| Saipan | 18 | 38 | 2 | 30 | 2 | 29 | 1981-2018 |
| Pohnpei | 66 | 67 | 62 | 67 | 54 | 66 | 1951-2018 |
| Kwajalein | 46 | 66 | 62 | 66 | 33 | 65 | 1952-2018 |
| Kapingamarangi | 29 | 31 | 17 | 18 | 12 | 13 | 1962-2018 |
| Chuuk | 61 | 67 | 51 | 67 | 31 | 66 | 1951-2018 |
| Guam | 20 | 61 | 21 | 61 | 20 | 61 | 1957-2018 |
| Nukuoro | 33 | 36 | 34 | 34 | 33 | 33 | 1981-2018 |
| Pago Pago | 51 | 52 | 50 | 52 | 45 | 51 | 1966-2018 |
| Wotje | 24 | 35 | 27 | 32 | 24 | 32 | 1981-2018 |
| Utirik | 7 | 17 | 4 | 8 | MSG | 2 | 1985-2018 |


[top]
State/Regional/National Moisture Status
A detailed review of drought and moisture conditions is available for all contiguous U.S. states, the nine standard regions, and the nation (contiguous U.S.):
| northeast u. s. | east north central u. s. | central u. s. |
| southeast u. s. | west north central u. s. | south u. s. |
| southwest u. s. | northwest u. s. | west u. s. |
| Contiguous United States |
[top]
Contacts & Questions