|
Contents Of This Report: |
|
Please note that the values presented in this report are based on preliminary data. They will change when the final data are processed, but will not be replaced on these pages.
National Drought Overview
|
|
[top]
Detailed Drought Discussion
Overview
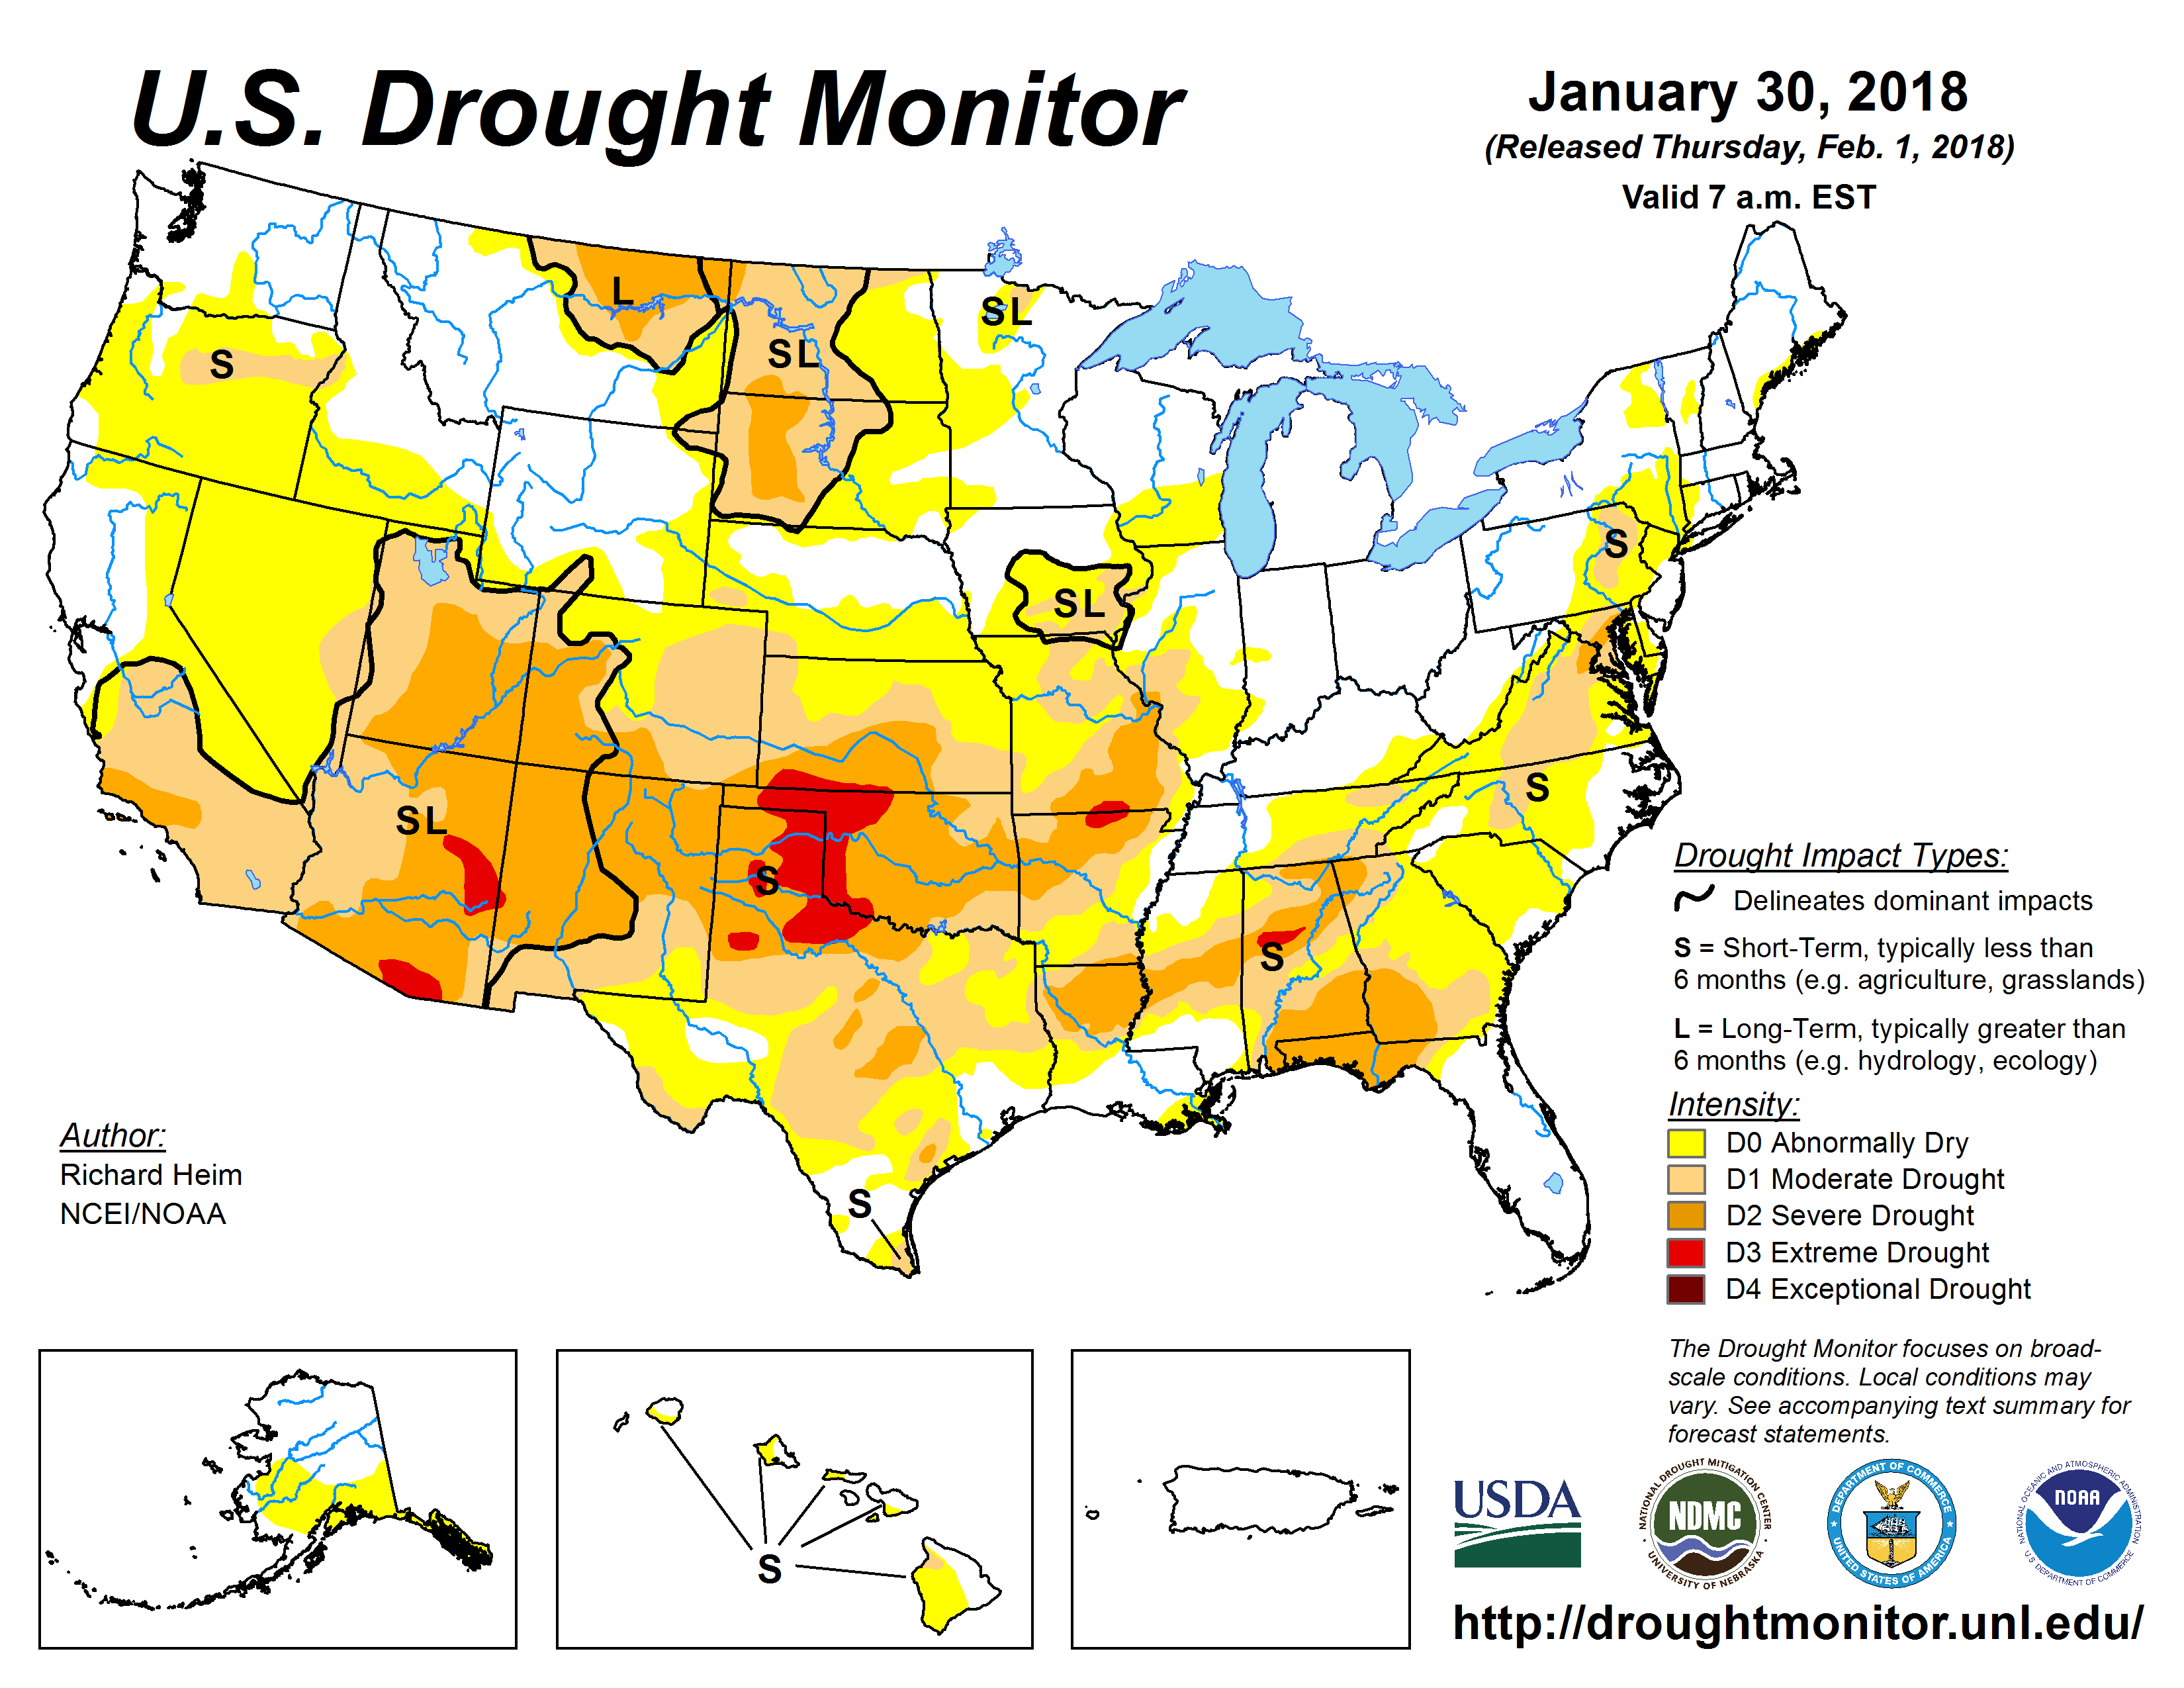
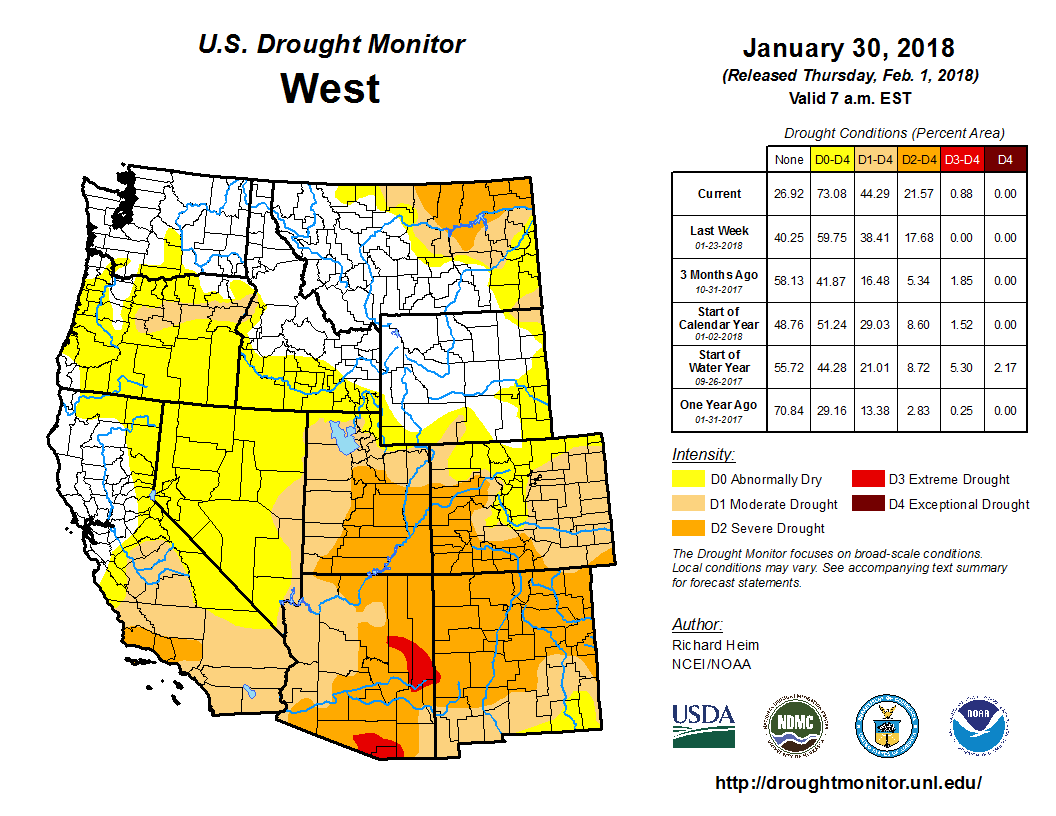
The U.S. Drought Monitor drought map valid January 30, 2018.
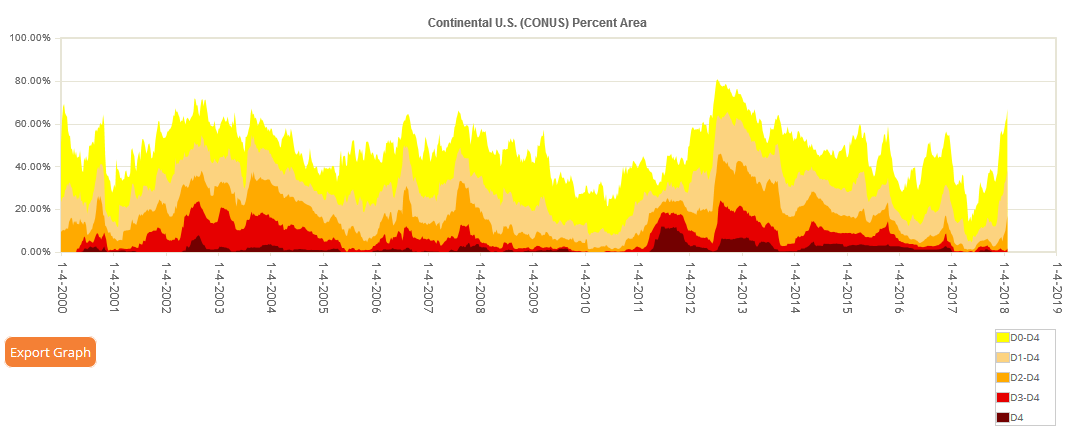
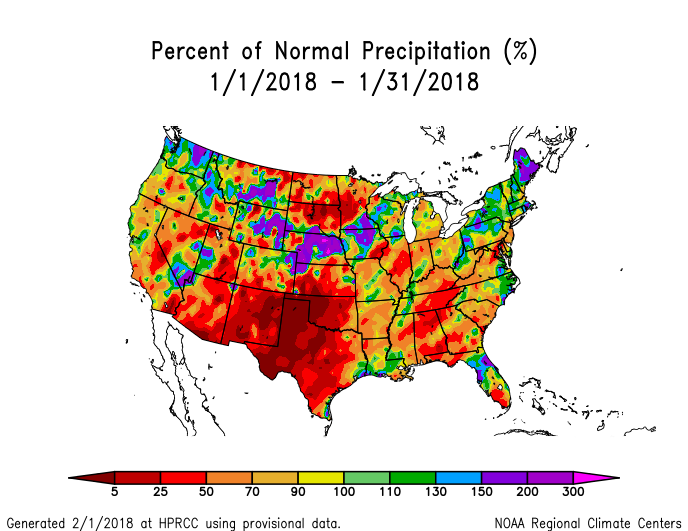
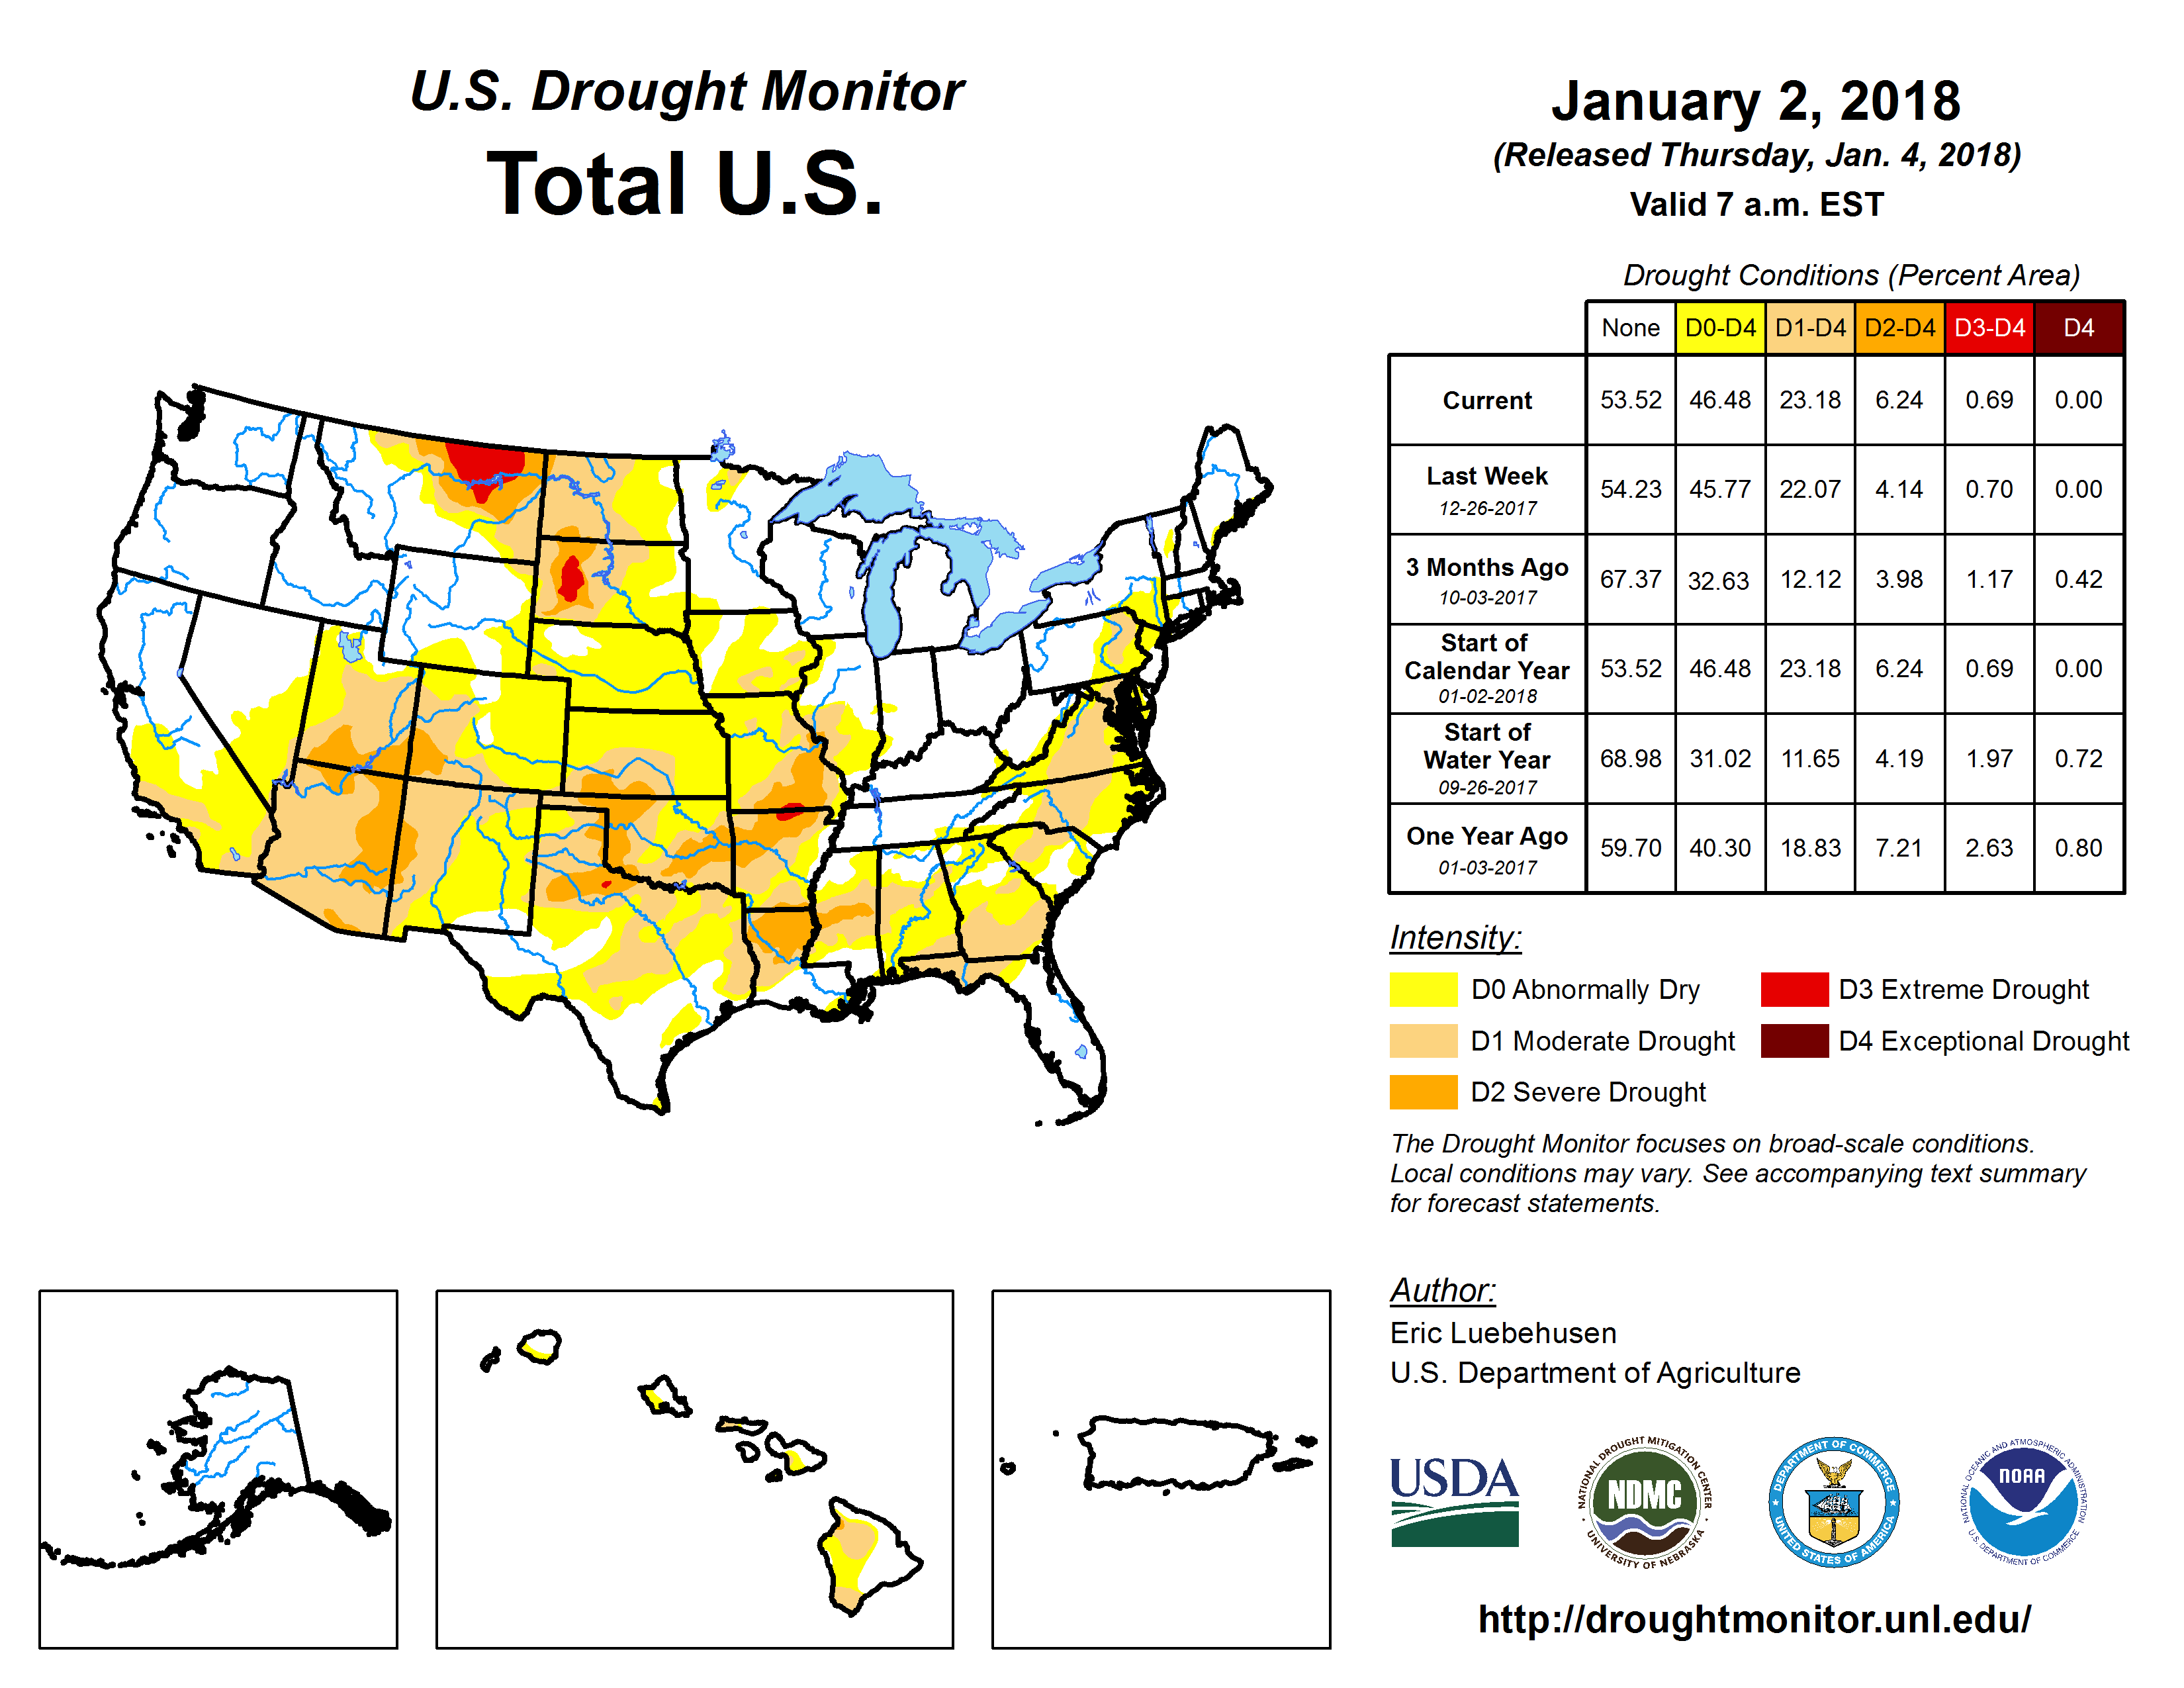
The atmospheric circulation experienced several shifts during January 2018, switching from a ridge/trough pattern to a zonal pattern then back to a ridge/trough pattern followed by zonal again. Like last month, the flip/flopping between western ridge, westerly flow, and (over the central CONUS) northwesterly flow generally kept moist air masses away from much of the country for much of the month. The net result was a drier-than-normal month across much of the West, the northern and especially southern Plains, and the Southeast to Ohio Valley and Mid-Atlantic. Parts of the Pacific Northwest to central Plains to western Great Lakes, and the Northeast, were wetter than normal. Alaska was warmer than normal with drier-than-normal conditions in the west and wetter than normal in parts of the southeast. Hawaii was mostly drier than normal. Even though January is in the midst of winter, daytime temperatures were still well above freezing in the western CONUS. The persistent ridging brought excessive warmth to the West, especially the Southwest, increasing evapotranspiration which exacerbated the dry conditions, resulting in expansion of abnormal dryness and drought in this region. For the Southwest, as well as southern to central Plains, Mid-Mississippi Valley, Mid-Atlantic region, and parts of the Southeast and Northeast, the January dryness was a continuation of dry conditions which have lasted for the last 2, 3, and even 6 months in some areas. Consequently, abnormal dryness and drought expanded in these areas. There was some contraction of drought and abnormal dryness in the areas where January precipitation was above normal (Montana and parts of the central Plains and Southeast), but expansion outweighed contraction, so the USDM-based national moderate-to-exceptional drought footprint across the CONUS expanded from 27.7 percent of the CONUS at the end of December to 38.4 percent of the CONUS at the end of January (from 23.2 percent to 32.1 percent for all of the U.S.). According to the Palmer Drought Index, which goes back to the beginning of the 20th century, about 27.1 percent of the CONUS was in moderate to extreme drought at the end of January, increasing about 2.3 percent from the 24.8 percent at the end of December.
Drought conditions at the end of the month, as depicted on the January 30th, 2018 USDM map, included the following core drought and abnormally dry areas:
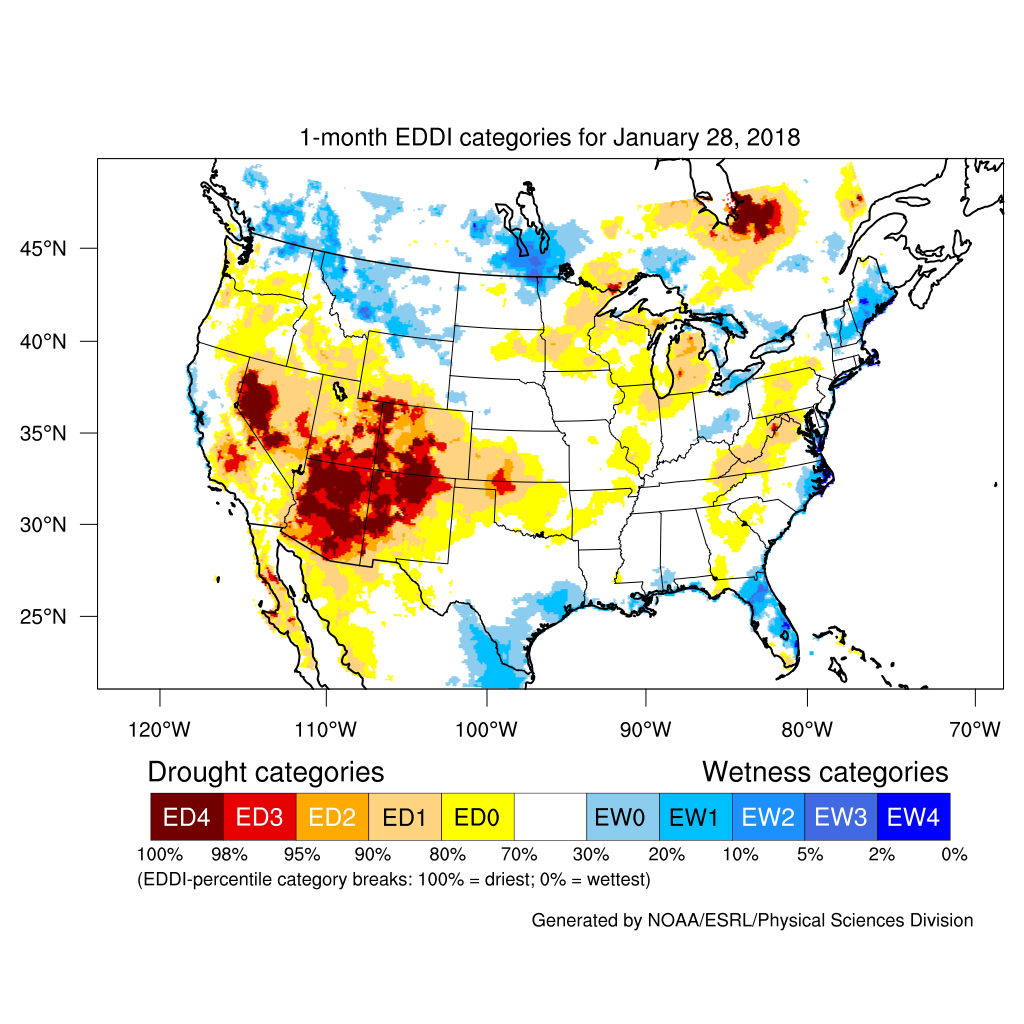
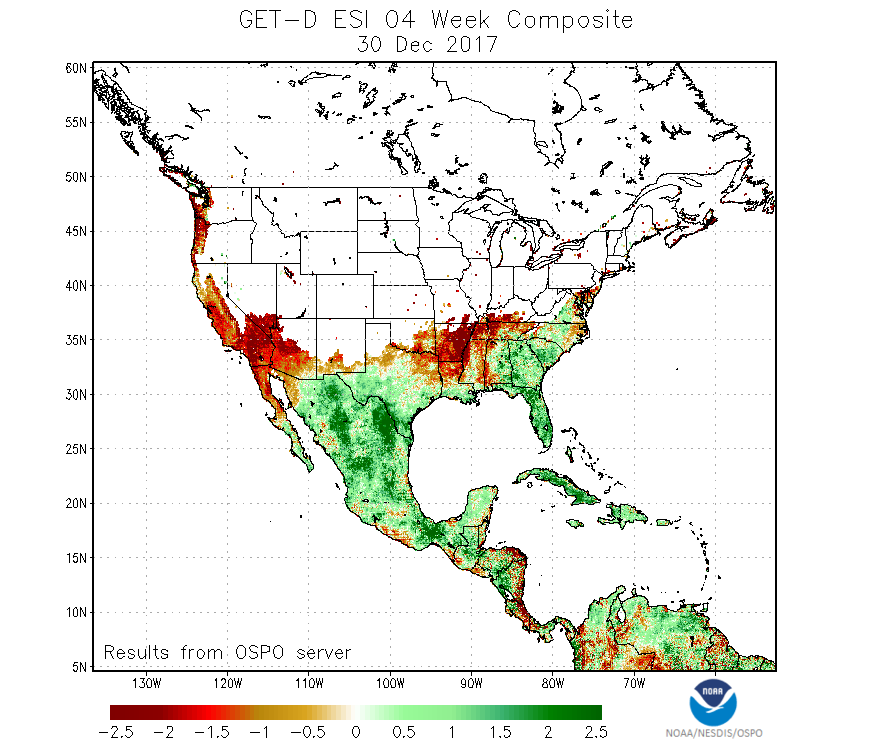
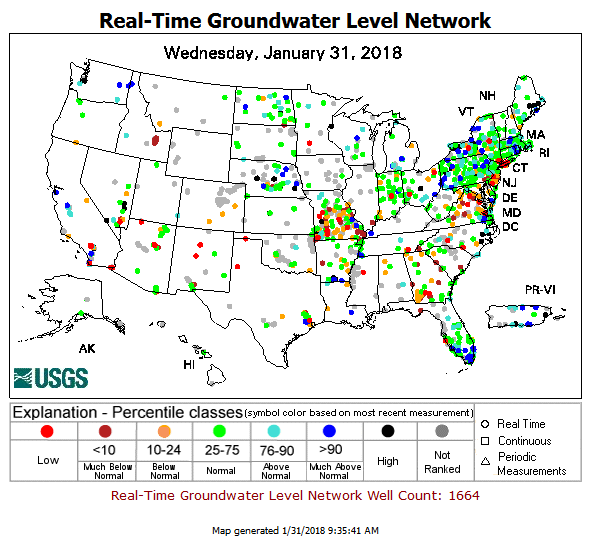
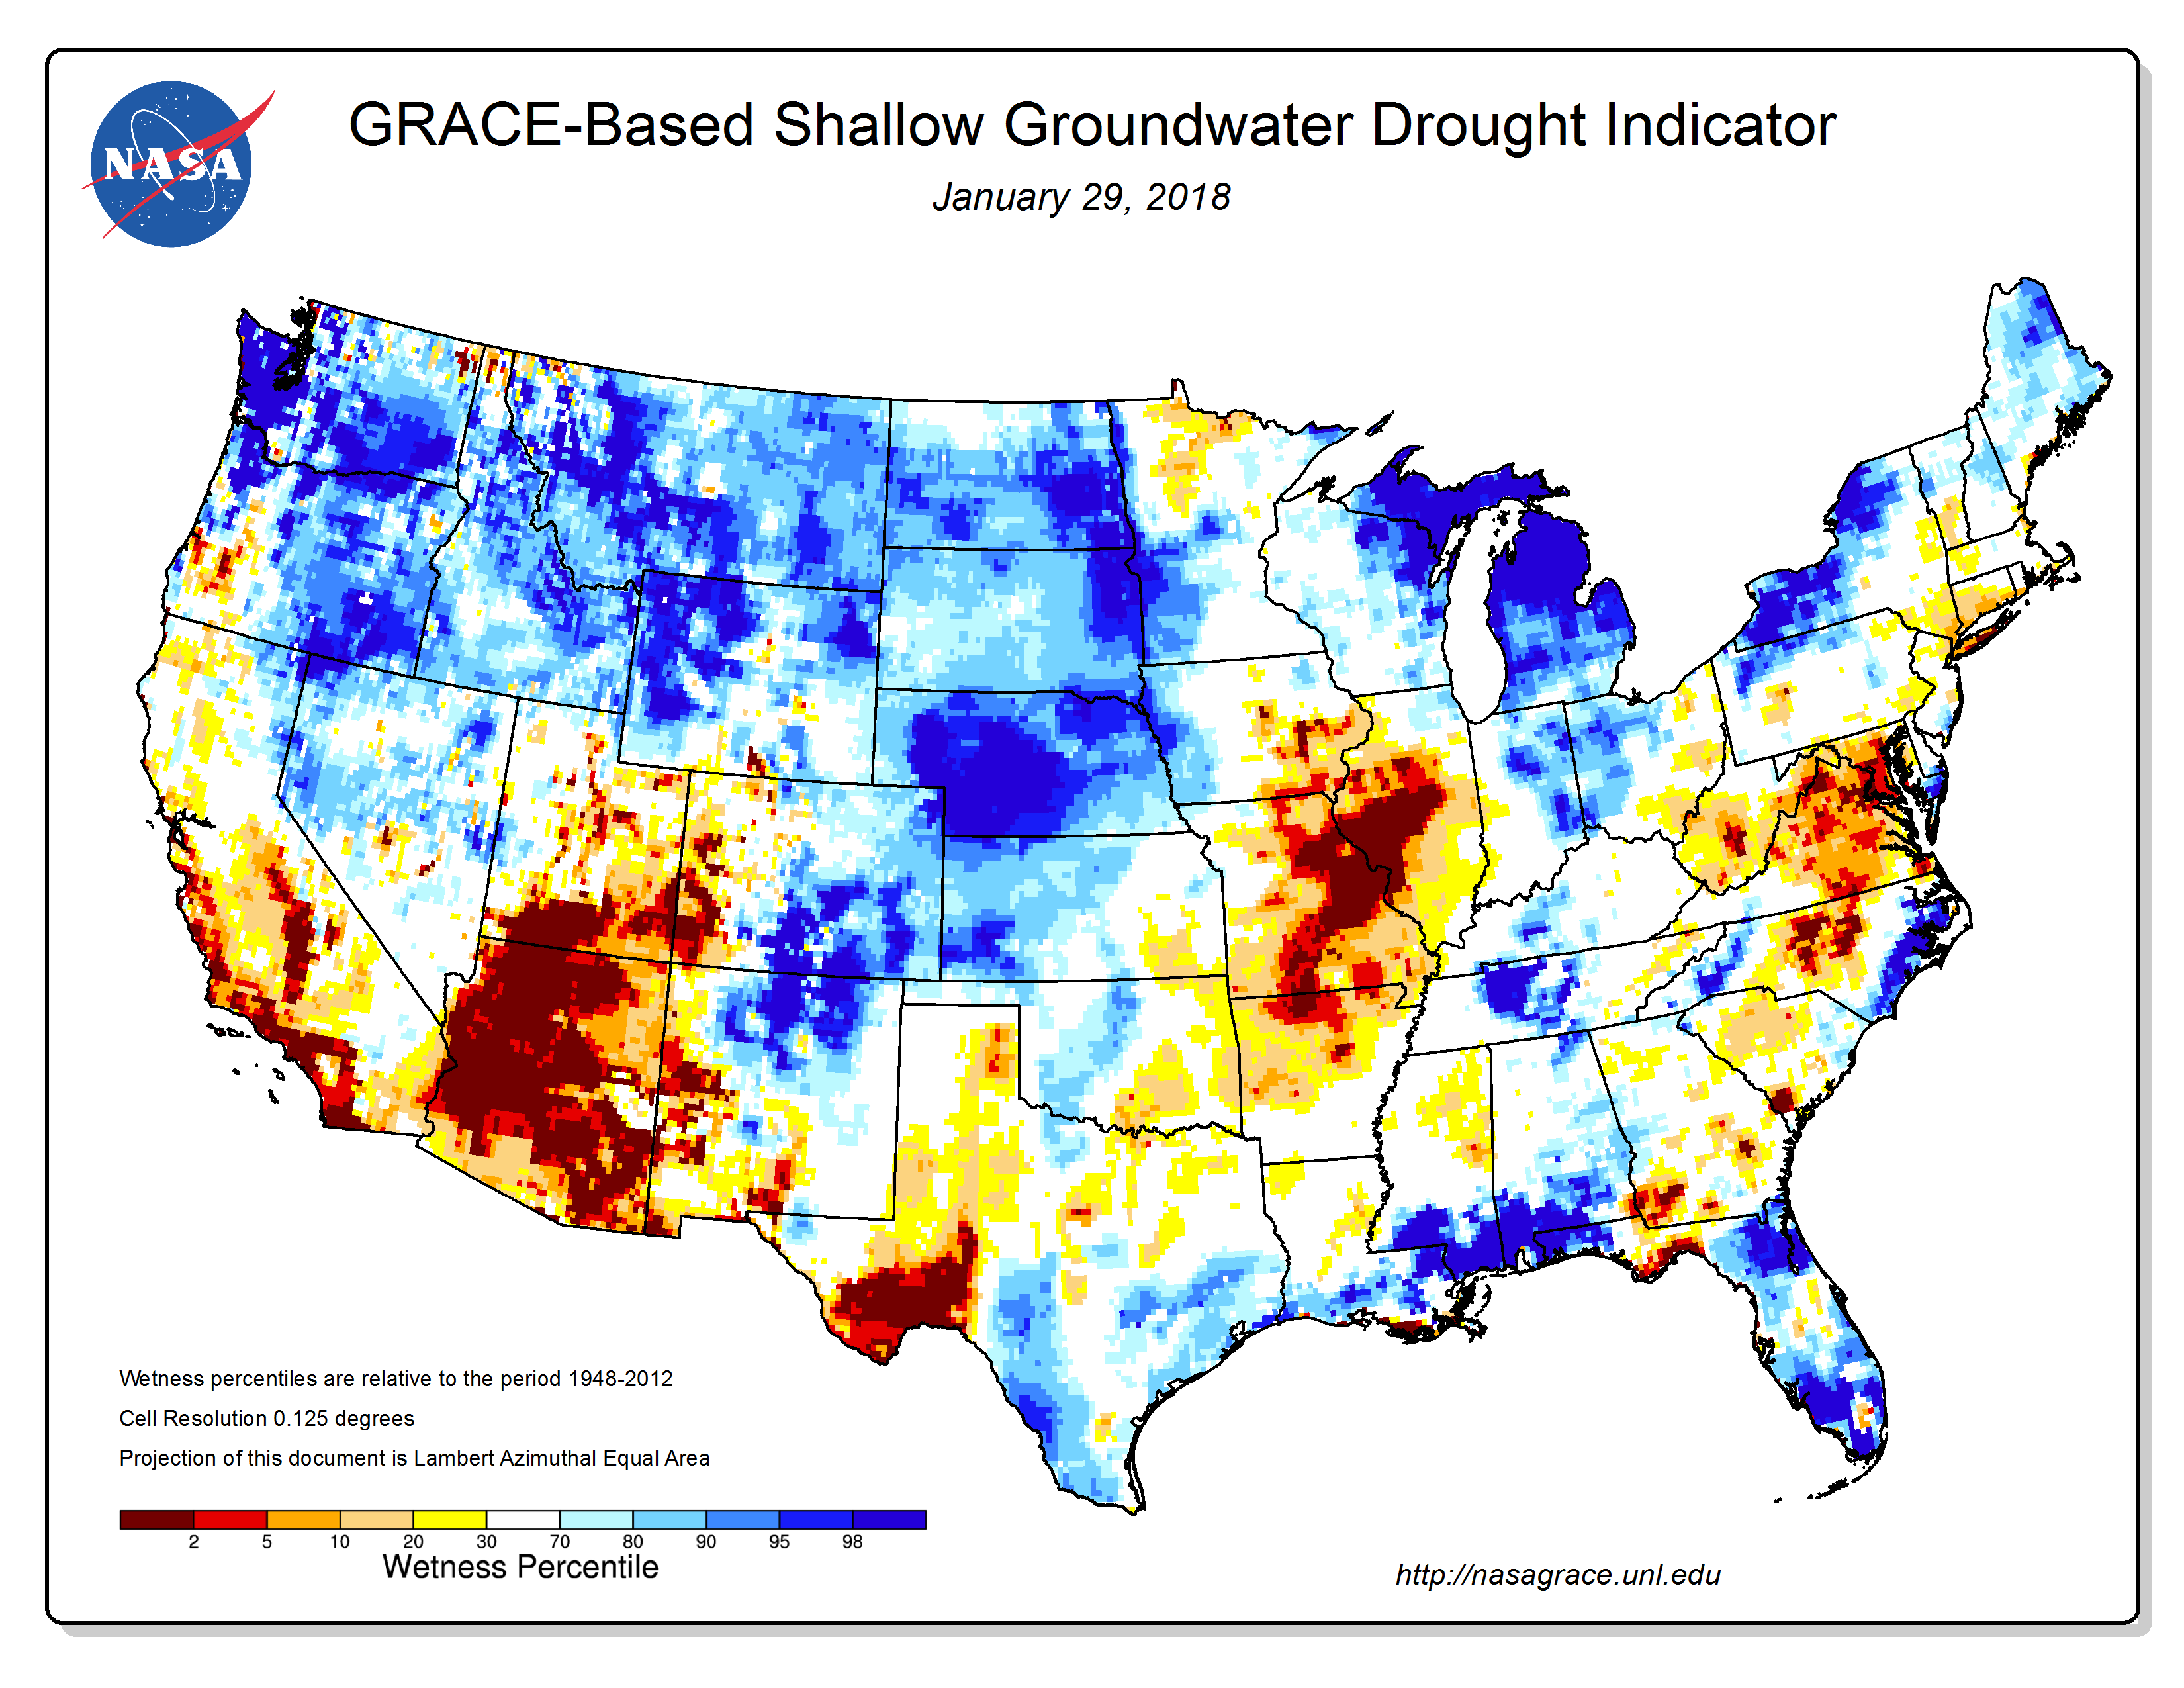
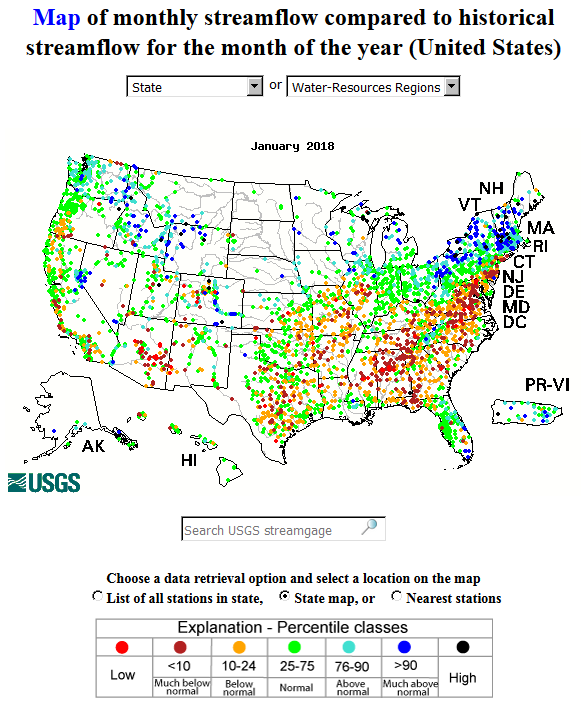
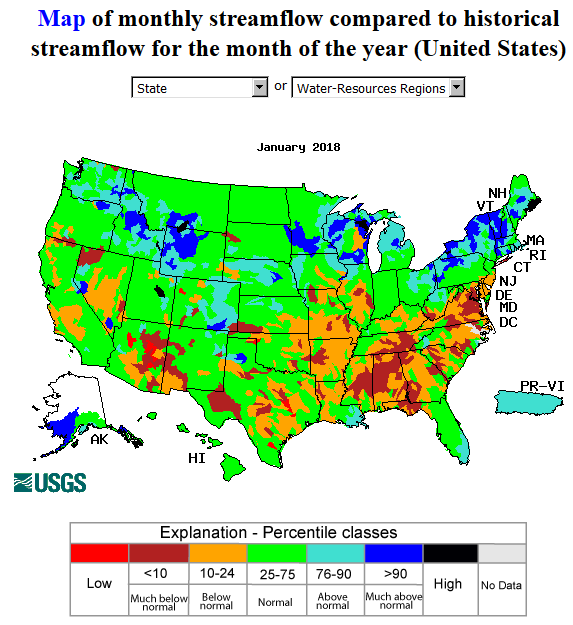
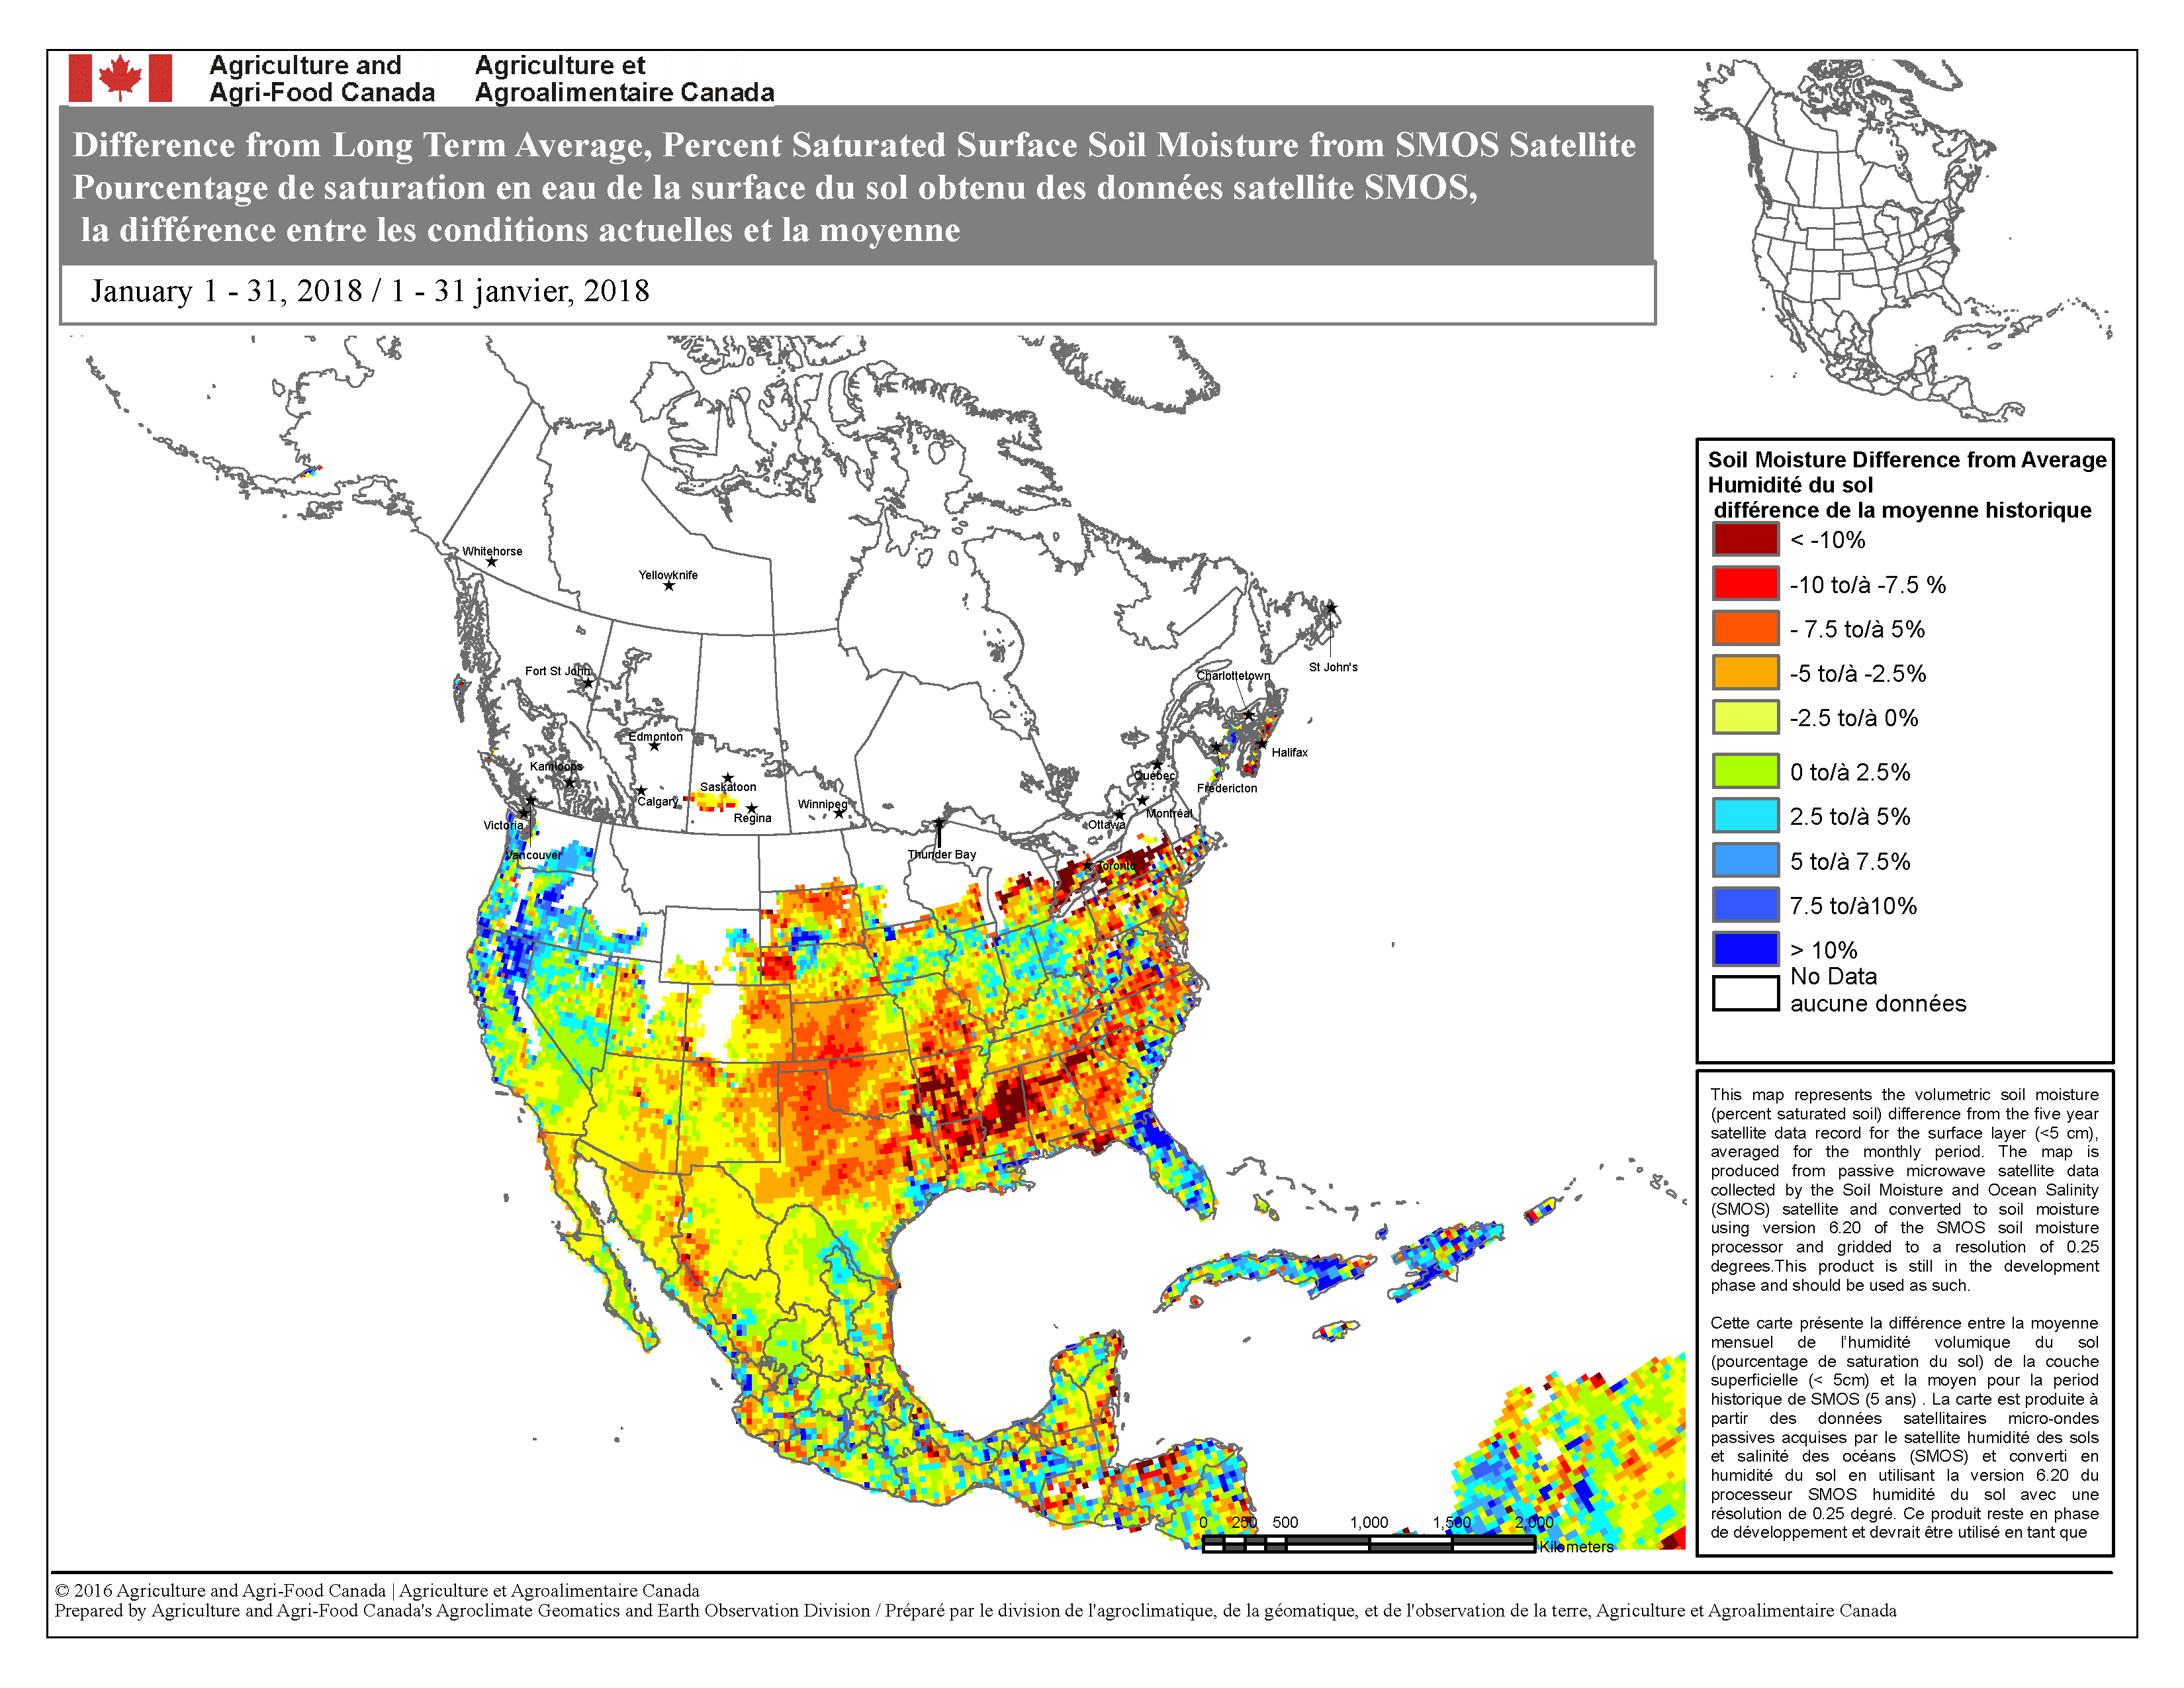
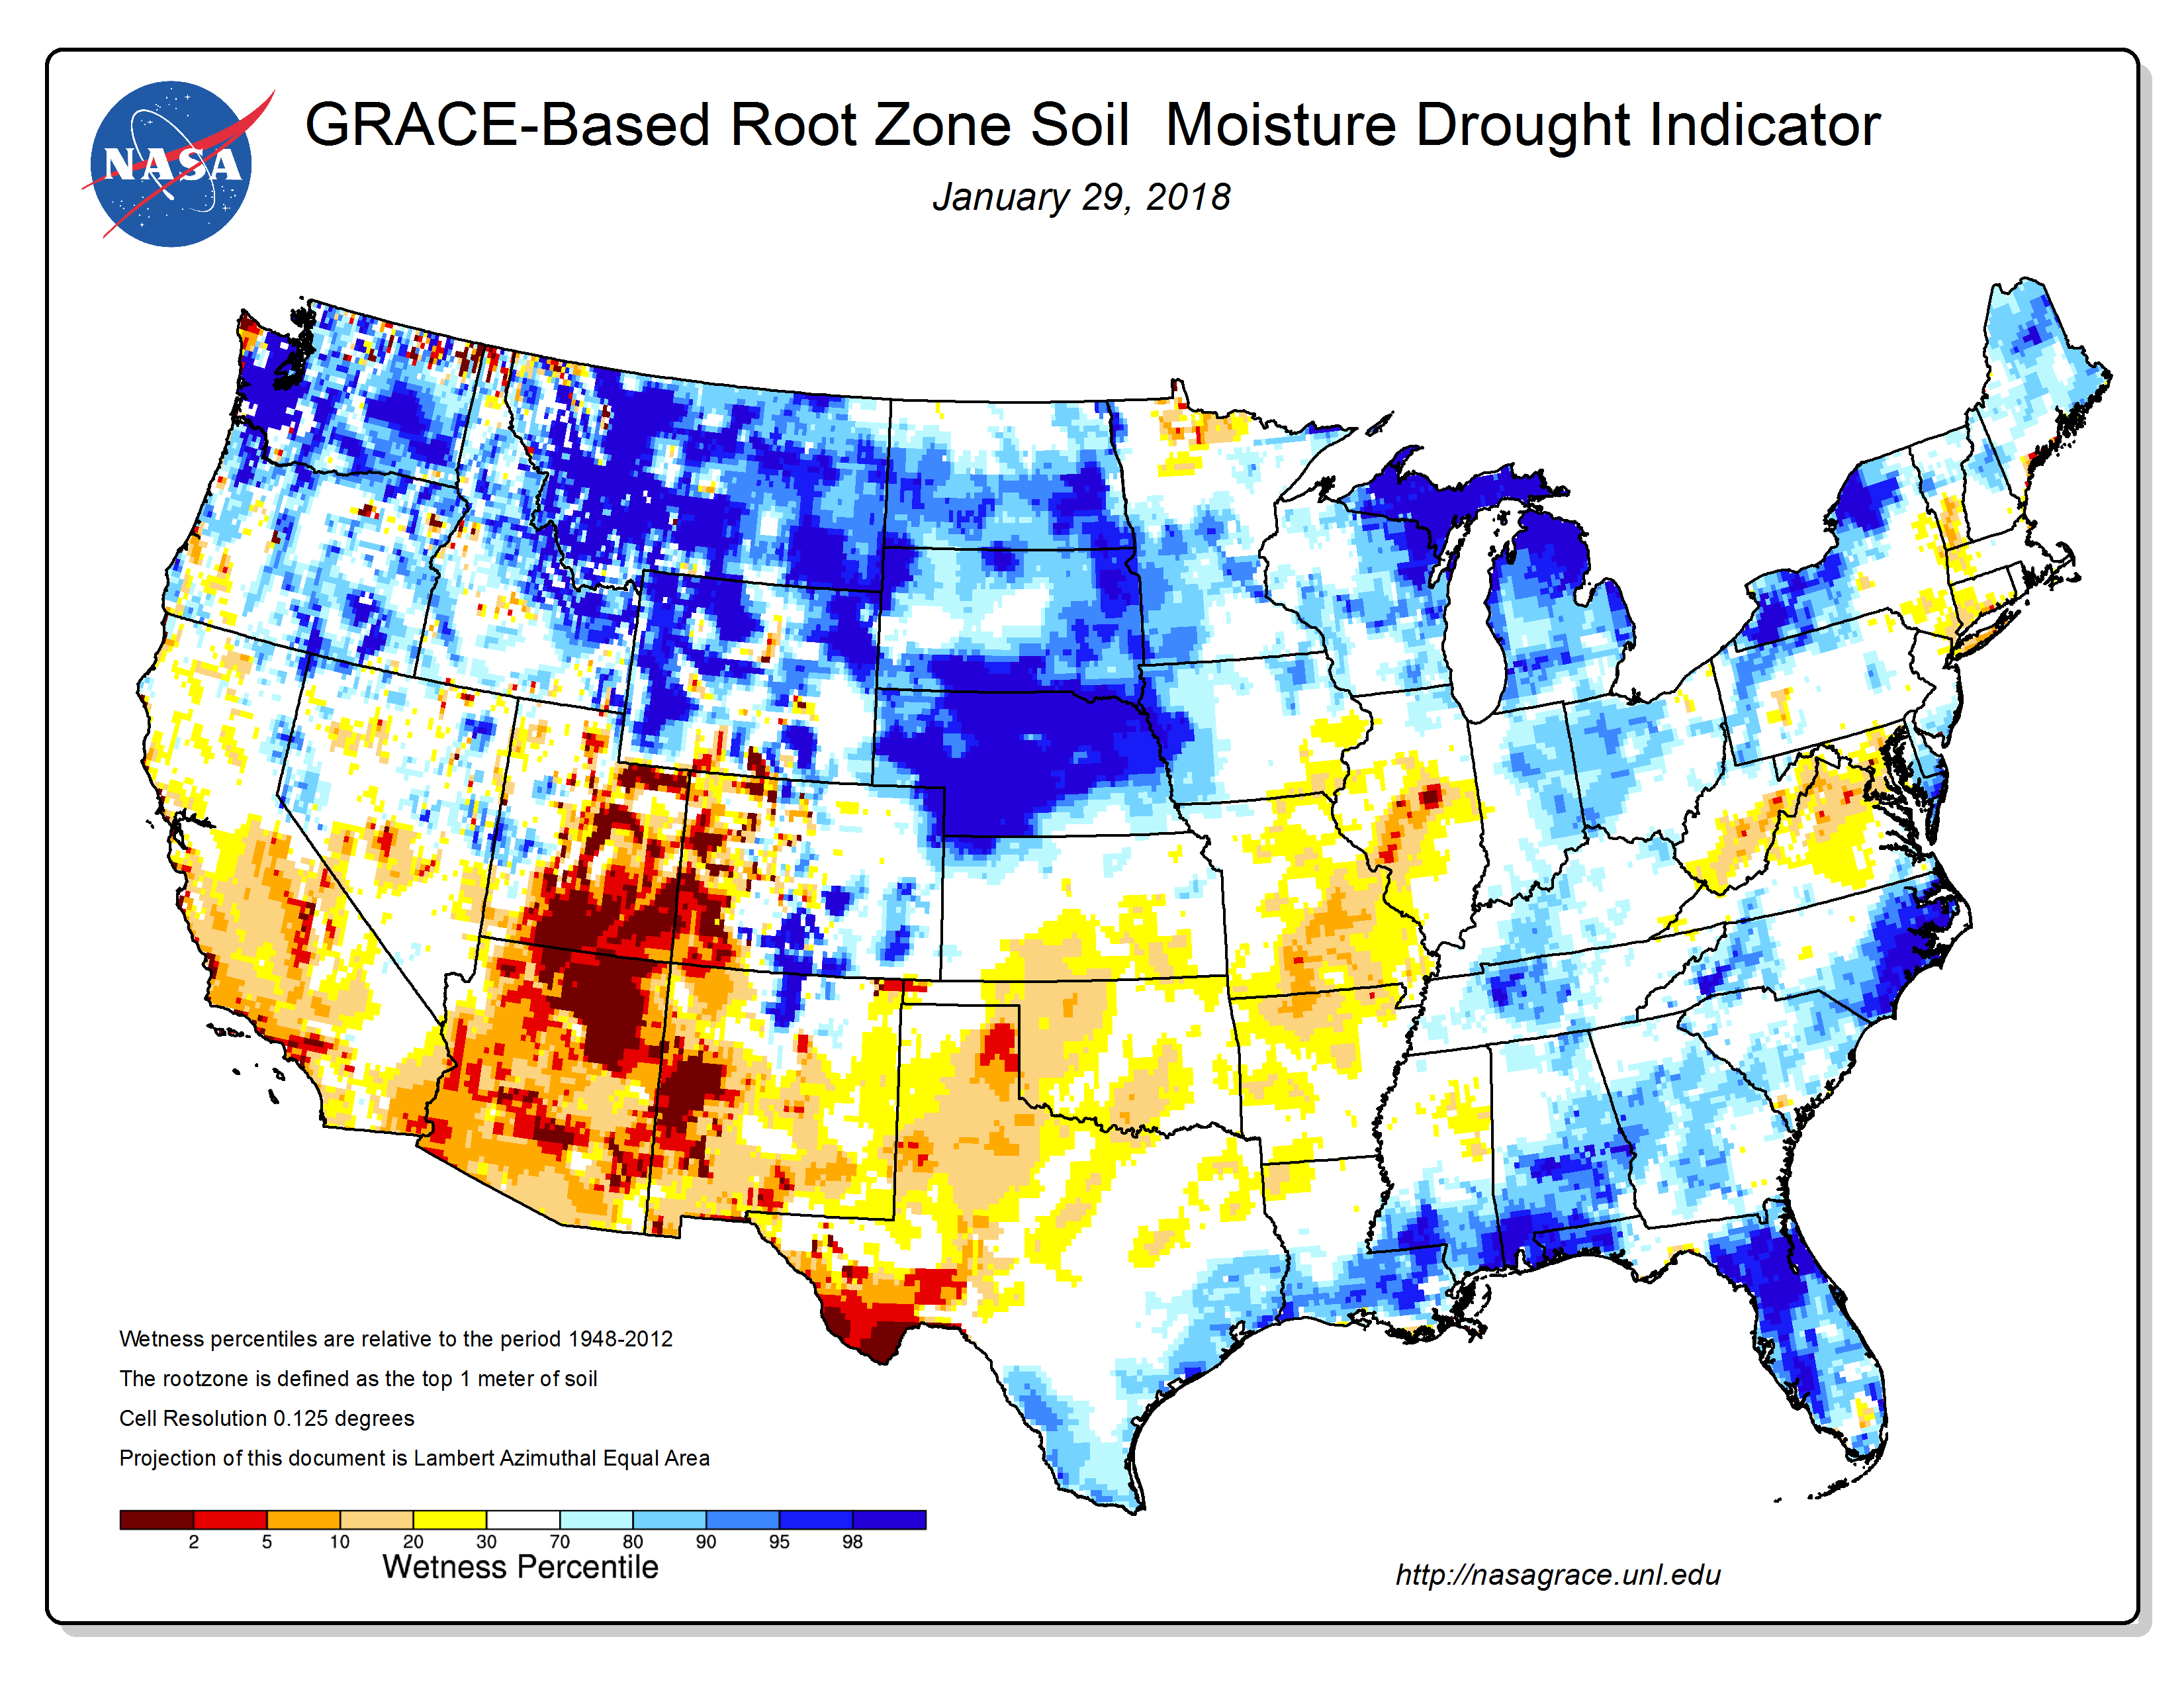
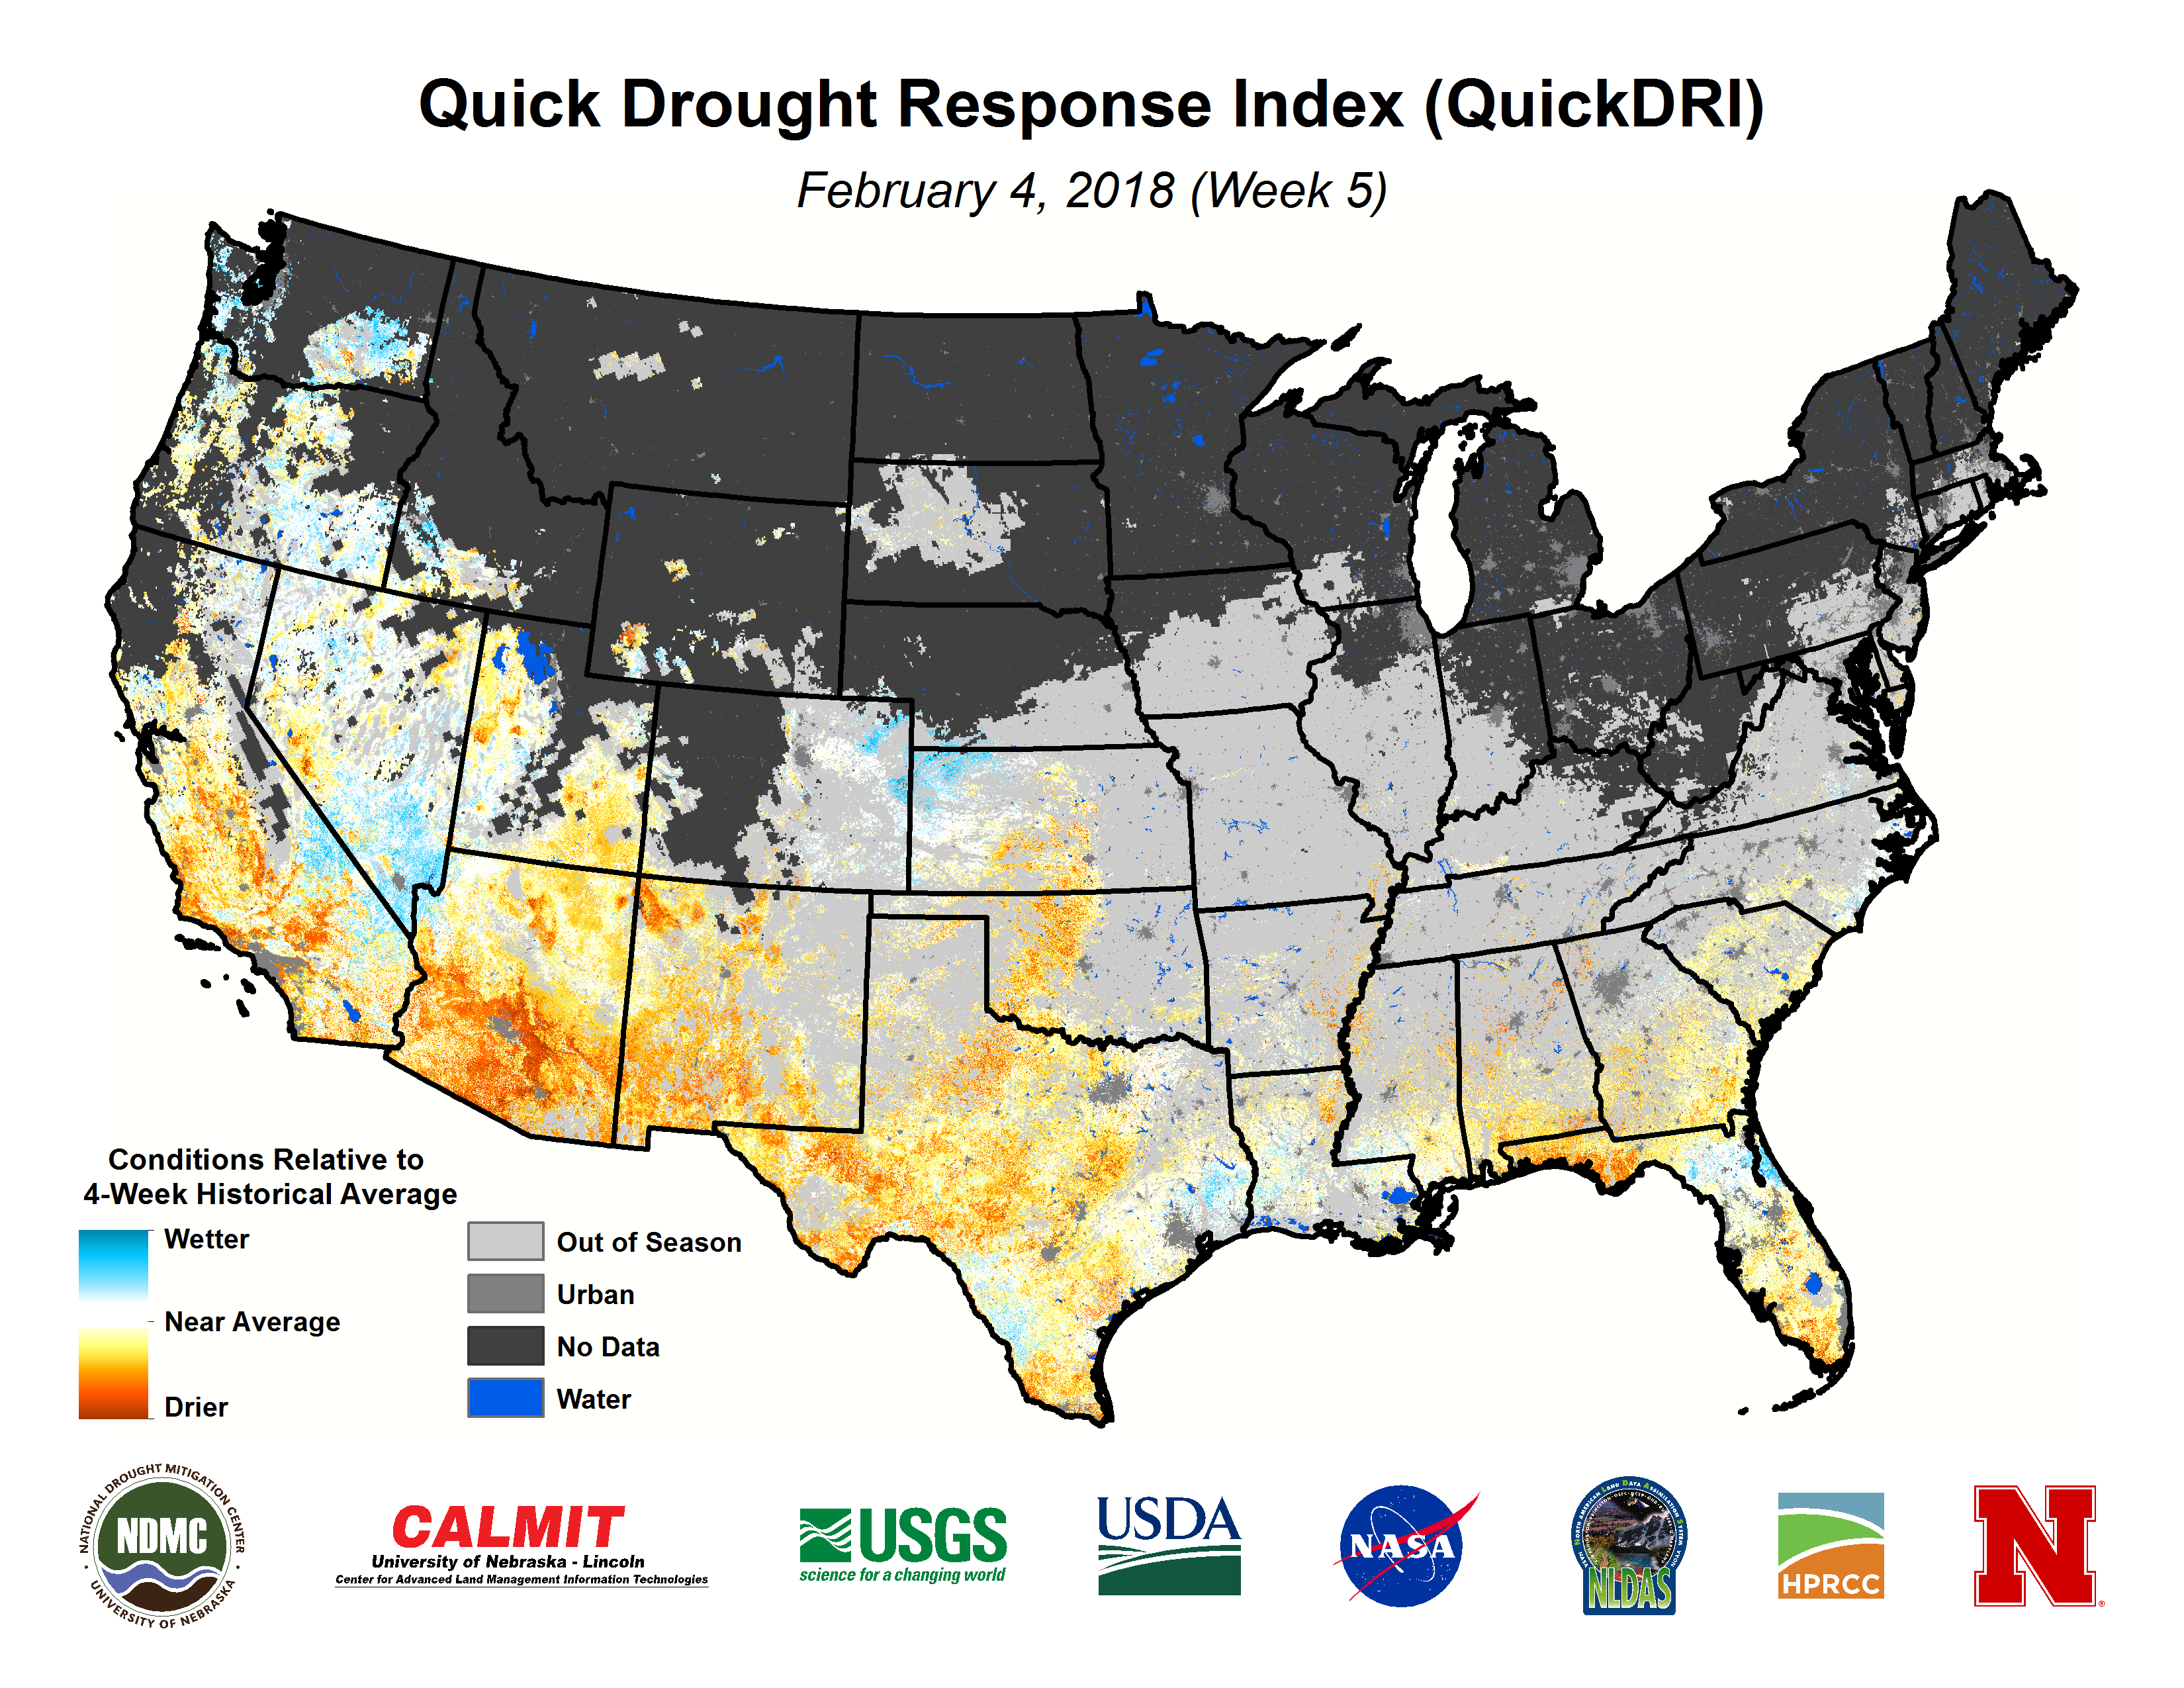
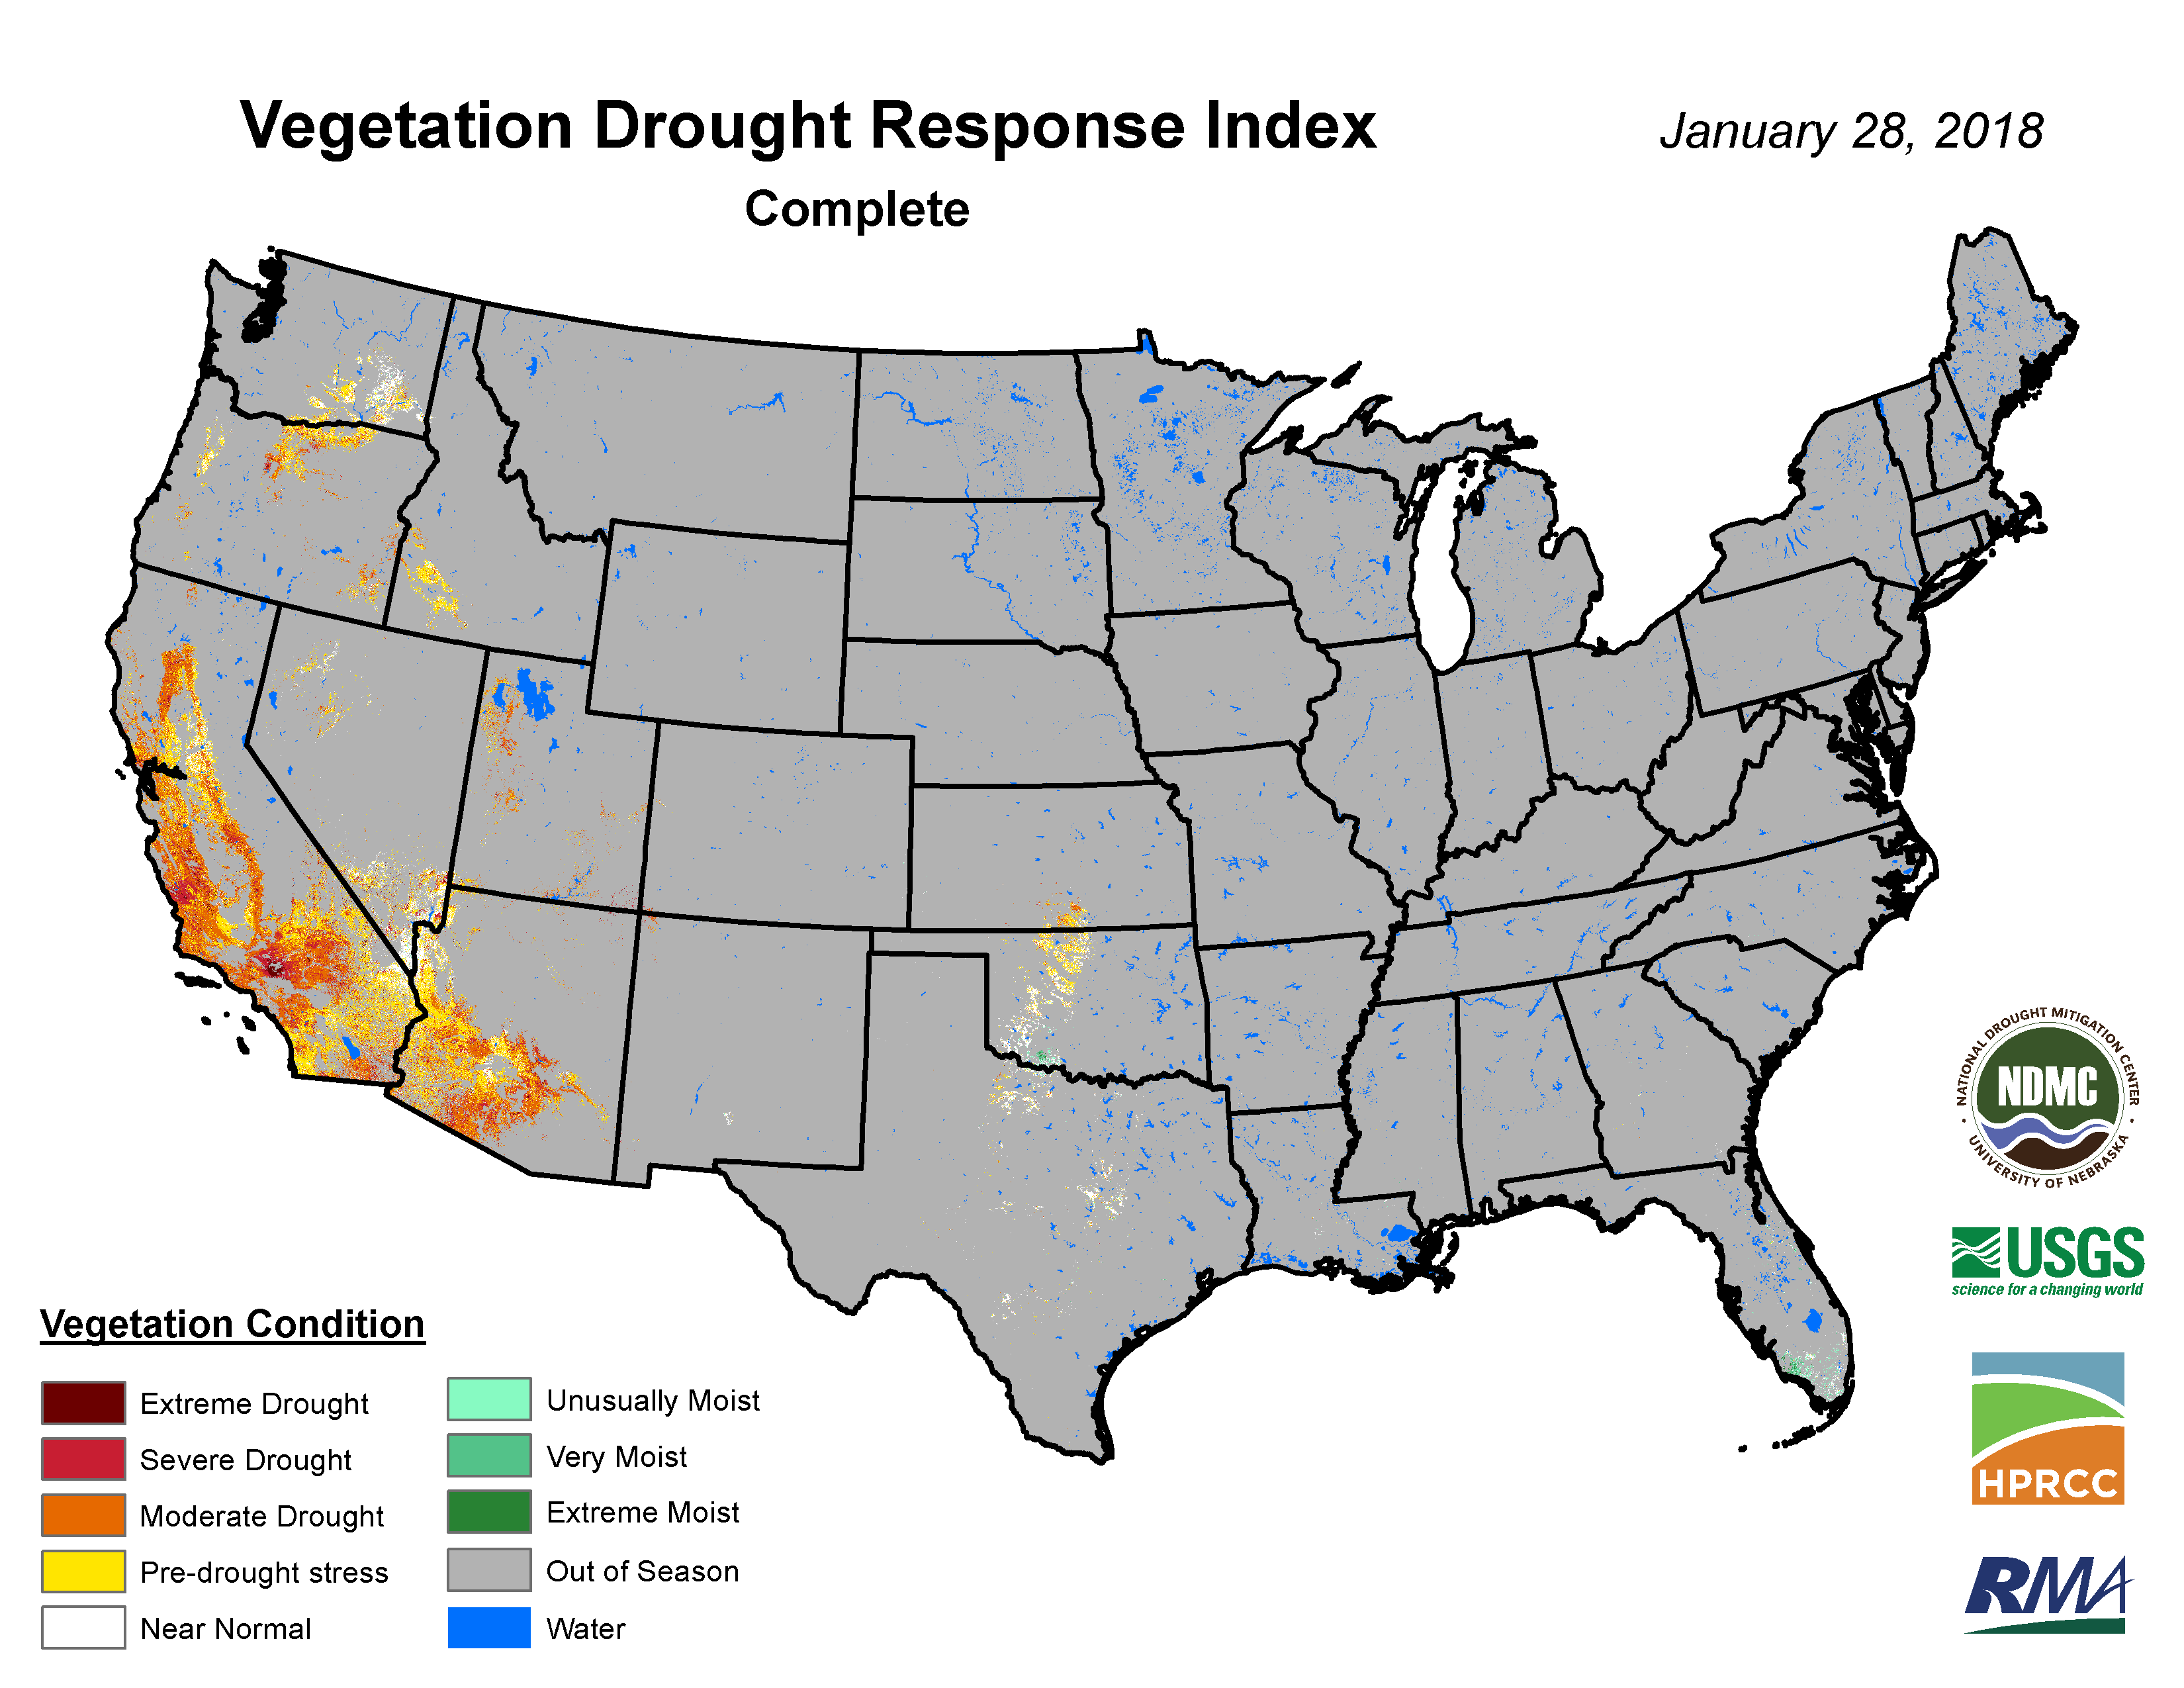
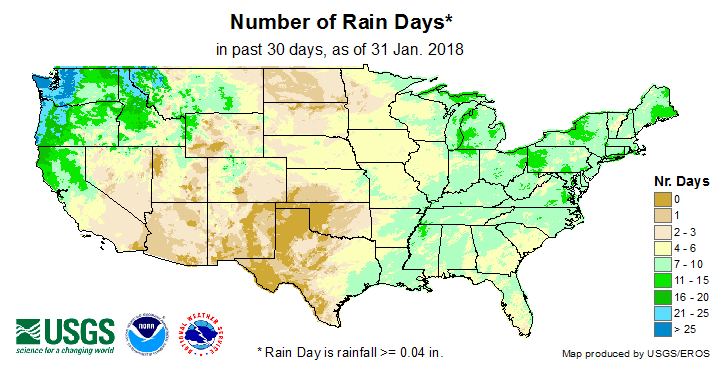
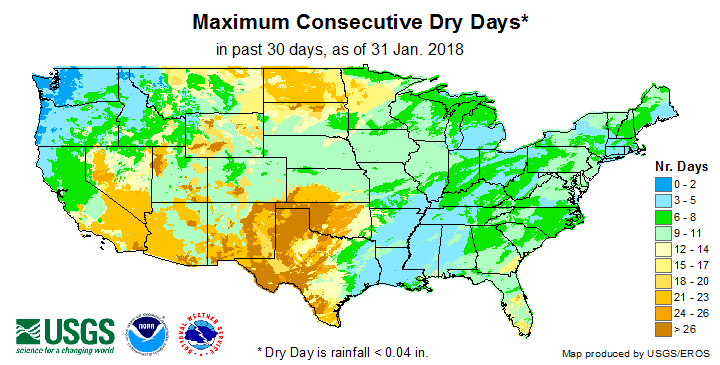
- Abnormal dryness (D0) to severe (D2) drought expanded across much of the West, and extreme (D3) drought was introduced in the Southwest, where the most severe western drought areas were located. — The percent area of the West (from the Rockies to the West Coast) in moderate to extreme drought (based on the Palmer Drought Index) rapidly increased in December and maintained a high level in January, growing over the last four months from 21.5 percent at the end of October to 56.7 percent at the end of January. The drought conditions were reflected in indices for evapotranspiration (EDDI, ESI), mountain snow water content and snowpack, groundwater (USGS observations, NASA GRACE model), streamflow, soil moisture (SMOS satellite observations, and CPC, Leaky Bucket, VIC, NASA GRACE, NLDAS top and total layer models), the QuickDRI index, the satellite data-based VegDRI index, some reservoirs, and USGS number of rain days and consecutive dry days.
- Abnormal dryness to extreme drought expanded in the southern to central Plains, and continued in the Lower to Mid-Mississippi Valley. — These conditions were reflected in indices for evapotranspiration (EDDI, ESI), groundwater (USGS observations, NASA GRACE model), streamflow, soil moisture (SMOS satellite observations, and CPC, Leaky Bucket, VIC, NASA GRACE, NLDAS top and total layer models), the QuickDRI index, and USGS number of rain days and consecutive dry days.
- There was some contraction in the central to northern Plains and the High Plains of Montana, but abnormal dryness to severe drought continued in the northern Plains. — This status mainly reflected long-term precipitation deficits (last 9 to 12 months), but also dryness in the short term (last 1, 2, 3 months) and indices for soil moisture (SMOS satellite observations, and CPC, Leaky Bucket, VIC, NLDAS top and total layer models) and USGS number of rain days and consecutive dry days.
- Abnormal dryness and moderate (D1) drought expanded, and severe to extreme drought introduced, in the Southeast to Mid-Atlantic states. — These conditions were reflected in indices for groundwater (USGS observations, NASA GRACE model), streamflow, soil moisture (SMOS satellite observations, and CPC, Leaky Bucket, VIC, NLDAS top and total layer models), and the QuickDRI index.
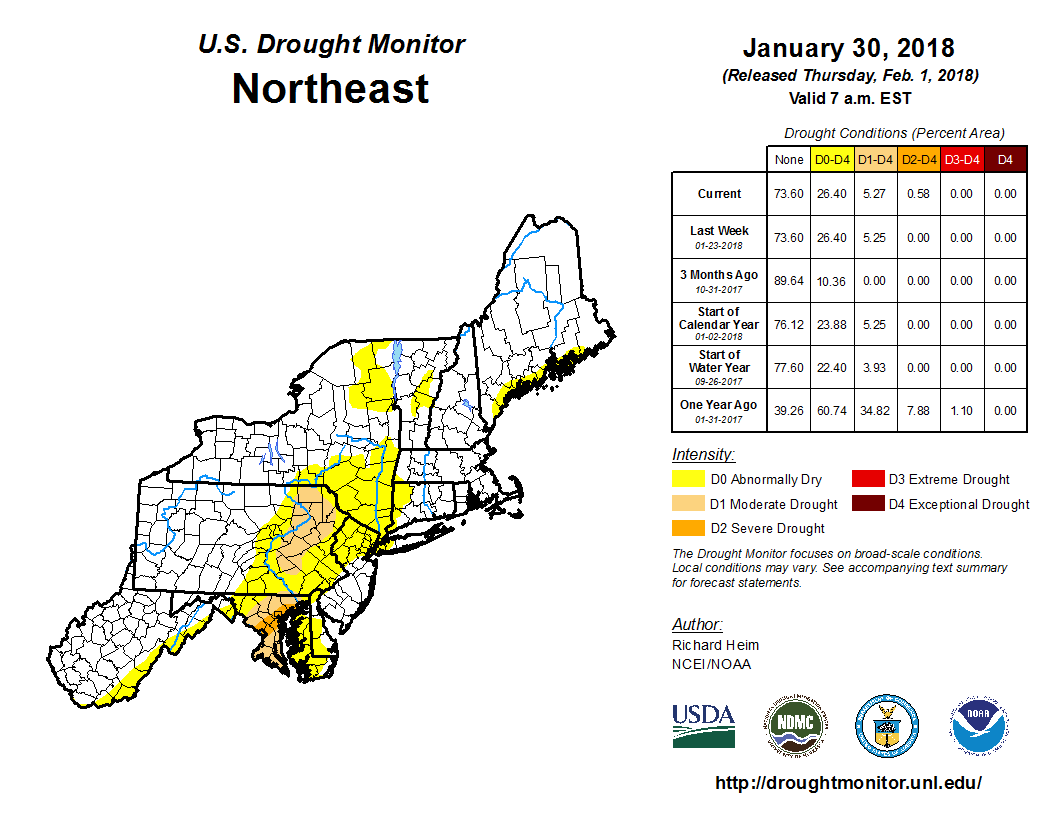
- Abnormal dryness and moderate drought continued, and severe drought was introduced, to parts of the Northeast. — These conditions were reflected, especially in the southern portions of the region, in indices for groundwater (USGS observations, NASA GRACE model), streamflow, and soil moisture (SMOS satellite observations, and CPC, Leaky Bucket, VIC, NLDAS top and total layer models).
- There was some contraction as well as expansion, but abnormally dry to moderate drought conditions continued in Hawaii.
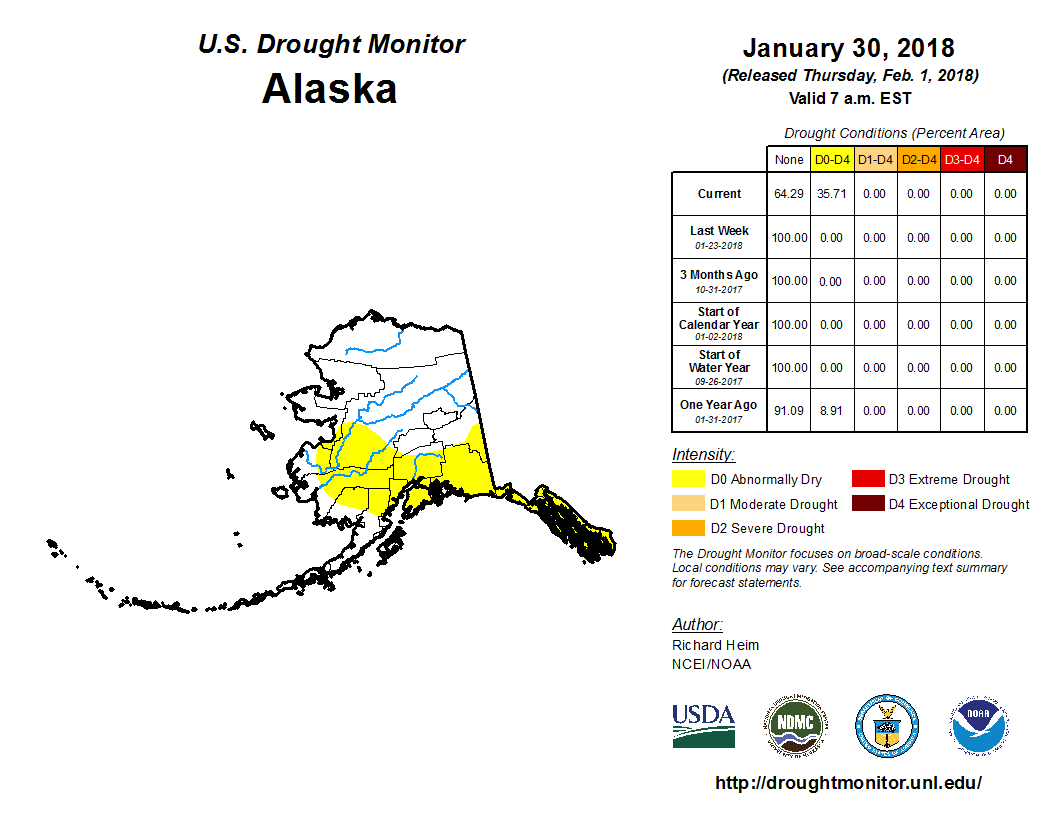
- Abnormal dryness was introduced in Alaska to reflect below-normal precipitation over the last one to six months as well as low snowpack and mountain snow water content.
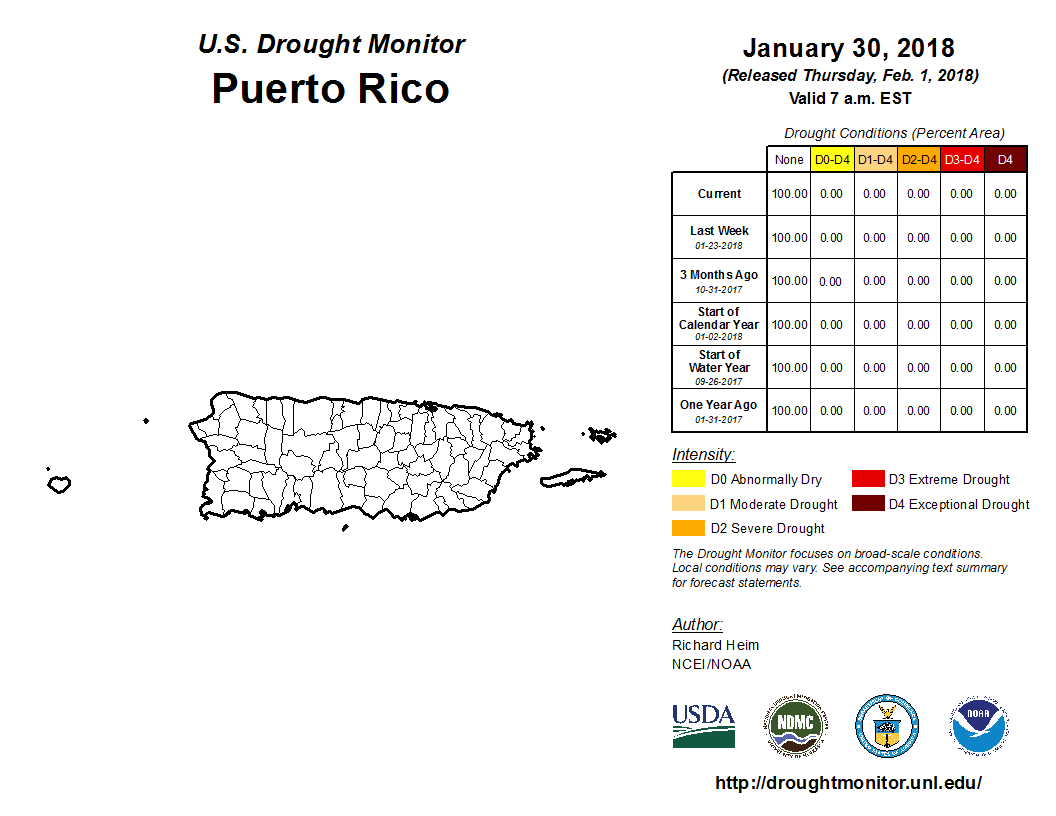
There was no drought or abnormal dryness in Puerto Rico.
Palmer Drought Index
The Palmer drought indices measure the balance between moisture demand (evapotranspiration driven by temperature) and moisture supply (precipitation). The Palmer Z Index depicts moisture conditions for the current month, while the Palmer Hydrological Drought Index (PHDI) and Palmer Drought Severity Index (PDSI) depict the current month's cumulative moisture conditions integrated over the last several months. While both the PDSI and PHDI indices show long-term moisture conditions, the PDSI depicts meteorological drought while the PHDI depicts hydrological drought. The PDSI map shows less severe and extensive drought (as well as wet spell conditions) in parts of the country than the PHDI map because the meteorological conditions that produce drought and wet spell conditions are not as long-lasting as the hydrological impacts.
|
 |
Used together, the Palmer Z Index and PHDI maps show that short-term dry conditions occurred across much of the West, eliminating previous long-term wetness (in eastern Colorado and New Mexico) and intensifying or expanding long-term drought (in the Four Corners States and in southern Oregon). Short-term dry conditions occurred across the Lower Mississippi Valley and Southeast, reducing previous previous long-term wet conditions and introducing long-term drought. Short-term dry conditions in the Mid-Atlantic to Ohio Valley intensified previous long-term drought and shrank previous long-term wet conditions.
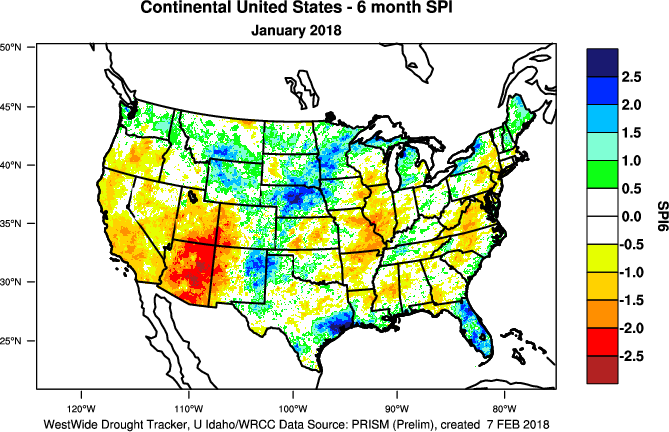
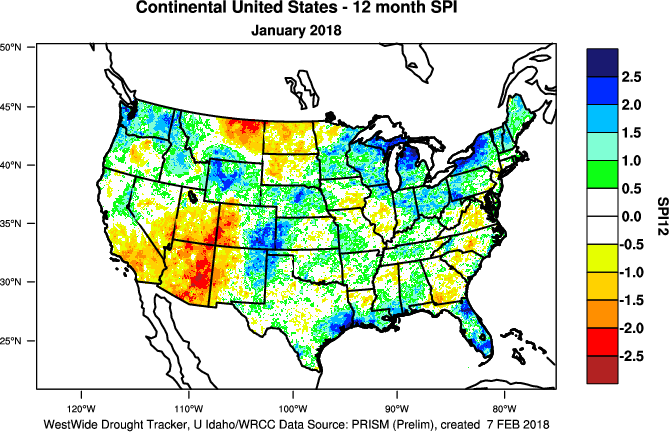
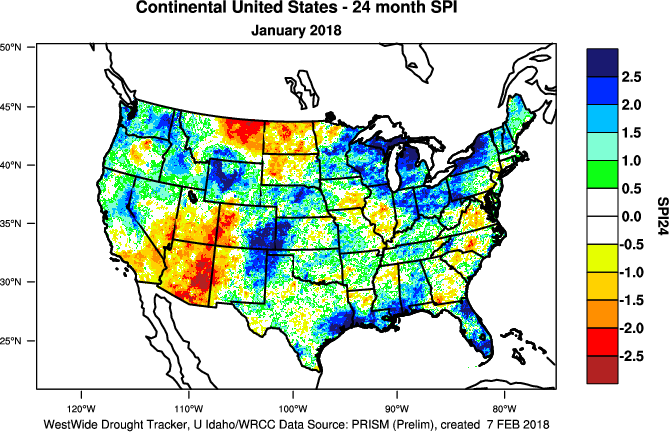
Standardized Precipitation Index
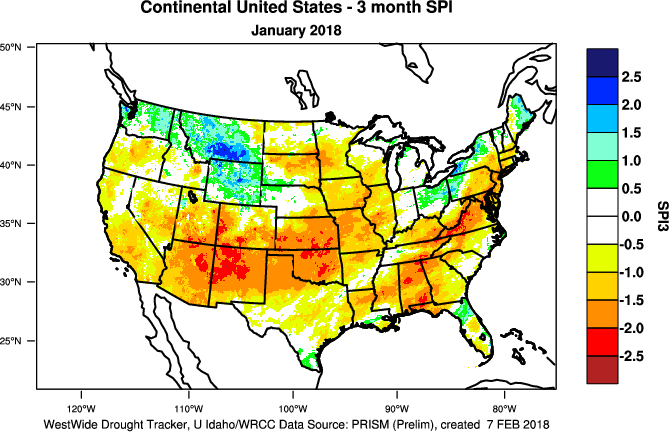
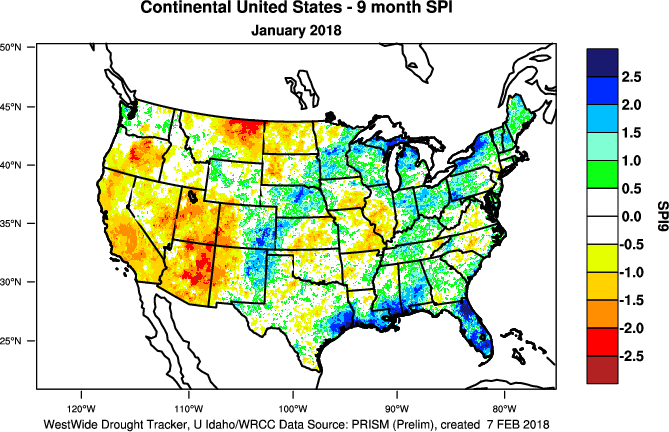
The Standardized Precipitation Index (SPI) measures moisture supply. The SPI maps here show the spatial extent of anomalously wet and dry areas at time scales ranging from 1 month to 24 months.
 |
 |
 |
The SPI maps illustrate how moisture conditions have varied considerably through time and space over the last two years. Dryness across much of the West is evident on the 1-month to 9-month maps, and in the Southwest at all time scales. Montana is near normal to wet at the 1- to 6-month time scales, but dry at 9 and 12 months. Dryness is widespread across the northern Plains for the last 1 to 3 months and at the 9- to 12-month time scales. The southern Plains (from eastern New Mexico to Kansas) is dry at the 1- to 3-month time scales. Texas is dry at 1-3 months, but wet for parts to much of the state at 6-24 months. Much of the Deep South to Southeast is dry at the 1- to 6-month time scales, and parts are dry at the 9- to 24-month time scales. Parts of the Northeast to Mid-Atlantic regions are dry at all time scales except 9 months. Parts of the Ohio Valley to Great Lakes are dry at the 1- to 6-month time scales, especially the southern parts and most widespread at 3 months, but wet conditions become evident (in the north) at 6 months and widespread at 9 to 24 months.
 |
 |
 |
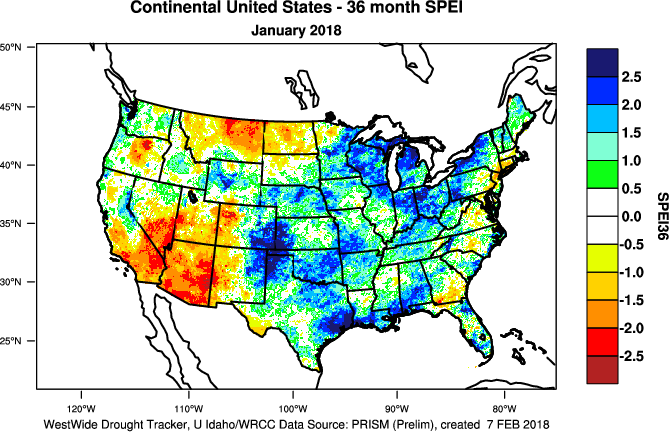
Standardized Precipitation Evapotranspiration Index
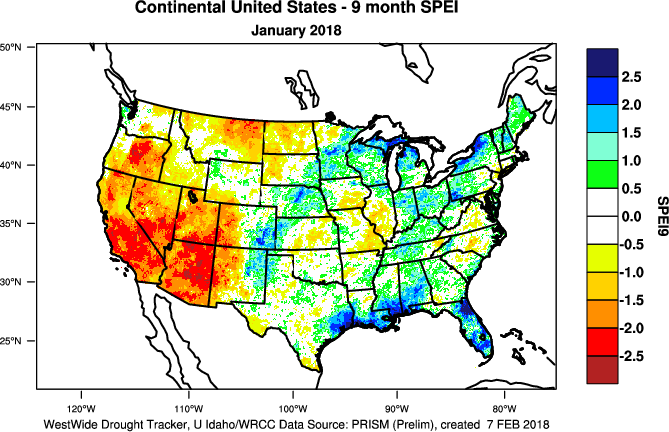
The SPI measures water supply (precipitation), while the SPEI (Standardized Precipitation Evapotranspiration Index) measures the combination of water supply (precipitation) and water demand (evapotranspiration as computed from temperature). Warmer temperatures tend to increase evapotranspiration, which generally makes droughts more intense.
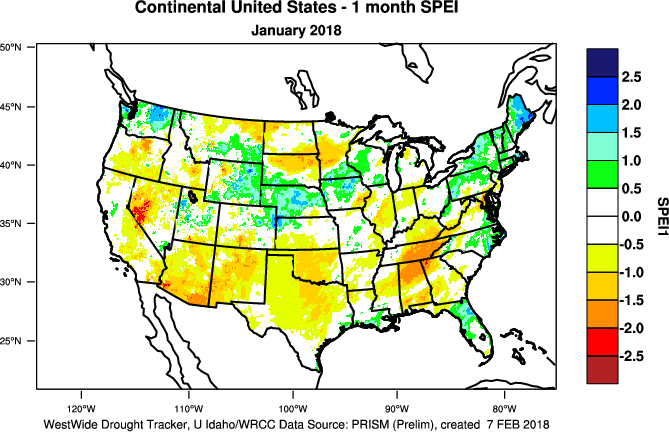 1-month SPEI for current month.
|
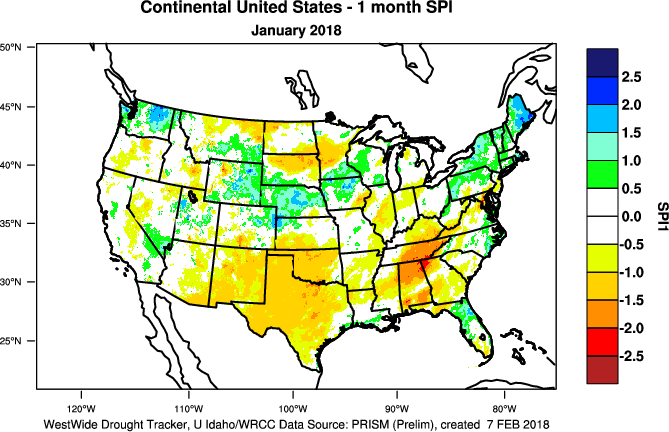 1-month SPI for current month.
|
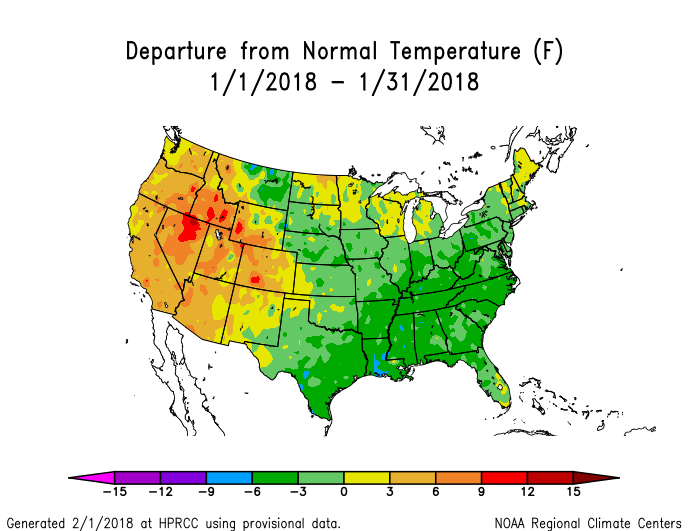
January 2018 temperatures were much warmer than normal across the West, and this increased evapotranspiration. Even though this is winter and the effect of evapotranspiration is muted, it can still be significant in the Southwest. Much of the West was drier than normal — again, especially in the Southwest. The increased evapotranspiration exacerbated drought conditions where it was dry, making the January 2018 1-month SPEI a little drier than the corresponding SPI.
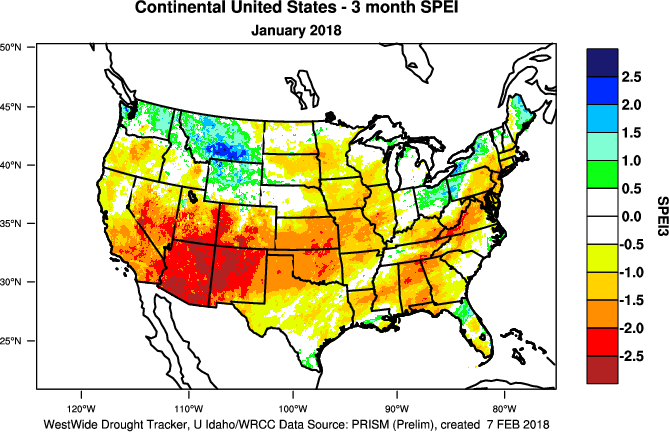 3-month SPEI for current month.
|
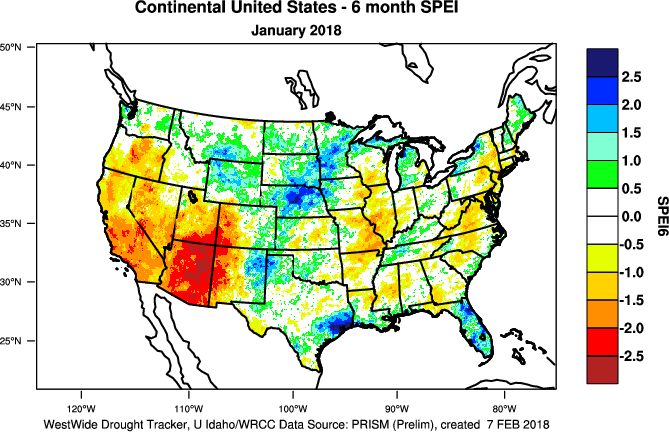 6-month SPEI for current month.
|
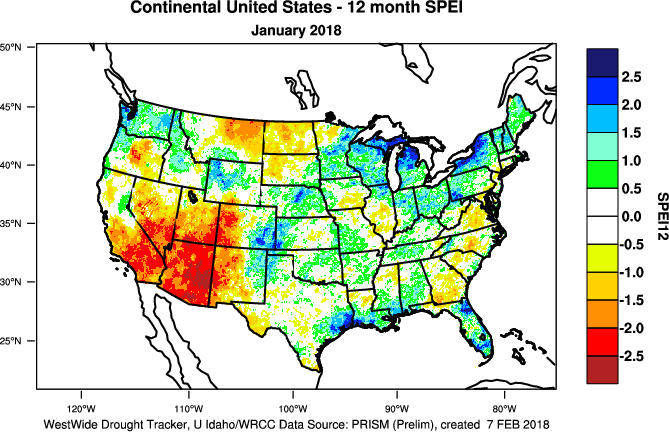 12-month SPEI for current month.
|
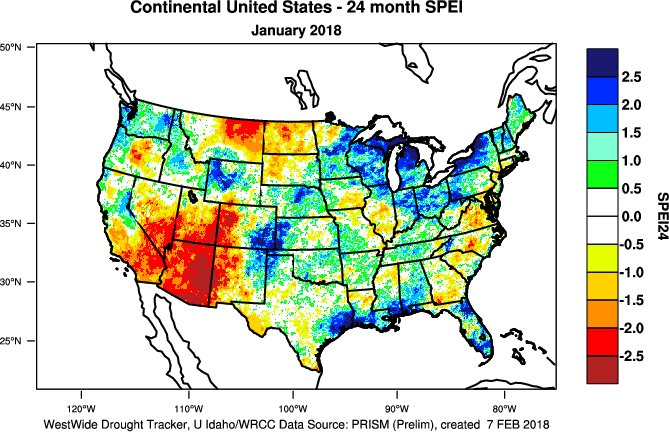 24-month SPEI for current month.
|
 3-month SPI for current month.
|
 6-month SPI for current month.
|
 12-month SPI for current month.
|
 24-month SPI for current month.
|
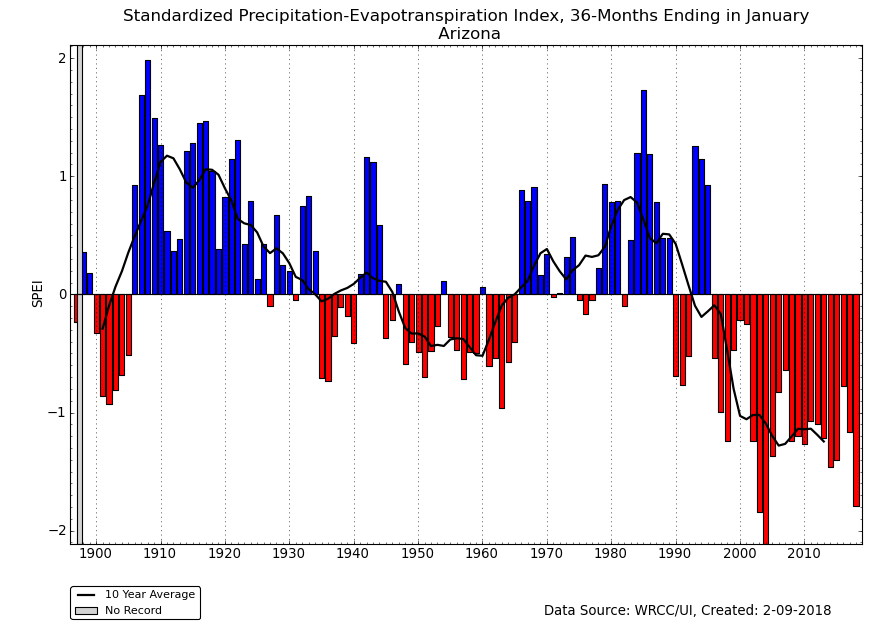
Unusually warm to record warm temperatures dominated much of the West for most of the last 12 months (climate division temperature rank maps for November 2017-January 2018, August 2017-January 2018, February 2017-January 2018). In fact, the last 10 to 20 years have been persistently warmer than the long-term average. This persistent and widespread warmth has resulted in a progressively more extreme SPEI compared to the corresponding SPI (SPEI maps for the last 3, 6, 9, 12, 24, 36, 48, 60, 72 months) (SPI maps for the last 3, 6, 9, 12, 24, 36, 48, 60, 72 months).
 36-month SPEI for current month.
|
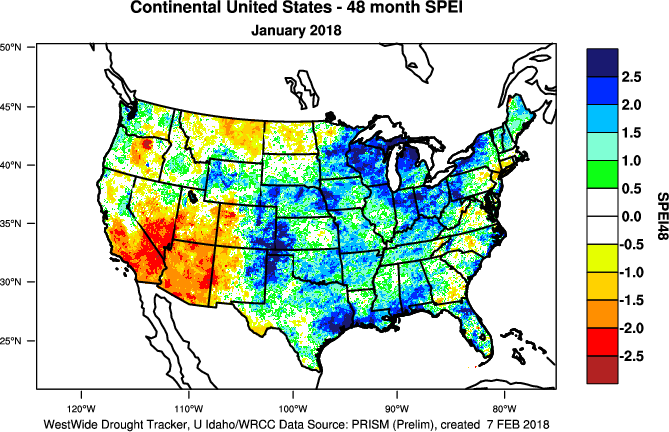 48-month SPEI for current month.
|
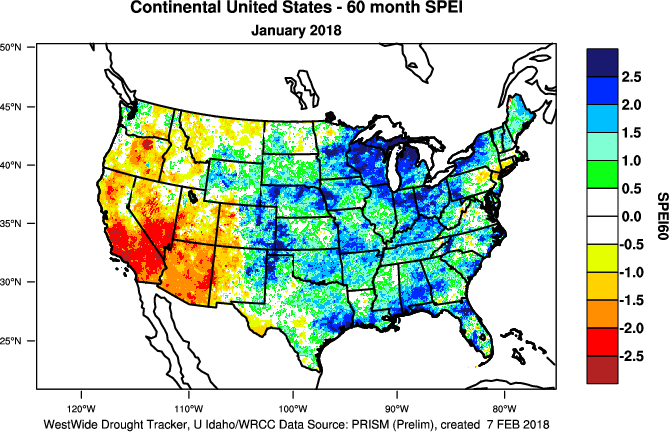 60-month SPEI for current month.
|
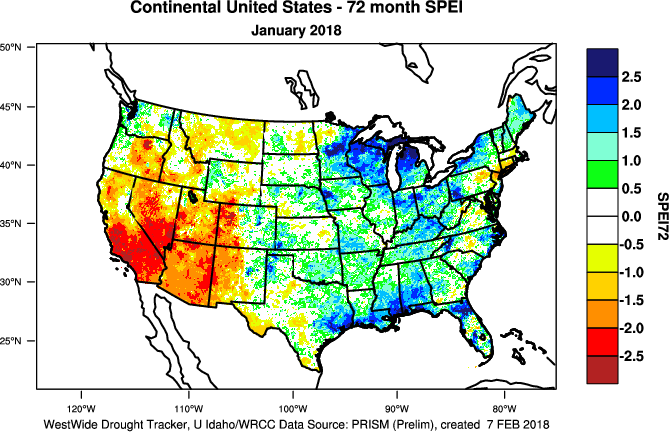 72-month SPEI for current month.
|
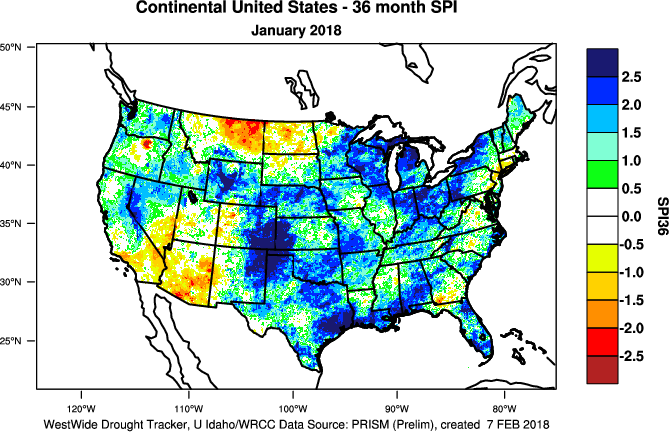 36-month SPI for current month.
|
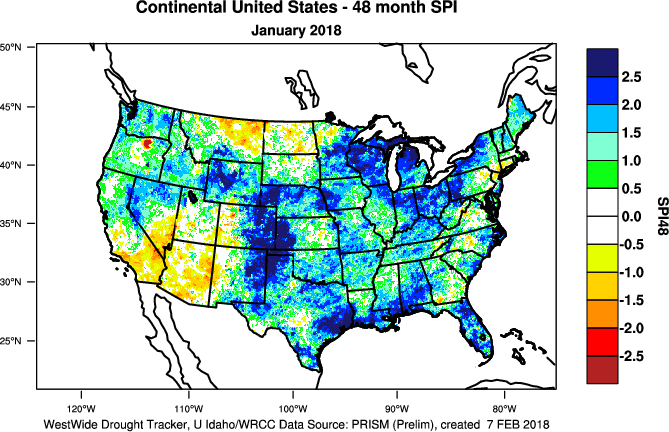 48-month SPI for current month.
|
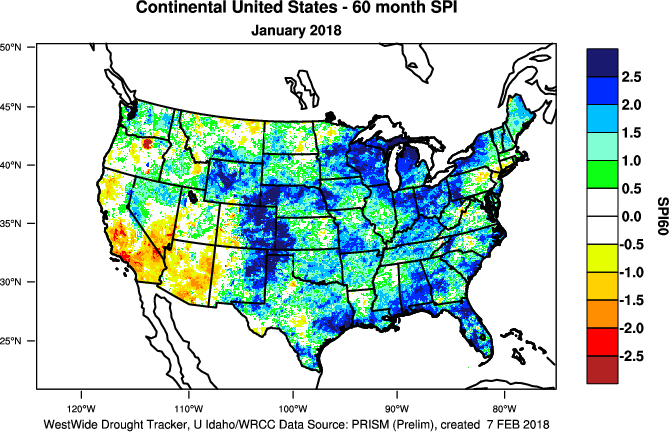 60-month SPI for current month.
|
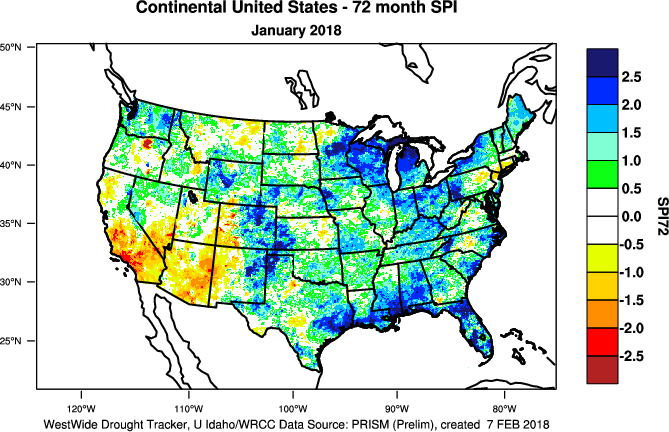 72-month SPI for current month.
|
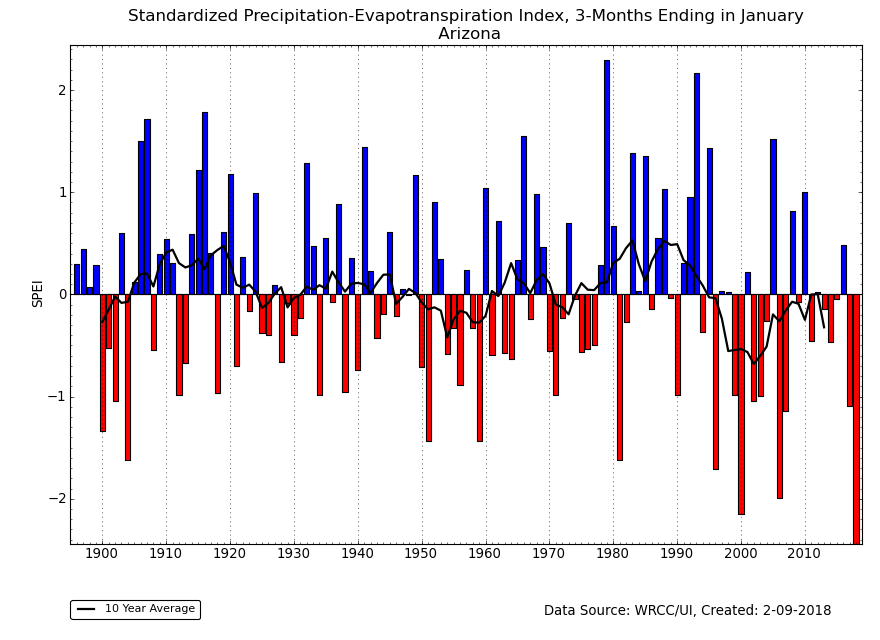
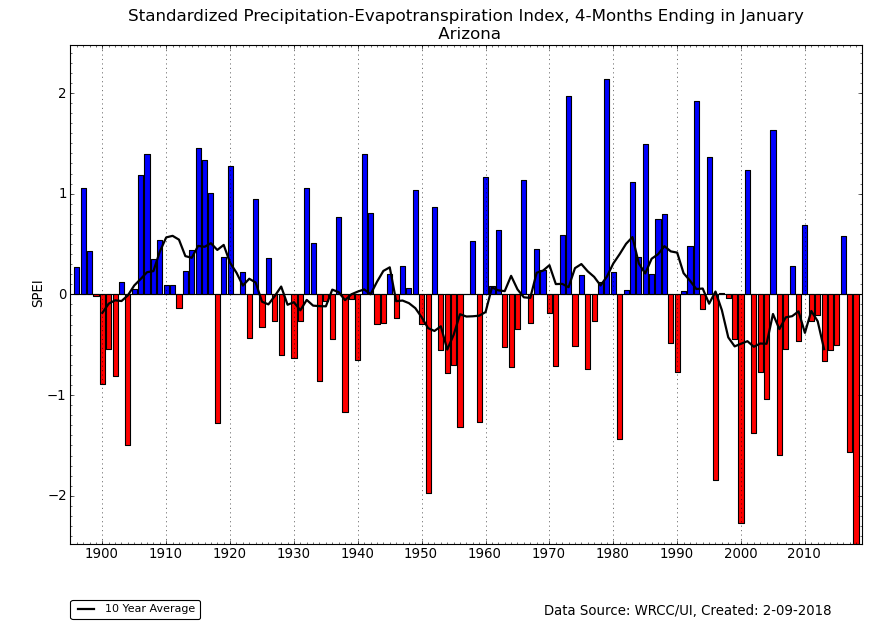
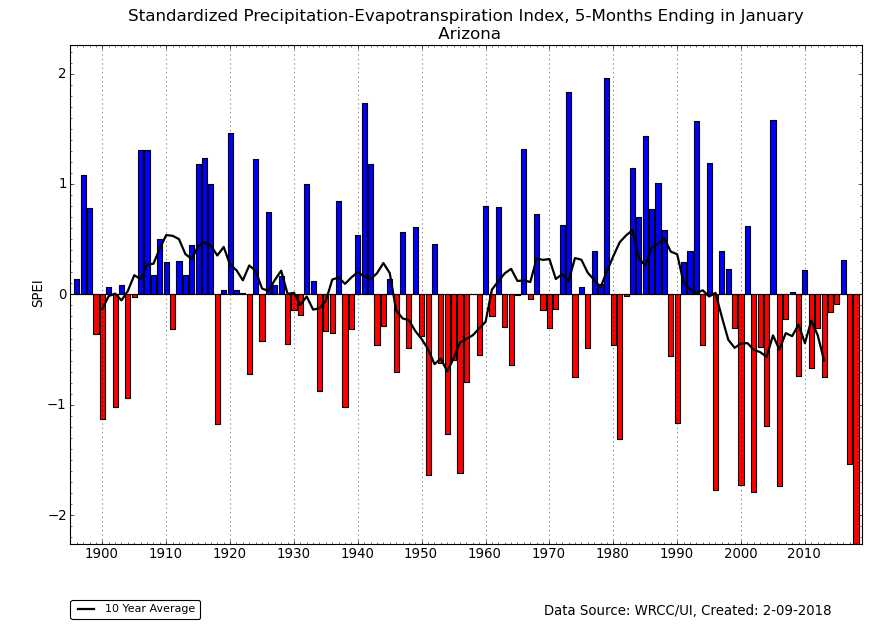
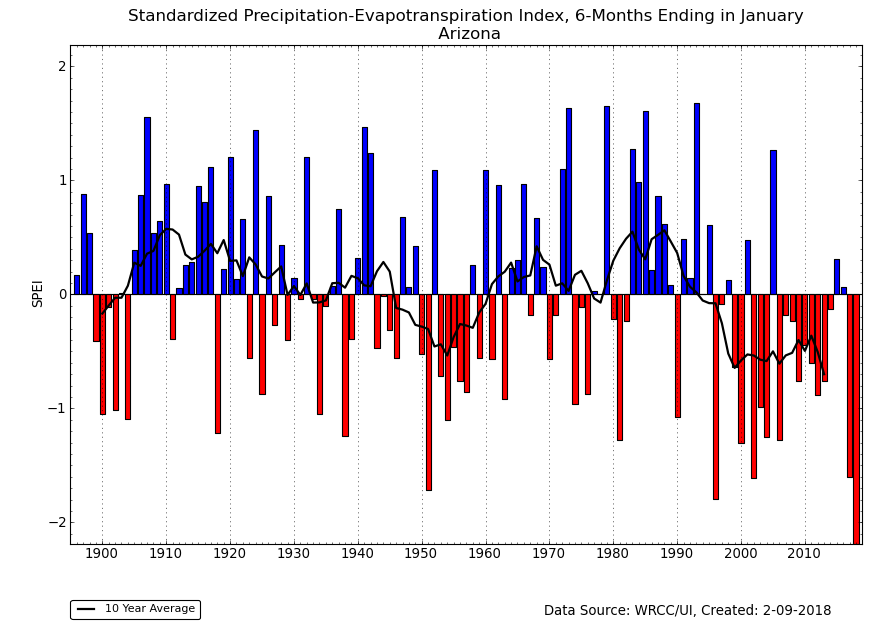
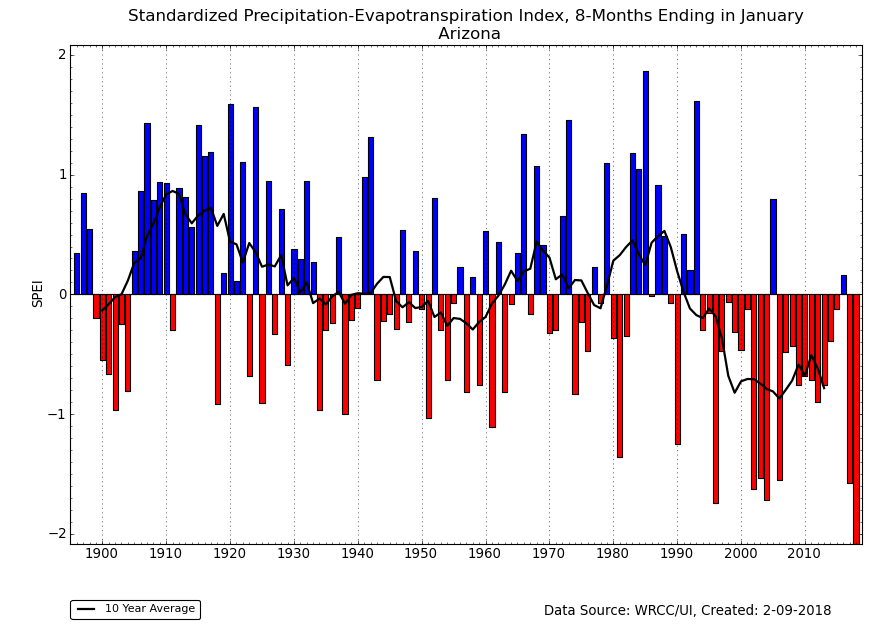
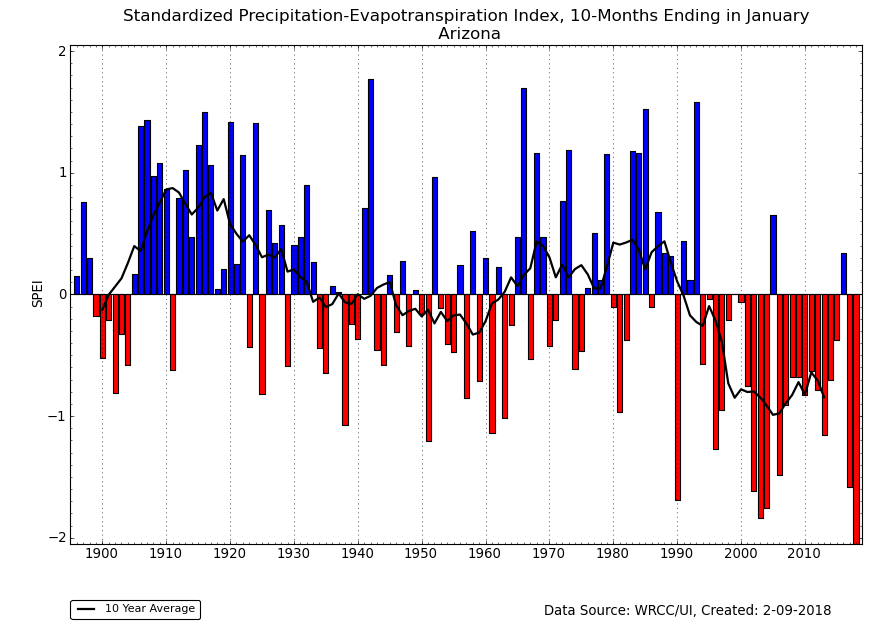
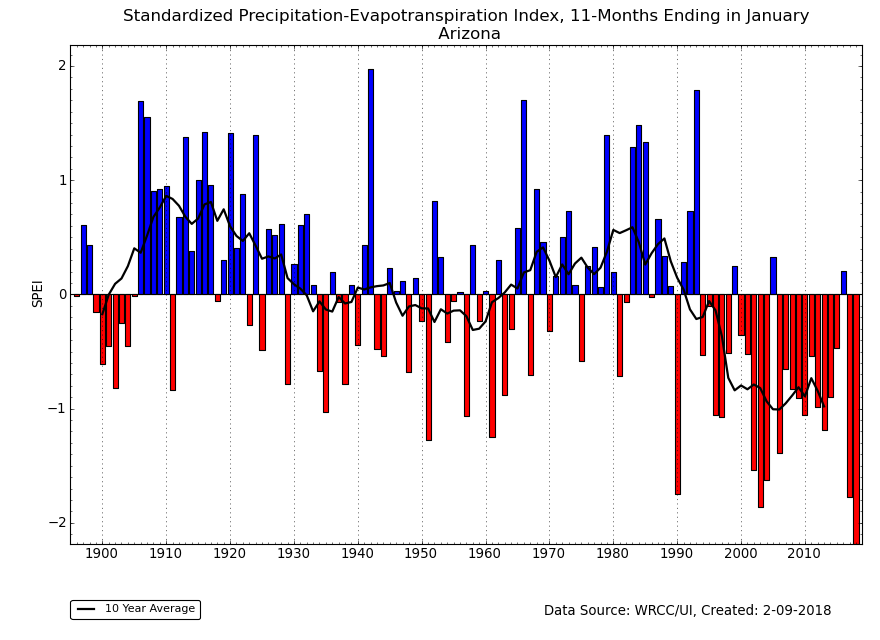
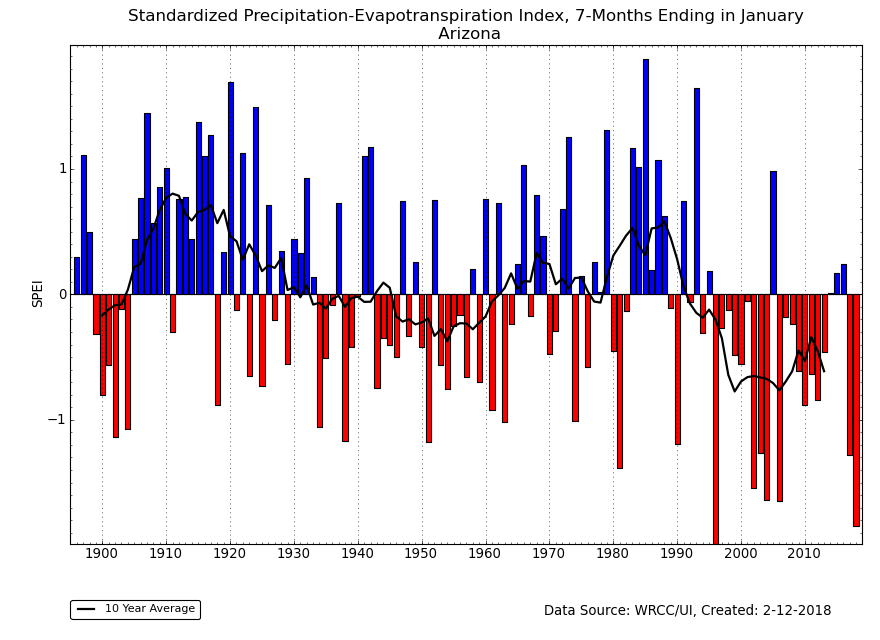
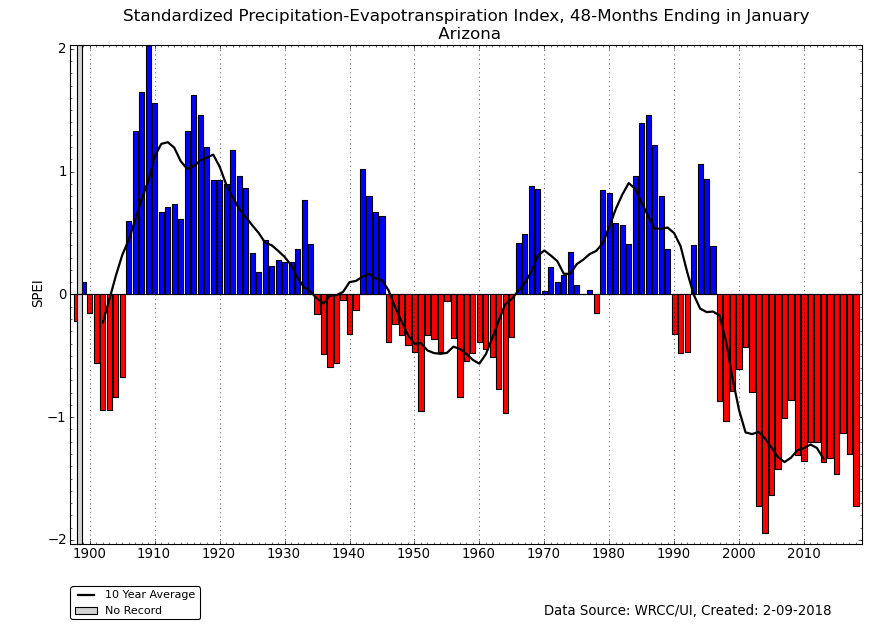
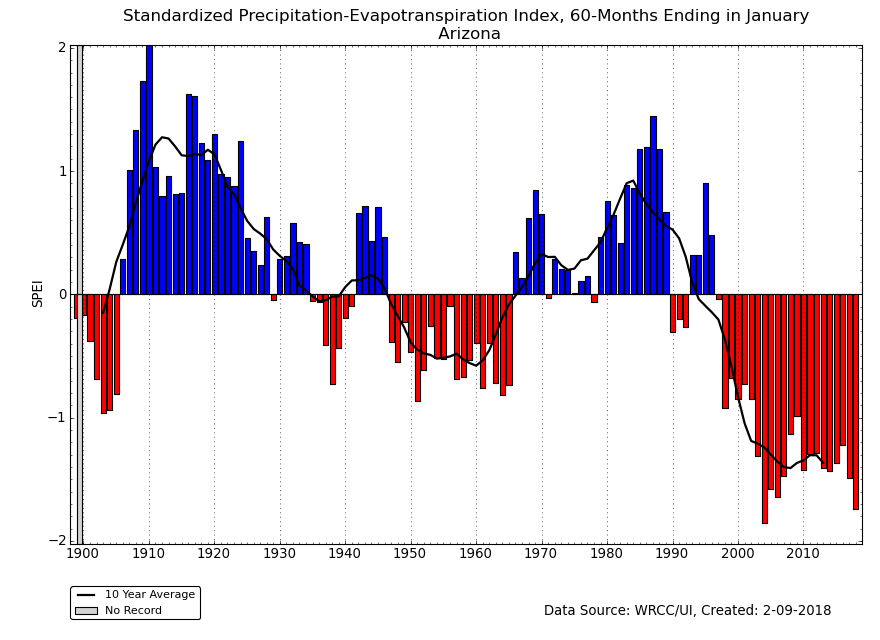
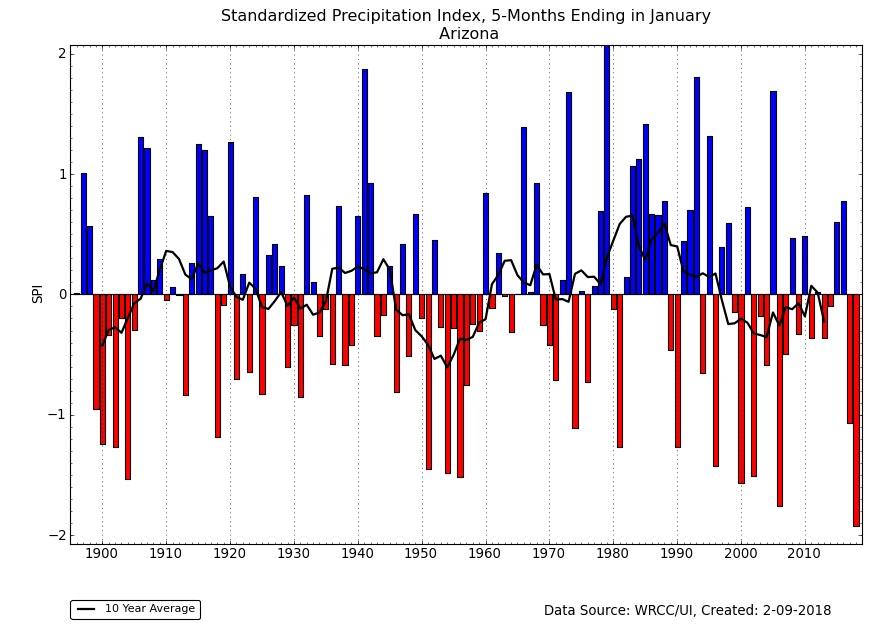
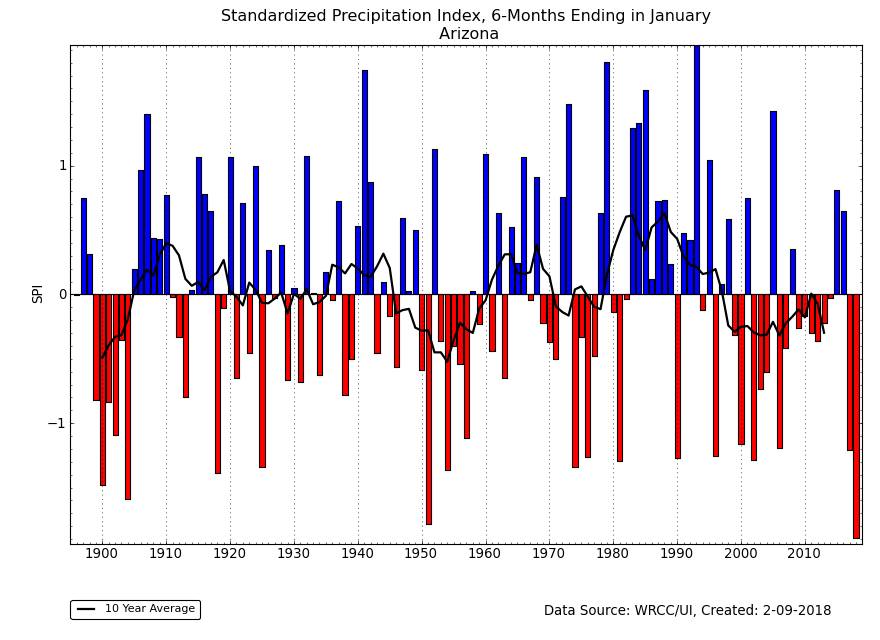
The Southwest, especially Arizona, has experienced record warm temperatures for the last 3, 6, and 12 months. For Arizona, this has resulted in a record dry SPEI in January 2018 for the last 3, 4, 5, 6, 8, 9, 10, 11, 12, 24, and 72 months. January 2018 had the second most extreme SPEI (behind 1996) for the last 7 months, and second most extreme behind 2004 for the last 48 and 60 months, and third most extreme (behind 2003 and 2004) for the last 36 months. Arizona's January 2018 SPI was record dry for the last 5 and 6 months, but second driest (behind 1951) for the last 11 months, third most extreme (behind 2000 and 1904) for the last 4 months, and only in the top ten driest for the last 7, 8, 9, 10, 12, and 24 months.
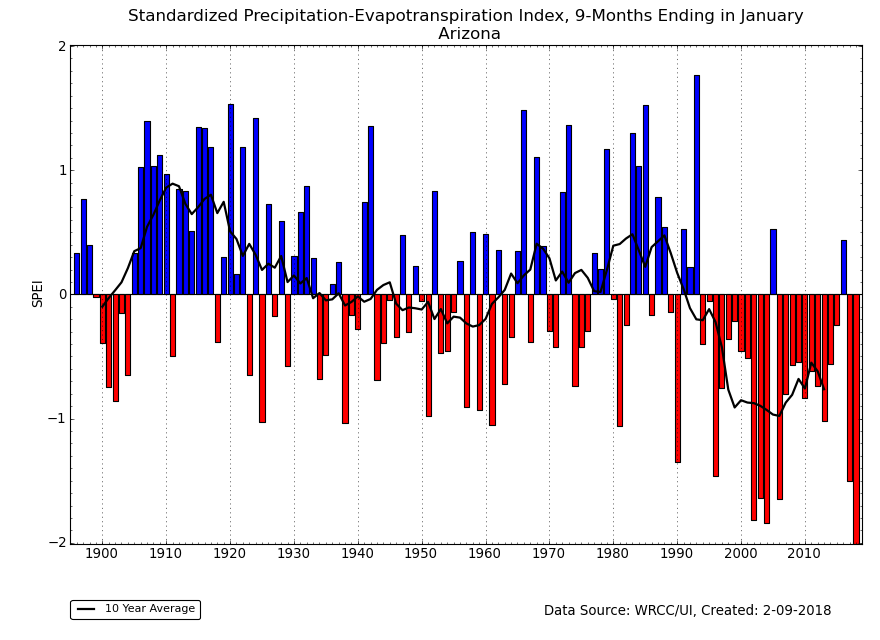 Arizona 9-month SPEI.
|
 Arizona 12-month SPEI.
|
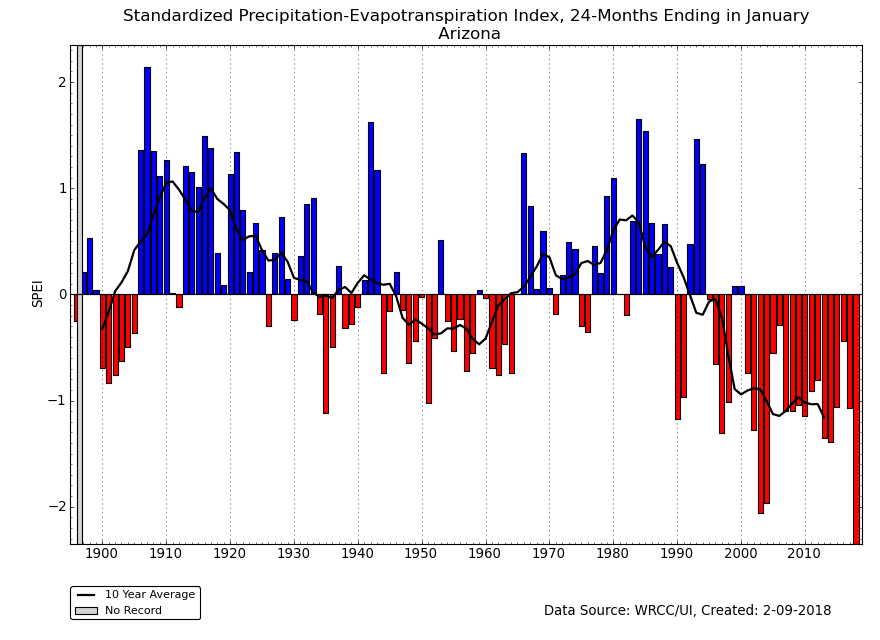 Arizona 24-month SPEI.
|
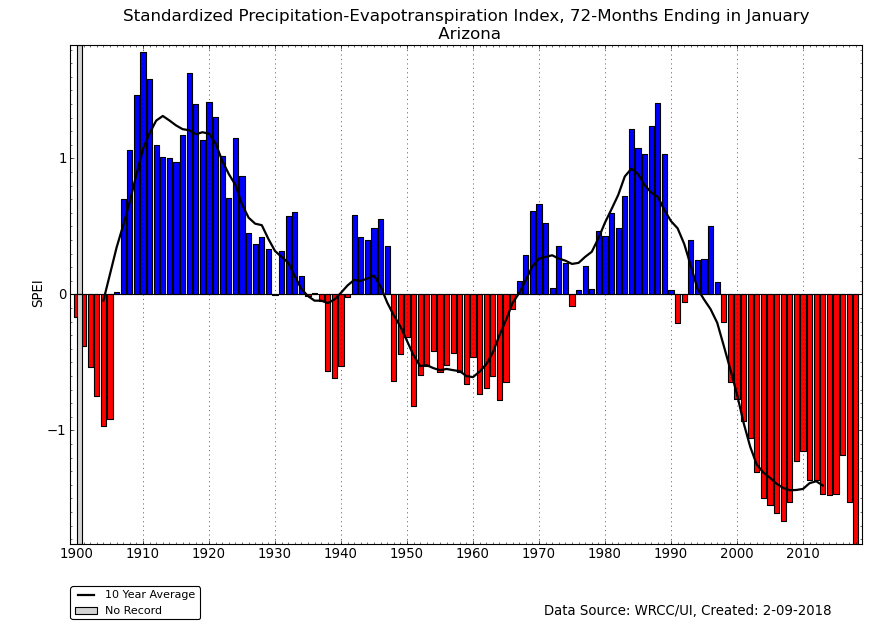 Arizona 72-month SPEI.
|
Regional Discussion
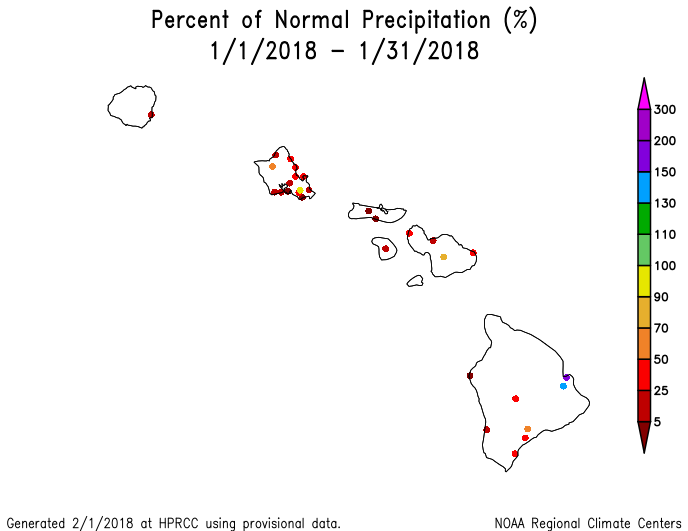
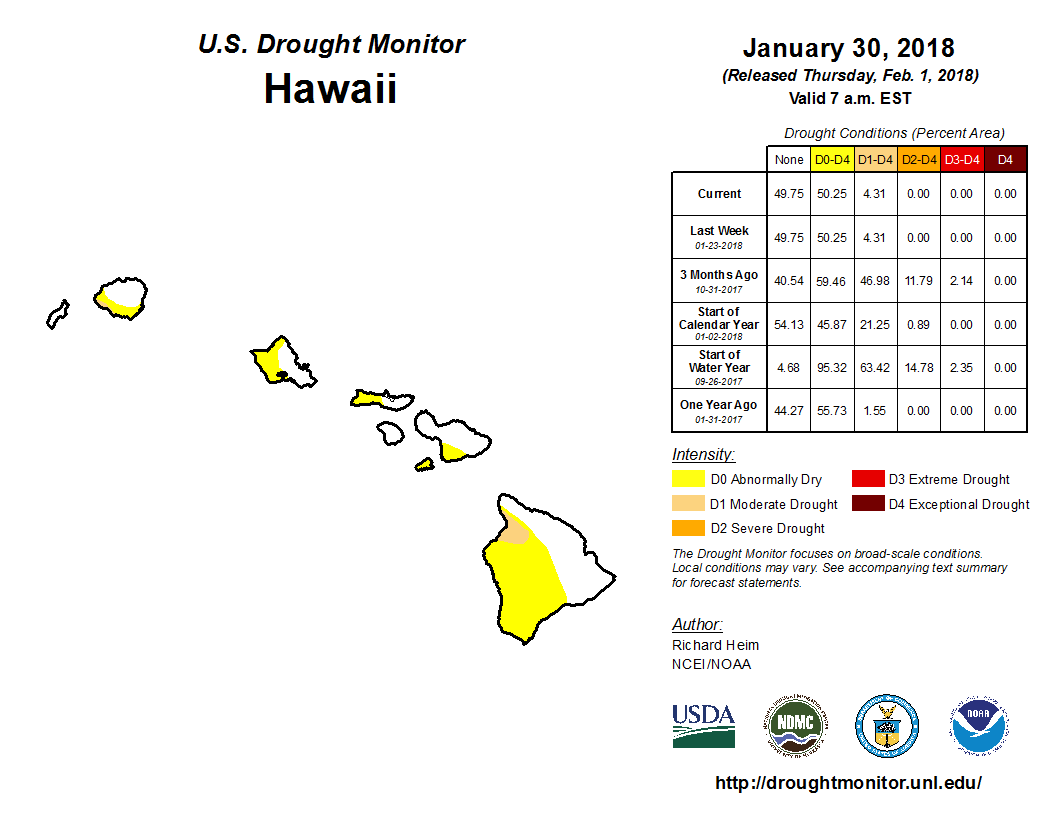
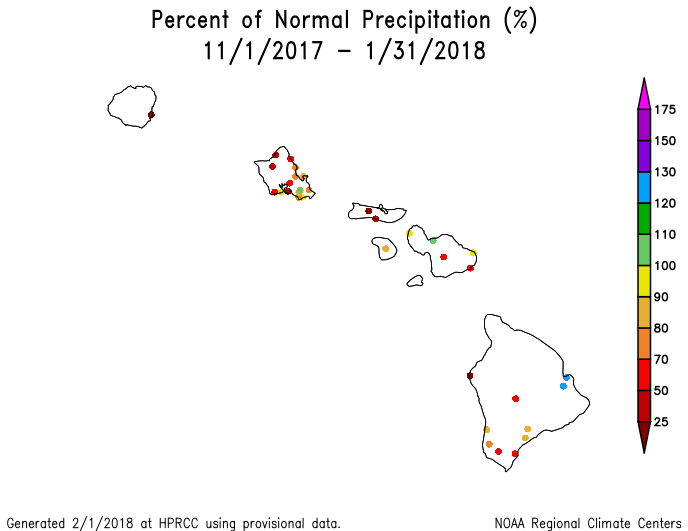
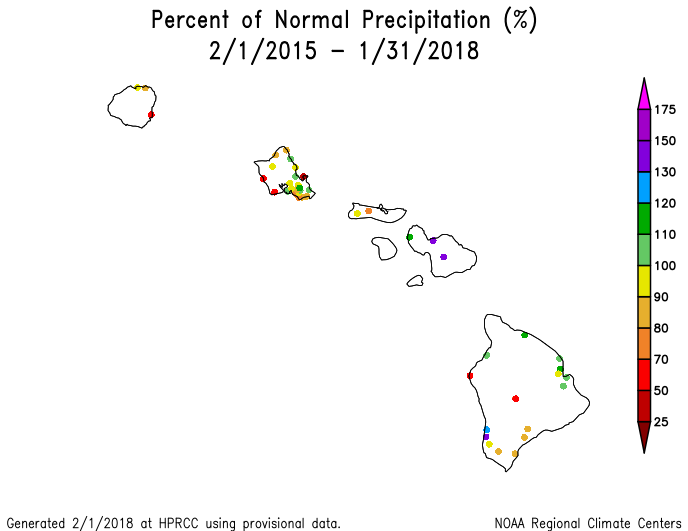
Map of percent of normal precipitation for Hawaii, January 2018.
January 2018 was mostly drier than normal across the Hawaiian Islands. A similar precipitation anomaly pattern existed for the last 2, 3, 4, 6, 7, 10, and 12 months, although wet conditions were evident on Kahului at about the 6 to 12 month time scales. A mixed precipitation anomaly pattern was evident at the longer time scales (last 24 and 36 months). Streamflow was mostly near to above normal. Abnormal dryness and drought contracted, but moderate drought still covered about 4.3 percent of the state on the January 30th, 2018 USDM map.
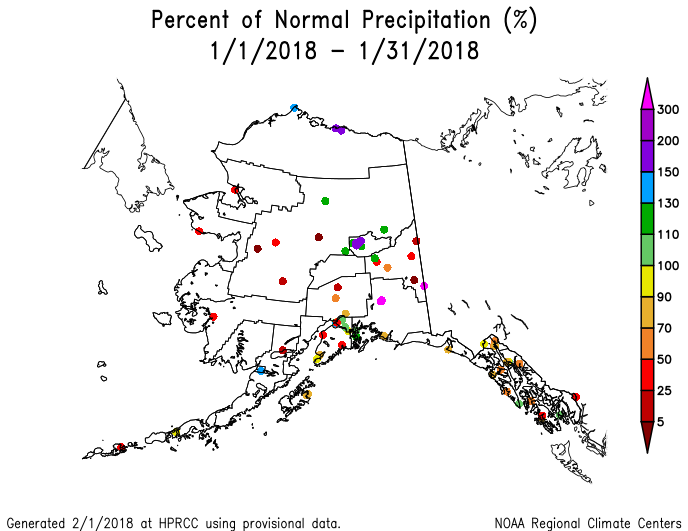
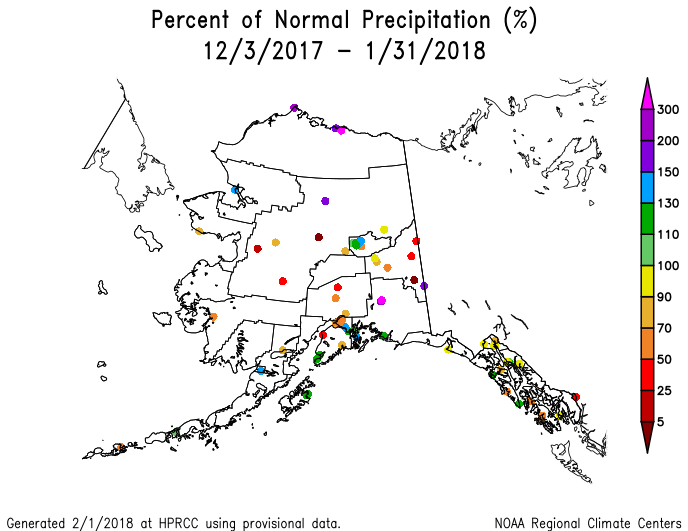
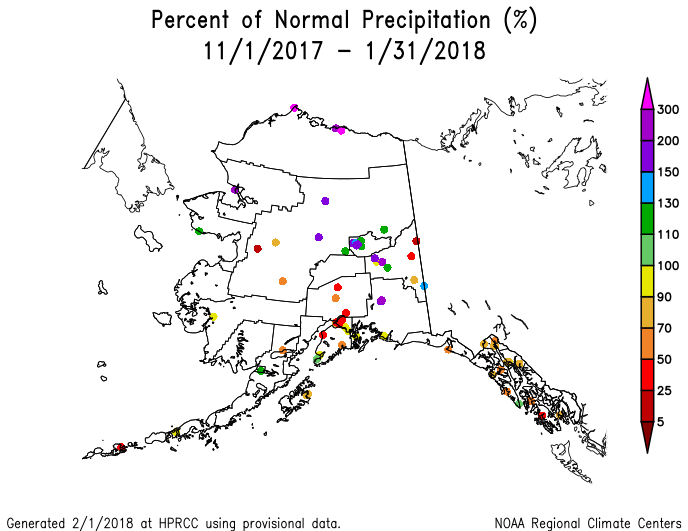
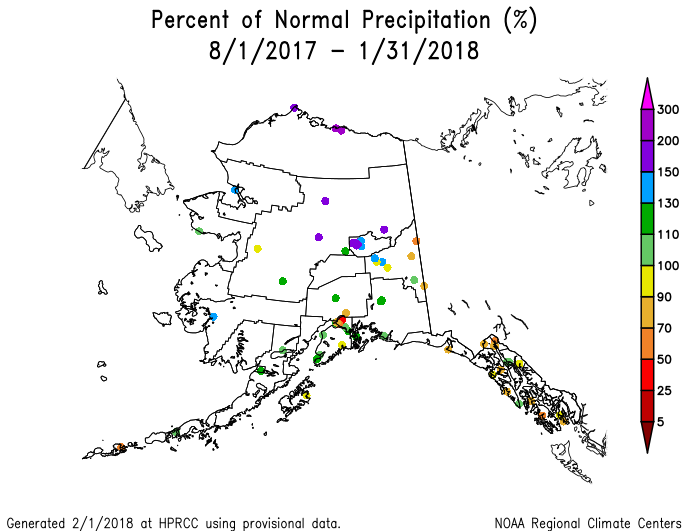
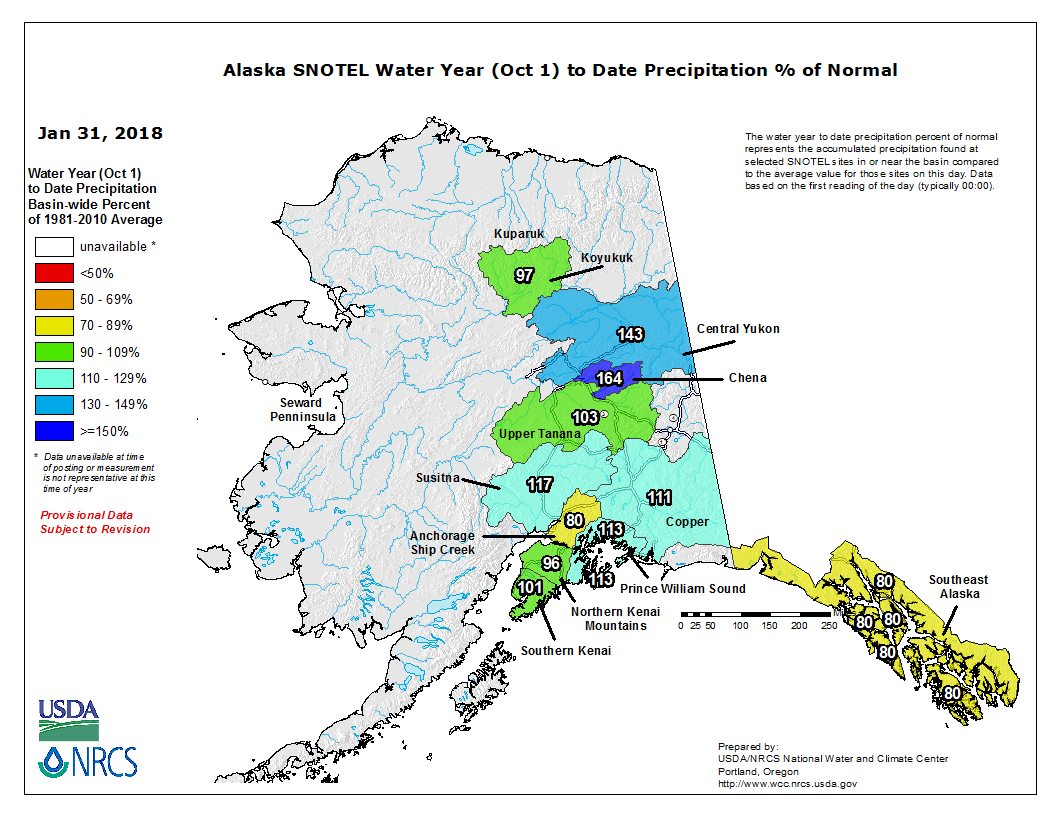
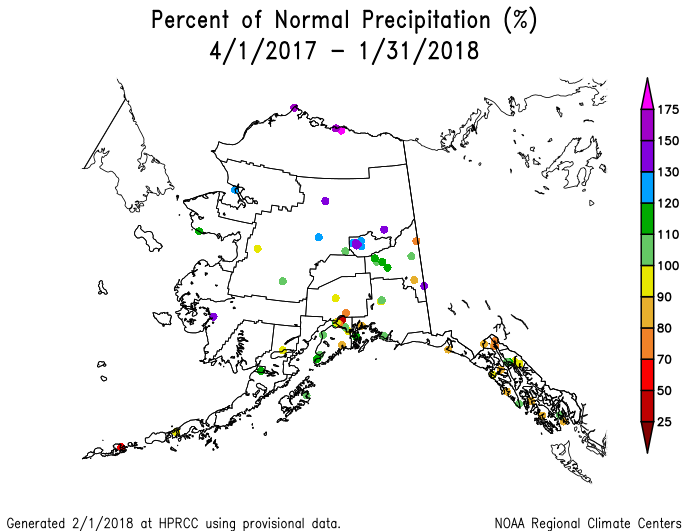
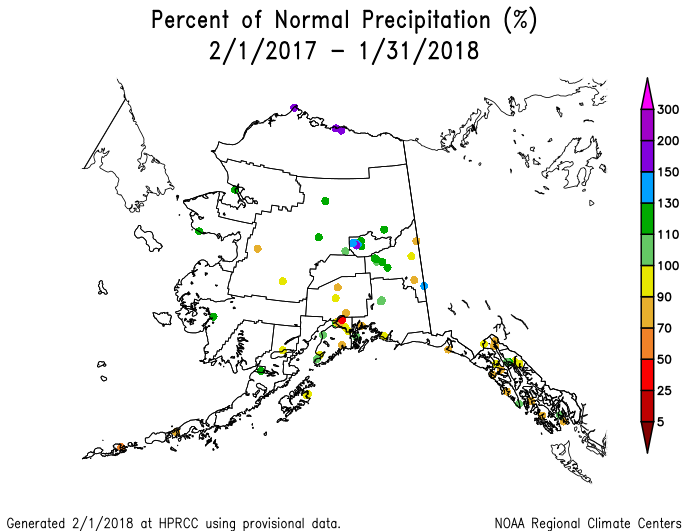
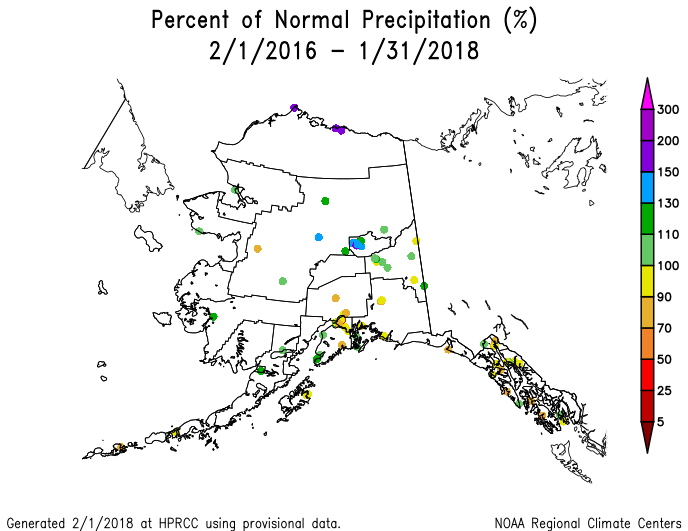
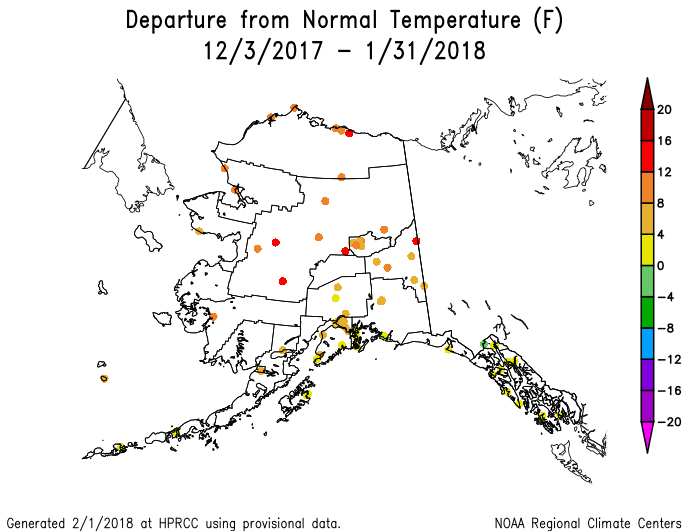
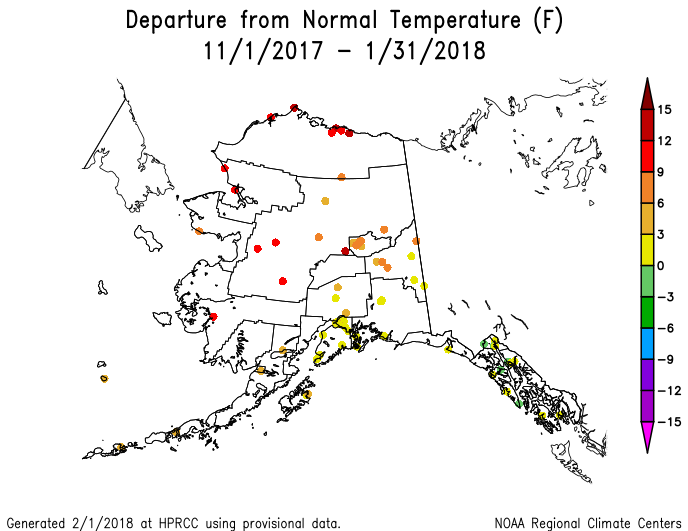
Alaska gridded percent of normal precipitation map, January 2018.
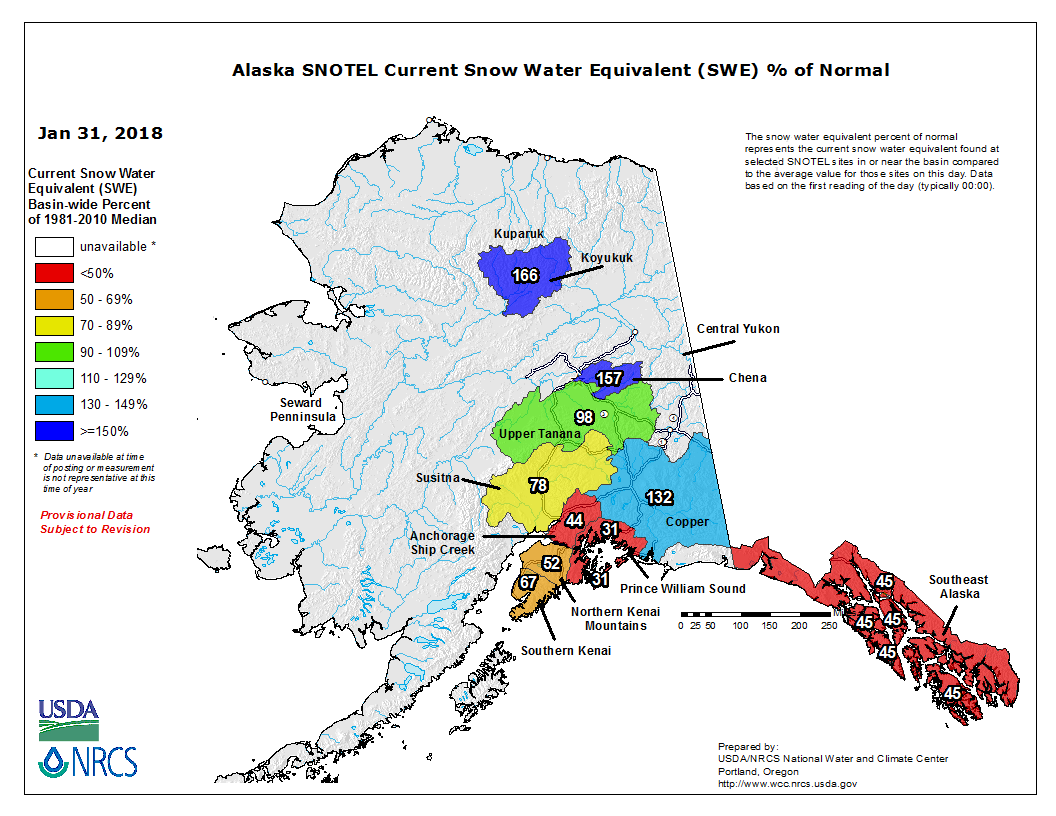
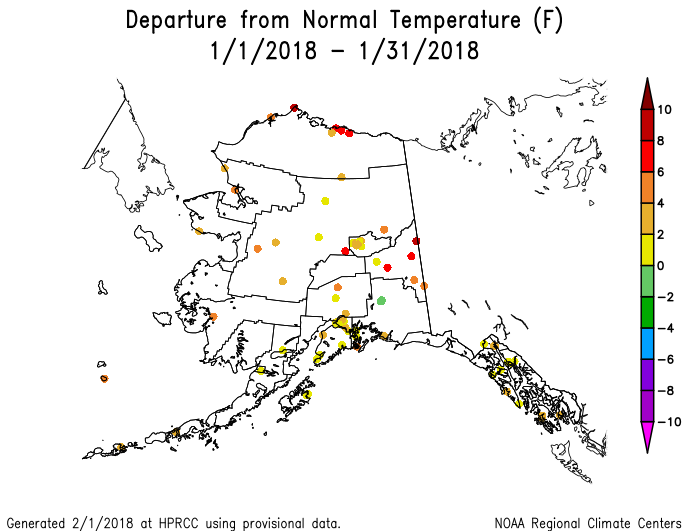
January 2018 was drier than normal across much of Alaska but wetter than normal in the north and interior southeast (climate division, gridded percentile, gridded percent of normal, and low elevation station maps); the high elevation (SNOTEL) stations had a mixed precipitation anomaly pattern. Dryness was centered more at the stations in the panhandle, south central, and interior southwest regions for the last 2 and 3 months (climate division, gridded percentile, gridded percent of normal, and low elevation station maps). For the water year to date (last 4 months, October 1 to present), the dryness was centered more along the panhandle and in the south central coastal region (SNOTEL station and basin maps, low elevation station maps). The panhandle was dry, but wetter-than-normal conditions dominated most of the rest of the state for the last 6 (climate division, gridded percent of normal, and low elevation station maps), 7, and 10 months. The last 12 months were mostly drier than normal in the south and wetter than normal in the north (climate division, low elevation station maps). There was some dryness in the panhandle and south central regions for the last 24- to 36 months, but wet conditions generally dominated. Temperatures were warmer than normal across most of the state during January (low elevation station, gridded percentile, gridded anomaly, divisional maps). Warmer-than-normal temperatures dominated at the 2-, 3- (low elevation station, gridded percentile, gridded anomaly, divisional maps), and 4-month time scales, with record warmth in the north. Warmer-than-average temperatures dominated, except in the panhandle, during the last 6 (gridded anomaly, divisional maps) and 12 (low elevation station, divisional maps) months. Snow pack and snow water content were below normal at the stations and in the basins in the panhandle and southern coastal regions, but above normal to the north. Streamflow in the south was mostly above normal. An area of abnormally dry (D0) was added to the southwestern, southern coastal, and panhandle regions on the January 30th USDM map to reflect the below-normal precipitation and snowpack.
National Weather Service precipitation anomaly maps were not available for Puerto Rico this month. January was wetter than normal at San Juan. Streamflow was mostly above normal across the island. As seen on the January 30th, 2018 USDM map, Puerto Rico was free of drought and abnormal dryness.
CONUS State Precipitation Ranks:
|
|
January 2018 was drier than normal across much of the CONUS. But there were enough areas of near- to above-normal precipitation mixed in with the below-normal areas that, on a statewide basis, only 15 states ranked in the driest third of the 124-year historical record with only two (Alabama at ninth driest and Colorado at tenth driest) in the top ten driest category.
|
|
November 2017-January 2018 was drier than normal across much of the CONUS, but especially from the Southwest to Mid-Mississippi Valley and from the Deep South to southern New England. Record dryness occurred in parts of the Southwest to central Plains and Mid-Atlantic regions. On a statewide basis, 36 states ranked in the driest third of the historical record with 14 in the top ten category — Kansas (driest November-January on record); Alabama, New Mexico, and Virginia (third driest); Colorado and Oklahoma (fourth driest); Arizona and Maryland (fifth driest); Missouri and New Jersey (sixth driest); Iowa, Kentucky, and Utah (eighth driest); and Connecticut (ninth driest). Nationally, it was the fourth driest November-January on record.
|
|
August 2017-January 2018 was drier than normal across much of the West, Mississippi Valley, and East. Eighteen states ranked in the driest third of the historical record, with Arizona having the driest August-January on record.
|
|
February 2017-January 2018 was drier than normal in the Southwest, northern High Plains, and parts of the Mississippi Valley and Southeast to southern New England regions. Nine states ranked in the driest third of the historical record, including two in the top ten driest category — Arizona (sixth driest) and North Dakota (seventh driest).
 Primary Hard Red Winter Wheat Belt precipitation, January, 1895-2018.
|
 Primary Hard Red Winter Wheat Belt precipitation, October-January, 1895-2018.
|
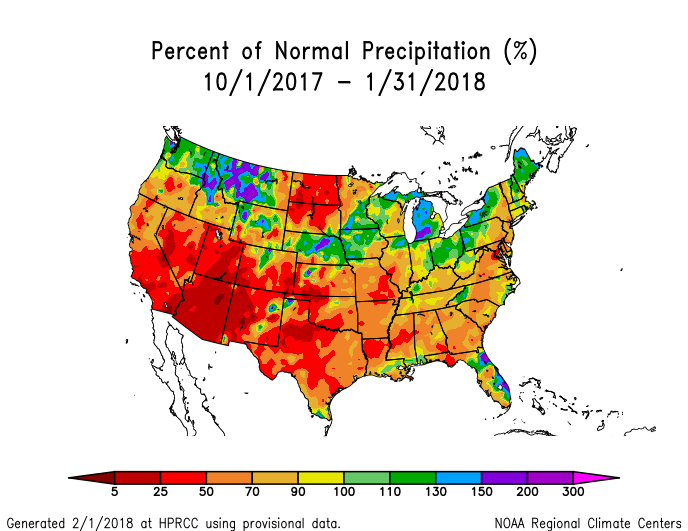
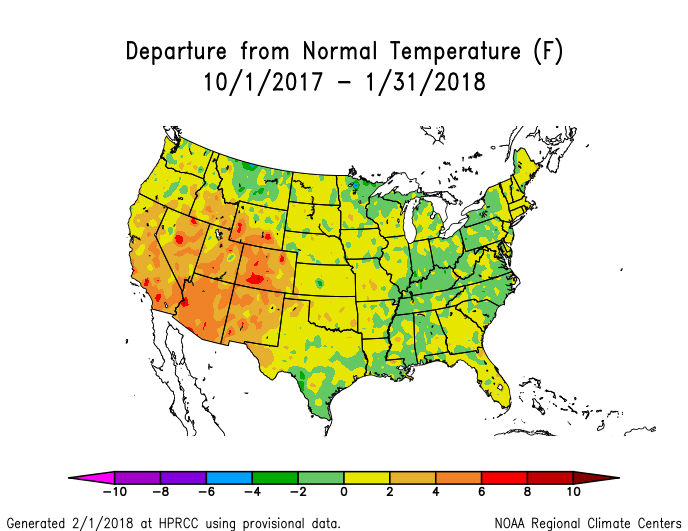
January 2018 was drier than normal with temperatures near normal across the Primary Hard Red Winter Wheat agricultural belt. The month ranked as the 22nd driest and 57th warmest January, regionwide, in the 1895-2018 record.
October marks the beginning of the growing season for the Primary Hard Red Winter Wheat belt. October 2017-January 2018 was drier than normal and warmer than normal across the agricultural belt, ranking as the 28th driest and 21st warmest October-January, regionwide.
| State | 11/26/17 | 12/31/17 | 1/31/18 |
| Winter Wheat Poor to Very Poor Condition | |||
| Colorado | 7% | 21% | 28% |
| Kansas | 14% | 22% | 44% |
| Oklahoma | 10% | 42% | 79% |
| Topsoil Moisture Short to Very Short | |||
| Colorado | 21% | 60% | 59% |
| Kansas | 39% | 77% | 79% |
| Oklahoma | 75% | 84% | 93% |
| South Dakota | 44% | 53% | 64% |
The prolonged below-normal precipitation has dried soils and inhibited crop growth in many states in the Plains. According to statistics from the U.S. Department of Agriculture (USDA), the percentage of pastures and rangeland rated in poor to very poor condition grew from 17 percent to 28 percent in Colorado, and from 31 percent to 49 percent in Oklahoma, from the end of December to the end of January. The table to the right summarizes the deteriorating condition of topsoil moisture and winter wheat condition for several states over the last three months.
NOAA Regional Climate Centers:
A more detailed drought discussion, provided by the NOAA Regional Climate Centers and others, can be found below.
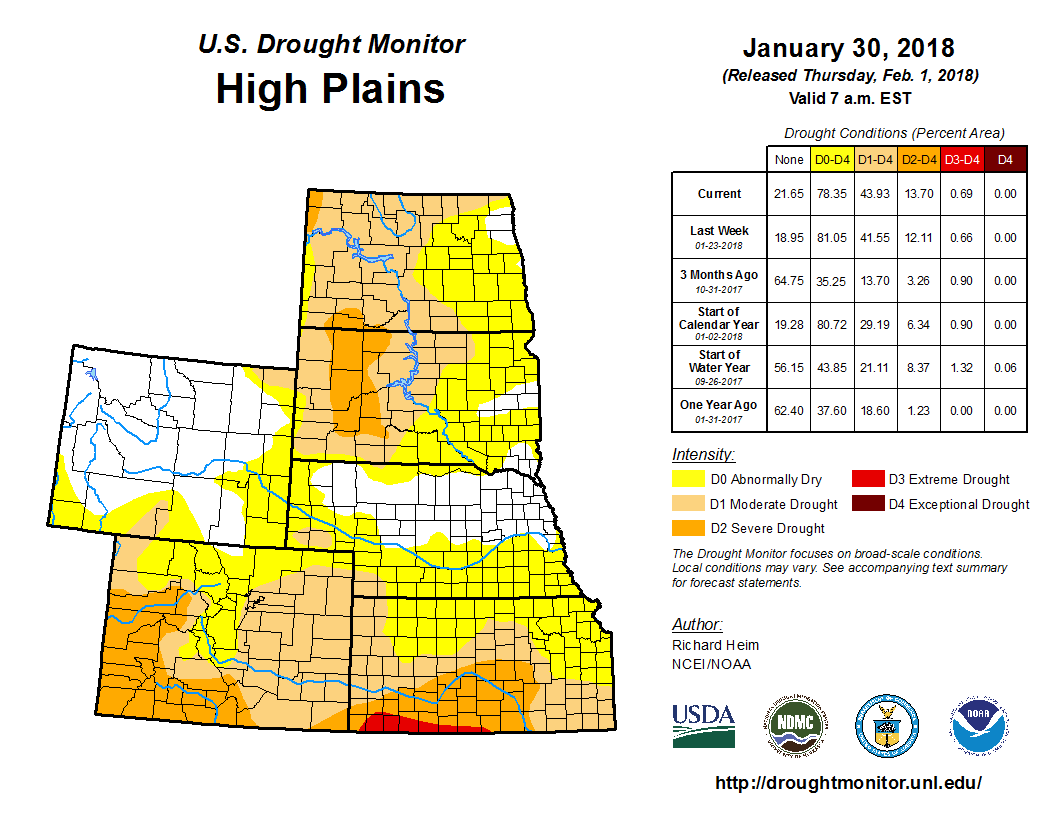
As described by the High Plains Regional Climate Center, temperatures were variable throughout the High Plains in January, and much of the region experienced another dry month, with the greatest precipitation departures across the southern part of the region. The monthly precipitation pattern showed a mix of wet and dry conditions, with plentiful precipitation falling across the central part of the region and paltry amounts occurring to the north and south. Portions of Nebraska and Wyoming experienced precipitation exceeding 200 percent of normal, while much of Kansas and the Dakotas received less than 50 percent of normal precipitation. Garden City, Kansas did not have measurable precipitation during January, recording only a trace and tying multiple years for the 2nd driest January on record. Some locations in Kansas experienced record-breaking dry streaks that carried into January. For instance, Liberal had its longest dry streak on record, with no measurable precipitation for 96 days (October 7, 2017 - January 10, 2018), crushing the old record of 82 days in 1989.
Drought continued to expand and intensify throughout Kansas and Colorado. According to the USDM, the area in drought (D1-D4) increased from 28 percent to 44 percent over the course of the month. The majority of the degradations occurred in Colorado and Kansas where November-January precipitation was less than 25 percent of normal. The worst conditions could be found in southern Kansas where extreme drought (D3) was introduced to the area. Moderate drought (D1) and severe drought (D2) spread northward into central Kansas. Winter wheat was not faring well, with nearly half of the crop in poor to very poor condition by the end of the month. In Colorado, snowpack continued to suffer, and mounting snowfall deficits in the southwestern portion of the state warranted D2 conditions on the USDM map. Ski resorts were losing business and forced to close for periods of time due to the lack of snow. Additionally, water managers began doubting that the precipitation deficit could be made up this season and began expressing concerns over the lack of water supplies later on in the year. And fires continued to be problematic in January. Despite the overall drought degradations this month, two primary areas experienced improvement in conditions. Excessive precipitation in northern and central Nebraska prompted the removal of abnormally dry conditions (D0), while gradual improvement in drought conditions led to the removal of D3 in South Dakota.
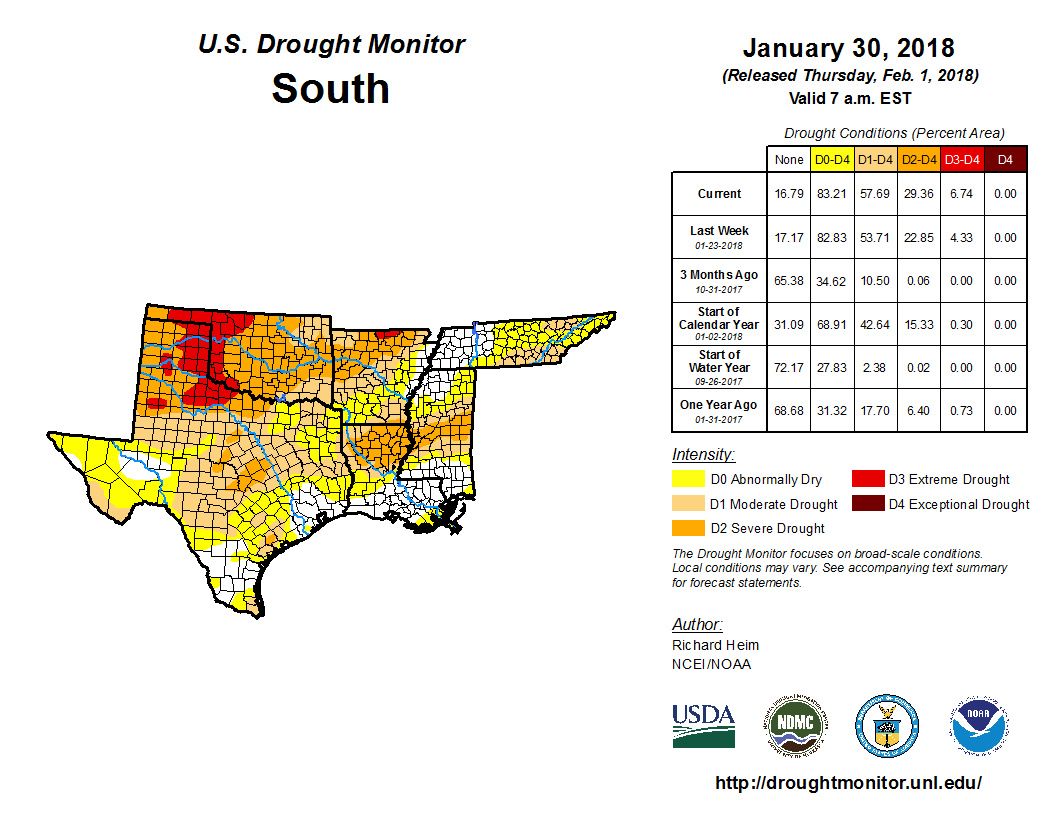
As explained by the Southern Regional Climate Center, January temperatures and precipitation were below normal for most of the Southern region. North, west, and central Texas, and western Oklahoma received 25 percent or less of normal precipitation. Areas of central, northern, and southern Tennessee, central and southern Mississippi, southeast and north Louisiana, central, eastern, and southern Texas, central northern, western, and southern Arkansas, and eastern Oklahoma received 25-70 percent of normal precipitation. In contrast, parts of southern Louisiana, southeast Texas, southwest and north central Mississippi, eastern Arkansas, and western and eastern Tennessee received above-normal precipitation. Throughout the month, drought conditions worsened from severe to extreme drought in western Oklahoma and northern Texas. Conditions worsened from moderate to severe drought in central Oklahoma, and northern and central Texas. Moderate drought conditions expanded throughout southern and western Texas and in central and western Tennessee. Abnormally dry conditions appeared in central and northern Tennessee and western Texas. In contrast, conditions improved from extreme to severe and moderate drought in central Arkansas.
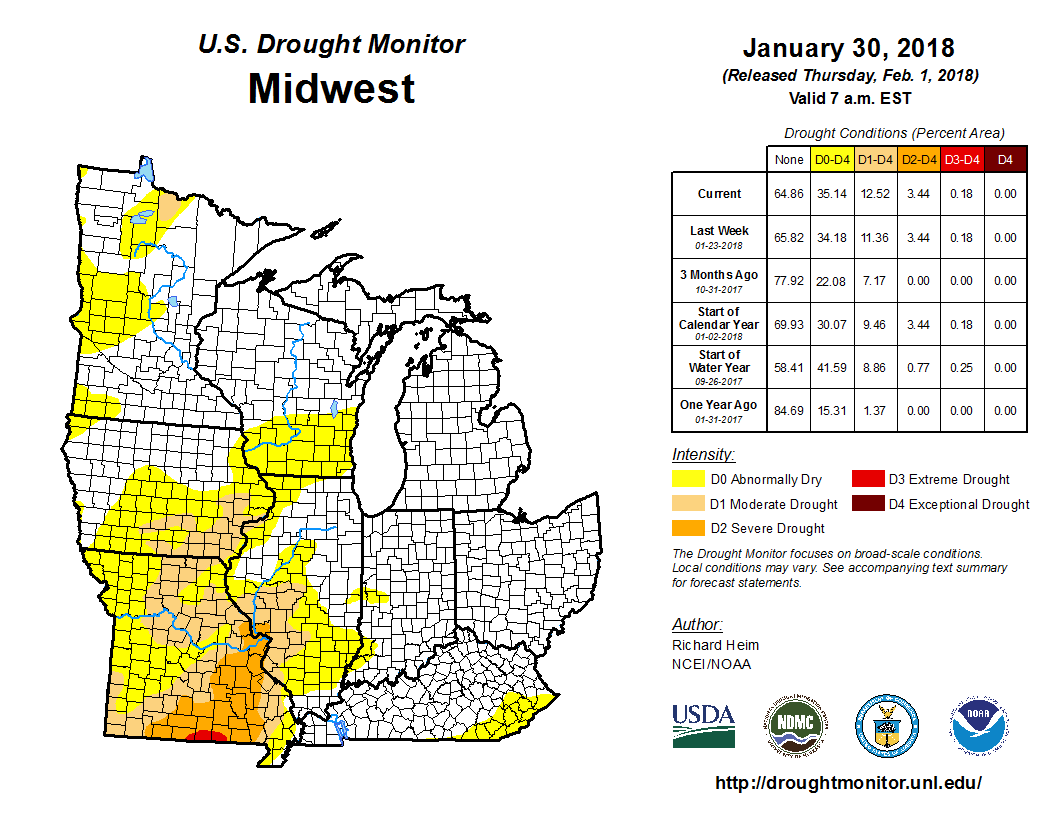
As summarized by the Midwest Regional Climate Center, the Midwest saw big temperature swings in January with monthly average temperatures close to normal. Conditions were mostly on the dry side in the Midwest, particularly in west central Minnesota where less than a quarter inch (6 mm) of precipitation fell and Kentucky where deficits up to 2.00 inches (51 mm) below normal were noted along the Tennessee border. A few locations had monthly totals that failed to reach 50 percent of normal and west central Minnesota had less than 25 percent of normal for the month. The areas with above-normal precipitation were mostly from Iowa to Upper Michigan. The generally dry conditions led to a slight expansion of drought in the Midwest in January. The area of extreme drought in south central Missouri remained steady but areas of moderate drought expanded during the month. The percentage of the region in drought increased from about 9 percent to 12 percent from the 2nd to the 30th. At the end of the month, about 60 percent of Missouri was in drought while areas in southwest Illinois, southeast Iowa, and northern Minnesota were also in drought.
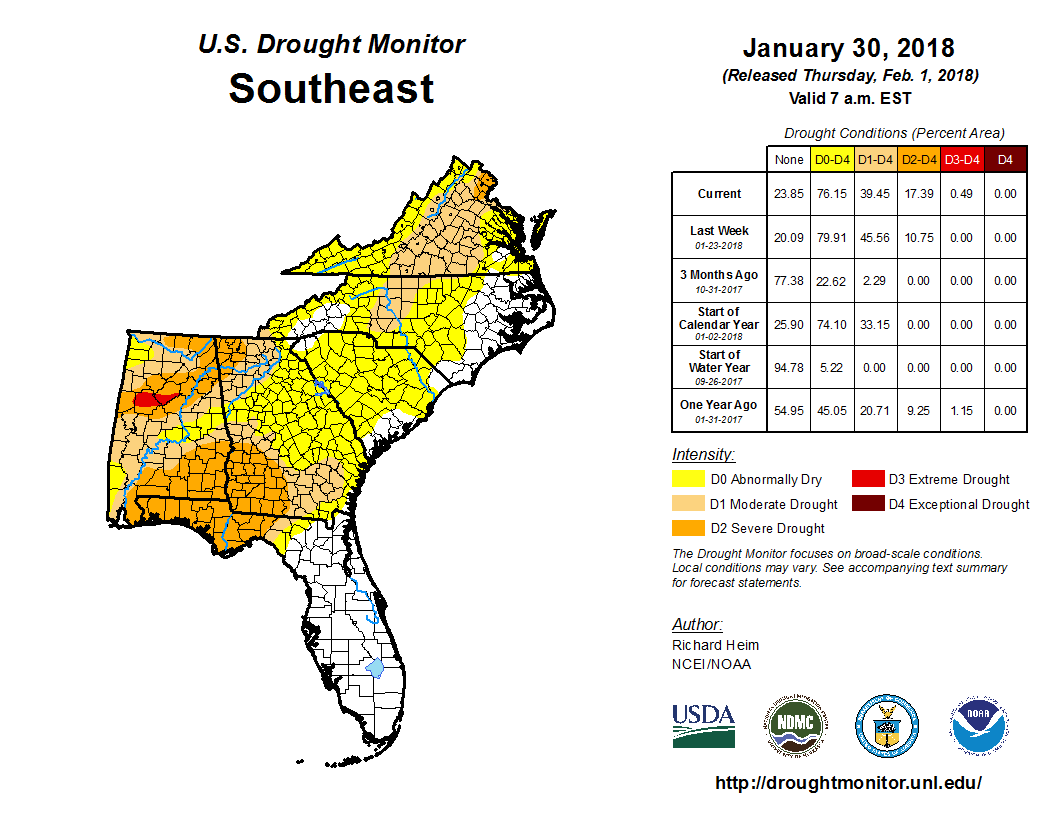
As noted by the Southeast Regional Climate Center, precipitation was near normal to well below normal across much of the Southeast region during January, with a few areas of unusual wetness, and temperatures were well below average across much of the region (excluding Puerto Rico and the U.S. Virgin Islands). The driest locations were found across much of Alabama, the Florida Panhandle, southern Florida, and the Washington, D.C. area, as well as portions of Georgia, the southern half of South Carolina, far western North Carolina, and the western half of Virginia. Monthly precipitation totals ranged from 50 to less than 25 percent of normal in these areas. In contrast, unusual wetness was found across portions of southeastern Virginia, coastal North Carolina, northeastern and west-central Florida, Puerto Rico, and St. Thomas in the U.S. Virgin Islands, where monthly precipitation totals were 150 to more than 200 percent of normal.
Drought continued to intensify and expand in coverage across portions of Alabama, Georgia, and Florida during January. By the end of the month, moderate-to-severe (D1-D2) drought covered 84 percent of Alabama, 50 percent of Georgia, and all of the Florida Panhandle, with several counties in central Alabama observing extreme (D3) drought. Severe drought also developed in a small area of northern Virginia and Washington, D.C. during late January. In contrast, above-normal precipitation during the final week of the month produced significant drought improvement across the Carolinas. Moderate drought was completely removed from South Carolina, while the coverage of moderate drought in North Carolina decreased from 35 percent on January 2nd to 13 percent on January 30th. Streamflows improved substantially across the Carolinas and Virginia, but over 40 percent of the USGS gages in Alabama recorded well-below-normal (i.e., less than the 10th percentile) streamflows at the end of the month. The growth of small grains, livestock pastures, and hayfields across the region was stunted by the persistence of cold, dry weather during the month.
As explained by the Northeast Regional Climate Center, the Northeast was colder and wetter than normal in January. Five states were drier than normal, while seven states were wetter than normal. Precipitation for all states ranged from 74 percent of normal in Maryland to 156 percent of normal in Maine. According to the USDM released on January 4, parts of Maryland and eastern Pennsylvania were in a moderate drought (totaling 5 percent of the Northeast) and 19 percent of the region was abnormally dry. During the month, moderate drought and abnormal dryness lingered or slightly expanded. By month's end, conditions worsened in parts of central and southern Maryland, leading to the introduction of severe drought. Below-normal streamflow and groundwater levels were reported in some areas, especially those experiencing severe drought. The USDM released on February 1 showed 5 percent of the Northeast was in a severe or moderate drought and 21 percent of the region was abnormally dry.
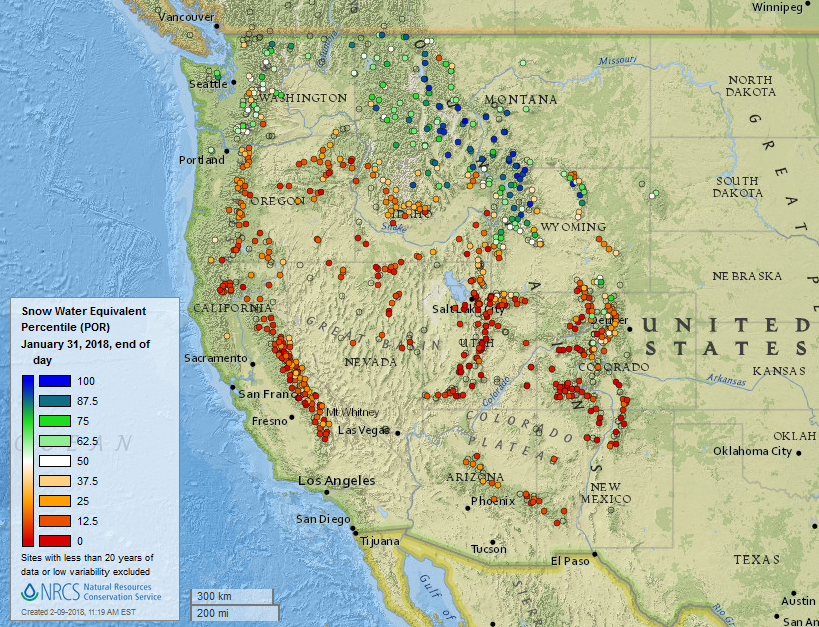
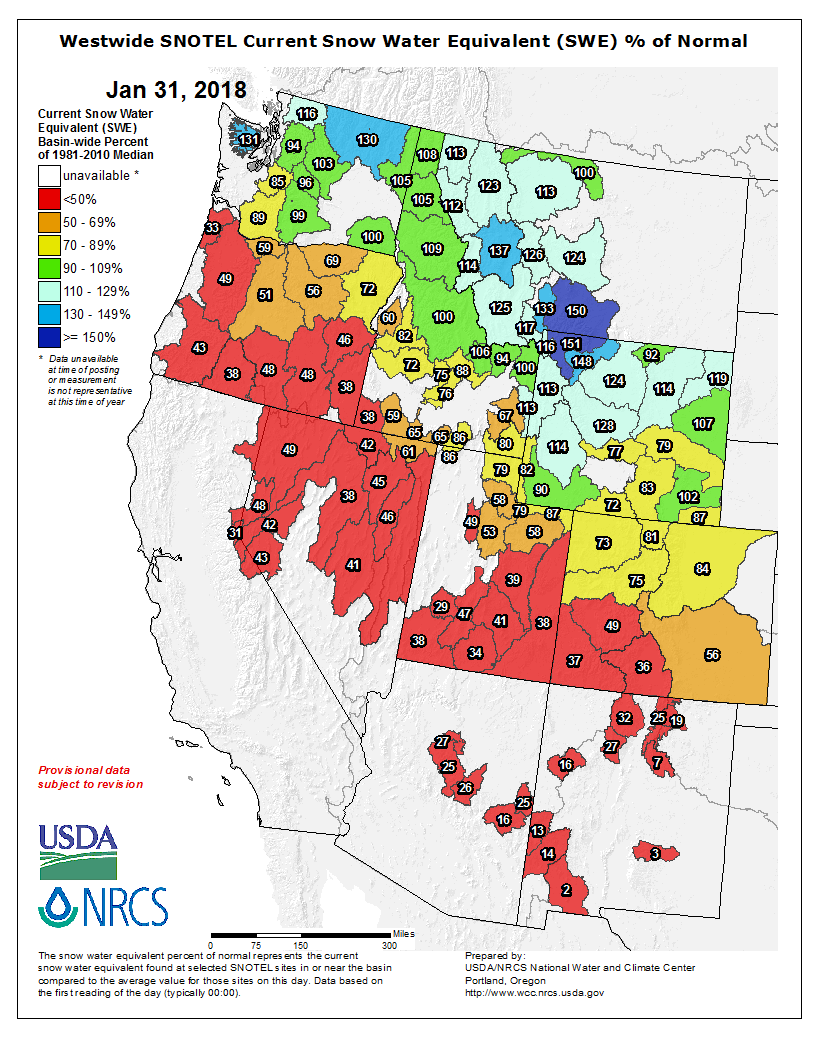
As summarized by the Western Regional Climate Center, January storms produced near to above normal precipitation in portions of the Northwest, coastal northern California, southern Nevada and the eastern Great Basin, but drier than normal conditions dominated elsewhere. Several periods of strong high pressure over the West led to widespread above normal temperatures this month. More specifically, across most of the Southwest and Oregon, dry conditions and below normal snowpack dominated this month. Snowpack stood at less than 50% of normal in most of Oregon, the Sierra Nevada, Great Basin, and Colorado River basins at the end of the month. Abnormally dry conditions were expanded across Nevada and Oregon on the USDM map. Moderate or worse drought conditions were extended across southern California and the Four Corners region.
The low snowpack raised drought concerns and impacted many western ski resorts. The Four Corners region has been one of the most impacted, but effects of the warm winter thus far and low snowpack also been felt in all other southwestern areas, Oregon and much of Idaho. Most of the Colorado River Basin is experiencing less than 75% of normal snowpack, raising concerns for spring and summer runoff and water resources if conditions do not improve in the remainder of winter. Grand County, in southeastern Utah, has declared a drought emergency as low precipitation and snowpack threaten agriculture. Low snowpack has also impacted ski resorts. A large resort operator, Vail Resorts, reported that visitation and retail sales are down approximately 10% this season through the first week of January. Many resorts have scaled back operations due to the low snowpack and have not been able to open all terrain. In northern New Mexico, Taos has only 25 of 111 runs open at month's end. A cold late January storm slightly improved conditions, but snowpack remained well below normal.
Across Alaska, the first half of January was mild and the second half considerably cooler except for the North Slope and Northwest regions. Precipitation was generally above normal across the northern region and Fairbanks area, and below normal elsewhere. Fairbanks reported 1.1 in (28 mm) precipitation, 189% of normal. Snowpack in Southcentral Alaska basins was less than 75% of median, while Interior basins were slightly above median. Further south, dry conditions dominated across most of Hawaii with nearly all stations reporting less than 50% of normal for the month. Honolulu, Oahu, reported 0.06 in (1.5 mm), 3% of normal and the 3rd driest January since records began in 1940. Kahului, Maui, observed 0.27 in (7 mm), 9% of normal and the 8th driest January since records began in 1905. The windward side of the Big Island experienced above normal precipitation; Hilo logged 14.63 in (372 mm), 158% of normal.
Pacific Islands: The NOAA National Weather Service (NWS) offices, the Pacific ENSO Applications Climate Center (PEAC), and partners provided reports on conditions across the Pacific Islands.
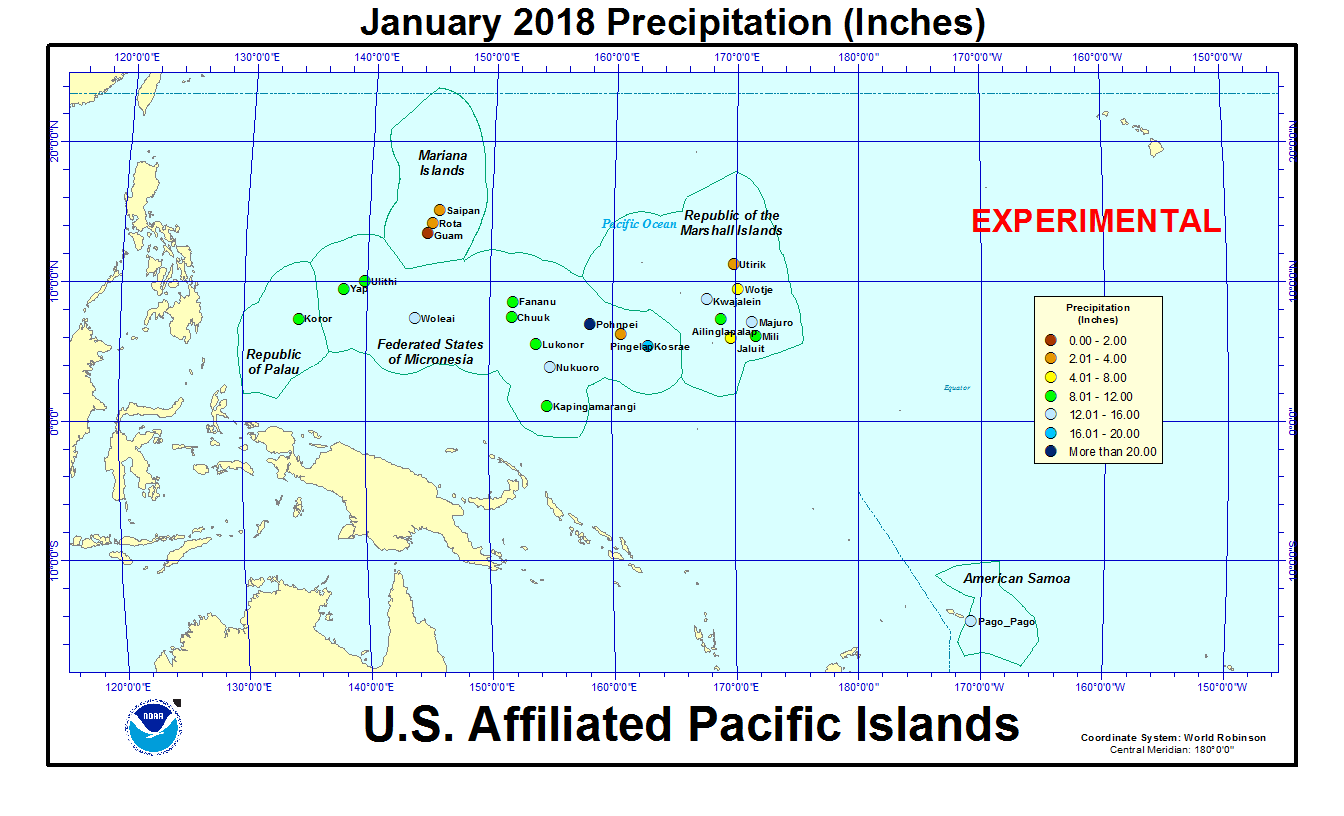
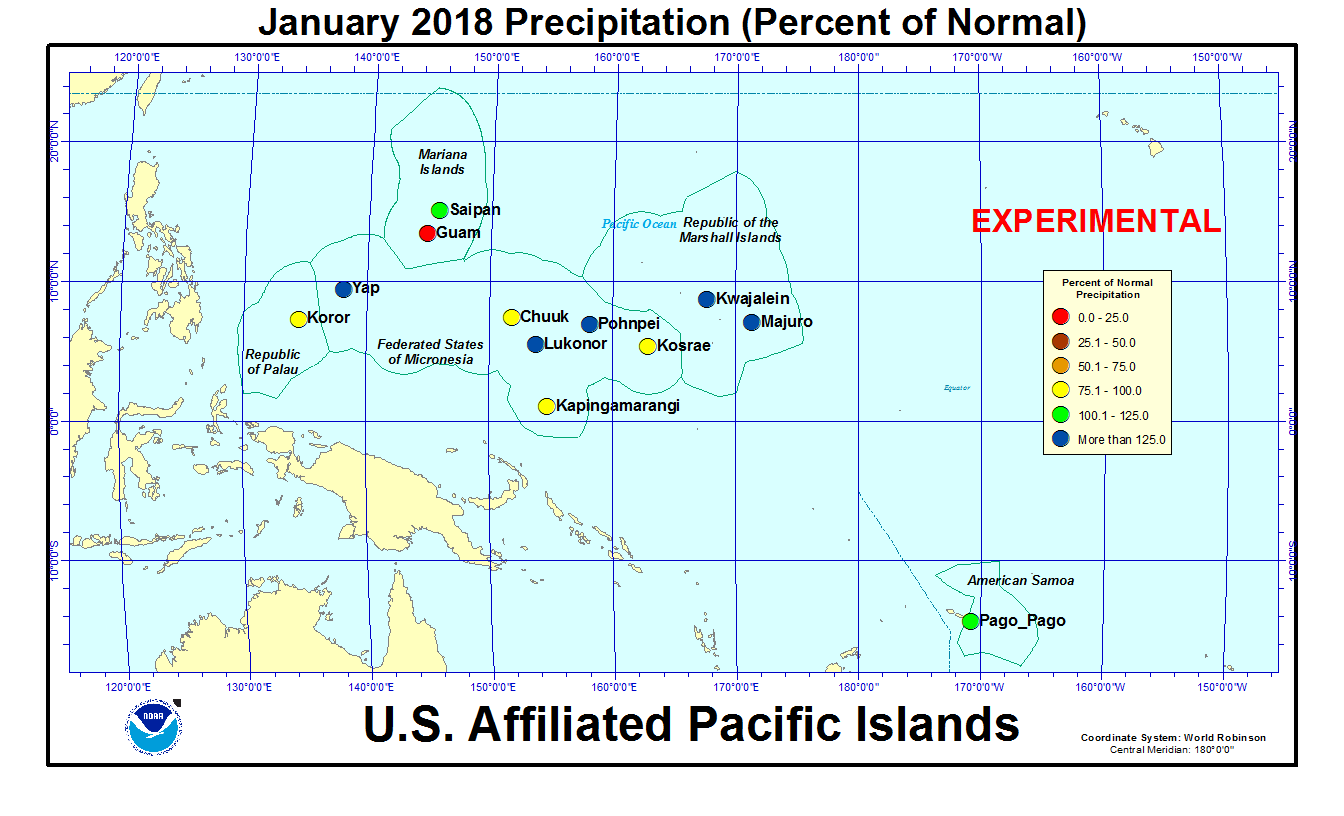
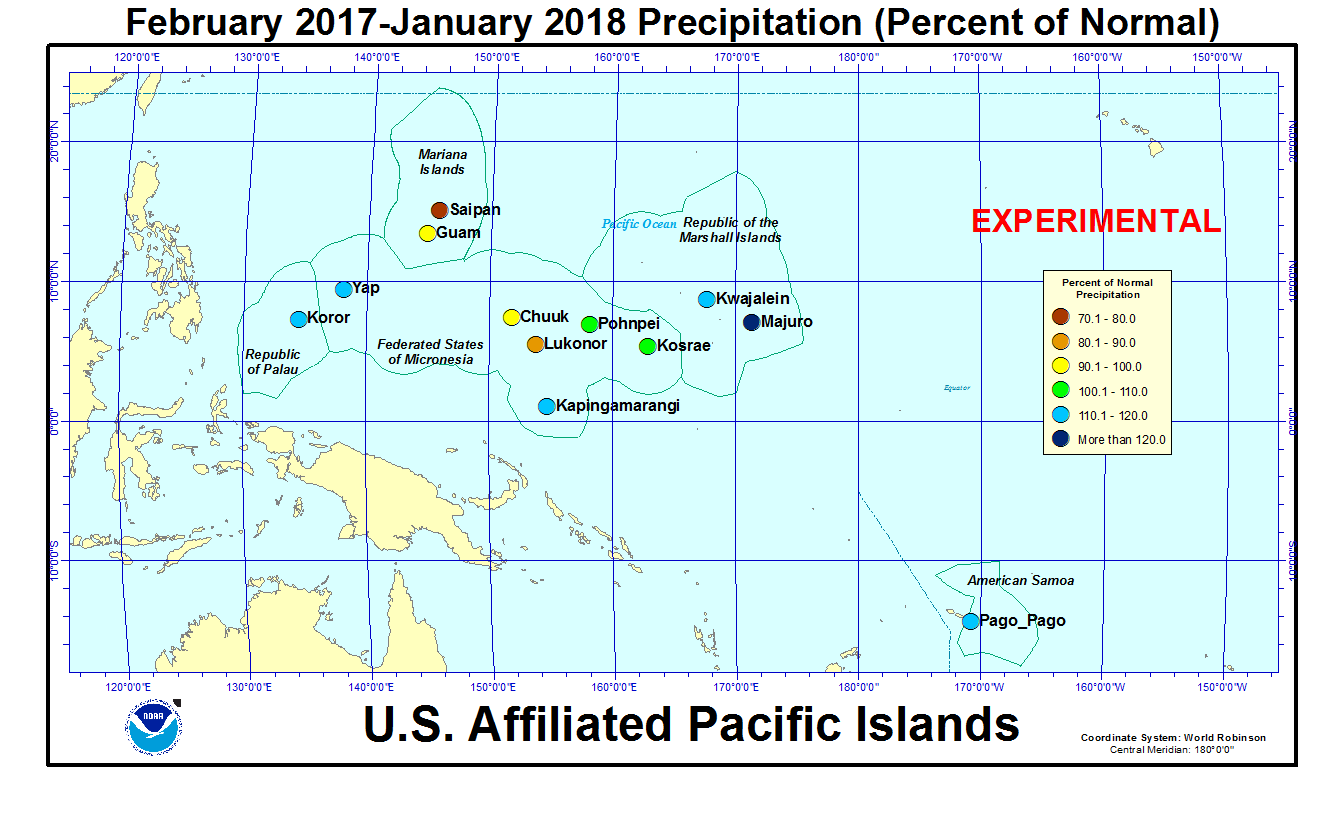
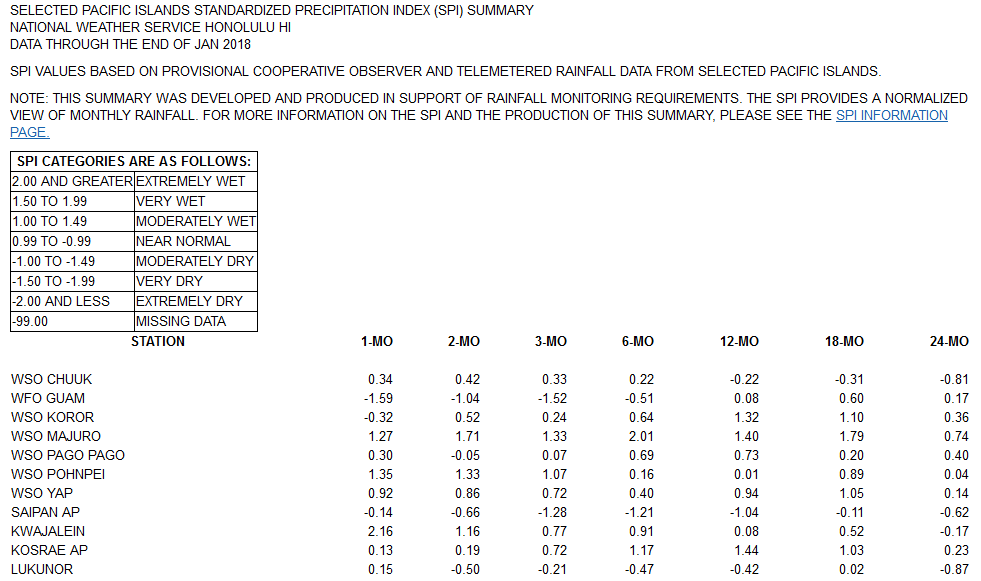
In the U.S. Affiliated Pacific Islands (USAPI) (maps — Federated States of Micronesia [FSM], Northern Mariana Islands, Marshall Islands [RMI], Republic of Palau, American Samoa, basinwide), January 2018 was drier than normal at Guam, Koror, Chuuk, Kapingamarangi, and Kosrae, and wetter than normal at Yap, Saipan, Lukonor, Pohnpei, Kwajalein, Majuro, and Pago Pago.
Rainfall amounts were below the minimum thresholds (4 or 8 inches) required to meet most monthly water needs at Guam, Rota, and Saipan (in the Marianas); Pingelap (in the FSM); and Jaluit, Utirik, and Wotje (in the RMI). January rainfall was above the monthly minimum thresholds at the rest of the regular reporting stations in Micronesia. The 4- and 8-inch thresholds are important because, if monthly precipitation falls below the threshold, then water shortages or drought become a concern.
Significant dryness developed in the northern Marshall Islands in December 2016, with 7 of the last 14 months each having less than 2 inches at Utirik, 11 had less than 8 inches, and 2 months were missing; that equates to just one month having more than 8 inches (November 2017 had 9.29 inches). At Wotje, 5 of the last 14 months had less than 2 inches each, and 11 had less than 8 inches, with only 3 (June, September, and November 2017) having more than 8 inches. Eight inches is the monthly minimum in the RMI. Jaluit recorded 10.46 inches of rain in November 2017, 9.30 inches in December, and 7.80 inches in January 2018, but still had the second driest March-January through July-January out of 33 years of data.
Dryness has developed in the last 3 months in the Marianas Islands. Guam had the driest January and November-January in their 1957-2018 record. Rota and Saipan have each had less than 4 inches (the monthly minimum in the Marianas) of rain for November and December 2017 and January 2018; March, April, and May 2017 were also each dry at Saipan. Each of the time periods from February-January through May-January, and August-January and September-January ranked as the second driest (out of 29 or 30 years of data) for Saipan. The National Weather Service office on Guam issued a Drought Information Statement on January 26, then revised it on February 8, warning of developing impacts from drought in the Marianas and northern Marshall Islands. Moderate drought impacts have developed on the Marianas, including browning vegetation and some grass fires, low streamflows on Guam, and some springs drying up on Saipan.
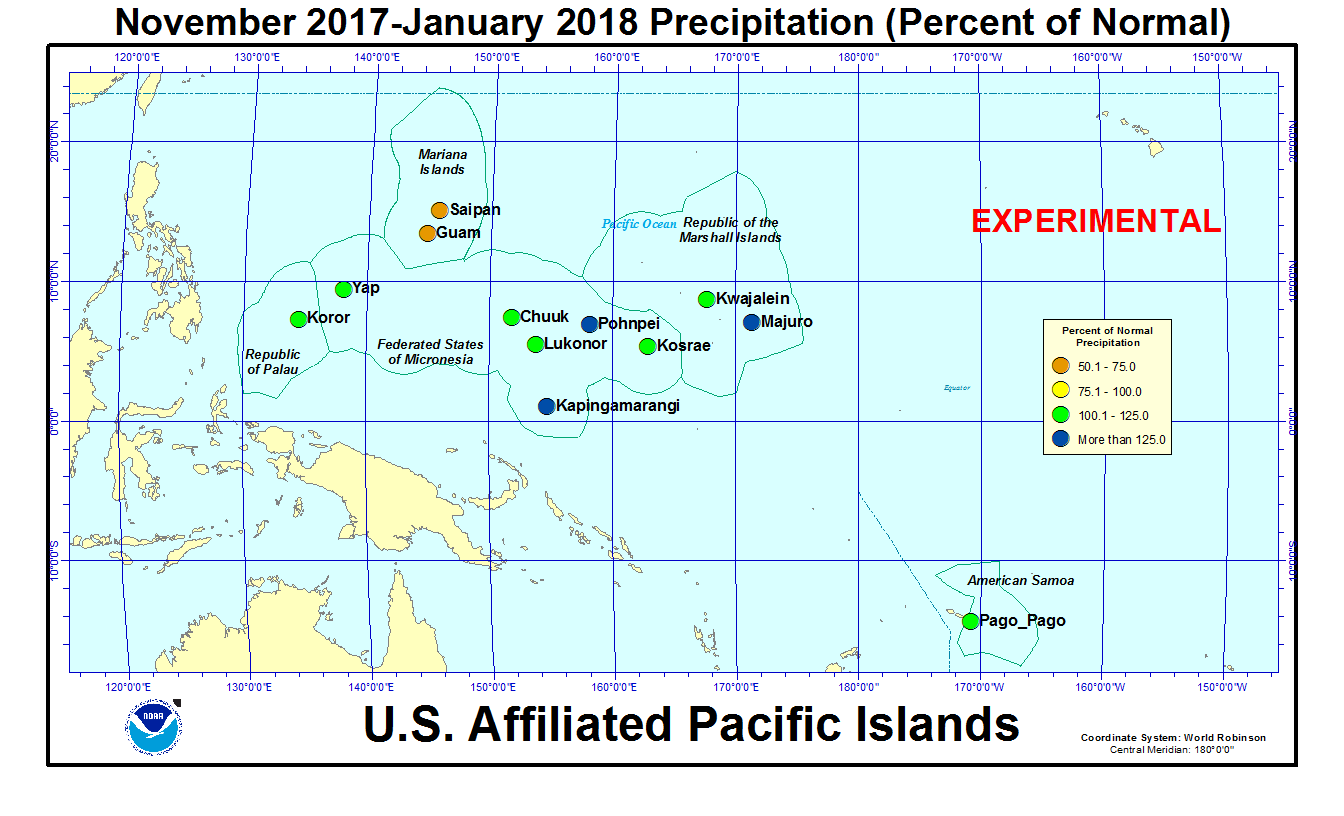
As measured by percent of normal precipitation, Guam has been drier than normal in the short term (January and the last 3 months [November 2017-January 2018]) as well as the long term (last 12 months [February 2017-January 2018]). Saipan was wetter than normal in January (but still had less than the monthly minimum, because the normals are so low during the dry season) but dry for the other 2 time periods. Kapingamarangi and Koror were drier than normal in January but wetter than normal in the other 2 time periods. Lukonor was near or wetter than normal in the short term but drier than normal in the long term. Chuuk was near normal for all 3 time periods. Kwajalein, Majuro, and Yap were wetter than normal for all 3 time periods. Kosrae, Pago Pago, and Pohnpei were near to wetter than normal for all 3 time periods.
| Station Name | Feb 2017 | Mar 2017 | Apr 2017 | May 2017 | Jun 2017 | Jul 2017 | Aug 2017 | Sep 2017 | Oct 2017 | Nov 2017 | Dec 2017 | Jan 2018 | Feb- Jan |
|---|---|---|---|---|---|---|---|---|---|---|---|---|---|
| Chuuk | 114% | 189% | 60% | 83% | 73% | 99% | 91% | 110% | 127% | 105% | 120% | 99% | 99% |
| Guam NAS | 167% | 256% | 340% | 56% | 136% | 97% | 66% | 118% | 161% | 57% | 88% | 23% | 93% |
| Kapingamarangi | 207% | 126% | 159% | 114% | 81% | 102% | 41% | 92% | 72% | 64% | 420% | 95% | 116% |
| Koror | 175% | 245% | 76% | 107% | 89% | 130% | 104% | 161% | 118% | 84% | 160% | 82% | 114% |
| Kosrae | 213% | 150% | 112% | 115% | 80% | 104% | 93% | 155% | 143% | 168% | 123% | 100% | 107% |
| Kwajalein | 212% | 46% | 65% | 77% | 156% | 70% | 64% | 205% | 88% | 83% | 71% | 458% | 110% |
| Lukonor | 66% | 160% | 85% | 80% | 60% | 103% | 63% | 84% | 116% | 136% | 70% | 129% | 82% |
| Majuro | 138% | 199% | 110% | 49% | 118% | 112% | 111% | 187% | 143% | 76% | 172% | 204% | 129% |
| Pago Pago | 153% | 52% | 87% | 240% | 93% | 84% | 145% | 96% | 217% | 127% | 94% | 115% | 111% |
| Pohnpei | 71% | 115% | 96% | 92% | 141% | 113% | 55% | 122% | 81% | 95% | 130% | 167% | 104% |
| Saipan | 199% | 108% | 115% | 66% | 128% | 72% | 65% | 84% | 66% | 62% | 60% | 117% | 79% |
| Yap | 370% | 205% | 110% | 69% | 68% | 121% | 55% | 93% | 156% | 106% | 132% | 182% | 115% |
| Station Name | Feb 2017 | Mar 2017 | Apr 2017 | May 2017 | Jun 2017 | Jul 2017 | Aug 2017 | Sep 2017 | Oct 2017 | Nov 2017 | Dec 2017 | Jan 2018 | Feb- Jan |
|---|---|---|---|---|---|---|---|---|---|---|---|---|---|
| Chuuk | 8.27" | 15.74" | 7.51" | 9.40" | 8.50" | 11.86" | 11.65" | 12.92" | 14.64" | 11.15" | 13.52" | 10.01" | 135.17" |
| Guam NAS | 5.06" | 5.30" | 8.60" | 1.89" | 8.40" | 9.86" | 9.73" | 14.92" | 18.47" | 4.23" | 4.49" | 0.94" | 91.89" |
| Kapingamarangi | 19.18" | 14.44" | 21.70" | 13.75" | 11.15" | 14.47" | 3.35" | 9.13" | 5.93" | 5.95" | 41.30" | 8.71" | 169.06" |
| Koror | 14.99" | 18.26" | 5.54" | 12.61" | 15.53" | 24.14" | 13.98" | 18.90" | 14.03" | 9.55" | 17.89" | 8.38" | 173.8" |
| Kosrae | 27.51" | 24.16" | 19.62" | 20.34" | 11.73" | 15.57" | 13.23" | 22.02" | 15.65" | 23.21" | 19.85" | 16.62" | 229.51" |
| Kwajalein | 5.60" | 1.07" | 3.44" | 5.20" | 10.80" | 6.91" | 6.28" | 22.06" | 9.83" | 9.40" | 4.72" | 14.46" | 99.77" |
| Lukonor | 5.90" | 14.83" | 9.61" | 9.41" | 6.97" | 16.47" | 8.88" | 8.51" | 13.10" | 12.38" | 7.90" | 10.83" | 124.79" |
| Majuro | 9.50" | 13.07" | 10.36" | 4.93" | 13.03" | 12.52" | 13.00" | 20.93" | 18.21" | 10.27" | 19.59" | 15.76" | 161.17" |
| Pago Pago | 18.32" | 5.60" | 8.14" | 23.23" | 4.94" | 4.66" | 7.78" | 6.26" | 20.11" | 12.89" | 12.06" | 15.37" | 139.36" |
| Pohnpei | 6.76" | 15.16" | 17.68" | 18.45" | 20.85" | 17.45" | 7.82" | 15.27" | 12.31" | 14.13" | 20.86" | 22.03" | 188.77" |
| Saipan | 5.15" | 2.04" | 3.02" | 1.58" | 4.63" | 6.45" | 8.59" | 8.47" | 7.01" | 3.48" | 2.31" | 2.97" | 55.7" |
| Yap | 19.19" | 9.35" | 6.19" | 5.40" | 8.16" | 18.27" | 8.20" | 12.59" | 18.99" | 9.40" | 11.27" | 11.64" | 138.65" |
| Station Name | Feb 2017 | Mar 2017 | Apr 2017 | May 2017 | Jun 2017 | Jul 2017 | Aug 2017 | Sep 2017 | Oct 2017 | Nov 2017 | Dec 2017 | Jan 2018 | Feb- Jan |
|---|---|---|---|---|---|---|---|---|---|---|---|---|---|
| Chuuk | 7.25" | 8.32" | 12.47" | 11.30" | 11.66" | 11.98" | 12.86" | 11.71" | 11.51" | 10.61" | 11.25" | 10.10" | 136.77" |
| Guam NAS | 3.03" | 2.07" | 2.53" | 3.40" | 6.18" | 10.14" | 14.74" | 12.66" | 11.44" | 7.38" | 5.11" | 4.01" | 99.09" |
| Kapingamarangi | 9.27" | 11.43" | 13.64" | 12.08" | 13.78" | 14.15" | 8.13" | 9.93" | 8.19" | 9.27" | 9.84" | 9.15" | 145.85" |
| Koror | 8.56" | 7.44" | 7.32" | 11.83" | 17.48" | 18.53" | 13.50" | 11.77" | 11.84" | 11.39" | 11.16" | 10.18" | 152.90" |
| Kosrae | 12.93" | 16.06" | 17.51" | 17.75" | 14.64" | 14.91" | 14.22" | 14.22" | 10.94" | 13.83" | 16.11" | 16.67" | 213.87" |
| Kwajalein | 2.64" | 2.35" | 5.26" | 6.72" | 6.93" | 9.87" | 9.74" | 10.74" | 11.18" | 11.28" | 6.66" | 3.16" | 90.41" |
| Lukonor | 8.93" | 9.26" | 11.31" | 11.69" | 11.65" | 15.93" | 14.04" | 10.15" | 11.32" | 9.08" | 11.27" | 8.41" | 151.36" |
| Majuro | 6.88" | 6.58" | 9.42" | 10.11" | 11.01" | 11.17" | 11.69" | 11.17" | 12.73" | 13.44" | 11.39" | 7.74" | 125.25" |
| Pago Pago | 12.00" | 10.68" | 9.39" | 9.66" | 5.33" | 5.55" | 5.38" | 6.53" | 9.26" | 10.14" | 12.84" | 13.34" | 125.57" |
| Pohnpei | 9.55" | 13.17" | 18.41" | 19.96" | 14.81" | 15.43" | 14.26" | 12.55" | 15.27" | 14.83" | 16.08" | 13.18" | 182.36" |
| Saipan | 2.59" | 1.89" | 2.63" | 2.38" | 3.62" | 8.91" | 13.13" | 10.09" | 10.62" | 5.61" | 3.85" | 2.53" | 70.25" |
| Yap | 5.19" | 4.56" | 5.63" | 7.85" | 12.04" | 15.08" | 14.82" | 13.50" | 12.18" | 8.83" | 8.51" | 6.39" | 120.31" |
The following analysis of historical data for the USAPI stations in the Global Historical Climatology Network-Daily (GHCN-D) dataset, augmented with fill-in data from the 1981-2010 Normals, helps put the current data into historical perspective by computing ranks based on the period of record. The table below lists the precipitation ranks for January 2018, August 2017-January 2018 (last 6 months), and February 2017-January 2018 (the last 12 months). Some stations have a long period of record and their dataset is fairly complete, while other stations have a shorter period of record and the dataset has some missing data.
Rank of 1 = driest.
| Station | Jan 2018 Rank |
Jan No. of Years |
Aug 2017- Jan 2018 Rank |
Aug- Jan No. of Years |
Feb 2017- Jan 2018 Rank |
Feb- Jan No. of Years |
Period of Record |
| Jaluit | 16 | 35 | 3 | 33 | 5 | 33 | 1981-2018 |
| Koror | 30 | 67 | 46 | 67 | 60 | 66 | 1951-2018 |
| Woleai | 34 | 36 | 12 | 28 | 10 | 22 | 1968-2018 |
| Yap | 53 | 67 | 44 | 67 | 53 | 66 | 1951-2018 |
| Majuro | 58 | 64 | 63 | 64 | 57 | 63 | 1954-2018 |
| Mili | 24 | 34 | MSG | 31 | MSG | 31 | 1981-2018 |
| Ulithi | 30 | 35 | 30 | 34 | MSG | 33 | 1981-2018 |
| Ailinglapalap | 32 | 35 | 11 | 32 | 11 | 32 | 1981-2018 |
| Kosrae | 25 | 48 | 28 | 33 | 23 | 28 | 1954-2018 |
| Lukonor | 21 | 34 | 11 | 21 | 9 | 21 | 1981-2018 |
| Saipan | 20 | 38 | 2 | 30 | 2 | 29 | 1981-2018 |
| Pohnpei | 63 | 67 | 40 | 67 | 37 | 66 | 1951-2018 |
| Kwajalein | 66 | 66 | 59 | 66 | 36 | 65 | 1952-2018 |
| Kapingamarangi | 11 | 28 | 12 | 16 | 12 | 13 | 1962-2018 |
| Chuuk | 39 | 67 | 35 | 67 | 26 | 66 | 1951-2018 |
| Guam | 1 | 61 | 9 | 61 | 21 | 60 | 1957-2018 |
| Nukuoro | 15 | 36 | 33 | 34 | 33 | 33 | 1981-2018 |
| Pago Pago | 31 | 52 | 37 | 52 | 41 | 51 | 1966-2018 |
| Wotje | 33 | 35 | 19 | 32 | 27 | 32 | 1981-2018 |
| Utirik | 14 | 20 | 4 | 8 | MSG | 3 | 1985-2018 |
[top]
State/Regional/National Moisture Status
A detailed review of drought and moisture conditions is available for all contiguous U.S. states, the nine standard regions, and the nation (contiguous U.S.):
| northeast u. s. | east north central u. s. | central u. s. |
| southeast u. s. | west north central u. s. | south u. s. |
| southwest u. s. | northwest u. s. | west u. s. |
| Contiguous United States |
[top]
Contacts & Questions