|
Contents Of This Report: |

|
Please note that the values presented in this report are based on preliminary data. They will change when the final data are processed, but will not be replaced on these pages.
National Drought Overview
|
|
[top]
Detailed Drought Discussion
Overview

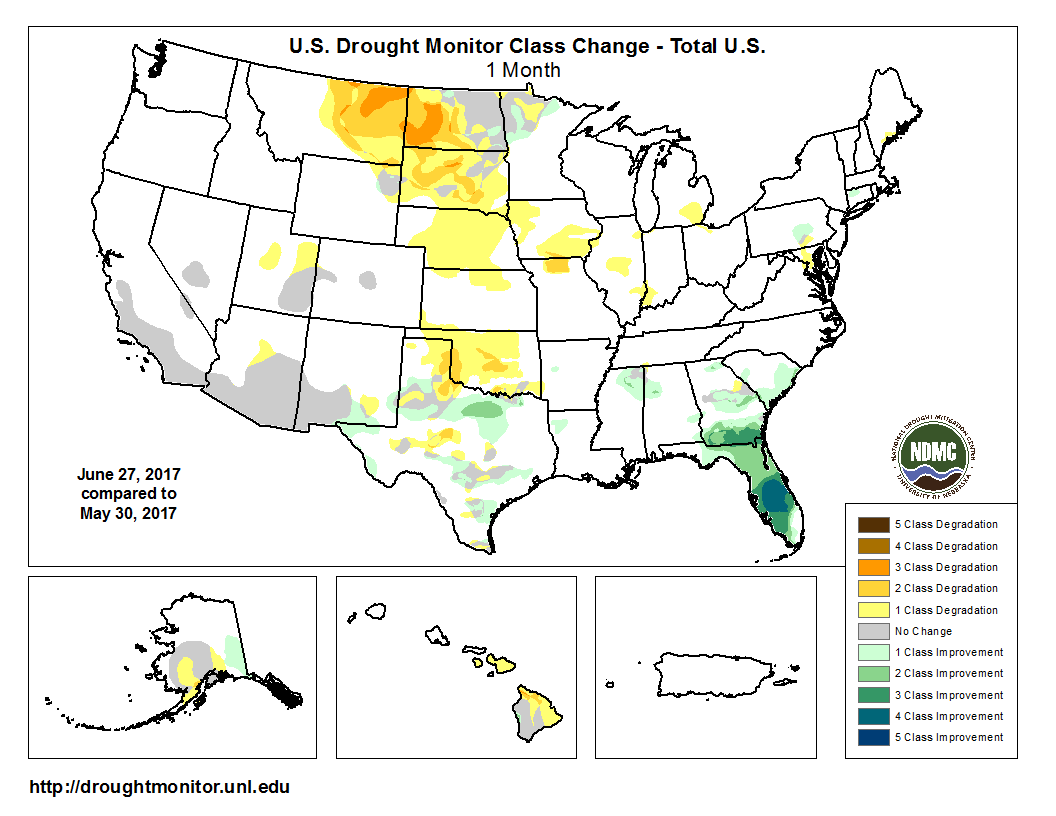
The U.S. Drought Monitor drought map valid June 27, 2017.
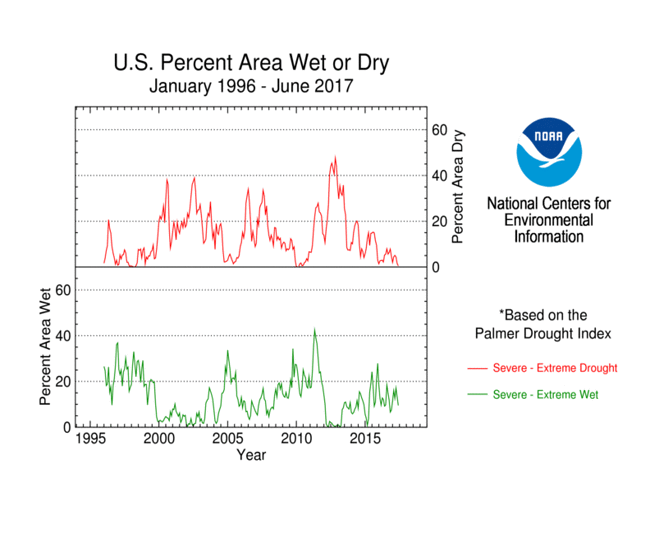
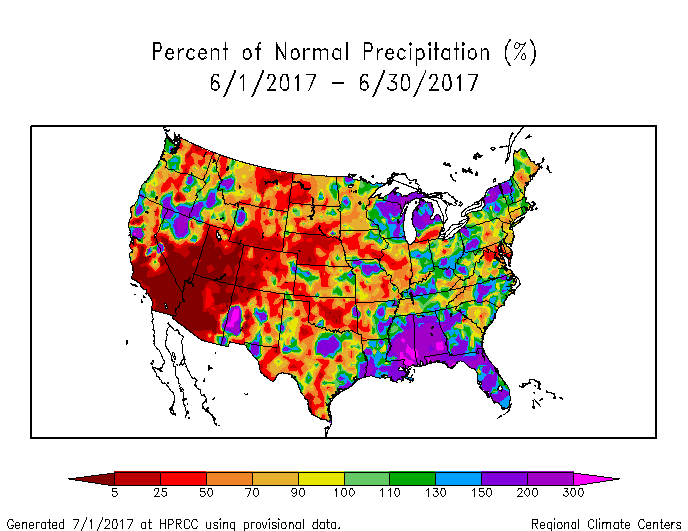
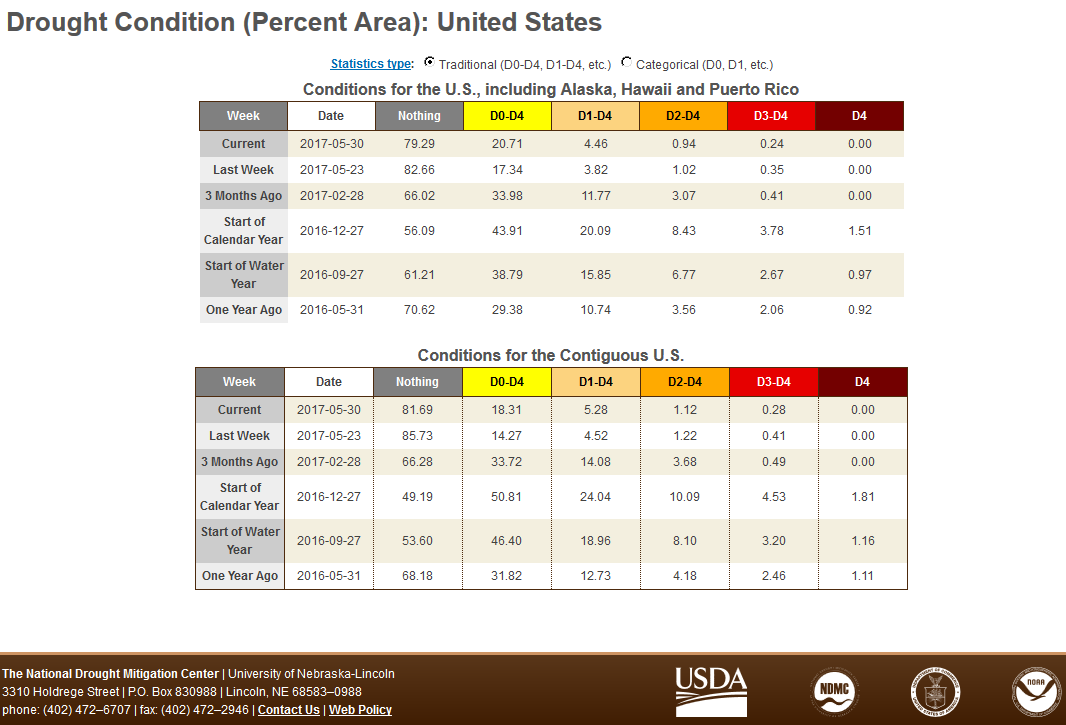
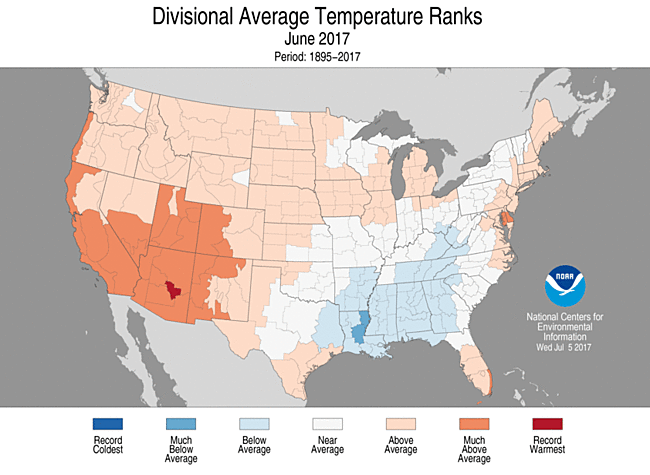
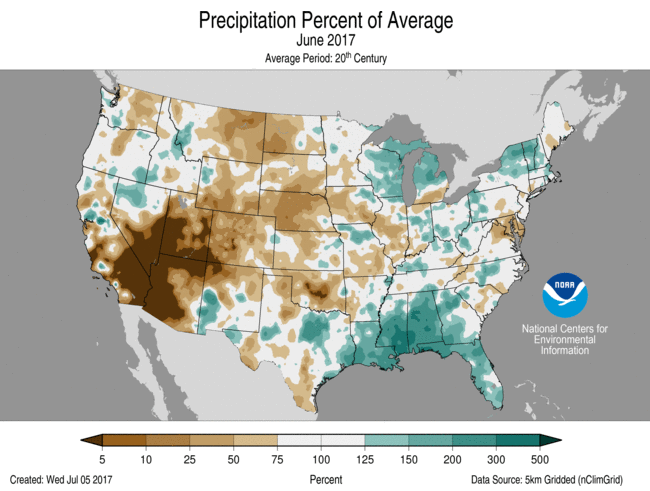
During June 2017, several troughs and closed lows moved across the CONUS in the upper-level circulation, with the overall monthly pattern consisting of an enhanced ridge across the West and an enhanced trough across the East. The ridge resulted in warmer- and drier-than-normal weather across the West and Great Plains. Fronts and surface lows moving in the eastern trough brought above-normal precipitation and near- to cooler-than-normal weather to much of the country east of the Mississippi River. The remnants of Tropical Storm Cindy contributed to the above-normal precipitation, especially in the South. The cloudiness, rain, and cold fronts contributed to a cooler-than-normal month in the southern states. Areas of drought and abnormal dryness contracted in the Southeast and parts of the southern Plains but expanded across the northern Plains and parts of the southern Plains and West. Drought and abnormal dryness expanded in Hawaii, while abnormal dryness contracted but moderate drought was introduced in Alaska. Puerto Rico remained free of drought and abnormal dryness. The expansion of drought was greater than the contraction, with the USDM-based national moderate-to-exceptional drought footprint across the CONUS increasing from 5.3 percent at the end of May to 8.0 percent at the end of June (from 4.5 percent to 7.8 percent for all of the U.S.). According to the Palmer Drought Index, which goes back to the beginning of the 20th century, about 9.4 percent of the CONUS was in moderate to extreme drought at the end of June, an increase from last month's 5.3 percent.

Drought conditions at the end of the month, as depicted on the June 27th, 2017 USDM map, included the following CONUS core drought and abnormally dry areas:
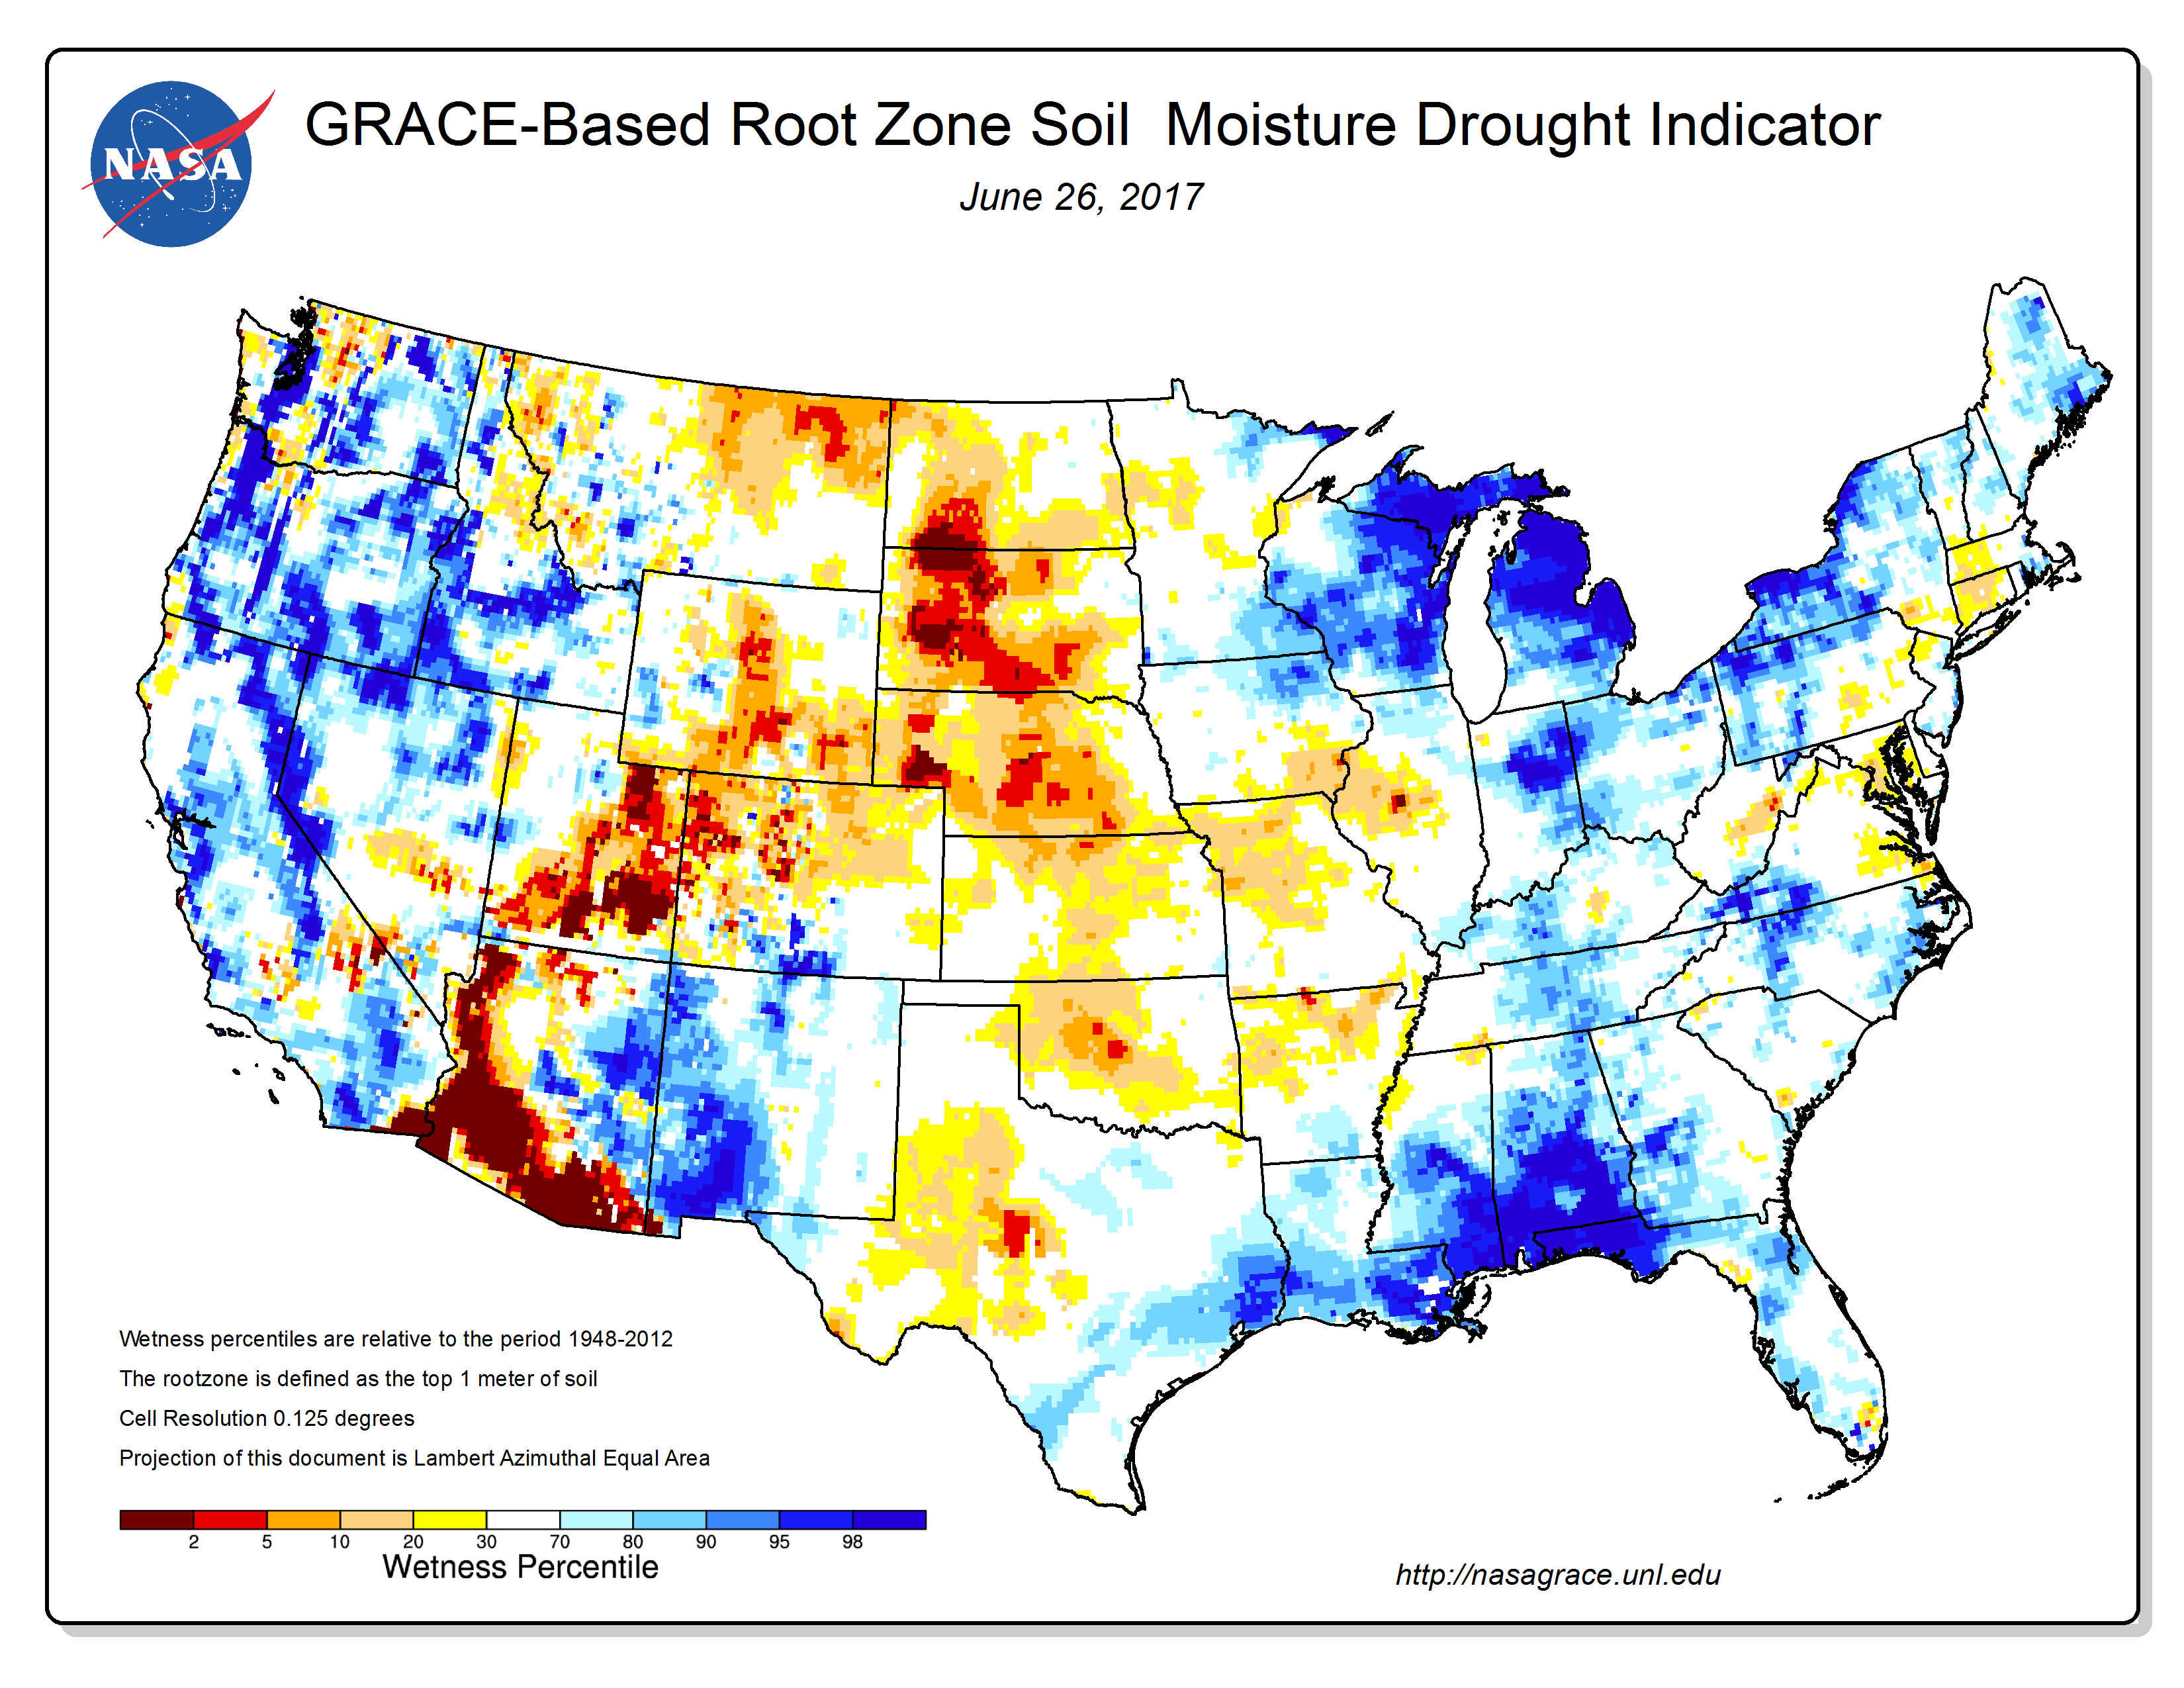
- Abnormal dryness (D0) and moderate (D1) drought expanded, and severe (D2) to extreme (D3) drought were introduced, in the northern Plains — The worsening conditions were reflected in a number of drought indices and indicators, including increased evapotranspiration (Evaporative Drought Demand Index [EDDI], Evaporative Stress Index [ESI]), low streamflow, and decreasing soil moisture (NLDAS top soil and total soil moisture, GRACE root zone and surface soil moisture, CPC model, Leaky bucket model, VIC model, SMOS satellite-based analysis). June 26th U.S. Department of Agriculture (USDA) reports of soil moisture conditions revealed very dry conditions in the northern Plains, and conditions worsened in the last four days of June and first couple days of July. According to July 2nd USDA reports, 80 percent of the topsoil moisture and 77 percent of the subsoil moisture were short to very short (dry to very dry) in Montana, while the statistics were 54 percent for topsoil and 45 percent for subsoil in North Dakota, 68 percent for topsoil and 63 percent for subsoil in South Dakota, 51 percent for topsoil and 44 percent for subsoil in Nebraska, and 44 percent for both topsoil and subsoil in Wyoming. Moisture stress on crops, and on vegetation in general (Vegetation Drought Response Index [VegDRI]), intensified as the month wore on (Crop Moisture Index [CMI] for weeks 1, 2, 3, 4, 5). The USDA reports indicated that pasture and rangeland were in poor to very poor condition for 42 percent of Montana, 63 percent of North Dakota, and 57 percent of South Dakota. For crops in South Dakota, 22 percent of corn, 23 percent of soybeans, 63 percent of winter wheat, and 65 percent of spring wheat were rated in poor to very poor condition.
- Drought and abnormal dryness expanded in parts of the southern Plains (especially Oklahoma) and contracted in others (parts of Texas) — This was reflected in low streamflow and decreasing soil moisture (NLDAS top soil and total soil moisture, GRACE root zone and surface soil moisture, Leaky bucket model, VIC model, SMOS satellite-based analysis). According to July 2nd USDA reports, 46 percent of the topsoil moisture and 41 percent of the subsoil moisture were short to very short in Oklahoma, while the statistics were 39 percent for topsoil and 40 percent for subsoil in Texas.
- Moderate to severe drought and abnormal dryness continued in parts of the Southwest — This was reflected in low streamflow, low groundwater (GRACE observations), and decreasing soil moisture (NLDAS top soil and total soil moisture, GRACE root zone and surface soil moisture, Leaky bucket model, VIC model). According to July 2nd USDA reports, 65 percent of the topsoil moisture and 75 percent of the subsoil moisture were short to very short in California, while the statistics were 48 percent for topsoil and 61 percent for subsoil in New Mexico and 48 percent for topsoil in Utah. The USDA reports indicated that pasture and rangeland were in poor to very poor condition for 30 percent of California, 34 percent of Arizona, and 29 percent of New Mexico. Many large wildfires developed across the West as the month progressed (wildfire maps for June 2, 22, 29).
- Abnormally dry to moderate drought conditions expanded, and severe drought developed, in parts of Hawaii.
- Abnormal dryness persisted and moderate drought developed in parts of Alaska.
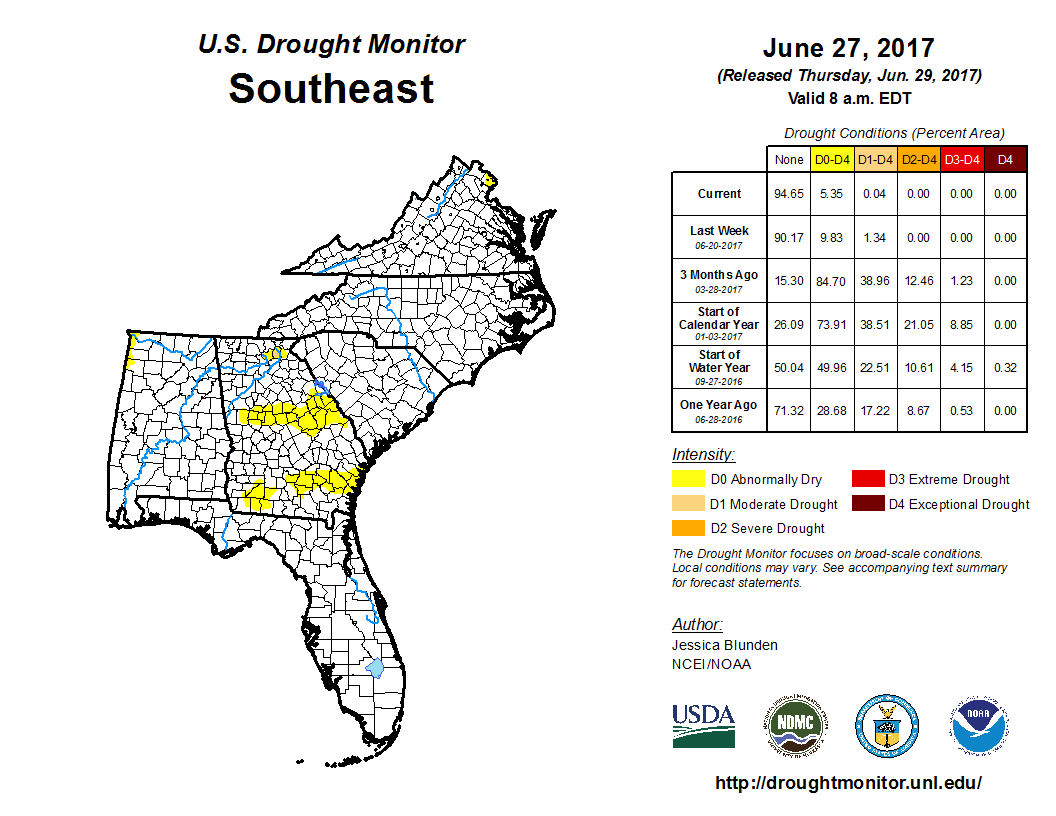
- Abnormally dry to moderate drought conditions lingered in parts of the Southeast, after significant contraction of drought due to above-normal precipitation of recent months, but developed in parts of the Midwest, and a small area of abnormally dry conditions was evident in the mid-Atlantic states. Although the USDM map showed only a small area of abnormally dry conditions, July 2nd USDA reports noted that 58 percent of the topsoil moisture and 51 percent of the subsoil moisture were short to very short in Maryland, while the statistics were 54 percent for topsoil and 34 percent for subsoil in Delaware.
![Evaporative Drought Demand Index [EDDI]](/monitoring-content/sotc/drought/2017/06/EDDI_01mn_20170625.png)
![Vegetation Drought Response Index [VegDRI]](/monitoring-content/sotc/drought/2017/06/VegDRI_eMODIS_wk27_Jul022017.png)
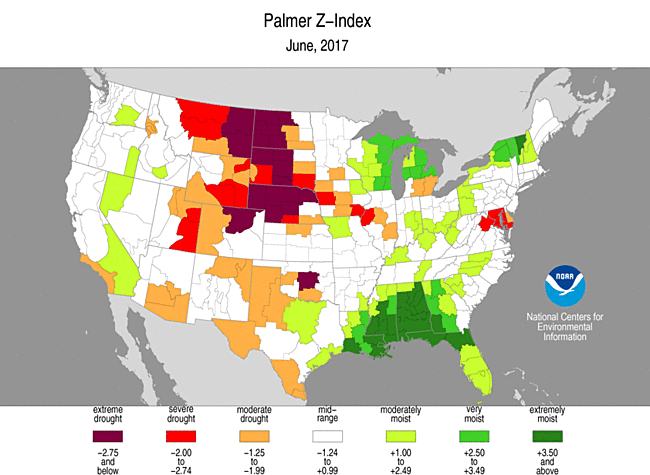
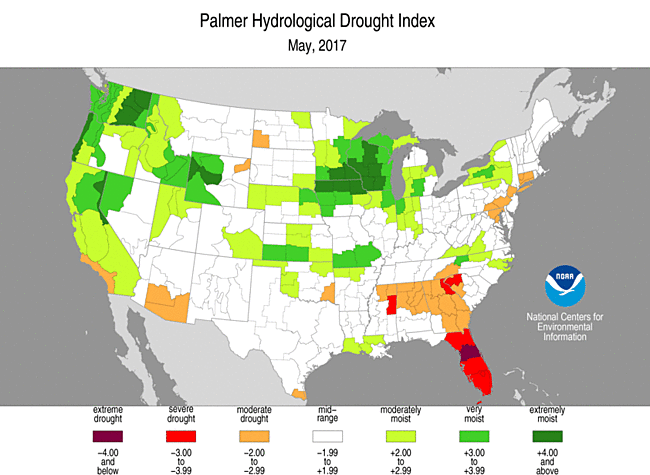
Palmer Drought Index
The Palmer drought indices measure the balance between moisture demand (evapotranspiration driven by temperature) and moisture supply (precipitation). The Palmer Z Index depicts moisture conditions for the current month, while the Palmer Hydrological Drought Index (PHDI) and Palmer Drought Severity Index (PDSI) depict the current month's cumulative moisture conditions integrated over the last several months. While both the PDSI and PHDI indices show long-term moisture conditions, the PDSI depicts meteorological drought while the PHDI depicts hydrological drought. The PDSI map shows less severe and extensive drought in parts of the northeastern and southeastern U.S. than the PHDI map because the meteorological conditions that produce drought and wet spell conditions are not as long-lasting as the hydrological impacts.
|
 |
Used together, the Palmer Z Index and PHDI maps show that short-term dry conditions occurred across much of the central to northern Plains, parts of the southern Plains and Southwest to central Rockies, and a small area of the Mid-Atlantic coastal area. This short-term dryness reduced long-term wet conditions in the central Plains, and expanded drought in parts of the Southwest, Mid-Atlantic, and especially northern Plains, compared to the end of May. Short-term wet conditions significantly reduced long-term drought conditions in the Southeast.
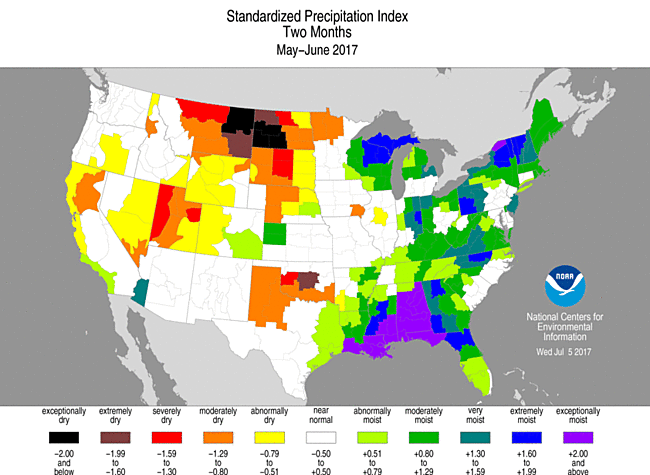
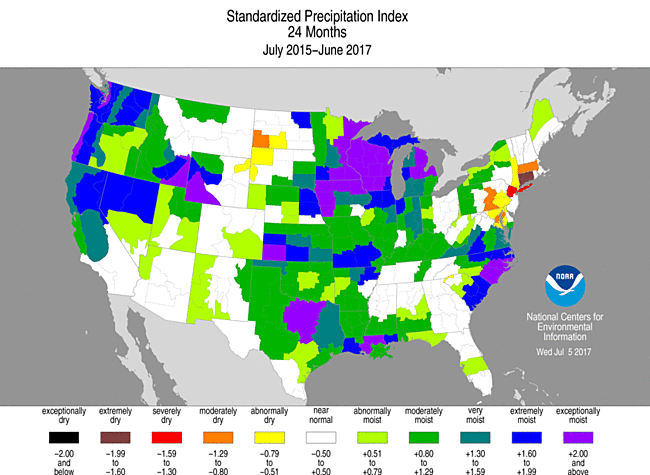
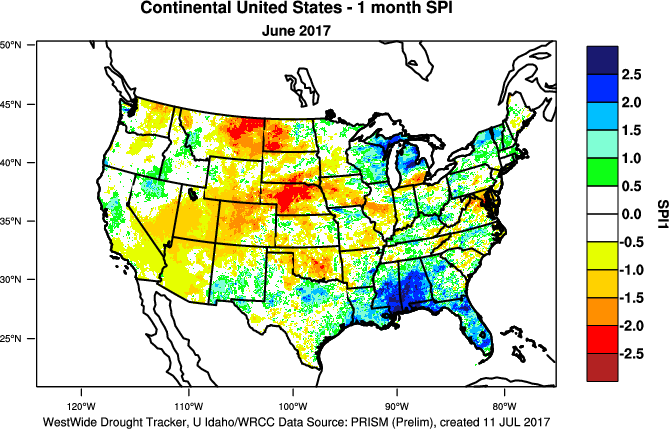
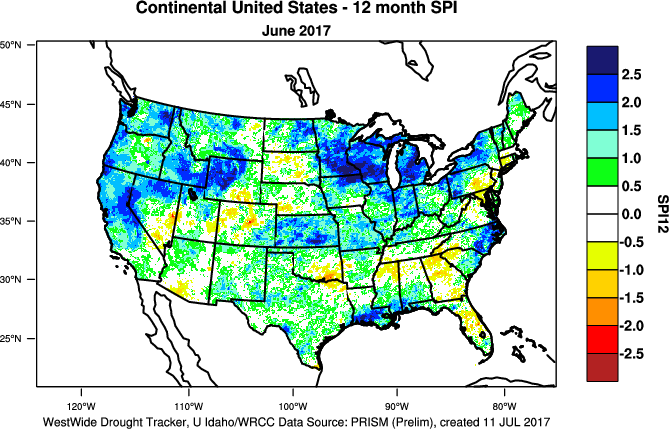
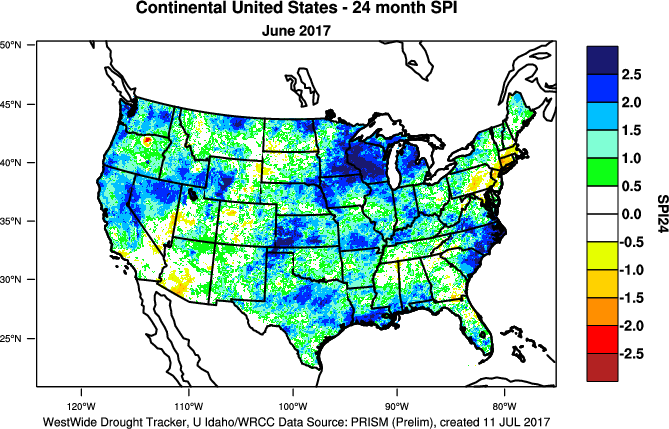
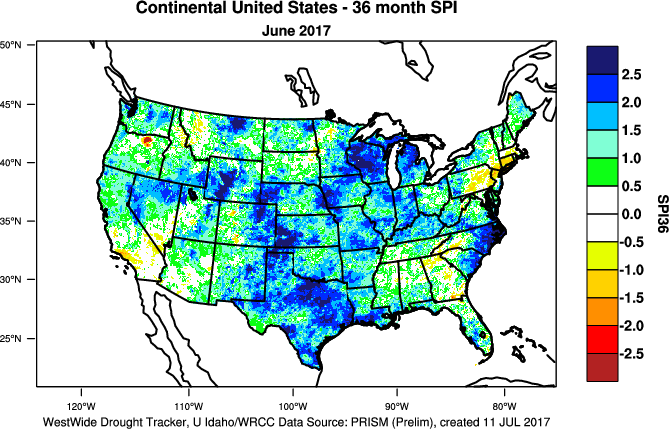
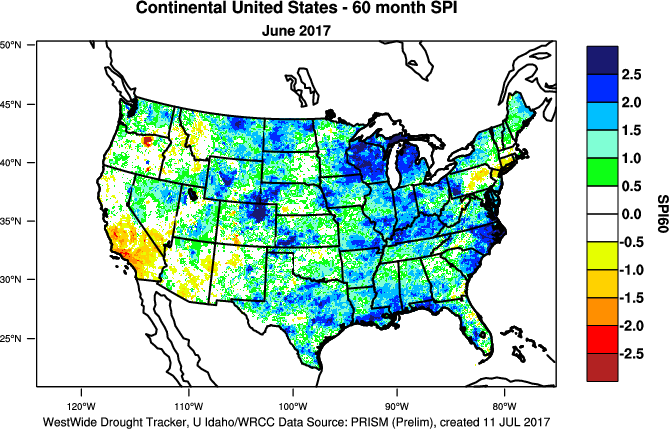
Standardized Precipitation Index
The Standardized Precipitation Index (SPI) measures moisture supply. The SPI maps here show the spatial extent of anomalously wet and dry areas at time scales ranging from 1 month to 24 months.
 |
 |
 |
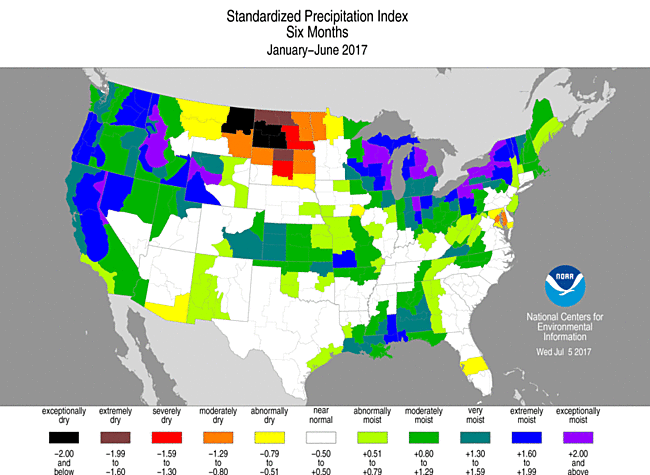
The SPI maps illustrate how moisture conditions have varied considerably through time and space over the last two years. June 2017 (the 1-month SPI map) showed contrasting areas of wetness and dryness. The dryness in the northern Plains at the 1-month time scale was a continuation of dryness which extended out to the 6-month time scale, with a few areas dry at the 9- to 24-month time scales. The dryness extended into the central and parts of the southern Plains at the 1- to 3-month time scales. Parts of the West (especially the Southwest) were dry at the 1- to 3-month time scales. The dryness in the Mid-Atlantic region was evident at the 1-month time scale but also at the 6- to 24-month time scales. Southern New England was wet at the short-term time scales, but dry on the 12- to 24-month maps. Wet conditions dominate in the Southeast for the last 1 to 6 months, but dryness is evident in some areas at the 9- to 12-month time scales. Wet conditions are widespread across the eastern CONUS from 2 to 6 months, the central CONUS from 3 to 24 months, and in the West from 6 to 24 months.
 |
 |
 |
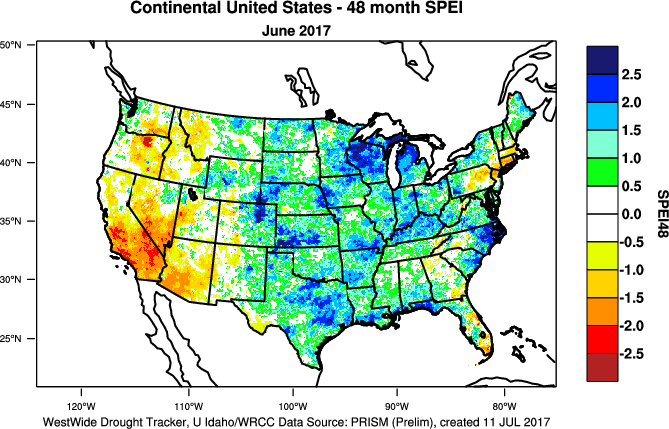
Standardized Precipitation Evapotranspiration Index
The SPI measures water supply (precipitation), while the SPEI (Standardized Precipitation Evapotranspiration Index) measures the combination of water supply (precipitation) and water demand (evapotranspiration as computed from temperature). Warmer temperatures tend to increase evapotranspiration, which generally makes droughts more intense.
 72-month SPEI for current month.
|
 72-month SPI for current month.
|
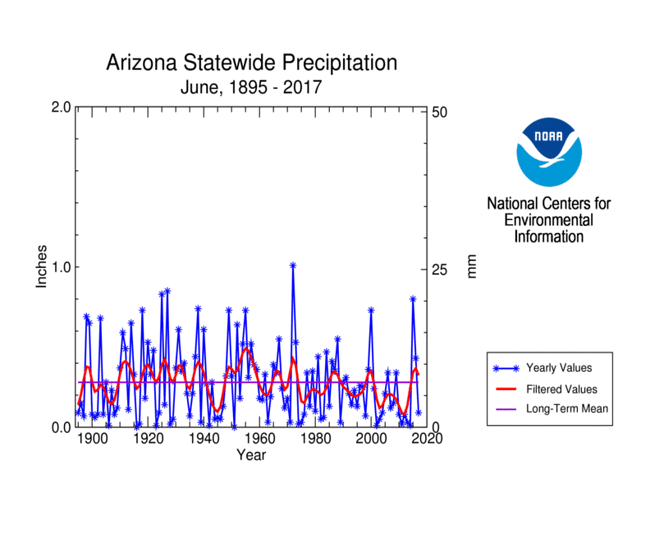
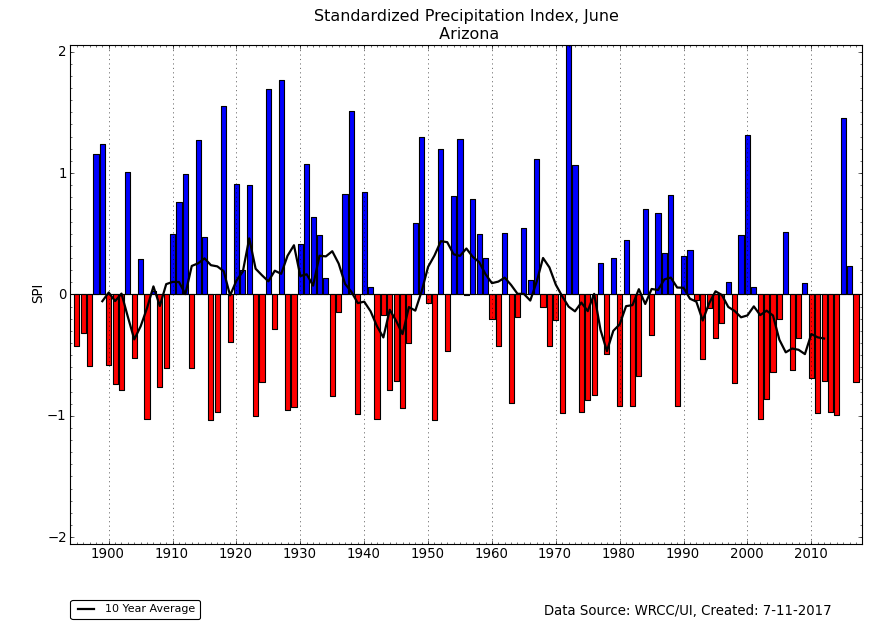
Temperatures during June 2017 were above normal across a large part of the country, but especially in the Southwest. Migrating air masses spread the temperature anomalies out more across the country during April-June, but unusually warm temperature anomalies dominated over the last 6 to 12 months. Warmer-than-normal temperatures worsen drought conditions where low precipitation occurs (SPEI maps for June and the last 12, 24, 36, 48, 60, 72 months) (SPI maps for June and the last 12, 24, 36, 48, 60, 72 months). This is especially evident for Arizona which had the 36th driest and second warmest June in the 1895-2017 record, resulting in the most severe 1-month SPEI for June (June 2013 almost tied June 2017) but an SPI that was nowhere near record low. It is also evident in the Southeast at 12 months, southern New England at 12 to 48 months, and Southwest (especially California) at 1 month and 12 to 72 months.
 72-month SPEI for California, June, 1895-2017.
|
 72-month SPI for California, June, 1895-2017.
|
In California, the last 12 months have been wet, ranking as the fifth wettest July-June on record, but most of the previous 15 years have been dry. The dryness has been compounded by persistent and unusually warmer-than-normal temperatures; this has been occurring for the last 35 years, but especially for the last three to four years when record to near-record warmth occurred. The heat has increased evapotranspiration and exacerbated drought conditions. While the 72-month SPI registered dryness, it was nowhere near record. However, the 72-month SPEI for the last 72 months was second driest on record; last year's 72-month SPEI was record dry.
Regional Discussion
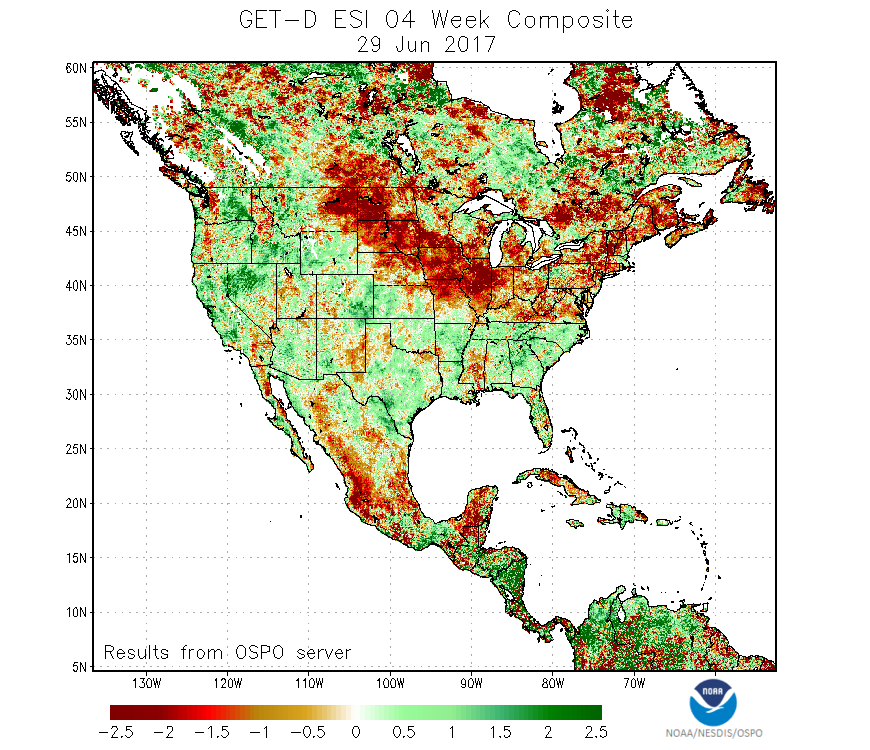 NOAA ESI map
|
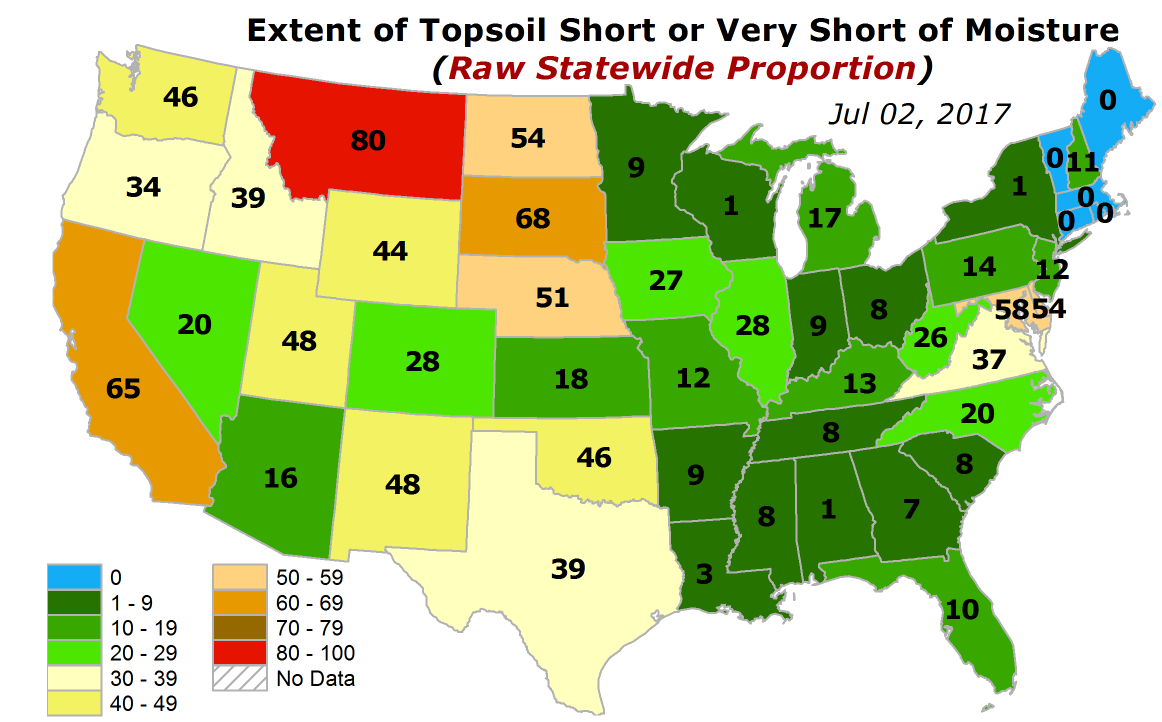 USDA soil moisture conditions
|
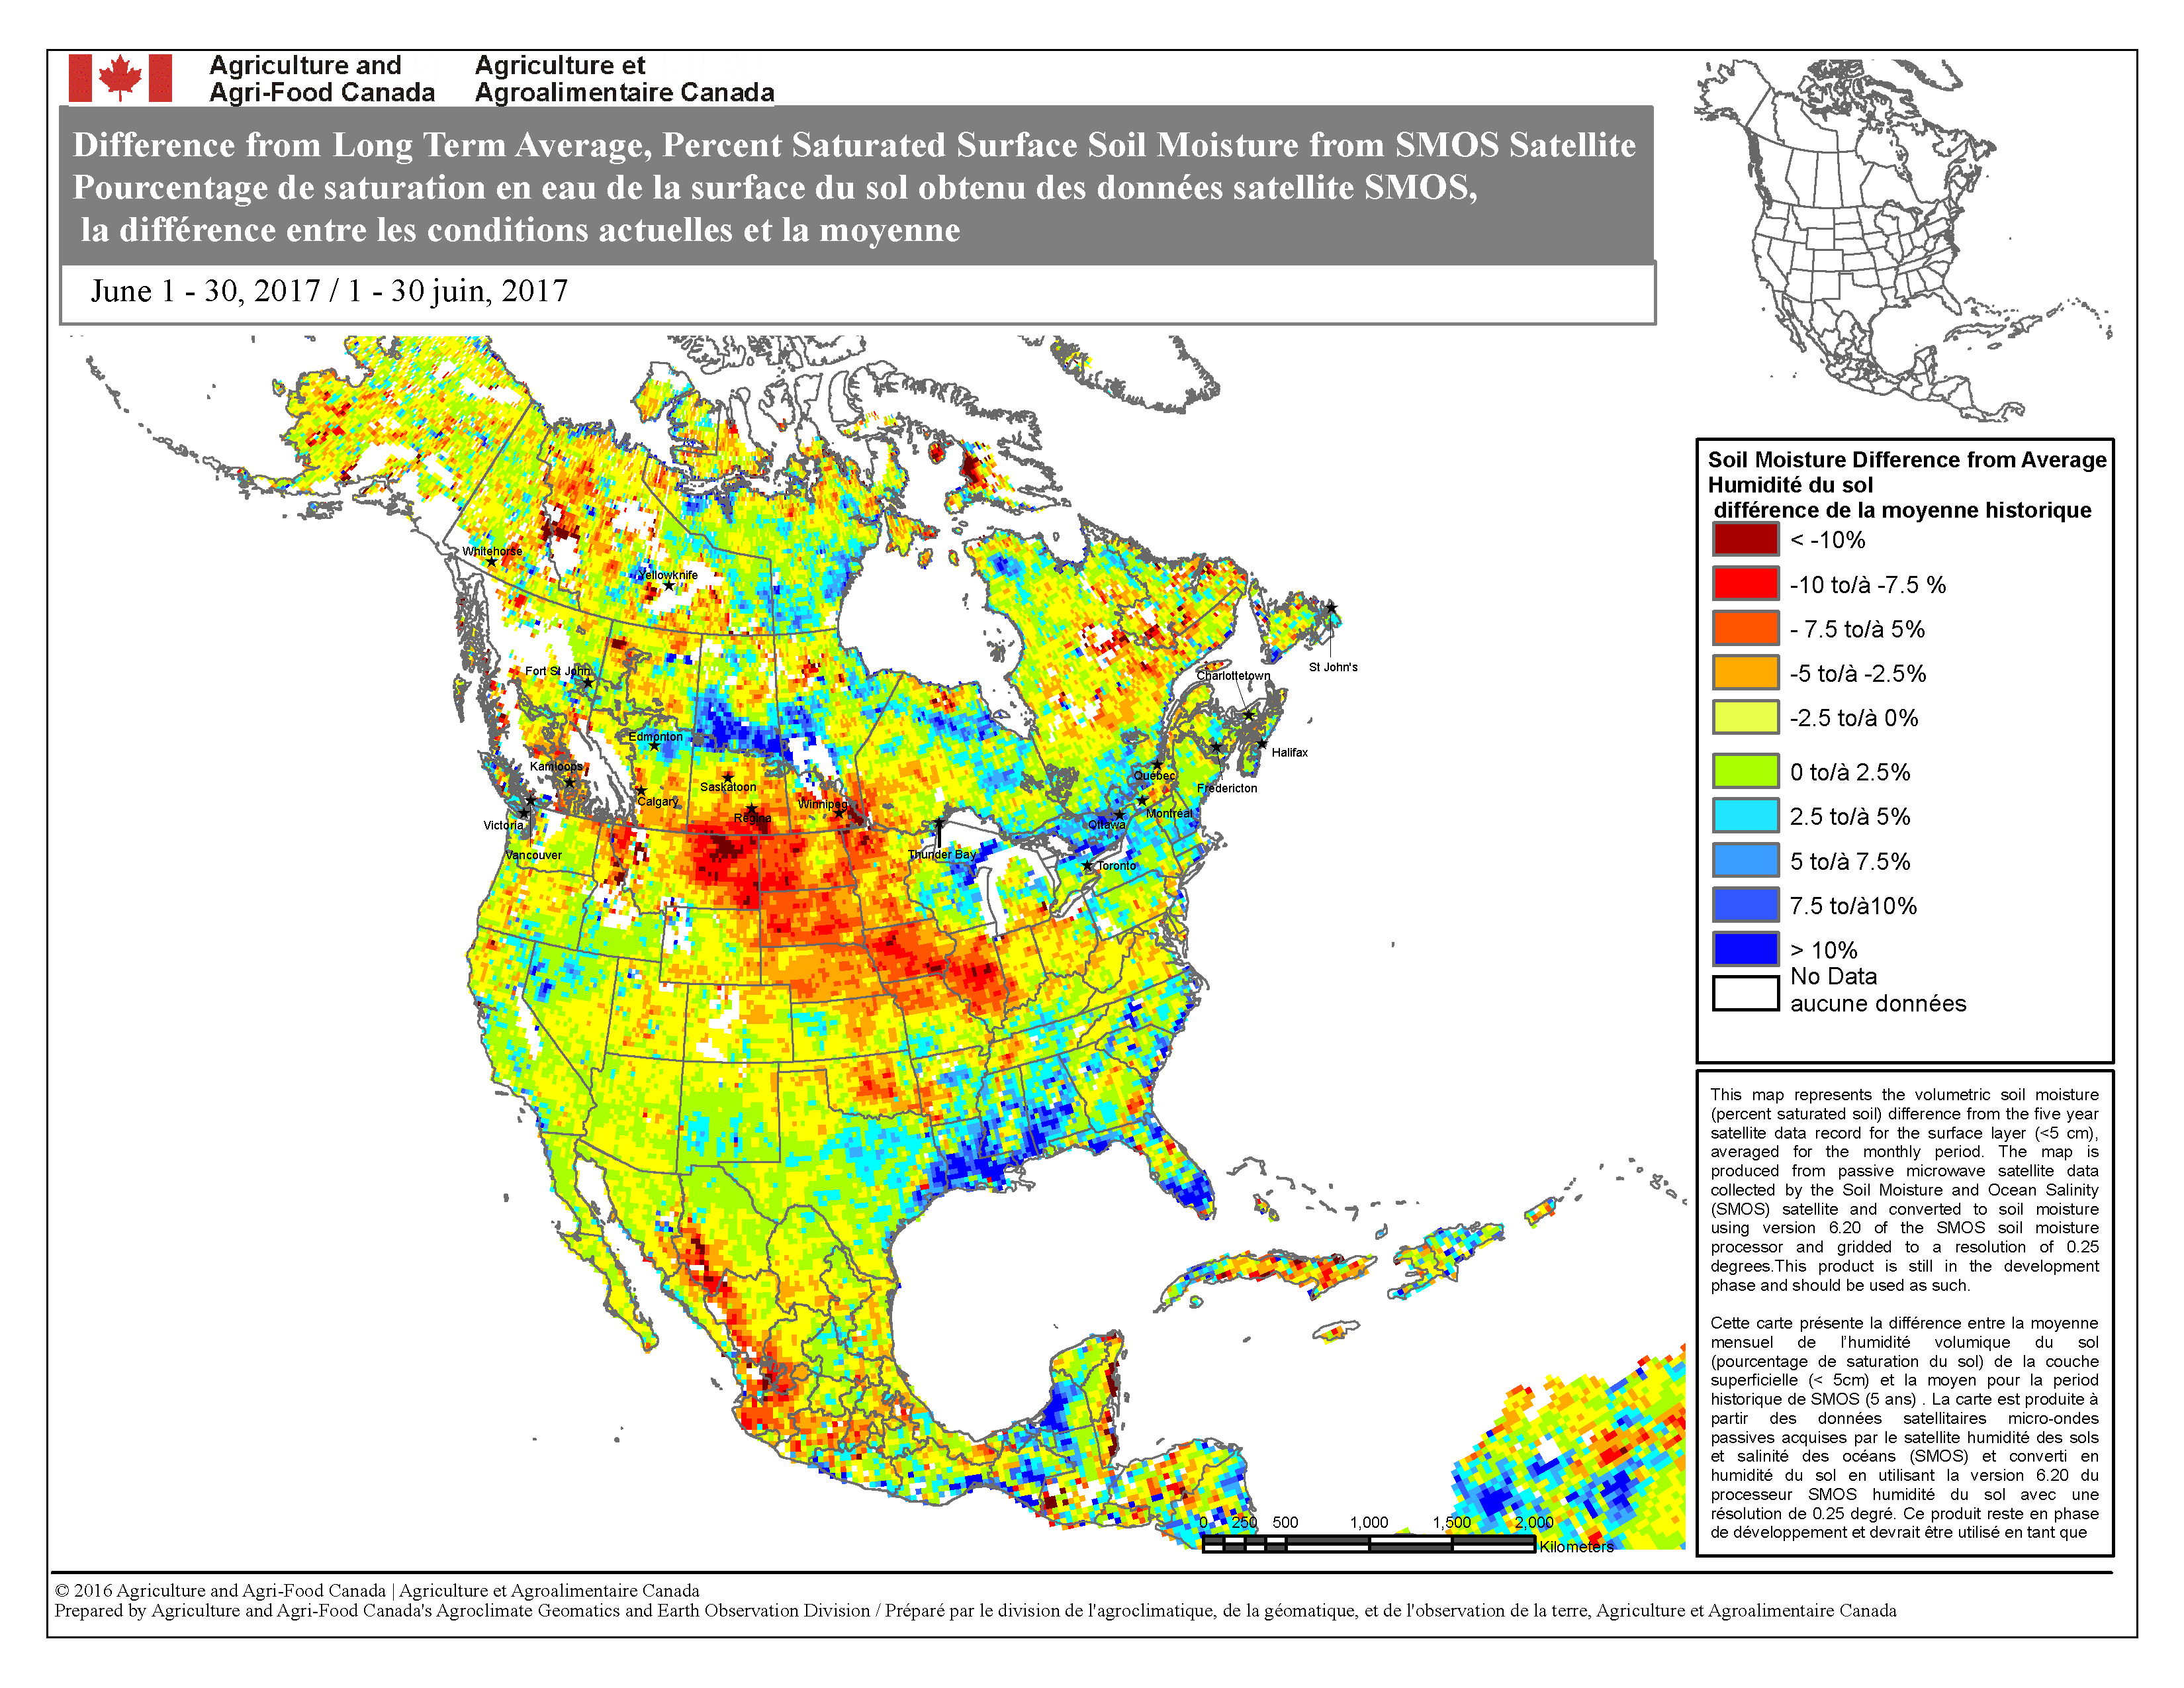 SMOS soil moisture percentiles
|
CONUS Agricultural & Hydrological Impacts:
Drought conditions at the end of June 2017 were reflected in a number of meteorological, hydrological, and agricultural indicators, both observed and modeled. These include: evapotranspiration (EDDI, ESI), streamflow, groundwater (GRACE observations), soil moisture (NLDAS top soil and total soil moisture, GRACE root zone and surface soil moisture, CPC model, Leaky bucket model, VIC model, SMOS satellite-based analysis), vegetation stress (Vegetation Drought Response Index [VegDRI]), and CMI (weeks 1, 2, 3, 4, 5). On a national scale, as of June 27th, 2017, very little of the agricultural areas of the CONUS were affected by drought — only eleven percent of hay acreage, eight percent of cattle inventory, three percent of corn production, four percent of soybean production, and seven percent of winter wheat production. But these were the same or higher than the values for the end of May, suggesting that conditions were getting a little worse. As noted by the USDA, only eight percent of the nation's corn crop, nine percent of soybeans, 17 percent of winter wheat, and 15 percent of the nation's pasture and rangeland were in poor to very poor condition, but 33 percent of the spring wheat was so rated. As seen earlier, conditions were more extreme on a statewide basis.

Hilo, Hawaii, precipitation, March-June, 1950-2017.
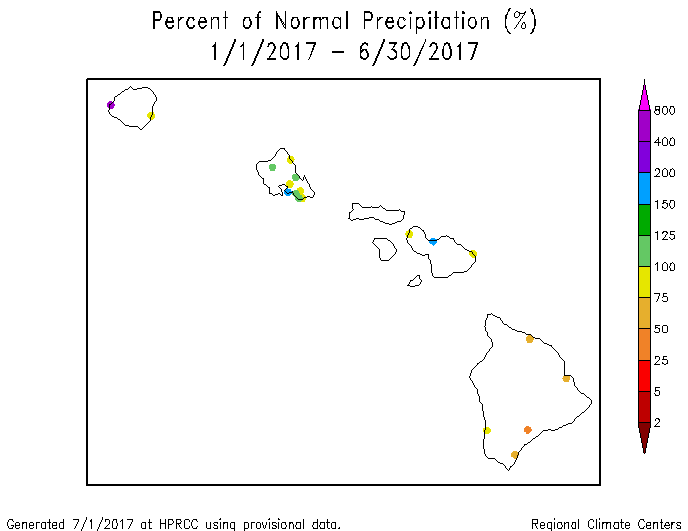
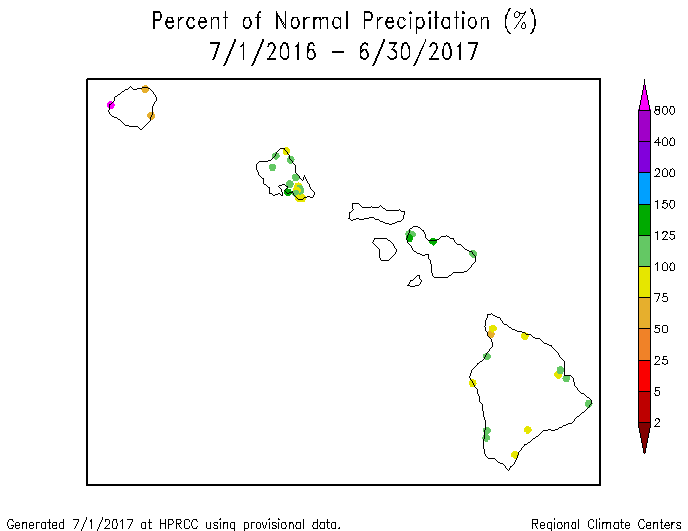
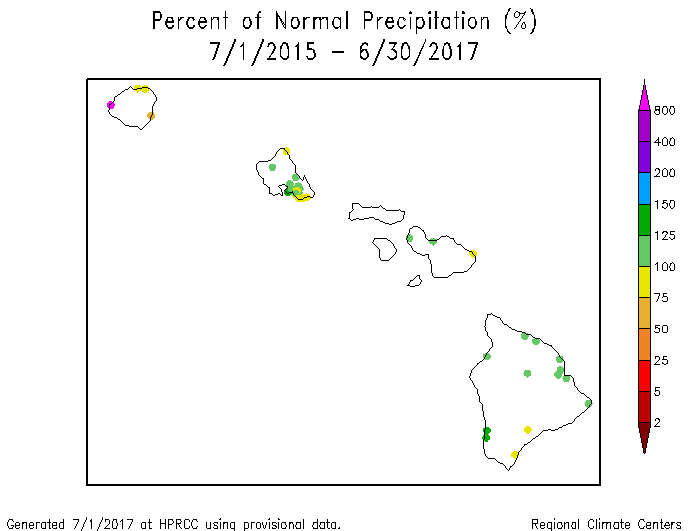
Hawaii: June 2017 had a mixed precipitation anomaly pattern across the Hawaiian Islands. Dryness was evident over the southern islands during the last 2 months. The Big Island was dry at the 3-month time scale. The last four months were dry, with Hilo having the third driest March-June in the 1950-2017 record. Drier-than-normal conditions tended to dominate the anomaly pattern for the last 6 and 9 months. A mixed anomaly pattern was evident at longer time scales (last 12, 24, 36 months). On the USDM map, abnormally dry and moderate drought conditions expanded and severe drought appeared this month; moderate drought expanded to cover about a third of the state on the June 27th, 2017 USDM map.

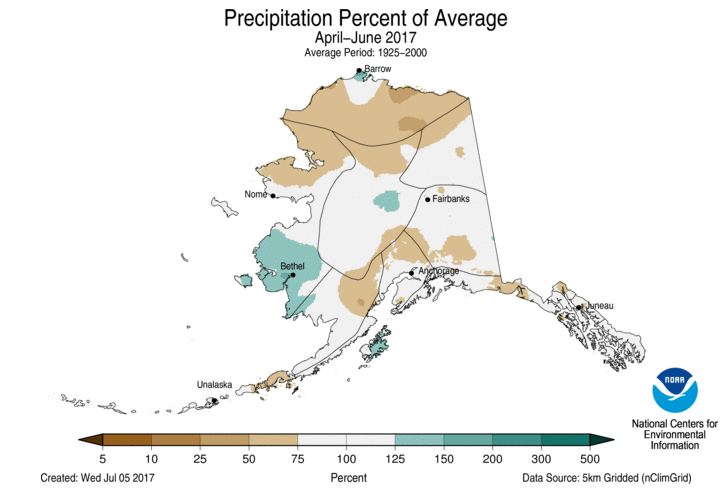
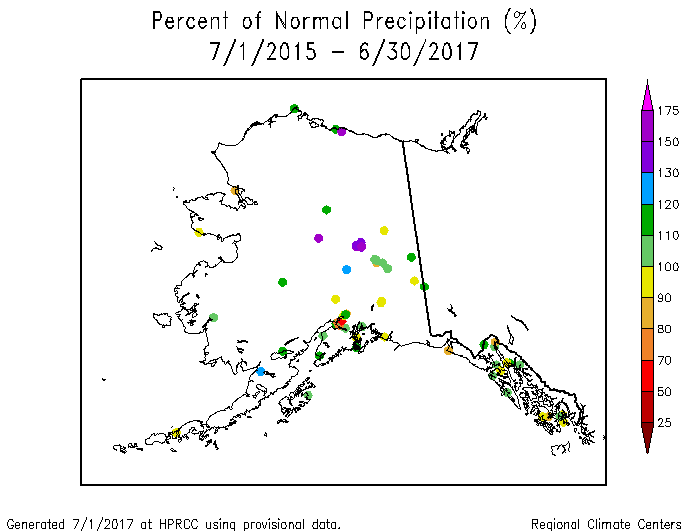
Alaska precipitation percentiles map, June 2017.
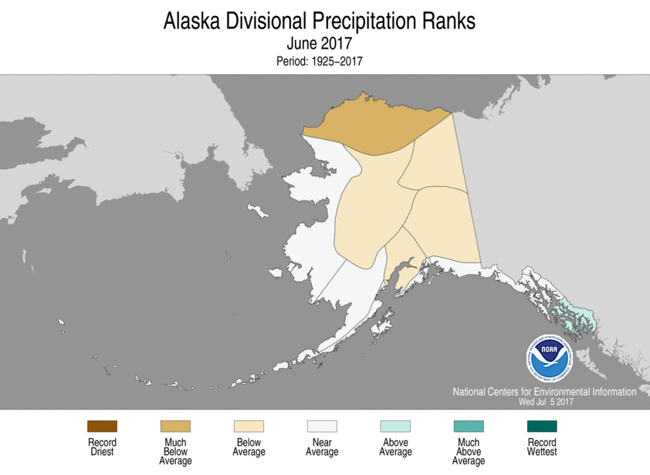
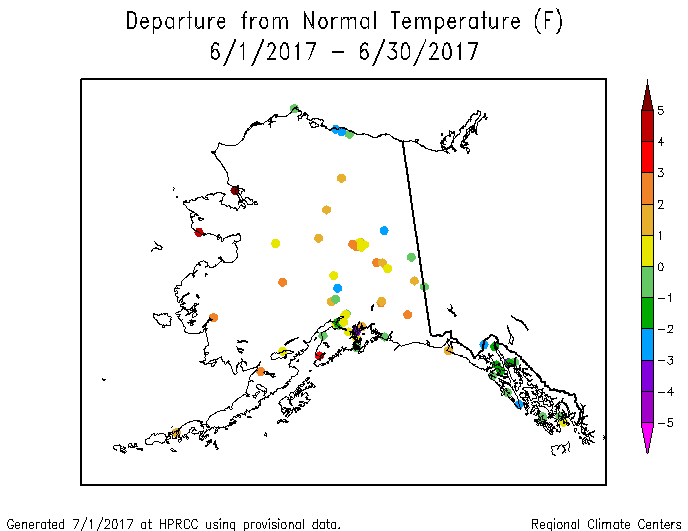
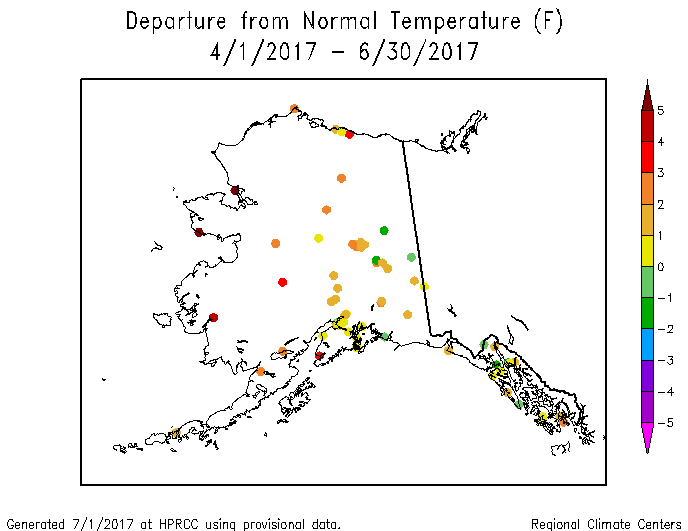
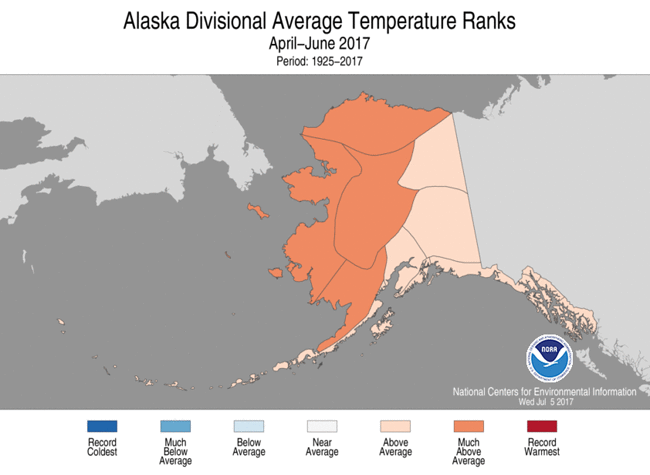
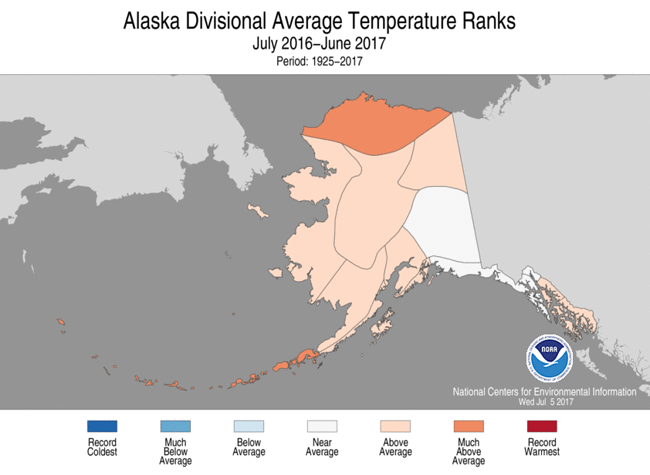
Alaska: June 2017 had a mixed precipitation anomaly pattern across Alaska on the high elevation (SNOTEL) station and low elevation station maps, but the pattern had more drier than normal areas on the climate division and gridded (percentiles, percent of normal) analyses. The pattern was mostly mixed for May-June, April-June (low elevation stations, climate divisions, gridded percentiles, gridded percent of normal), January-June (low elevation stations, climate divisions, gridded percent of normal), the last 12 months (climate divisions, low elevation stations), and the last 36 months. Drier-than-normal conditions dominated for October-June (low elevation stations, SNOTEL stations and basins), while wetter-than-normal conditions dominated for the last 24 months. June was warmer than normal across most of the state, with some cooler-than-normal stations in the panhandle and in the north (low elevation stations, climate division analysis, and gridded analysis). May-June had a mixed temperature anomaly pattern. The last three months were mostly warmer than normal (low elevation stations, climate division analysis). The last six months were mostly cooler than normal on the low elevation station map but mixed on the climate division analysis. October 2016-June 2017 and the last 12 months were mixed on the station maps, while the last 12 months were mostly warmer than normal on the climate division analysis. Below-normal streamflow was widespread across the state. Moderate drought developed in southwest Alaska while about a third of the state continued abnormally dry on the June 27th USDM map.
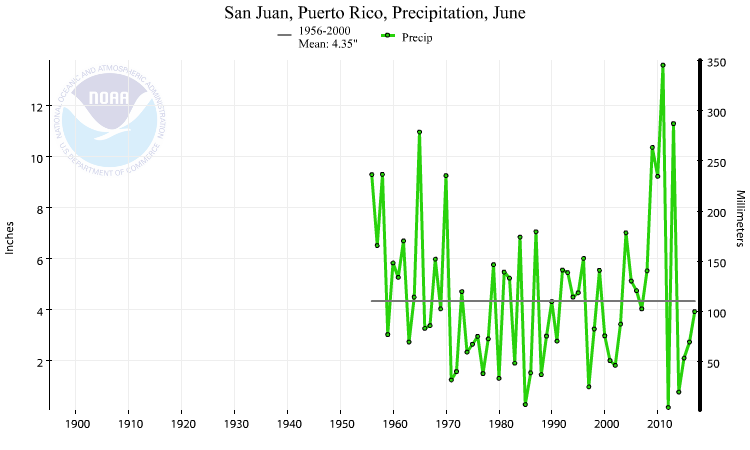
San Juan, Puerto Rico, precipitation, June, 1956-2017.
Puerto Rico: Precipitation anomaly maps for Puerto Rico were not available this month. San Juan had the 29th driest June in the 1956-2017 record. Soils were drying along the southern coast and toward the interior, but streamflow was above normal across the island. Puerto Rico was free of abnormal dryness and drought on the June 27th, 2017 USDM map.
CONUS State Precipitation Ranks:
|

|
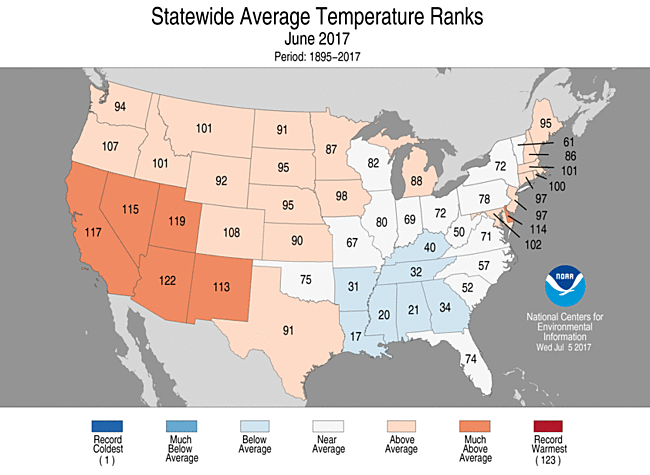
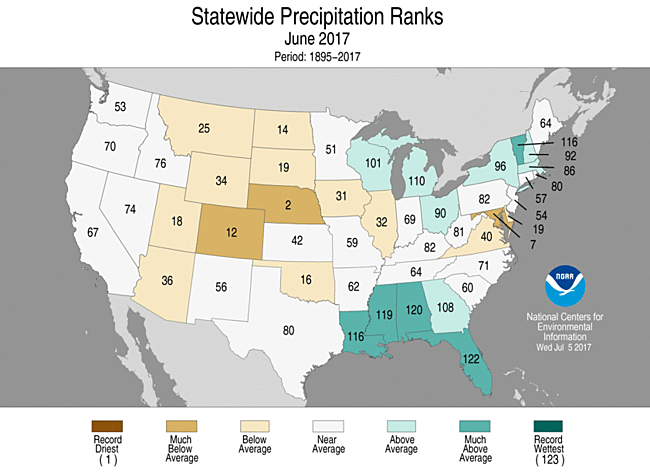
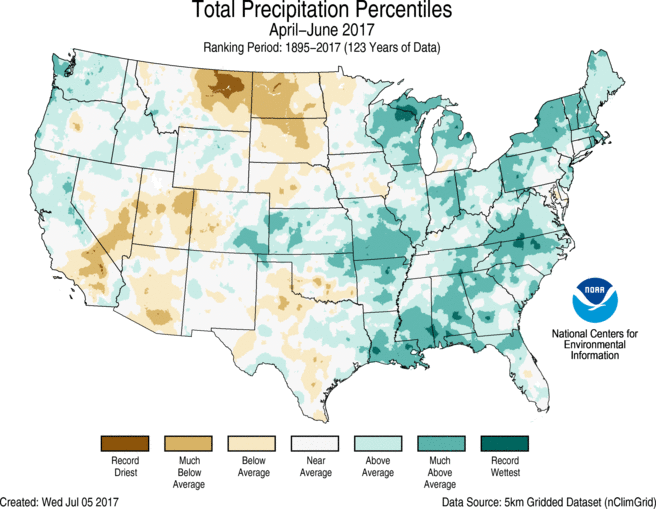
June 2017 was drier than normal across much of the West and Great Plains and parts of the Mid-Atlantic region. On a statewide basis, 13 states ranked in the driest third of the historical record with Nebraska ranking second driest in the 123-year record and Maryland seventh driest.
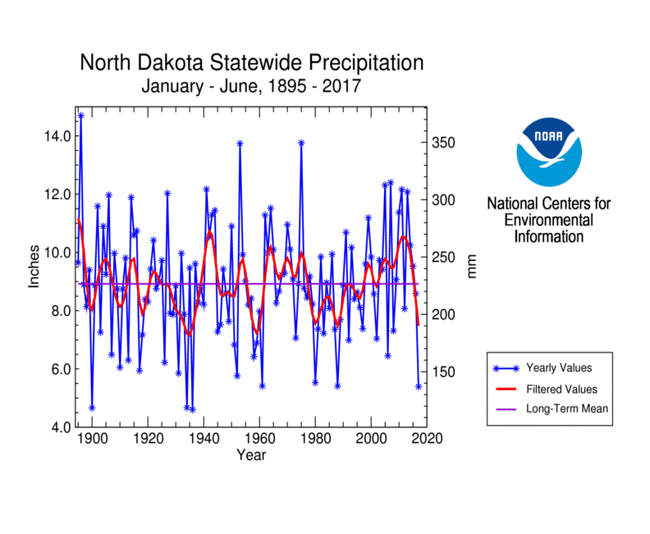
At the 3-month time scale, dryness was evident in the northern Plains and parts of the southern Plains and Southwest. Five states ranked in the driest third of the 1895-2017 record, including North Dakota which had the seventh driest April-June.

|
|
The dryness persisted at the 6-month time scale in the northern Plains, with three states there (plus Maryland) ranking in the driest third of the historical record. North Dakota had the fourth driest January-June.
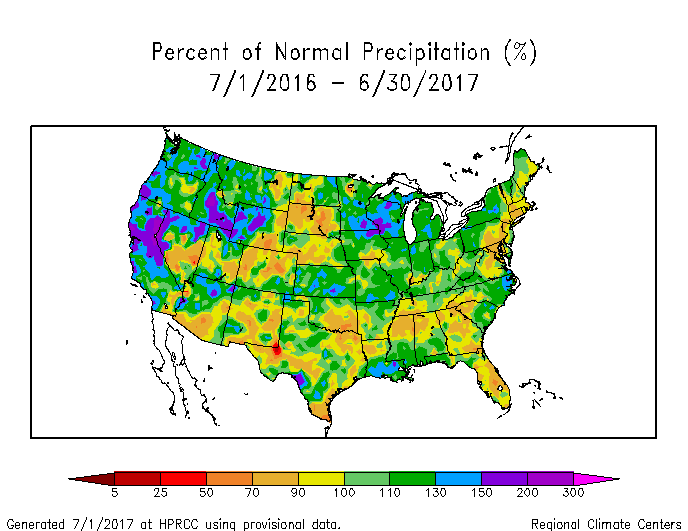
There were some areas of below-normal precipitation for the last 12 months, but no severe dryness in the CONUS. Three states (Georgia, Maryland, and Massachusetts) ranked in the driest third of the historical record.
 Primary Corn and Soybean Belt precipitation, June, 1895-2017.
|
 Primary Corn and Soybean Belt precipitation, March-June, 1895-2017.
|
June 2017 was near to drier than normal across most of the Primary Corn and Soybean agricultural belt, while temperatures ranged from warmer than normal in the north to cooler than normal in the south. The month ranked as the 54th driest and 45th warmest June, regionwide, in the 1895-2017 record. March marks the beginning of the growing season for the Primary Corn and Soybean agricultural belt. March-June 2017 was warmer and wetter than normal across most of the region, ranking as the 20th warmest and 21st wettest March-June, regionwide, on record.
NOAA Regional Climate Centers:
A more detailed drought discussion, provided by the NOAA Regional Climate Centers and others, can be found below.
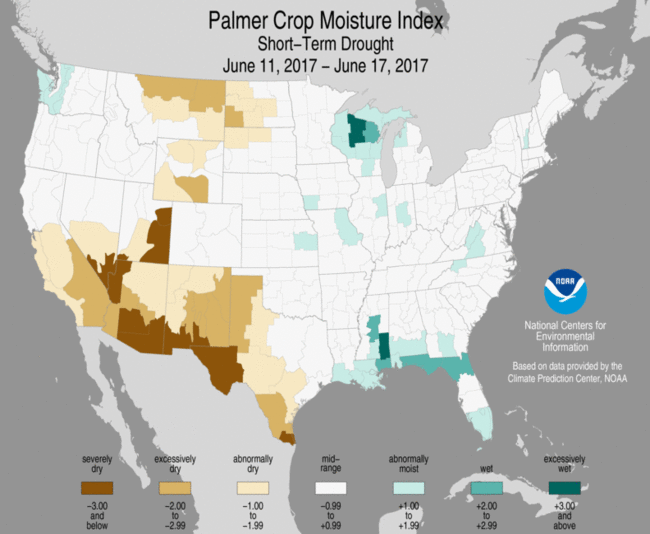
As described by the High Plains Regional Climate Center, June brought a variety of weather conditions to the High Plains, including widespread dryness, heat waves, severe weather outbreaks, and flooding from snowmelt. Temperatures were near normal to slightly above normal throughout most of the region during June. The precipitation pattern turned dry during June, as most of the High Plains region experienced below-normal precipitation. Other than some pockets of wetness, the majority of the region only received 50 percent of normal precipitation, at best. Precipitation was particularly abysmal across parts of Colorado, Wyoming, western and central Nebraska, and western North Dakota where these areas received less than 25 percent of normal precipitation.
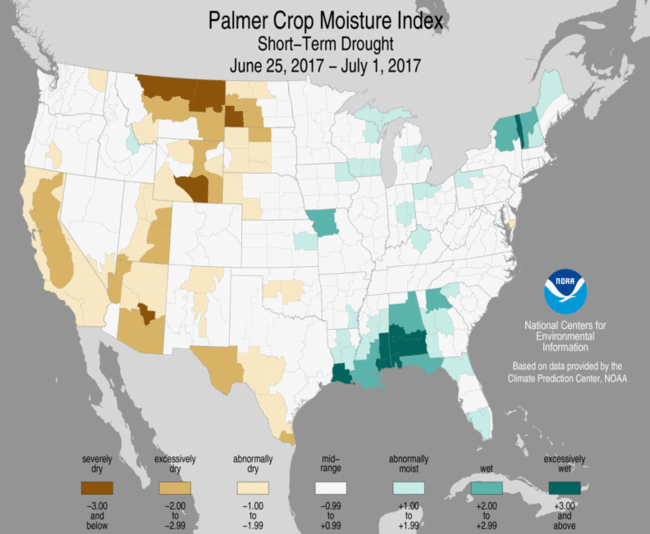
Below-normal precipitation during spring carried into June in the Dakotas and northeastern Montana, which resulted in rapid intensification of drought in this region. As of the end of June, much of this area had received no more than 50 percent of normal precipitation since April, which is a critical time for receiving ample precipitation so that crops take in adequate moisture for growth and pastures green up to feed livestock. The lack of precipitation depleted topsoil moisture, thus causing agricultural impacts to accumulate quickly. According to the July 5, 2017 U.S. Weekly Weather and Crop Bulletin, 68 percent of South Dakota's topsoil moisture was rated short to very short, compared to 54 percent in North Dakota. In South Dakota, nearly two-thirds of the spring and winter wheat crops were in poor to very poor condition. Similar conditions were reported for pastures in the Dakotas. Heat waves experienced in June exacerbated drought conditions, and without widespread precipitation and cooler conditions in July, the situation could become dire.
Drought conditions, as depicted on the USDM, intensified rapidly during the month of June across the Dakotas and northeastern Montana. According to the June 27th USDM depiction, nearly half of the High Plains region was experiencing drought or abnormal dryness (D0-D4), compared to only a quarter of the region at the end of May. Conditions worsened considerably in the Dakotas, and some areas quickly slipped into extreme drought (D3). While much of the Dakotas experienced a wet winter, it was very dry during the spring, which is a critical time for moisture as plants come out of winter dormancy and crops are planted. Spring precipitation was only 25-50 percent of normal for the majority of the Dakotas, and the dryness carried into June as well. A hot spell with temperatures in the high 90s and low 100s occurred in early June, making conditions even worse. A wide range of drought impacts have been reported in the Dakotas. The winter and spring wheat crops were faring poorly, especially in South Dakota. Pasture conditions have suffered considerably across the Dakotas, which has led to the culling of herds and the allowance of emergency grazing on Conservation Reserve Program (CRP) lands. Water hauling for livestock has been reported in some areas. Due to the scarcity of hay, the North Dakota Department of Agriculture designed an interactive online map to display information on producers selling hay, hay haulers, and hay/pasture land for rent and feedlots and can be accessed here: http://ndda.maps.arcgis.com/apps/webappviewer/index.html?id=d9266e1cc231463399c585d7f0a39893.
As explained by the Southern Regional Climate Center, June was cooler than normal for the majority states in the Southern region besides Texas and Oklahoma. Precipitation values for the month of June varied spatially across the region. Areas in central and western Oklahoma, western Arkansas, and parts of central and southern Texas received 5-50% normal precipitation for June. The majority of Tennessee received near normal precipitation for June with parts of western and eastern Tennessee receiving 50-70% of normal precipitation. Over the month of June 2017, moderate drought conditions were present in western and central Oklahoma and parts of northern and central Texas. There was an area of severe drought located near the panhandle of Texas. Most of Oklahoma experienced abnormally dry conditions which were not present in May. Northeastern Mississippi and areas in central and southern Texas had abnormally dry conditions. Moderate drought improved to abnormally dry in northeastern Mississippi. Abnormally dry conditions improved to near normal conditions during June for parts of western Arkansas and northeastern Louisiana.
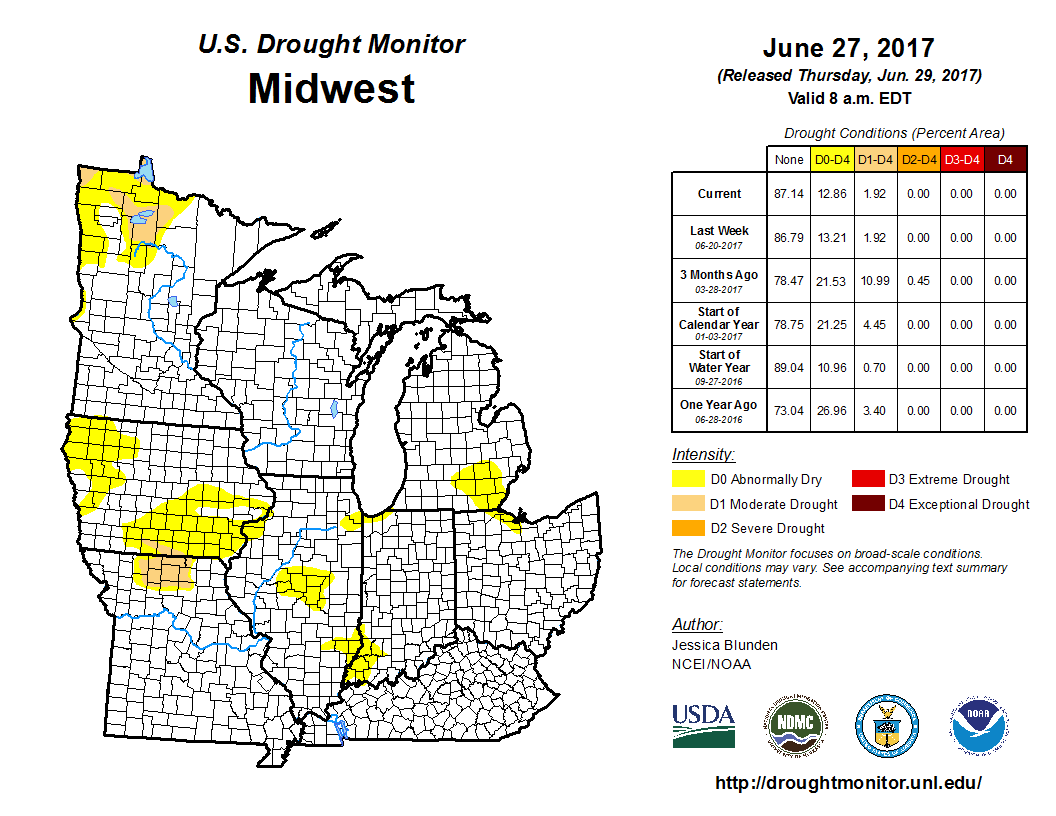
As summarized by the Midwest Regional Climate Center, June precipitation in the Midwest varied from more than 200 percent of normal to less than 50 percent of normal. The wettest areas were largely in Wisconsin and Michigan. A swath across Iowa and into Illinois had the driest conditions. June temperatures averaged close to normal across the region. Warmer than normal conditions were common in the first half of the month but were offset by cooler weather later in the month. Corn and soybean crops in the region were rated as good or excellent for over half of each crop in eight of the nine Midwestern states. Indiana came in just below half of each crop being rated as such. Crops rated as fair accounted for 10 to 35 percent and less than 20 percent were rated poor or very poor. After a drought-free May in the Midwest, some areas of drought developed in June. The USDM introduced areas of moderate drought in Minnesota, Iowa, and Missouri. As of the June 27th release of the USDM, just under 2 percent of the Midwest was designated in drought.
As noted by the Southeast Regional Climate Center, temperatures were near average across much of the Southeast region during June. However, well-below-average maximum temperatures and well-above-average minimum temperatures were recorded in portions of the region. Persistent cloud cover and rainfall during the month suppressed daytime temperatures in Alabama, the western half of Georgia, and the Florida Panhandle. Mean temperatures were near average to above average across much of Puerto Rico and the U.S. Virgin Islands during the month. In southeastern Puerto Rico, Guayama (1914-2017) tied its third warmest June mean temperature on record.
Precipitation was well above normal across much of the Southeast region during June, but a few areas of unusual dryness were also observed. The driest locations were found across portions of northern Virginia and the District of Columbia, where monthly precipitation totals were 25 to 50 percent of normal. Washington, D.C. (1871-2017) and Washington Dulles International Airport, VA (1960-2017) observed their third and fourth driest June on record, with only 1.13 and 1.28 inches (28.7 and 32.5 mm) of precipitation, respectively. From the 1st through the 15th, Washington, D.C. tied its second longest June streak of 15 consecutive days with no measurable precipitation.
Precipitation was highly variable across Puerto Rico and the U.S. Virgin Islands during June, with well-above-normal amounts in northwestern Puerto Rico and much-below-normal amounts in southern and central portions of the island.
With the exception of a localized area in northeastern Georgia, drought conditions were completely removed from the region during June. The greatest drought improvement occurred in Florida, which observed its second wettest June since records began in 1895. Consequently, moderate-to-extreme (D1-D3) drought covering about 72 percent of the state was rapidly removed during the month. Moderate-to-severe (D1-D2) drought covered about one third of Georgia in early June but was nearly eliminated from the state by the end of the month. Well-above-average precipitation replenished streamflows, recharged soil moisture, and suppressed lingering wildfires across Florida and southern Georgia. Pasture conditions continued to improve rapidly in Florida, with many livestock producers no longer having to feed hay or provide water for their herds. Corn, cotton, peanut, and soybean fields in portions of Alabama and the Florida Panhandle were flooded by heavy precipitation during the month, with some crops needing to be replanted. The heavy rainfall also leached nutrients from the soil and caused herbicide injury to the crops, which could lead to yield losses in some fields. While irrigation costs were reduced in some areas, excessive wetness during June delayed winter wheat harvesting, hay cutting, and crop planting across much of the region. In addition, nutrient and pesticide treatments could not be applied to saturated fields, which increased disease pressure on the crops. Agricultural producers in southern Georgia were prevented from harvesting several fruit and vegetable products (e.g., sweet corn, watermelon, and tomatoes), resulting in significant damage during a small harvest window for these crops.
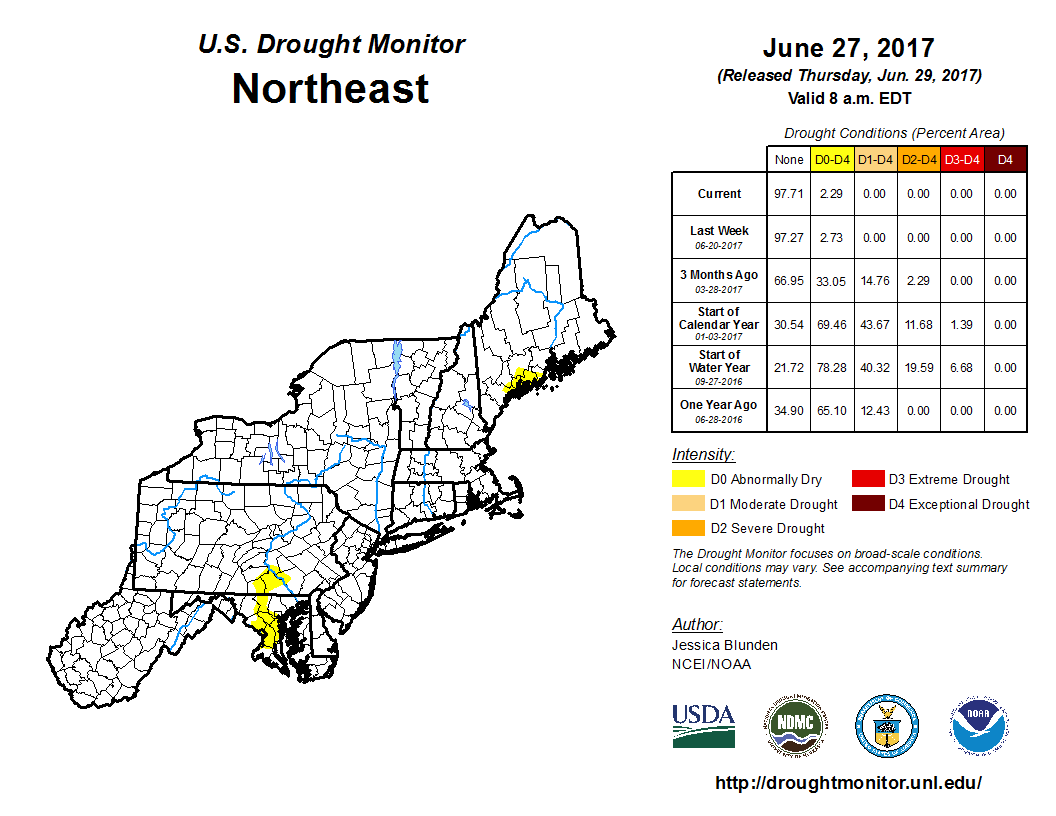
As explained by the Northeast Regional Climate Center, June averaged out to be warmer than normal for the Northeast and was another wetter-than-normal month. Of the twelve states, six were drier than normal and six were wetter than normal. Maryland has its seventh driest June on record, while Delaware had its 19th driest. The USDM released on June 1 showed small areas of abnormal dryness in Pennsylvania and Connecticut, which eased the following week. Abnormal dryness was introduced in northern West Virginia mid-month and in Pennsylvania and central Maryland a week later. Dryness eased in West Virginia by month's end, but lingered in Pennsylvania and Maryland and was introduced in coastal Maine. During the month, state drought declarations returned to normal status in Connecticut and Rhode Island.
As summarized by the Western Regional Climate Center, the West experienced a broad range of weather conditions in June, from late season snowfall mid-month to extreme heat in the latter part of the month. While most of the West was seasonably dry, the northern Great Basin and southern New Mexico observed above normal precipitation and eastern Montana reported drier than normal conditions.
June is typically one of the driest months of the year for most areas of the West, and many areas received little to no precipitation. However, a few scattered areas reported above normal precipitation mostly due to a slow-moving closed low-pressure system that traversed the Northwest on the 11th-13th, and a pocket of above normal precipitation was observed in southwest New Mexico. In contrast with other parts of the West, June is the peak of the wet season for eastern Montana, however much of the state experienced far below normal precipitation. Glasgow reported 0.14 in (4 mm), 6% of normal and the second driest June since records began in 1948. A large area of northeastern Montana was elevated from moderate to severe to exceptional drought in the USDM this month. During the second half of the month, an extensive high-pressure ridge established over the West, driving average temperatures at many locations to 10-20 F (6-10 C) above normal. June average temperatures were more moderate in the Pacific Northwest.
Drought emergency declared for eastern Montana: Impacts from persistent dry conditions combined with periods of above normal temperatures and strong winds prompted the Montana governor to declare a drought emergency in 19 counties in eastern Montana and on two Native American reservations. Range and pasture conditions are poor, and various crops such as oats, spring wheat, and sugarbeets have suffered.
Temperatures were near normal across most of Alaska this month, with some western locations seeing well above normal temperatures. Many areas of Alaska saw near to above normal June precipitation, especially in the panhandle. Several locations in the Southcentral region reported below normal precipitation; for example, Homer logged 0.46 in (12 mm), 56% of normal.
In Hawaii, June is typically one of the driest months of the year. Many locations saw near normal precipitation, though Hilo, which still typically receives over 7 in (178 mm) of rainfall in June, recorded only 2.96 in (75 mm), 40% of normal. This drier than normal June prompted a designation of abnormally dry for the windward side of the Big Island this month in the USDM.
Pacific Islands: The NOAA National Weather Service (NWS) offices, the Pacific ENSO Applications Climate Center (PEAC), and partners provided reports on conditions across the Pacific Islands.
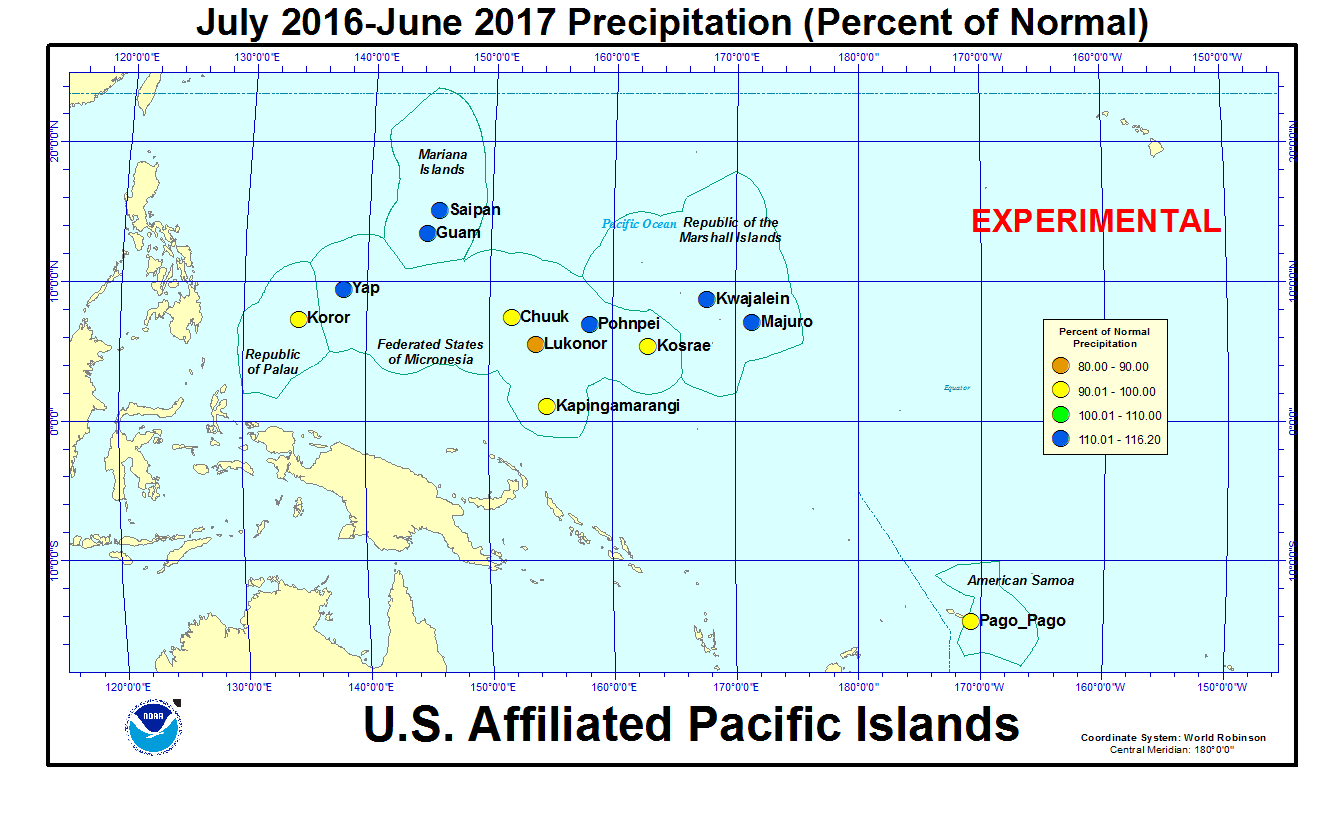
In the U.S. Affiliated Pacific Islands (USAPI) (maps — Federated States of Micronesia, Northern Mariana Islands, Marshall Islands, Republic of Palau, American Samoa, basinwide), June 2017 was drier than normal generally at the southerly stations (Koror, Yap, Chuuk, Lukonor, Kapingamarangi, Kosrae, and Pago Pago) and wetter than normal generally at the northerly stations (Saipan, Guam, Pohnpei, Kwajalein, and Majuro).
Rainfall amounts were below the minimum thresholds (4 or 8 inches) required to meet most monthly water needs at Ulithi, Lukonor, and Pingelap (in the Federated States of Micronesia [FSM]); Jaluit and Utirik (in the Marshall Islands [RMI]); and Pago Pago (in American Samoa). June rainfall was above the monthly minimum thresholds at the rest of the regular reporting stations in Micronesia. The 4- and 8-inch thresholds are important because, if monthly precipitation falls below the threshold, then water shortages or drought become a concern.
Significant dryness has developed in the northern Marshall Islands since December 2016, with five of the last seven months having less than 2 inches each at Utirik; four of the last seven months having less than 2 inches each at Wotje; and six of the last seven months having less than 4 inches each at Wotje (8 inches is the monthly minimum in the RMI). The 8.86 inches for June at Wotje is the first "wet" (above minimum) month since November 2016. The last three months were the second driest April-June at Utirik out of 10 years of data; the last two months were the third driest May-June at Ailinglapalap out of 34 years of data; and the last two months were the driest May-June at Jaluit out of 34 years of data. The National Weather Service office on Guam issued a revised Drought Information Statement on July 6 which noted that drought continues to be a serious concern for the northern Marshall Islands following an April 24th declaration of a state of emergency by the President of the RMI for the northern atolls and islands affected by the dry conditions.
Parts of the FSM were on the dry side of normal, although drought was not a concern there at this time. Pingelap had the driest May-June in 34 years of data, Lukonor the fourth driest April-June in 33 years of data, Yap seventh driest May-June in 66 years of data, and Chuuk third driest May-June and sixth driest April-June in 66 years of data.
As measured by percent of normal precipitation, Chuuk and Lukonor have been drier than normal in the short term (June and the last 3 months [April-June]) as well as the long term (year to date [January-June] and last 12 months [July 2016-June 2017]). Koror and Yap have been drier than normal in the near term and near to wetter than normal in the long term. Kapingamarangi and Kosrae were drier than normal for June, near to wetter than normal for the last 3 and 6 months, and near to drier than normal for the last 12 months. Kwajalein, Majuro, and Saipan were drier than normal for April-June but wetter than normal at the other three time scales. Pago Pago was drier than normal for June and the last 12 months but near to wetter than normal at the other two time scales. Guam and Pohnpei were wetter than normal at all four time scales.
| Station Name | Jul 2016 | Aug 2016 | Sep 2016 | Oct 2016 | Nov 2016 | Dec 2016 | Jan 2017 | Feb 2017 | Mar 2017 | Apr 2017 | May 2017 | Jun 2017 | Jul- Jun |
|---|---|---|---|---|---|---|---|---|---|---|---|---|---|
| Chuuk | 94% | 74% | 86% | 58% | 98% | 176% | 113% | 114% | 189% | 60% | 83% | 73% | 94% |
| Guam NAS | 67% | 141% | 124% | 115% | 137% | 170% | 155% | 167% | 256% | 340% | 56% | 136% | 112% |
| Kapingamarangi | 66% | 91% | 77% | 26% | 71% | 114% | 159% | 207% | 126% | 159% | 114% | 81% | 95% |
| Koror | 45% | 61% | 115% | 153% | 144% | 64% | 131% | 175% | 245% | 76% | 107% | 89% | 99% |
| Kosrae | 88% | 88% | 89% | 90% | 56% | 168% | 103% | 213% | 150% | 112% | 115% | 80% | 95% |
| Kwajalein | 101% | 83% | 64% | 168% | 126% | 156% | 285% | 212% | 46% | 65% | 77% | 156% | 114% |
| Lukonor | 43% | 73% | 120% | 74% | 198% | 128% | 138% | 66% | 160% | 85% | 80% | 60% | 85% |
| Majuro | 90% | 75% | 123% | 120% | 129% | 103% | 228% | 138% | 199% | 110% | 49% | 118% | 116% |
| Pago Pago | 81% | 83% | 83% | 55% | 127% | 111% | 72% | 153% | 52% | 87% | 240% | 93% | 93% |
| Pohnpei | 79% | 112% | 144% | 120% | 115% | 142% | 182% | 71% | 115% | 96% | 92% | 141% | 114% |
| Saipan | 42% | 186% | 191% | 48% | 79% | 95% | 182% | 199% | 108% | 115% | 66% | 128% | 116% |
| Yap | 67% | 88% | 66% | 164% | 156% | 101% | 198% | 370% | 205% | 110% | 69% | 68% | 113% |
| Station Name | Jul 2016 | Aug 2016 | Sep 2016 | Oct 2016 | Nov 2016 | Dec 2016 | Jan 2017 | Feb 2017 | Mar 2017 | Apr 2017 | May 2017 | Jun 2017 | Jul- Jun |
|---|---|---|---|---|---|---|---|---|---|---|---|---|---|
| Chuuk | 11.27" | 9.50" | 10.04" | 6.73" | 10.39" | 19.83" | 11.37" | 8.27" | 15.74" | 7.51" | 9.40" | 8.50" | 128.55" |
| Guam NAS | 6.77" | 20.85" | 15.65" | 13.14" | 10.13" | 8.68" | 6.22" | 5.06" | 5.30" | 8.60" | 1.89" | 8.40" | 110.69" |
| Kapingamarangi | 9.33" | 7.38" | 7.61" | 2.14" | 6.58" | 11.22" | 14.54" | 19.18" | 14.44" | 21.70" | 13.75" | 11.15" | 139.02" |
| Koror | 8.28" | 8.20" | 13.51" | 18.06" | 16.38" | 7.13" | 13.30" | 14.99" | 18.26" | 5.54" | 12.61" | 15.53" | 151.79" |
| Kosrae | 13.07" | 12.48" | 12.71" | 9.87" | 7.76" | 26.99" | 17.21" | 27.51" | 24.16" | 19.62" | 20.34" | 11.73" | 203.45" |
| Kwajalein | 9.96" | 8.12" | 6.90" | 18.73" | 14.16" | 10.36" | 9.00" | 5.60" | 1.07" | 3.44" | 5.20" | 10.80" | 103.34" |
| Lukonor | 6.84" | 10.31" | 12.23" | 8.41" | 18.02" | 14.42" | 11.58" | 5.90" | 14.83" | 9.61" | 9.41" | 6.97" | 128.53" |
| Majuro | 10.09" | 8.78" | 13.73" | 15.28" | 17.36" | 11.77" | 17.65" | 9.50" | 13.07" | 10.36" | 4.93" | 13.03" | 145.55" |
| Pago Pago | 4.48" | 4.49" | 5.45" | 5.12" | 12.86" | 14.24" | 9.57" | 18.32" | 5.60" | 8.14" | 23.23" | 4.94" | 116.44" |
| Pohnpei | 12.12" | 15.91" | 18.13" | 18.39" | 17.00" | 22.83" | 24.00" | 6.76" | 15.16" | 17.68" | 18.45" | 20.85" | 207.28" |
| Saipan | 3.76" | 24.40" | 19.31" | 5.07" | 4.42" | 3.67" | 4.61" | 5.15" | 2.04" | 3.02" | 1.58" | 4.63" | 81.66" |
| Yap | 10.03" | 13.10" | 8.89" | 20.00" | 13.78" | 8.59" | 12.67" | 19.19" | 9.35" | 6.19" | 5.40" | 8.16" | 135.35" |
| Station Name | Jul 2016 | Aug 2016 | Sep 2016 | Oct 2016 | Nov 2016 | Dec 2016 | Jan 2017 | Feb 2017 | Mar 2017 | Apr 2017 | May 2017 | Jun 2017 | Jul- Jun |
|---|---|---|---|---|---|---|---|---|---|---|---|---|---|
| Chuuk | 11.98" | 12.86" | 11.71" | 11.51" | 10.61" | 11.25" | 10.10" | 7.25" | 8.32" | 12.47" | 11.30" | 11.66" | 136.77" |
| Guam NAS | 10.14" | 14.74" | 12.66" | 11.44" | 7.38" | 5.11" | 4.01" | 3.03" | 2.07" | 2.53" | 3.40" | 6.18" | 99.09" |
| Kapingamarangi | 14.15" | 8.13" | 9.93" | 8.19" | 9.27" | 9.84" | 9.15" | 9.27" | 11.43" | 13.64" | 12.08" | 13.78" | 145.85" |
| Koror | 18.53" | 13.50" | 11.77" | 11.84" | 11.39" | 11.16" | 10.18" | 8.56" | 7.44" | 7.32" | 11.83" | 17.48" | 152.90" |
| Kosrae | 14.91" | 14.22" | 14.22" | 10.94" | 13.83" | 16.11" | 16.67" | 12.93" | 16.06" | 17.51" | 17.75" | 14.64" | 213.87" |
| Kwajalein | 9.87" | 9.74" | 10.74" | 11.18" | 11.28" | 6.66" | 3.16" | 2.64" | 2.35" | 5.26" | 6.72" | 6.93" | 90.41" |
| Lukonor | 15.93" | 14.04" | 10.15" | 11.32" | 9.08" | 11.27" | 8.41" | 8.93" | 9.26" | 11.31" | 11.69" | 11.65" | 151.36" |
| Majuro | 11.17" | 11.69" | 11.17" | 12.73" | 13.44" | 11.39" | 7.74" | 6.88" | 6.58" | 9.42" | 10.11" | 11.01" | 125.25" |
| Pago Pago | 5.55" | 5.38" | 6.53" | 9.26" | 10.14" | 12.84" | 13.34" | 12.00" | 10.68" | 9.39" | 9.66" | 5.33" | 125.57" |
| Pohnpei | 15.43" | 14.26" | 12.55" | 15.27" | 14.83" | 16.08" | 13.18" | 9.55" | 13.17" | 18.41" | 19.96" | 14.81" | 182.36" |
| Saipan | 8.91" | 13.13" | 10.09" | 10.62" | 5.61" | 3.85" | 2.53" | 2.59" | 1.89" | 2.63" | 2.38" | 3.62" | 70.25" |
| Yap | 15.08" | 14.82" | 13.50" | 12.18" | 8.83" | 8.51" | 6.39" | 5.19" | 4.56" | 5.63" | 7.85" | 12.04" | 120.31" |
An analysis of historical data for the USAPI stations in the Global Historical Climatology Network-Daily (GHCN-D) dataset, augmented with fill-in data from the 1981-2010 Normals, indicated that long-term dryness persisted at a few stations, short-term dryness has developed at a few others, and wet conditions dominated at yet others. The following table lists the precipitation ranks for June 2017, April-June 2017 (last 3 months), and July 2016-June 2017 (the last 12 months). Some stations have a long period of record and their dataset is fairly complete, while other stations have a shorter period of record and the dataset has some missing data.
Rank of 1 = driest.
| Station | Jun 2017 Rank |
Jun No. of Years |
Apr- Jun 2017 Rank |
Apr- Jun No. of Years |
Jul 2016- Jun 2017 Rank |
Jul- Jun No. of Years |
Period of Record |
| Jaluit | 4 | 34 | 3 | 34 | 14 | 32 | 1981-2017 |
| Koror | 28 | 66 | 18 | 66 | 33 | 65 | 1951-2017 |
| Woleai | 12 | 35 | 13 | 33 | 9 | 20 | 1968-2017 |
| Yap | 12 | 66 | 12 | 66 | 51 | 65 | 1951-2017 |
| Majuro | 43 | 64 | 26 | 63 | 48 | 63 | 1954-2017 |
| Ulithi | 1 | 35 | 7 | 35 | MSG | 32 | 1981-2017 |
| Ailinglapalap | 15 | 34 | 8 | 34 | 26 | 31 | 1981-2017 |
| Kosrae | 10 | 50 | 20 | 43 | 17 | 31 | 1954-2017 |
| Lukonor | 2 | 33 | 4 | 33 | 8 | 20 | 1981-2017 |
| Saipan | 25 | 37 | 18 | 37 | 24 | 28 | 1981-2017 |
| Pohnpei | 53 | 66 | 40 | 66 | 55 | 65 | 1951-2017 |
| Kwajalein | 44 | 66 | 22 | 65 | 42 | 65 | 1952-2017 |
| Kapingamarangi | 16 | 27 | 20 | 23 | 8 | 14 | 1962-2017 |
| Chuuk | 8 | 66 | 6 | 66 | 15 | 66 | 1951-2017 |
| Guam | 49 | 61 | 48 | 61 | 49 | 60 | 1957-2017 |
| Nukuoro | 20 | 35 | 30 | 34 | 25 | 32 | 1981-2017 |
| Pago Pago | 18 | 52 | 36 | 52 | 18 | 51 | 1966-2017 |
| Wotje | 26 | 34 | 20 | 34 | 25 | 31 | 1981-2017 |
| Utirik | 4 | 13 | 2 | 10 | MSG | 3 | 1985-2017 |


[top]
State/Regional/National Moisture Status
A detailed review of drought and moisture conditions is available for all contiguous U.S. states, the nine standard regions, and the nation (contiguous U.S.):
| northeast u. s. | east north central u. s. | central u. s. |
| southeast u. s. | west north central u. s. | south u. s. |
| southwest u. s. | northwest u. s. | west u. s. |
| Contiguous United States |
[top]
Contacts & Questions