|
Contents Of This Report: |
|
Please note that the values presented in this report are based on preliminary data. They will change when the final data are processed, but will not be replaced on these pages.
National Drought Overview
|
|
[top]
Detailed Drought Discussion
Overview
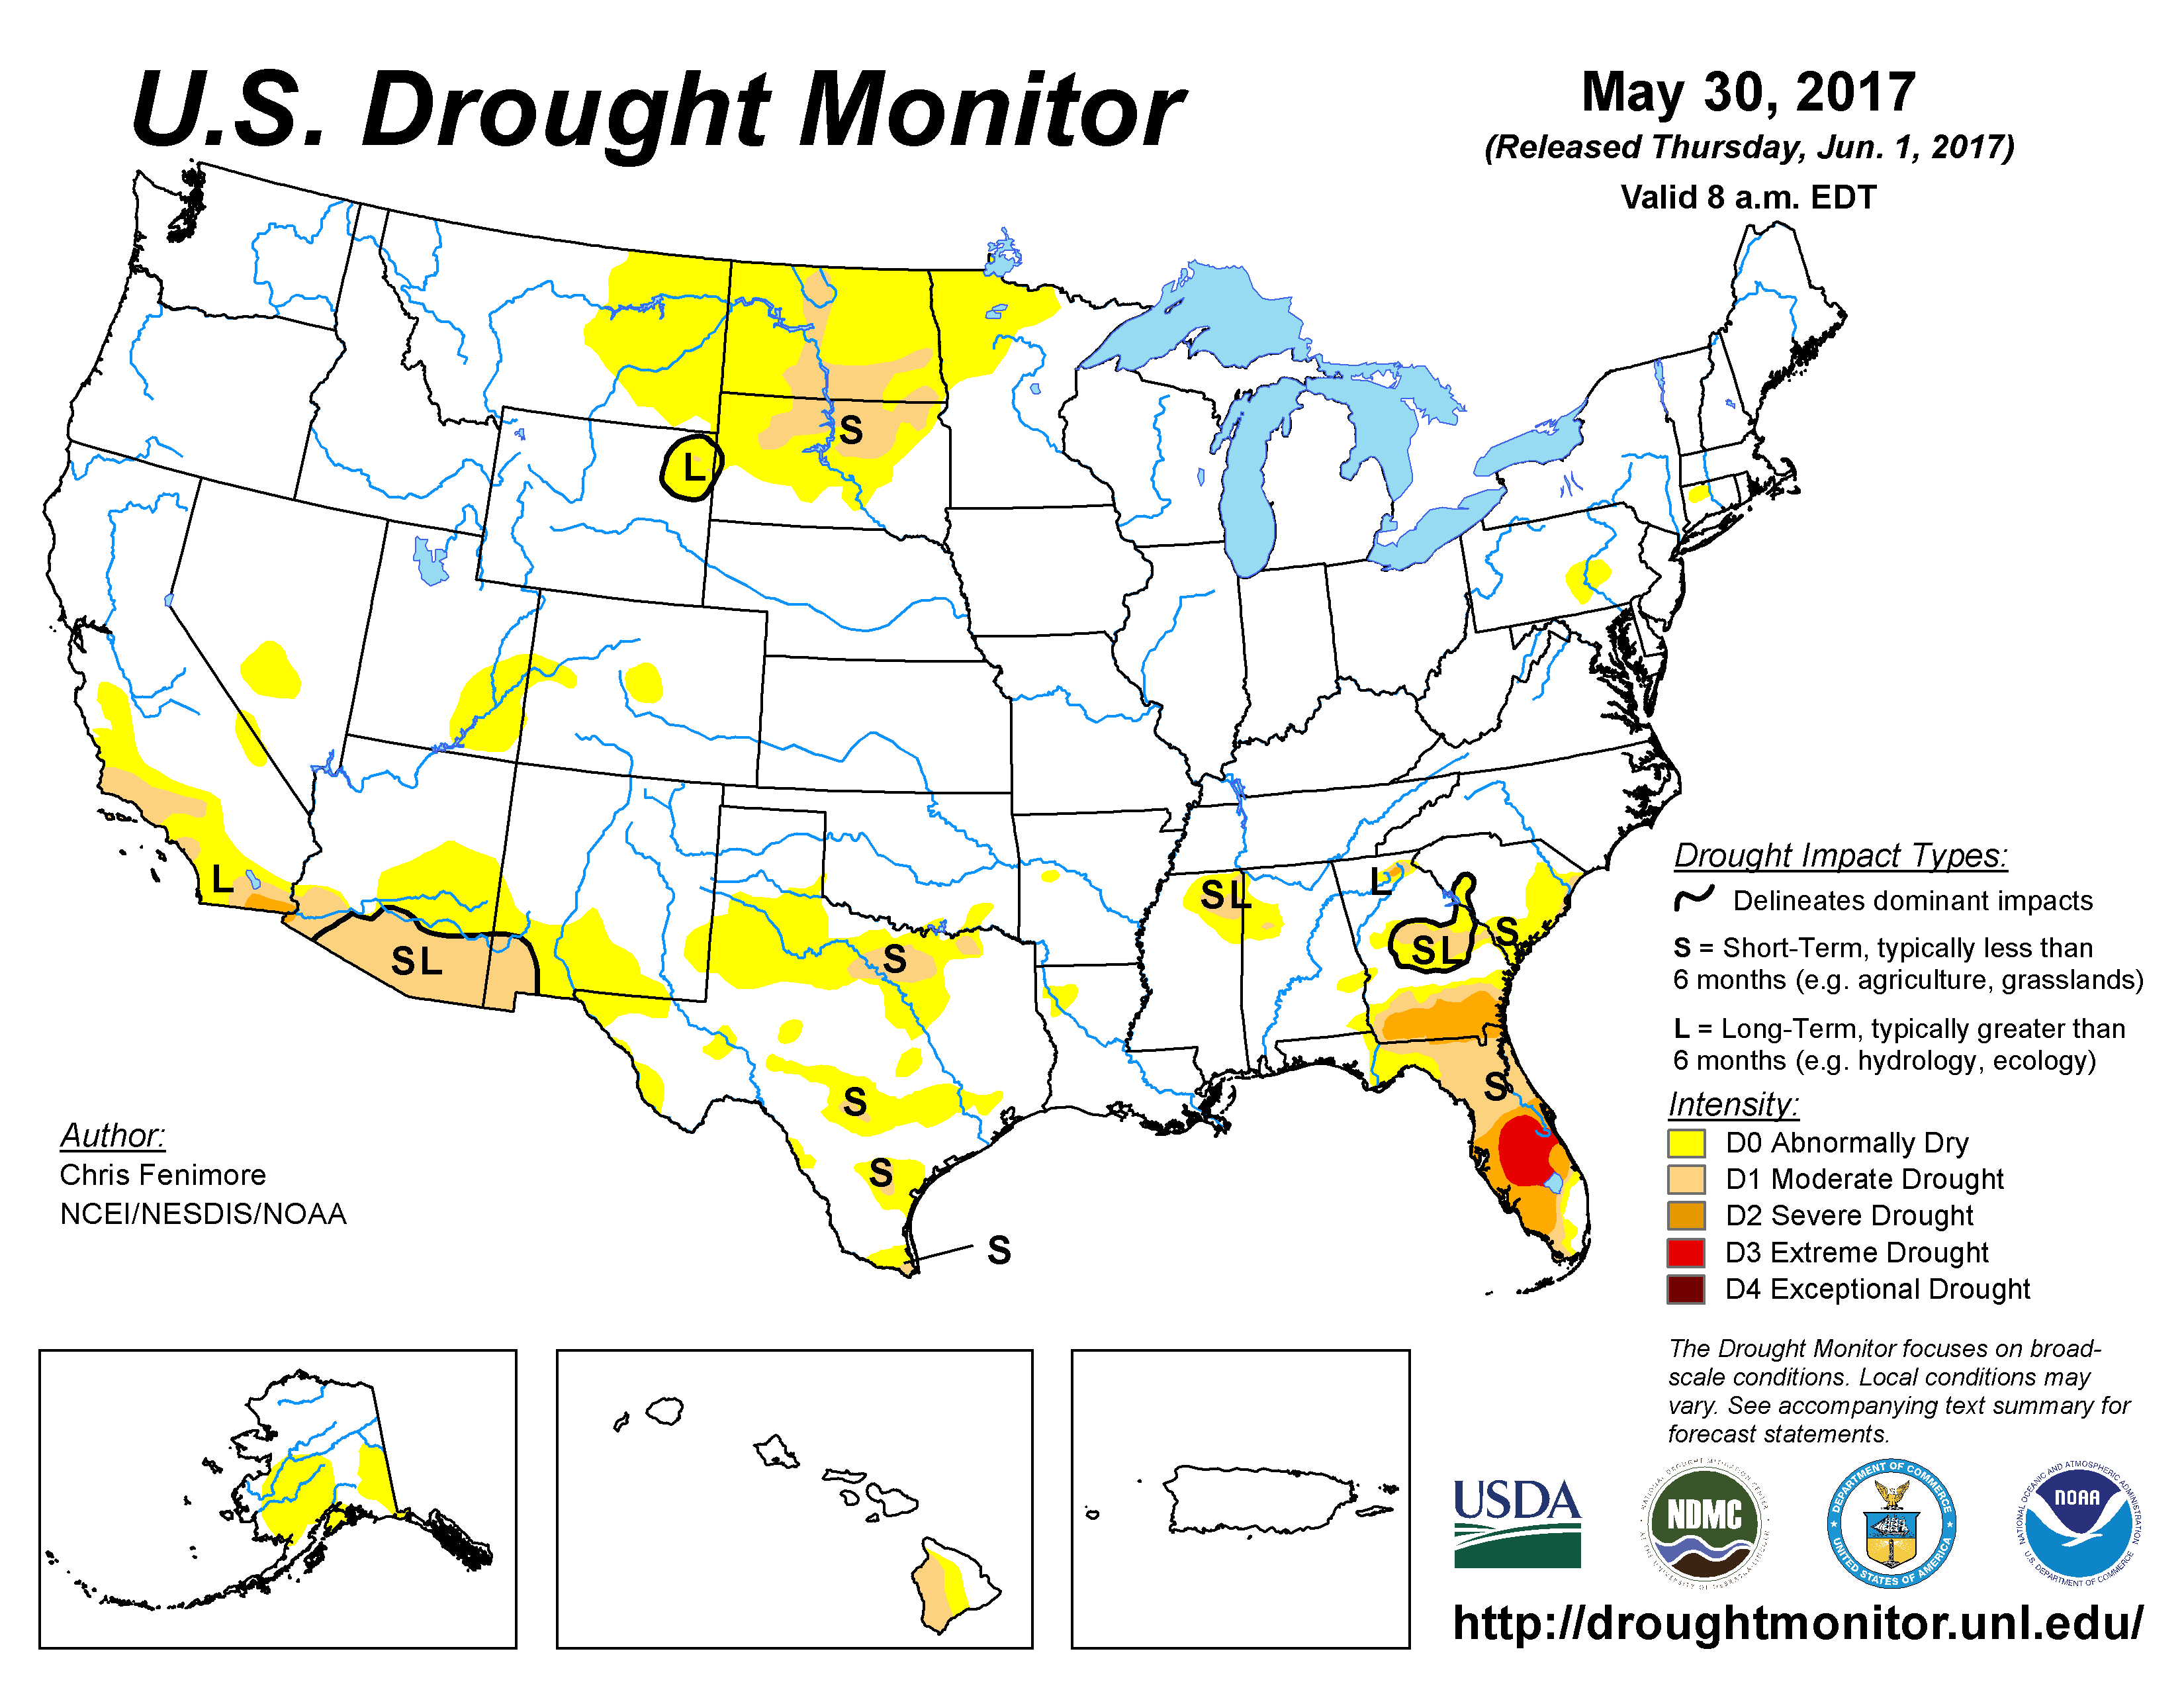
The U.S. Drought Monitor drought map valid May 30, 2017.
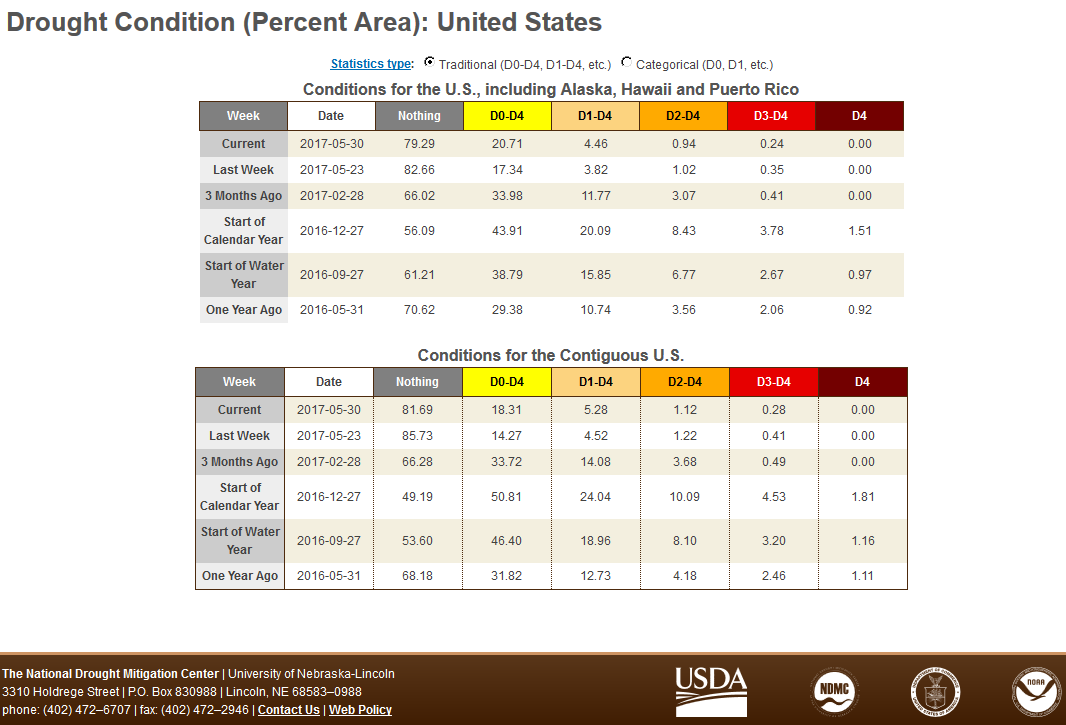
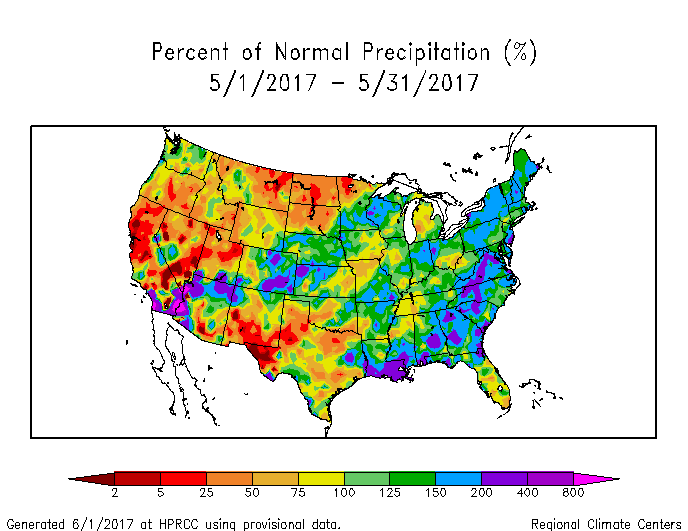
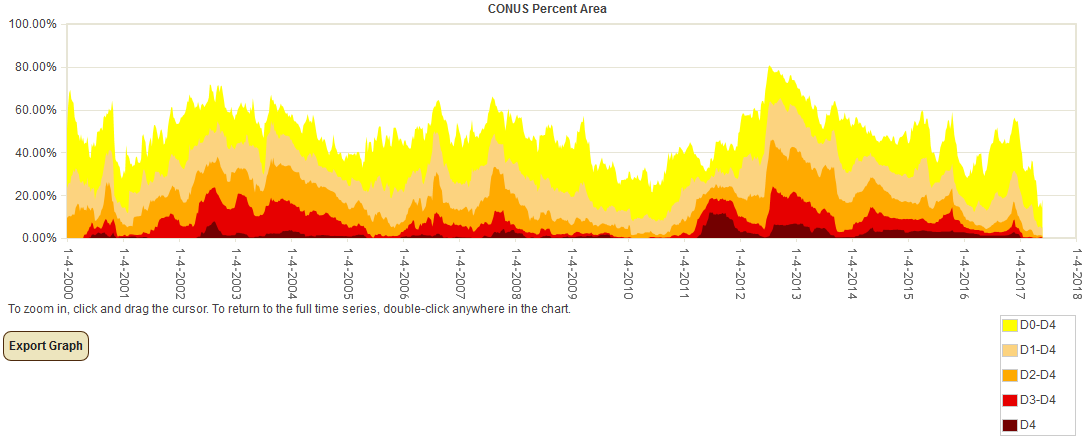
During May 2017, the upper-level circulation over the CONUS was highly meridional and variable and consisted of several troughs and slow-moving closed lows which brought above-normal precipitation to many areas east of the Rockies. Areas of drought and abnormal dryness contracted from the South to Northeast. Unfortunately, the rain-producing systems mostly missed parts of the Plains and much of the West, with drought and abnormal dryness expanding or intensifying in parts of the northern and southern Plains and Southwest. Abnormal dryness and severe drought contracted in Hawaii, although the net area of moderate to severe drought remained the same. May had a mixed precipitation anomaly pattern across Alaska, while the month was mostly drier than normal across Puerto Rico. The expansion of drought in some areas and contraction in others mostly balanced each other out, with the USDM-based national moderate-to-exceptional drought footprint across the CONUS increasing only slightly from 5.0 percent at the end of April to 5.3 percent at the end of May (from 4.2 percent to 4.5 percent for all of the U.S.). According to the Palmer Drought Index, which goes back to the beginning of the 20th century, about 5.4 percent of the CONUS was in moderate to extreme drought at the end of May, a decrease from last month's 11.2 percent.
Drought conditions at the end of the month, as depicted on the May 30th, 2017 USDM map, included the following CONUS core drought and abnormally dry areas:
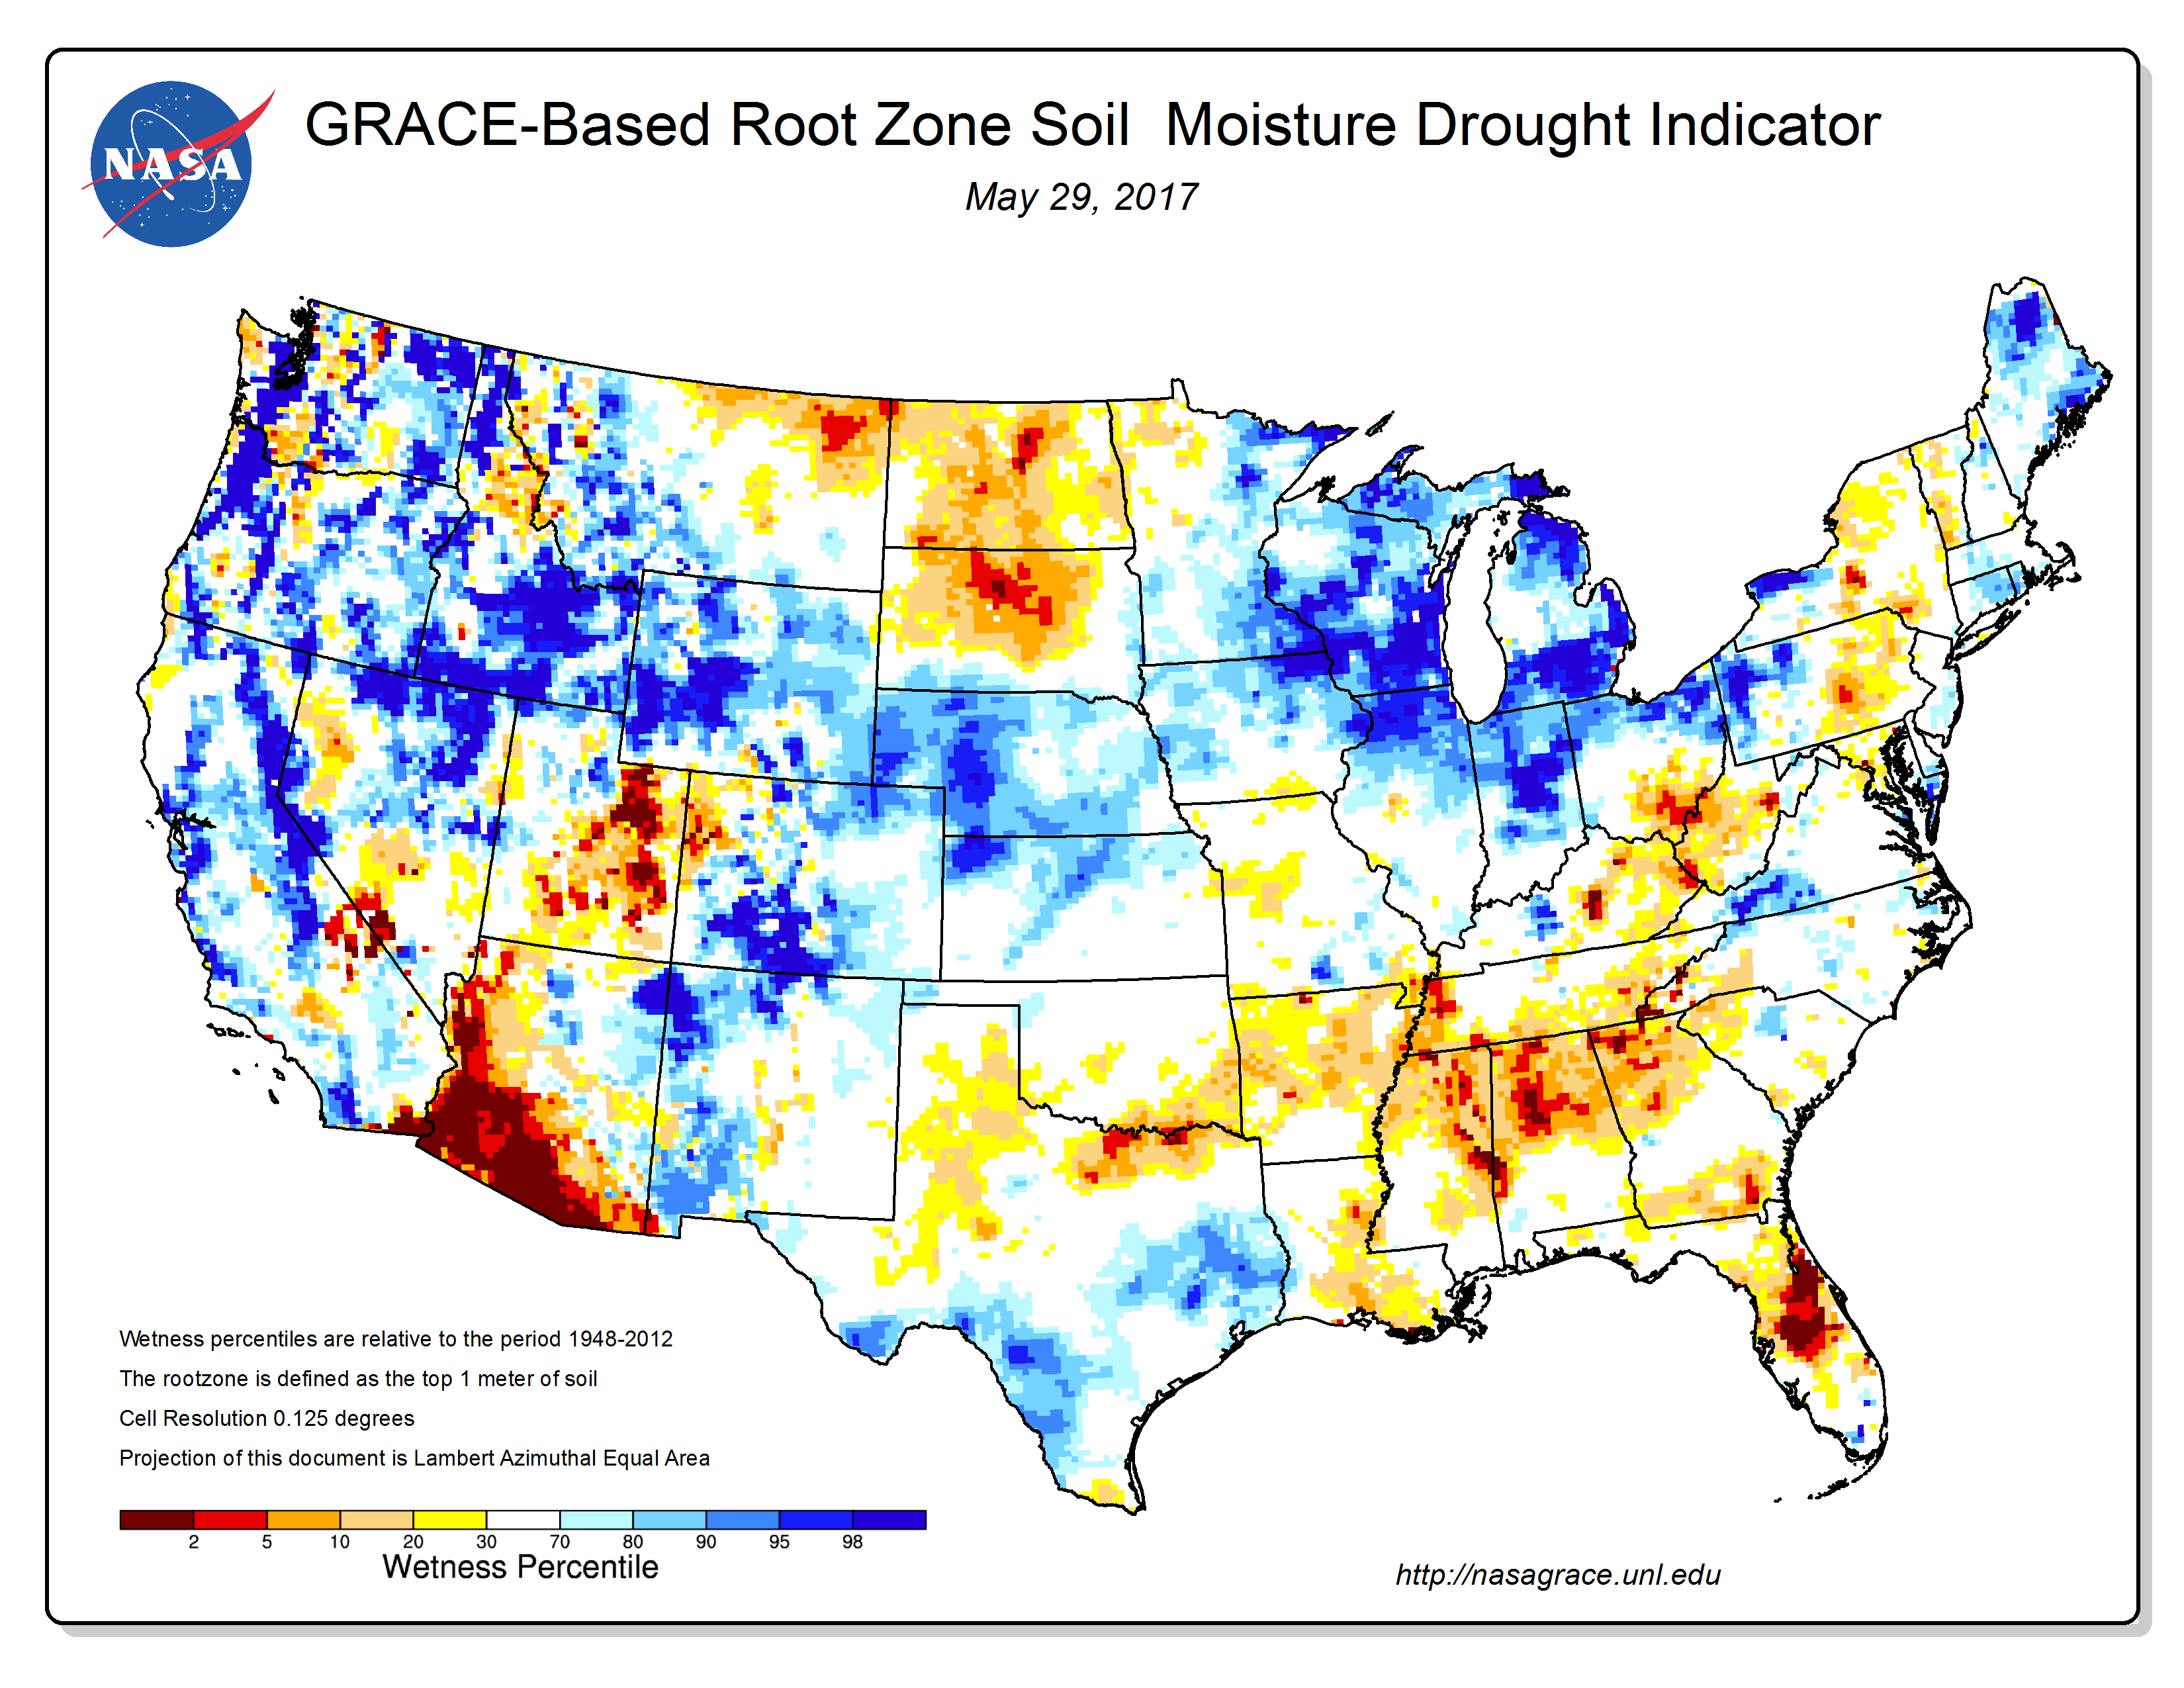
- Abnormal dryness (D0) expanded and moderate (D1) drought was introduced in the northern Plains — The worsening conditions were reflected in a number of drought indices and indicators, including increased evapotranspiration (Evaporative Stress Index [ESI]) and decreasing soil moisture (NLDAS top soil and total soil moisture, GRACE root zone and surface soil moisture, CPC model, VIC model, SMOS satellite-based analysis). Moisture stress on crops intensified as the month wore on (Crop Moisture Index [CMI] for weeks 1, 2, 3, 4, 5). According to May 30th U.S. Department of Agriculture (USDA) reports, 34 percent of the topsoil moisture and 20 percent of the subsoil moisture was short to very short (dry to very dry) in Montana, while the statistics were 36 percent for topsoil and 23 percent for subsoil in North Dakota and 38 percent for topsoil and 39 percent for subsoil in South Dakota. The USDA reports indicated that pasture and rangeland was in poor to very poor condition for 17 percent of Montana, 21 percent of North Dakota, and 26 percent of South Dakota. For crops in South Dakota, 21 percent of winter wheat and 23 percent of spring wheat were rated in poor to very poor condition.
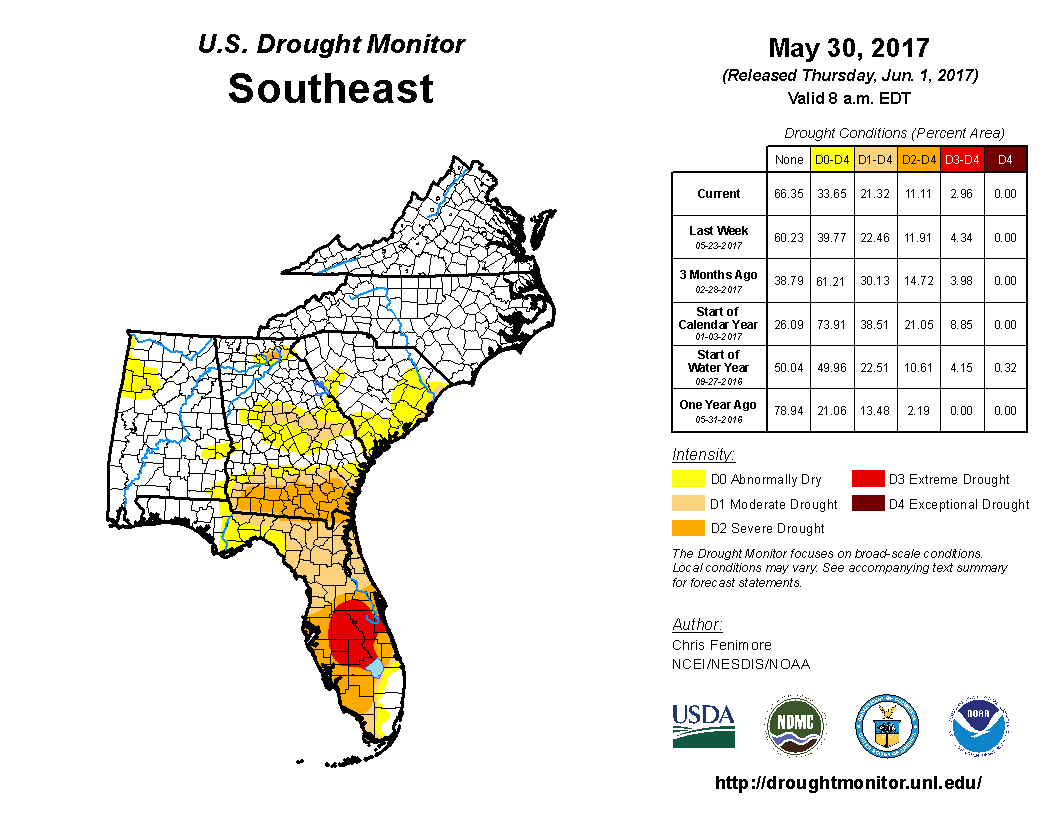
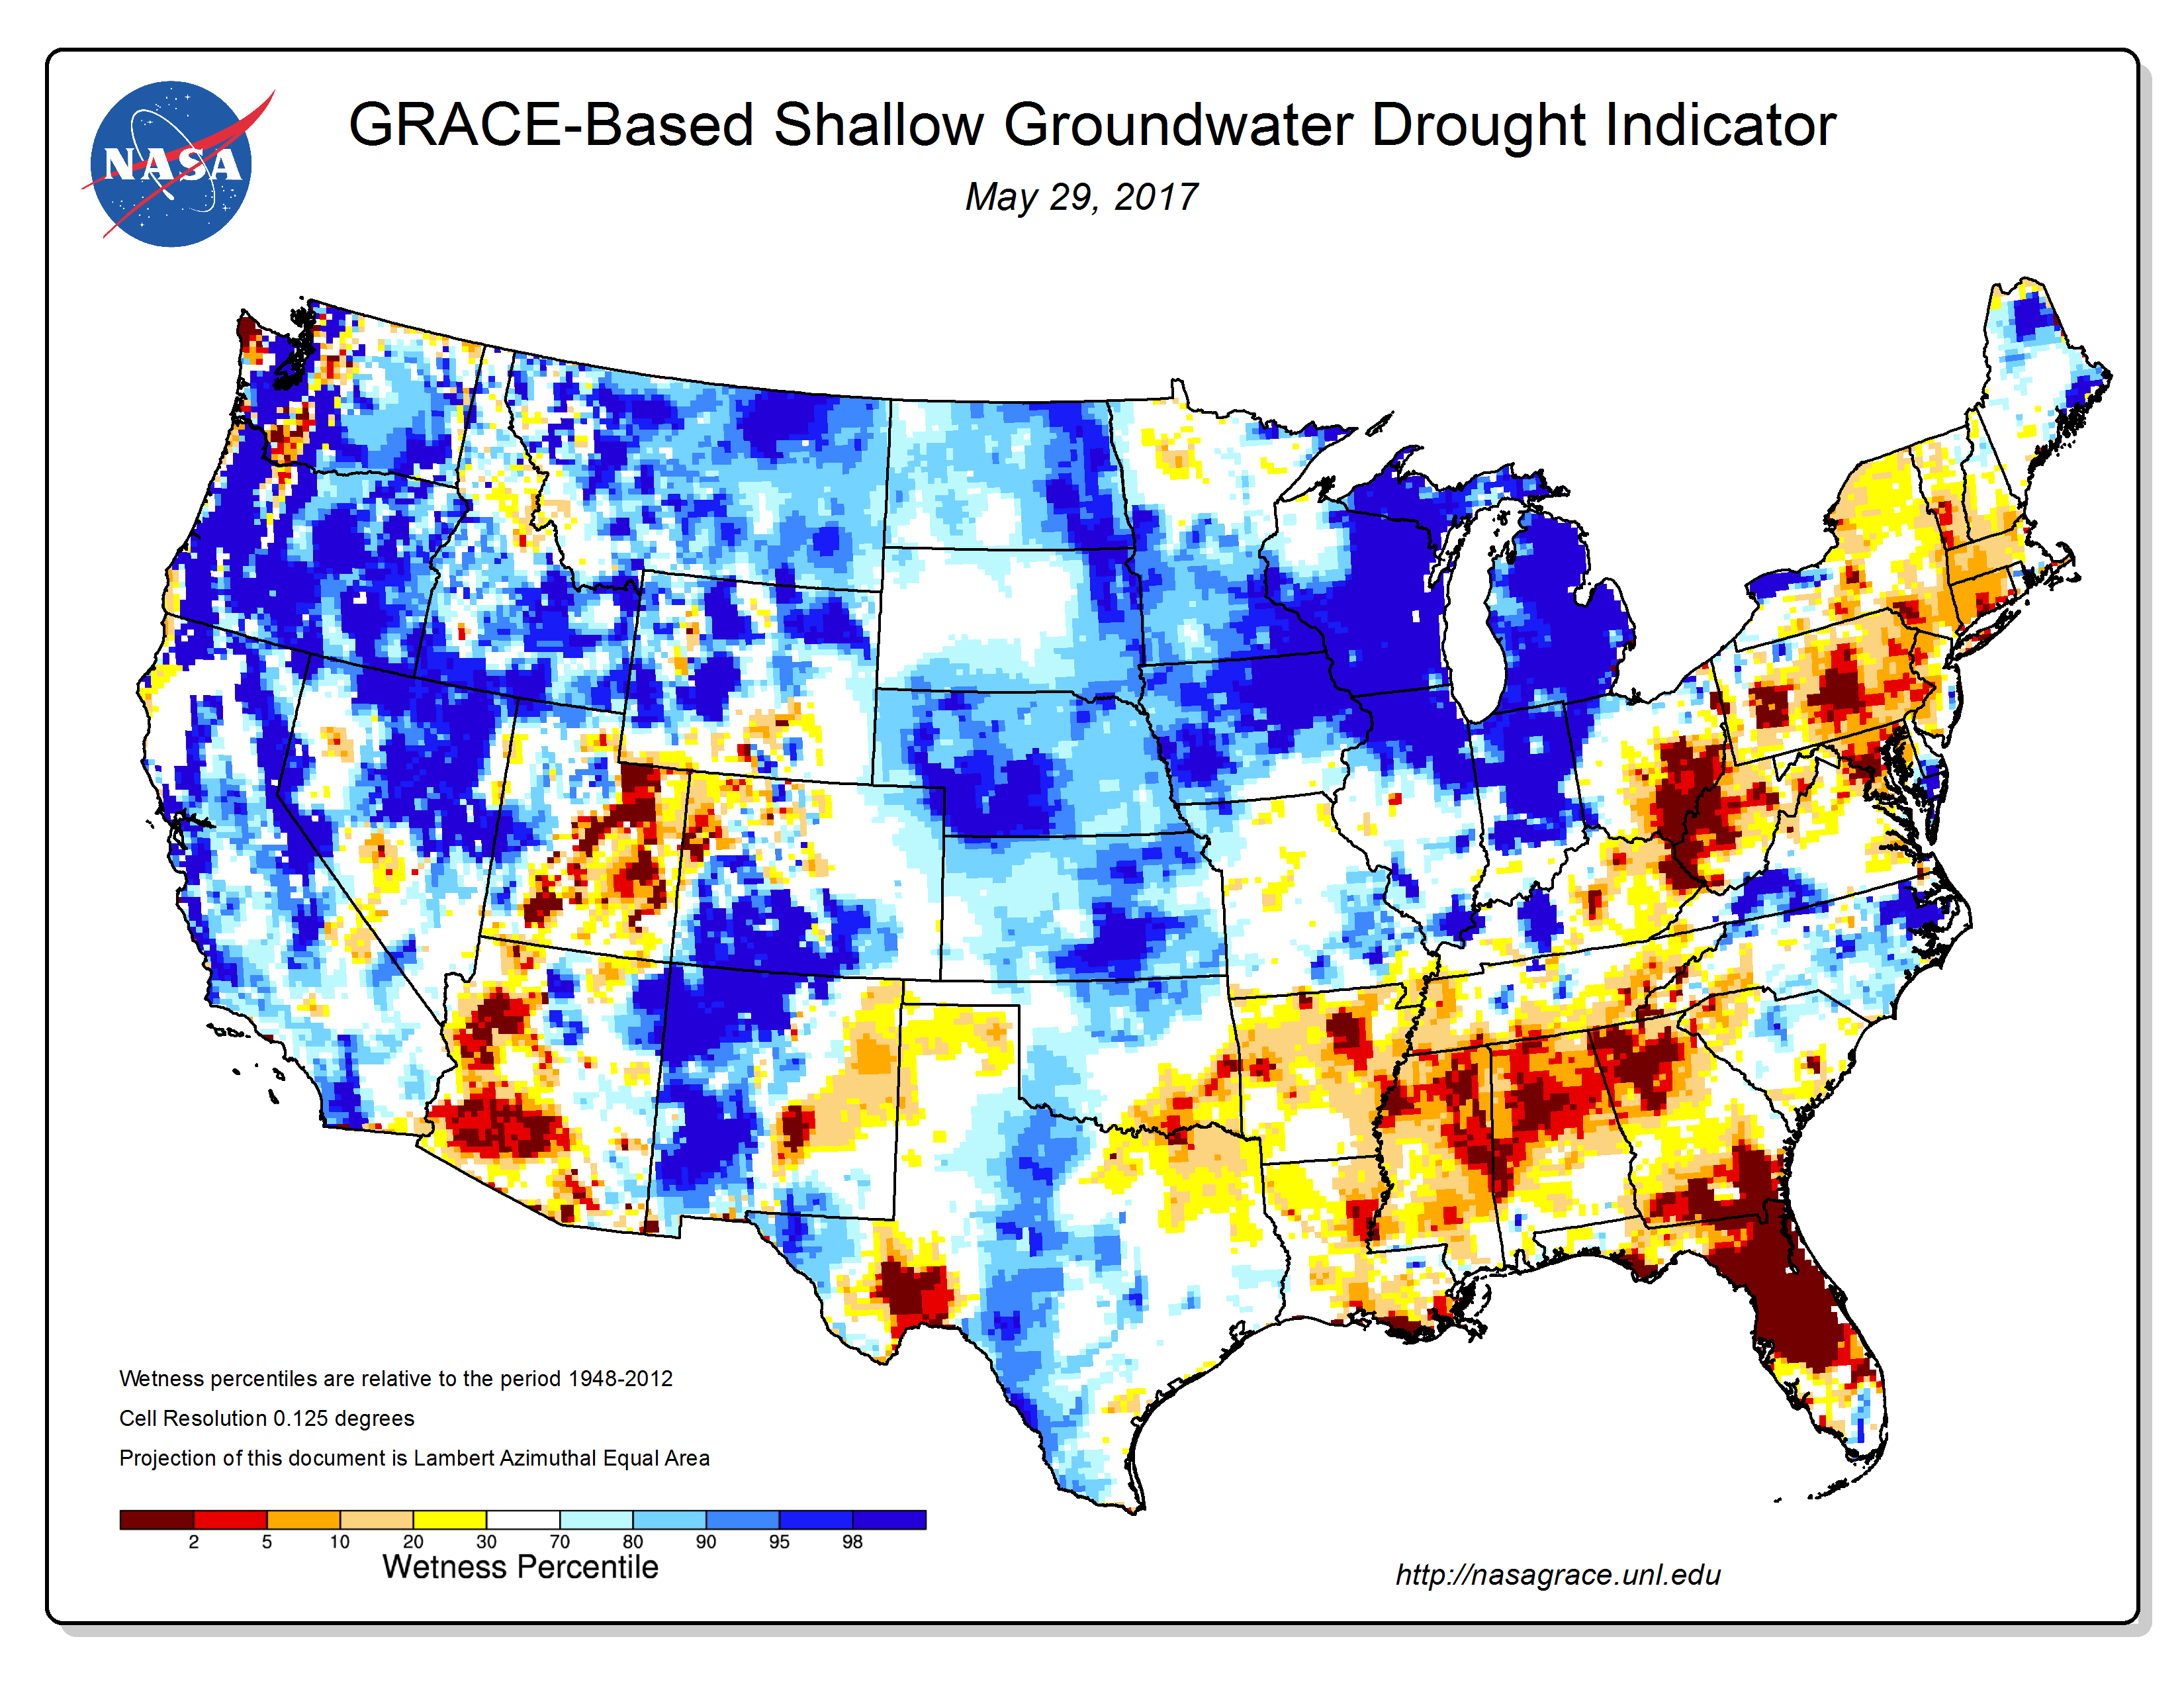
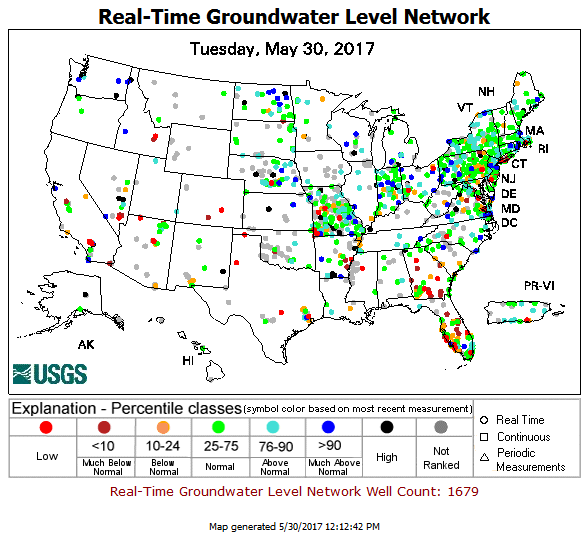
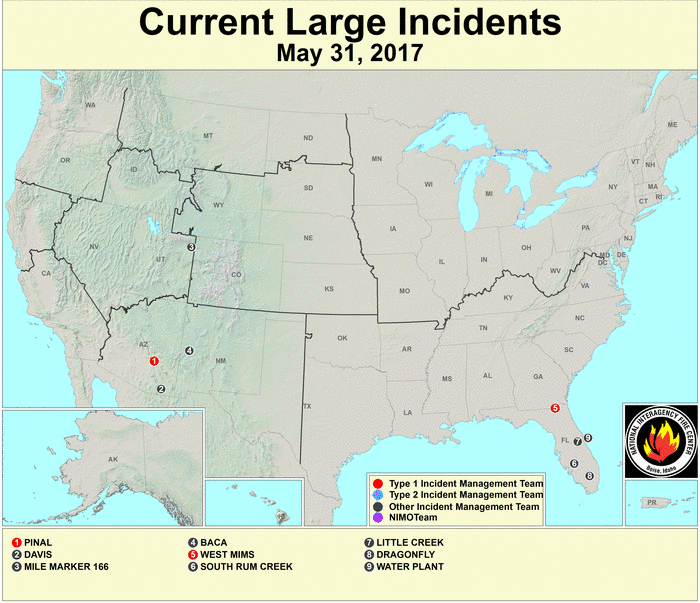
- Drought and abnormal dryness contracted in the Southeast, except in Florida where moderate and extreme (D3) drought expanded — This was reflected in evapotranspiration (Evaporative Drought Demand Index [EDDI] and ESI), groundwater (GRACE and USGS observations), streamflow, soil moisture (NLDAS top soil and total soil moisture, GRACE root zone and surface soil moisture, CPC model, VIC model, SMOS satellite-based analysis), and CMI (weeks 1, 2, 3, 4, 5) indicators. Several large wildfires burned throughout the month in Florida (wildfire maps for May 5, 19, 31). According to May 30th USDA reports, 72 percent of the topsoil moisture and 67 percent of the subsoil moisture was short to very short in Florida, and 50 percent of the pasture and rangeland was in poor to very poor condition.
- Abnormal dryness expanded in the southern Plains, and moderate drought contracted in some areas and expanded in others — This was reflected in evapotranspiration (EDDI), groundwater (GRACE observations), streamflow, soil moisture (NLDAS top soil and total soil moisture, GRACE root zone and surface soil moisture, VIC model, SMOS satellite-based analysis), and CMI (weeks 1, 2, 3, 4, 5) indicators. According to May 30th USDA reports, 43 percent of the topsoil moisture and 36 percent of the subsoil moisture was short to very short in Texas, but only 13 percent of the pasture and rangeland was in poor to very poor condition.
- Moderate drought and abnormal dryness expanded in parts of the central Rockies and Southwest — This was reflected in groundwater (GRACE observations), streamflow, soil moisture (NLDAS top soil and total soil moisture, GRACE root zone and surface soil moisture, VIC model), and CMI (weeks 1, 2, 3, 4, 5) indicators. A few large wildfires burned throughout the month in parts of the Southwest (wildfire maps for May 5, 19, 31). According to May 30th USDA reports, 62 percent of the topsoil moisture and 56 percent of the subsoil moisture was short to very short in New Mexico, with the statistics 50 percent for both topsoil and subsoil moisture in California. The USDA reports indicated that pasture and rangeland was in poor to very poor condition for 29 percent of New Mexico.
- Abnormally dry to moderate drought conditions persisted across parts of Hawaii.
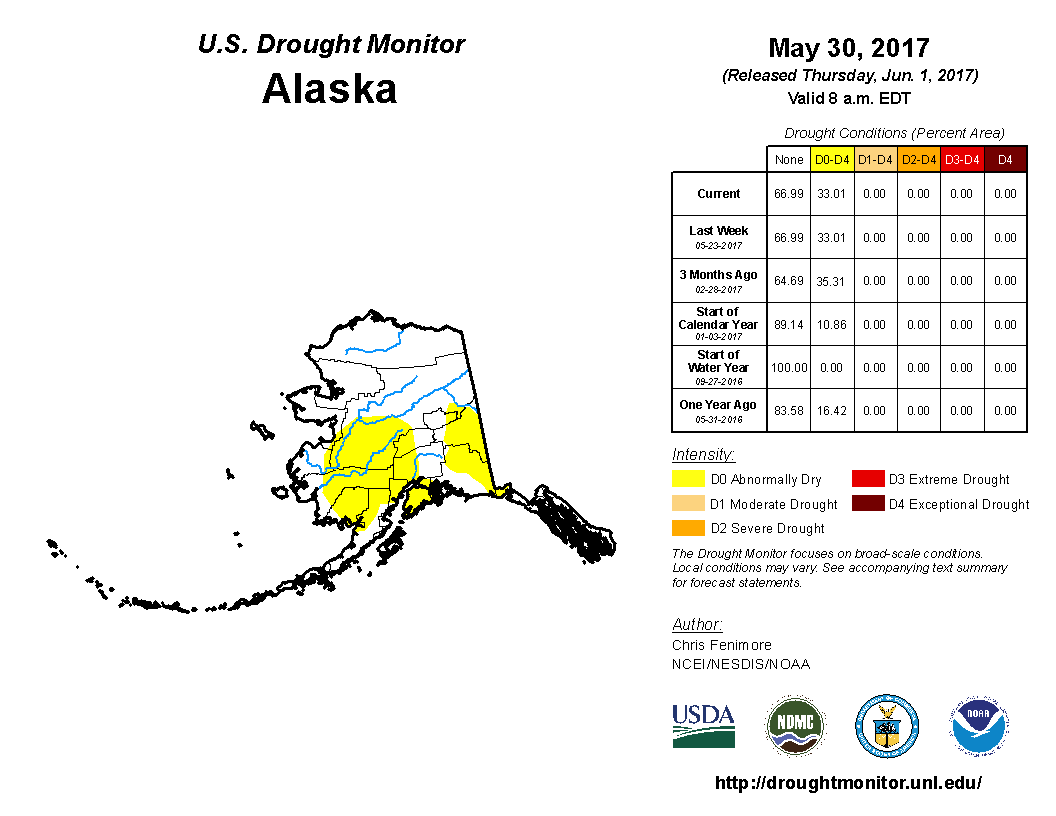
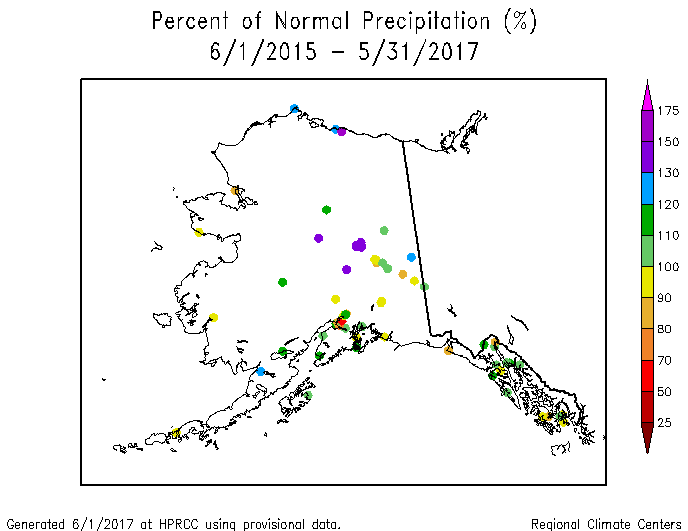
- Abnormal dryness persisted across a significant portion of Alaska.
![Evaporative Drought Demand Index [EDDI]](/monitoring-content/sotc/drought/2017/05/EDDI_01mn_20170526.png)
Palmer Drought Index
The Palmer drought indices measure the balance between moisture demand (evapotranspiration driven by temperature) and moisture supply (precipitation). The Palmer Z Index depicts moisture conditions for the current month, while the Palmer Hydrological Drought Index (PHDI) and Palmer Drought Severity Index (PDSI) depict the current month's cumulative moisture conditions integrated over the last several months. While both the PDSI and PHDI indices show long-term moisture conditions, the PDSI depicts meteorological drought while the PHDI depicts hydrological drought. The PDSI map shows less severe and extensive drought in parts of the northeastern and southeastern U.S. than the PHDI map because the meteorological conditions that produce drought and wet spell conditions are not as long-lasting as the hydrological impacts.
|
 |
Used together, the Palmer Z Index and PHDI maps show that short-term dry conditions occurred across much of southern Florida and the northern and southern Plains, and parts of the West. This short-term dryness reduced long-term wet conditions in the northern Plains and parts of the West compared to the end of April. Short-term wet conditions reduced long-term drought conditions from eastern Texas to the Carolinas and much of the Northeast.
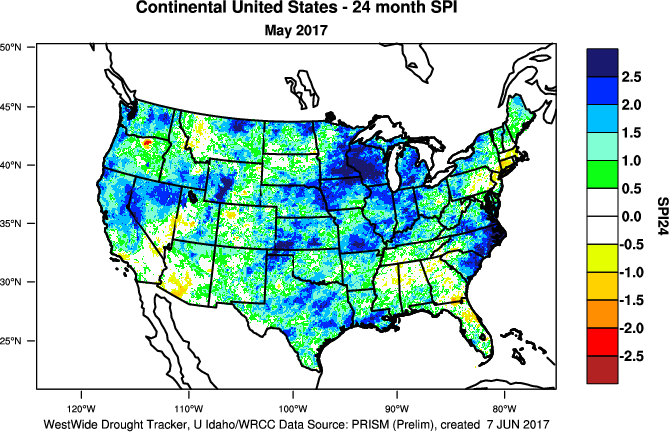
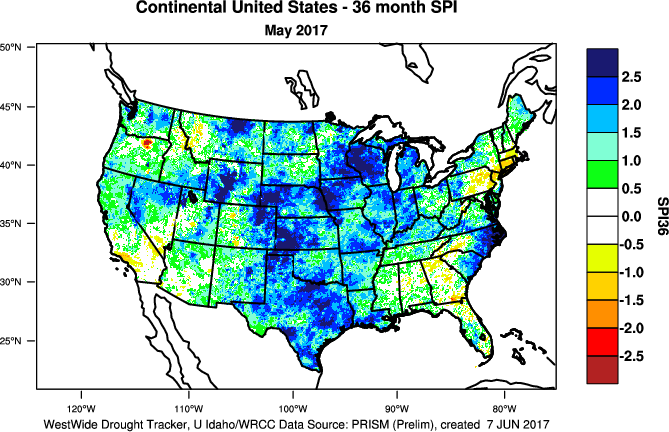
Standardized Precipitation Index
The Standardized Precipitation Index (SPI) measures moisture supply. The SPI maps here show the spatial extent of anomalously wet and dry areas at time scales ranging from 1 month to 24 months.
 |
 |
 |
The SPI maps illustrate how moisture conditions have varied considerably through time and space over the last two years. May 2017 (the 1-month SPI map) showed contrasting areas of wetness and dryness. The dryness in the northern Plains at the 1-month time scale was a continuation of dryness which extended out to the 6-month time scale, with a few areas dry at the 9- and 12-month time scales. Parts of the West (especially the Southwest) were dry at the 1- to 3-month time scales. Much of Florida has dryness at the 2- to 12-month time scales, with parts of the state dry also at the 1- and 24-month time scales. Wetness dominates parts to most of the Southeast at the 1- to 3-month time scales. But dryness is still evident at 9 to 12 months, and even 24 months for parts of Alabama and Mississippi. Much of the southern Plains was dry for May, but dryness is limited to just parts of the region at the 2- to 3-month time scales and last 9 to 12 months. Wetness dominates the Northeast for the last 1 to 6 months, but southern New England to Maryland still has dry conditions (precipitation deficits) at the 9- to 24-month time scales. Otherwise, wet conditions dominate much of the country at all time scales.
 |
 |
 |
Standardized Precipitation Evapotranspiration Index
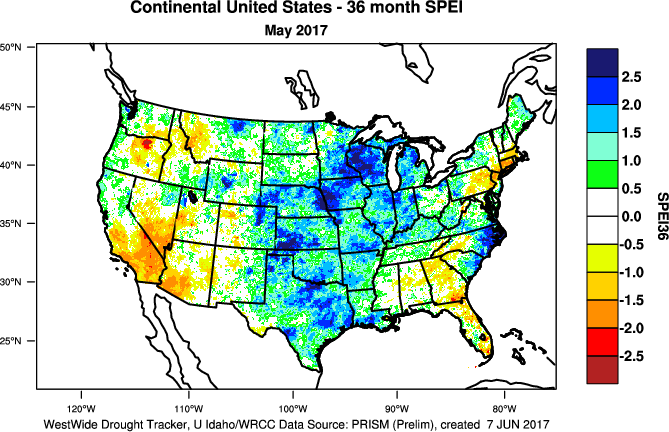
The SPI measures water supply (precipitation), while the SPEI (Standardized Precipitation Evapotranspiration Index) measures the combination of water supply (precipitation) and water demand (evapotranspiration as computed from temperature). Warmer temperatures tend to increase evapotranspiration, which generally makes droughts more intense.
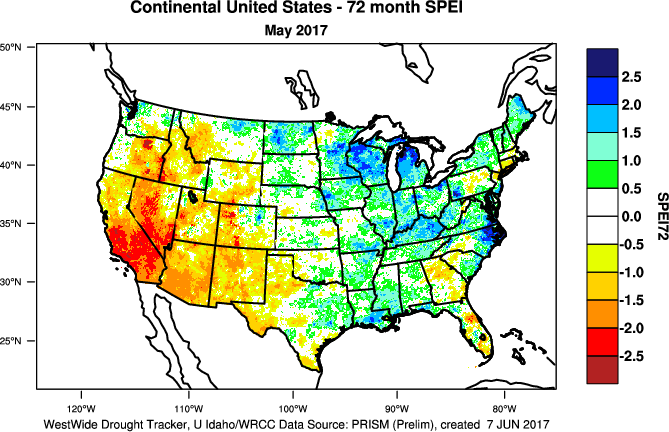 72-month SPEI for current month.
|
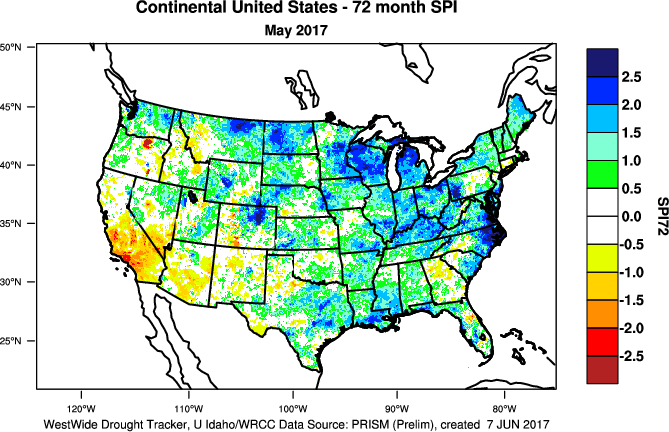 72-month SPI for current month.
|
Temperatures during May 2017 were below normal across a large part of the country from the Southwest and southern Plains to the Northeast. Only parts of the Southeast and West Coast to northern Rockies were near to warmer than normal. But at longer time scales (out to the last 12 to 72 months), above-normal temperatures prevail (except in the Northwest). Warmer-than-normal temperatures worsen drought conditions where low precipitation occurs (SPEI maps for last 12, 24, 36, 48, 60, 72 months) (SPI maps for last 12, 24, 36, 48, 60, 72 months). This is especially evident in the Southeast at 12 months, southern New England at 12 to 48 months, and Southwest (especially California) at 24 to 72 months.
 72-month SPEI for California, May, 1895-2017.
|
 72-month SPI for California, May, 1895-2017.
|
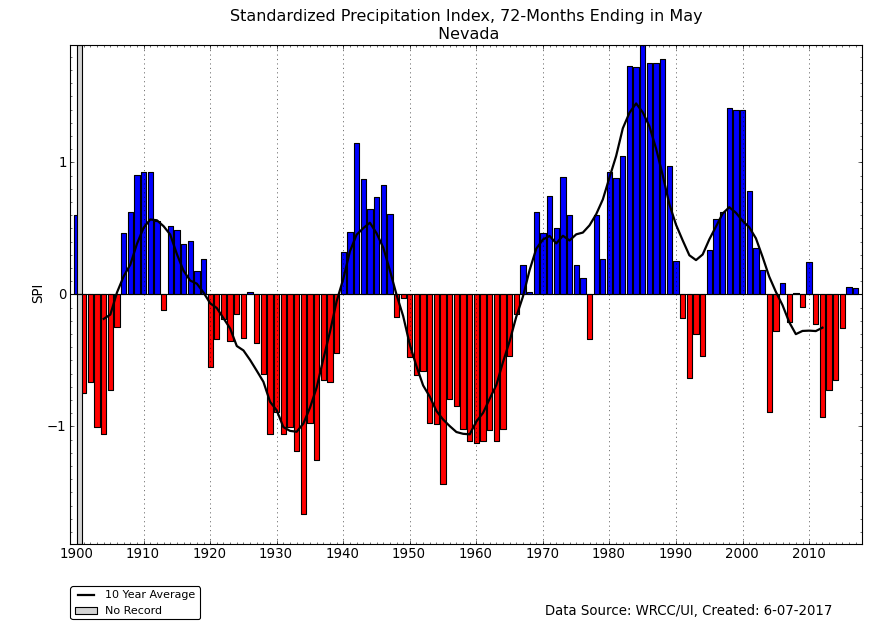
In California, the last 12 months have been wet, but most of the previous 15 years have been dry. The dryness has been compounded by persistent and unusually warmer-than-normal temperatures; this has been occurring for the last 35 years, but especially for the last three to four years when record to near-record warmth occurred. The heat has increased evapotranspiration and exacerbated drought conditions. While the 72-month SPI registered dryness, it was nowhere near record. However, the 72-month SPEI for the last 72 months was second driest on record; last year's 72-month SPEI was record dry. Likewise, in Nevada, the 72-month SPI was near zero, indicating near-normal precipitation, but the 72-month SPEI for 2017 tied with 2004 as the driest on record.
Regional Discussion
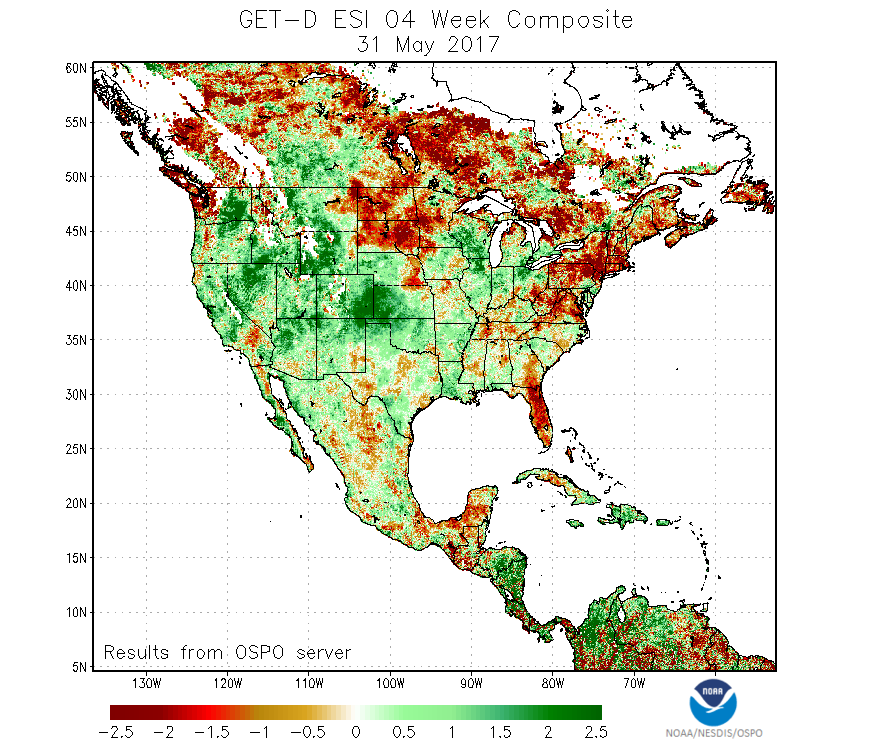 NOAA ESI map
|
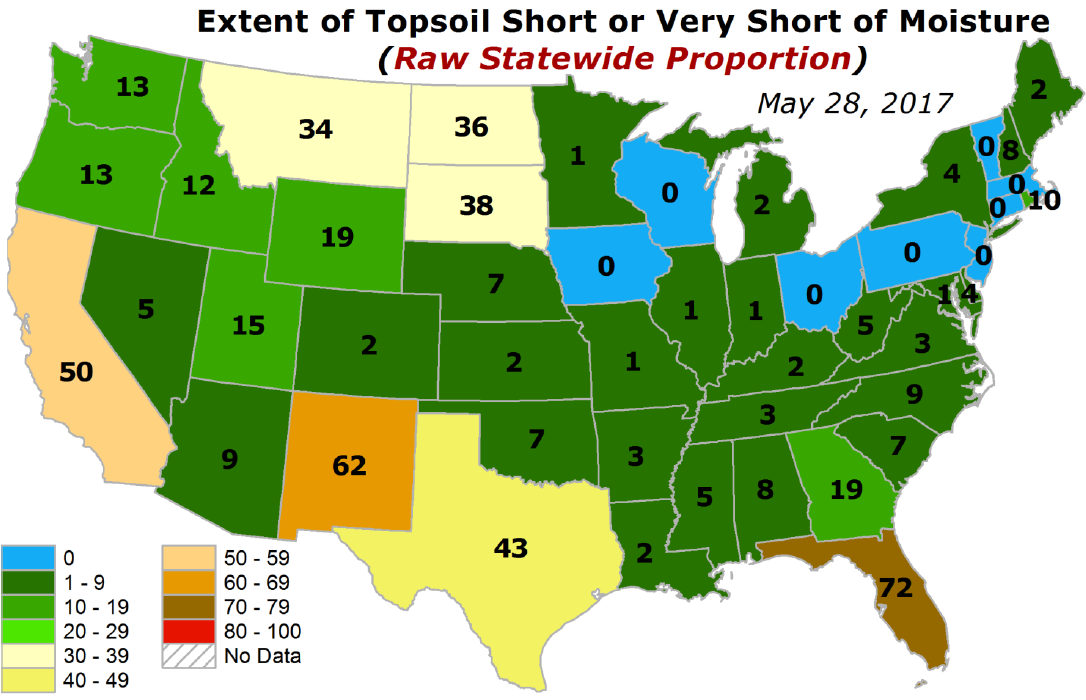 USDA soil moisture conditions
|
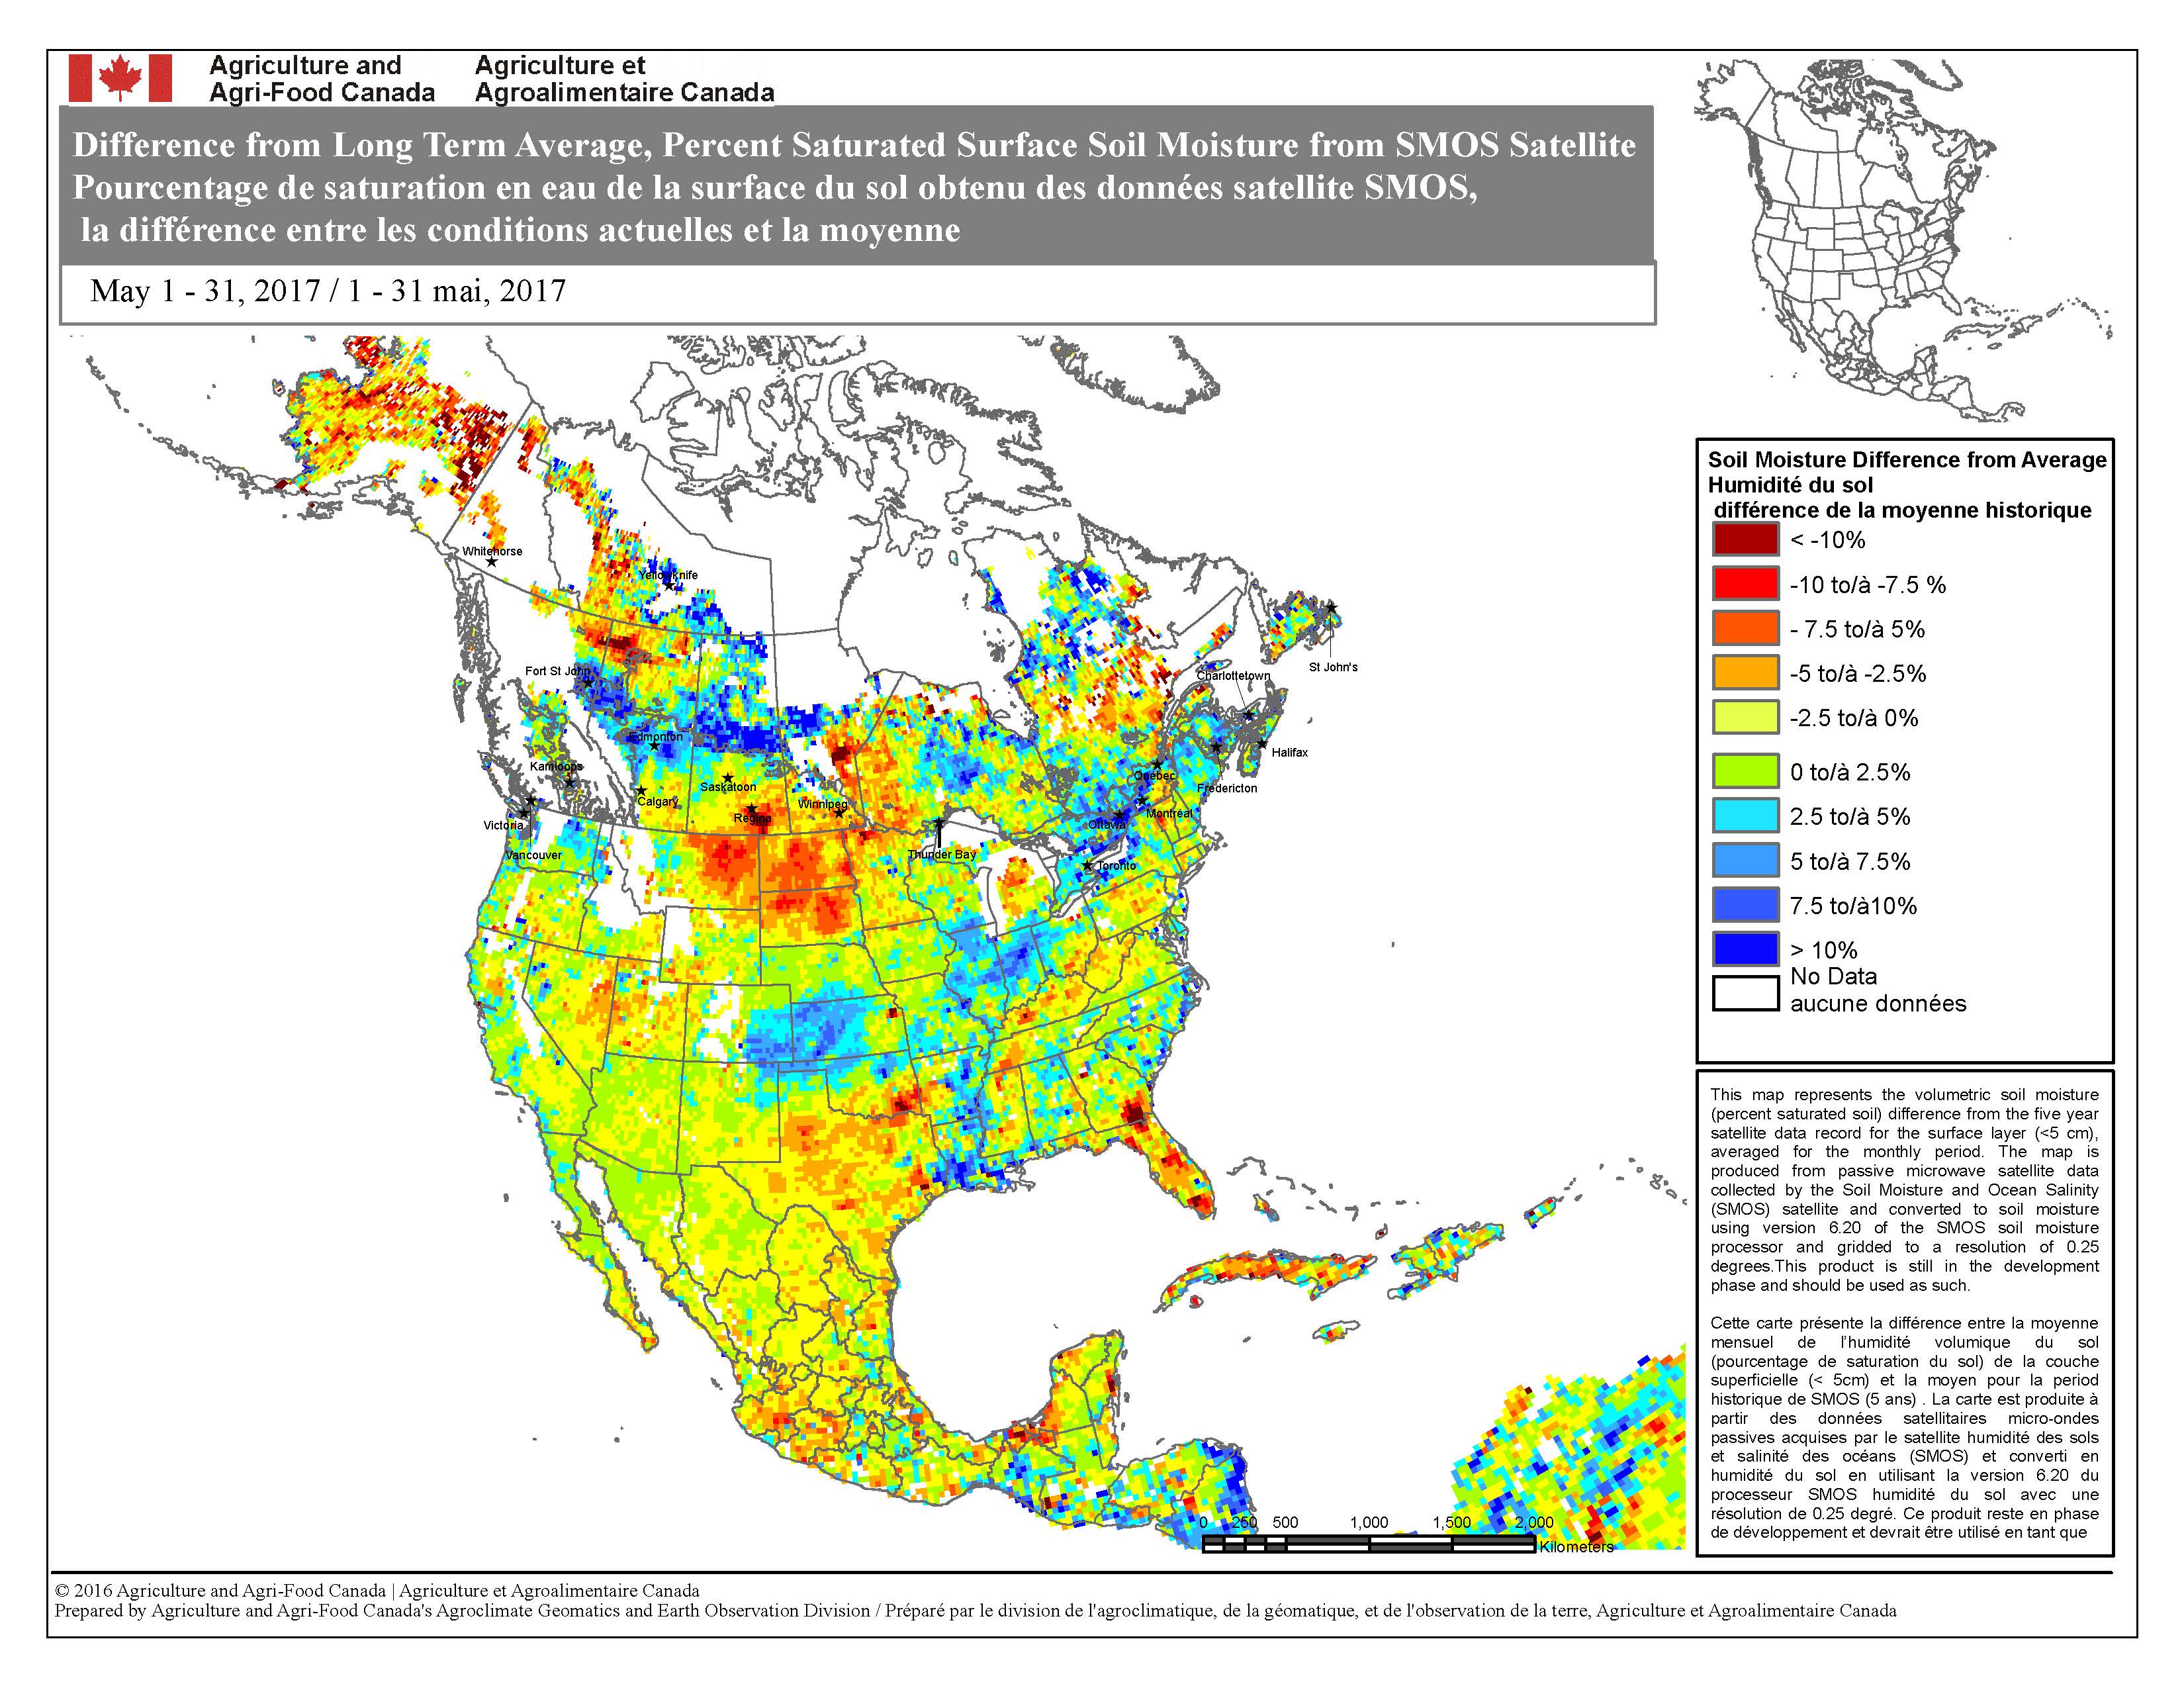 SMOS soil moisture percentiles
|
CONUS Agricultural & Hydrological Impacts:
Drought conditions at the end of May 2017 were reflected in a number of meteorological, hydrological, and agricultural indicators, both observed and modeled. These include: evapotranspiration (EDDI and ESI), groundwater (GRACE and USGS observations), streamflow, number of rain days and consecutive dry days, soil moisture (NLDAS top soil and total soil moisture, GRACE root zone and surface soil moisture, CPC model, Leaky Bucket model, VIC model, SMOS satellite-based analysis, USDA observations), and CMI (weeks 1, 2, 3, 4, 5). On a national scale, as of May 30th, 2017, very little of the agricultural areas of the CONUS were affected by drought — only five percent of hay acreage and cattle inventory, three percent of corn and soybean production, and one percent of winter wheat production. All of these except wheat were slightly higher than the values for the end of April. As noted by the USDA, only 15 percent of the nation's winter wheat, 6 percent of spring wheat, and 10 percent of the nation's pasture and rangeland were in poor to very poor condition. On a national scale, only 14 percent of the nation's topsoil and 12 percent of subsoil were short or very short of moisture. But, as seen earlier, conditions were more extreme on a statewide basis.
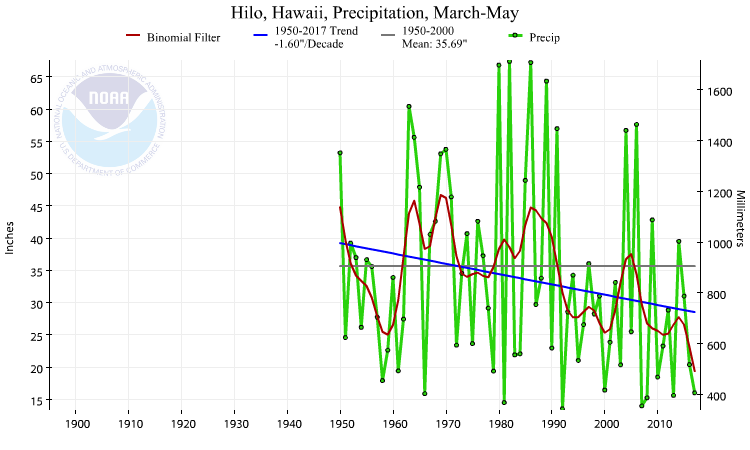
Hilo, Hawaii, precipitation, March-May, 1950-2017.
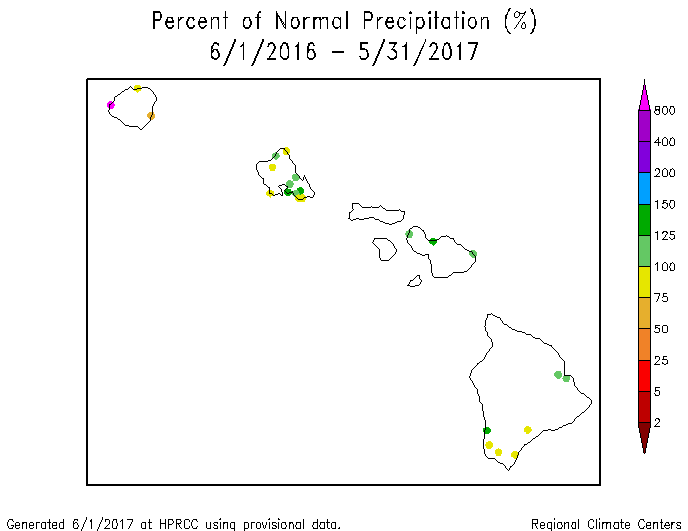
Hawaii: May 2017 had a mixed precipitation anomaly pattern across the Hawaiian Islands. The last 2 to 3 months were wetter, except over the Big Island. Hilo, for example, had the seventh driest March-May in the 1950-2017 record. Drier-than-normal conditions tended to dominate the anomaly pattern for the last 5, 6, and 8 months. A mixed anomaly pattern was evident at longer time scales (last 11, 12, 24, 36 months). On the USDM map, abnormally dry conditions contracted and severe drought conditions disappeared this month; moderate drought continued to cover about a fourth of the state on the May 30th, 2017 USDM map.
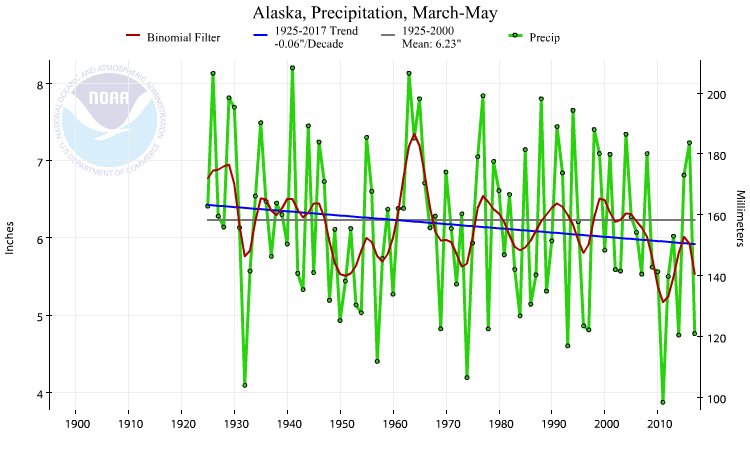
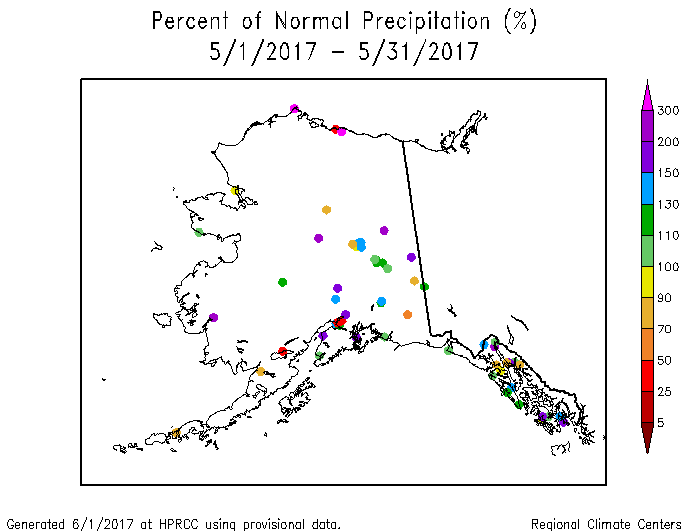
Alaska statewide precipitation, March-May, 1925-2017.
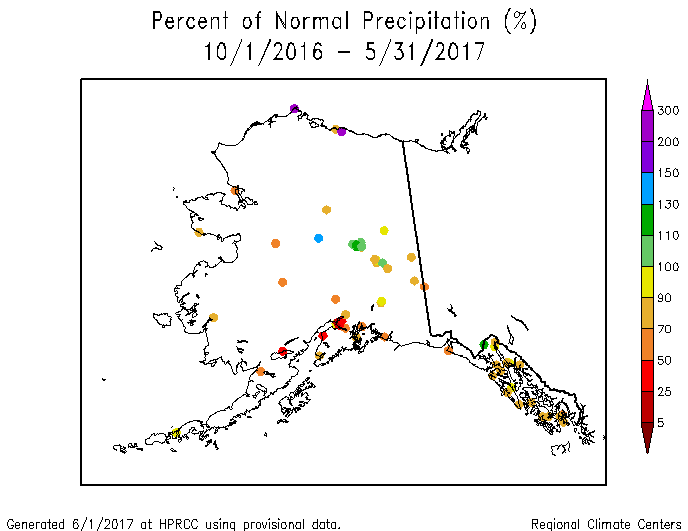
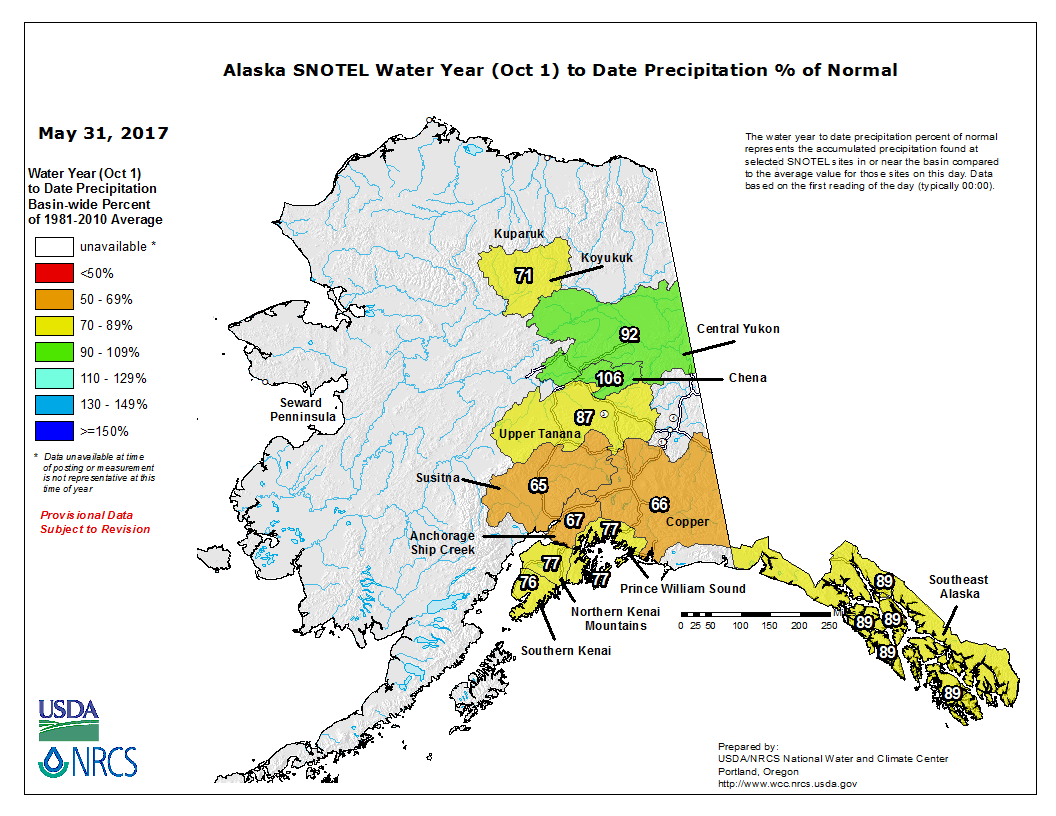
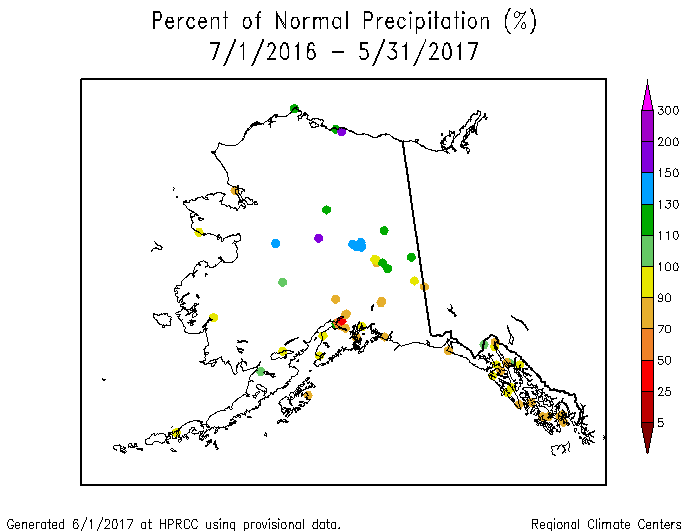
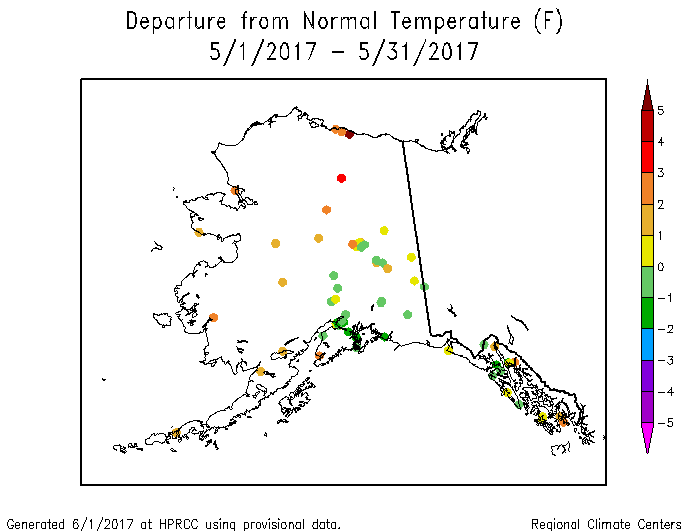
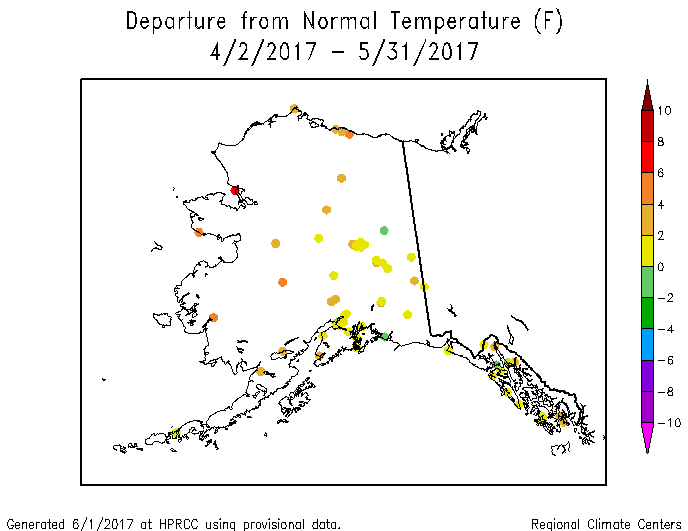
Alaska: May 2017 had a mixed precipitation anomaly pattern across Alaska, especially for the high elevation (SNOTEL) stations; the low elevation stations, climate division analysis, and gridded analysis were mostly wetter than normal. Drier-than-normal conditions became more widespread during April-May and dominated the pattern for spring (March-May) (low elevation stations, climate division analysis, and gridded analysis). On a statewide basis, Alaska had the seventh driest spring in the 1925-2017 record. January-May was generally drier than normal in the west and south and wetter than normal in the north and east (low elevation stations, climate division analysis, and gridded analysis). The last six months had a similar pattern (low elevation stations, climate division analysis, and gridded analysis). Drier-than-normal conditions dominated for the water year to date (October 2016-May 2017) (low elevation stations, SNOTEL stations and basins), with Alaska having the fourth driest October-May on record, statewide. Wetter-than-normal conditions dominated the anomaly pattern for the last 11, 12 (low elevation stations, climate division analysis), 24, and 36 months. May was warmer than normal across most of the state, with some cooler-than-normal stations in the southeast (low elevation stations, climate division analysis, and gridded analysis). Warmer-than-normal temperatures dominated for April-May, but the temperature anomaly pattern became mixed at some longer time scale analyses — last 3 (low elevation stations, climate division analysis, and gridded analysis), 5 (low elevation stations, climate division analysis, and gridded analysis), 6 (climate division analysis, and gridded analysis), and 12 (low elevation stations, climate division analysis) months. Mountain snowpack and snow water content were below normal at most stations and basins, and below-normal streamflow was beginning to show up at a few streams. About a third of the state continued abnormally dry on the May 30th USDM map.

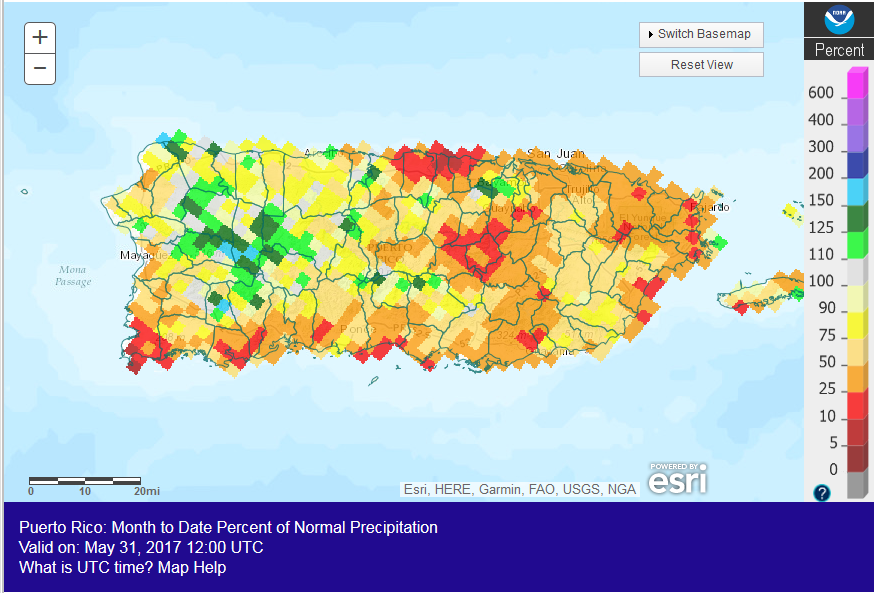
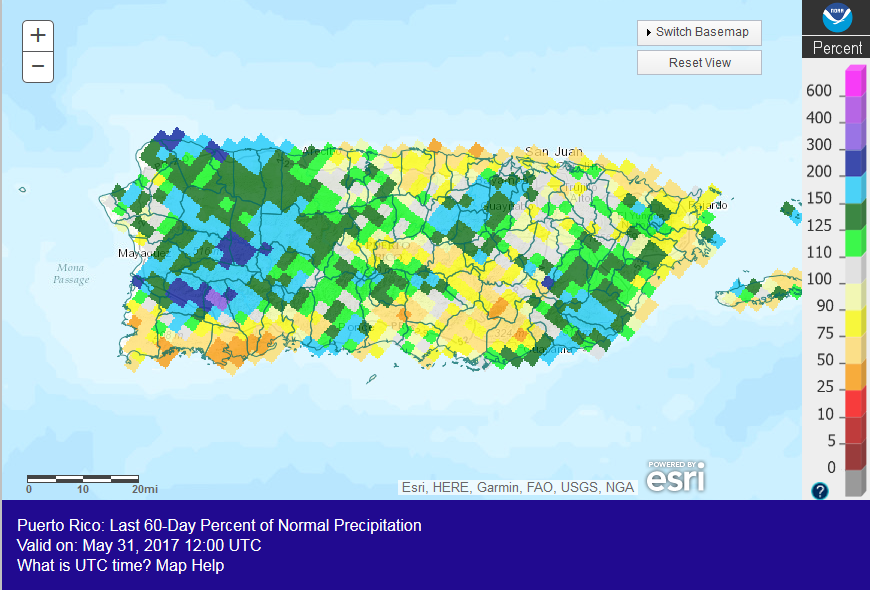
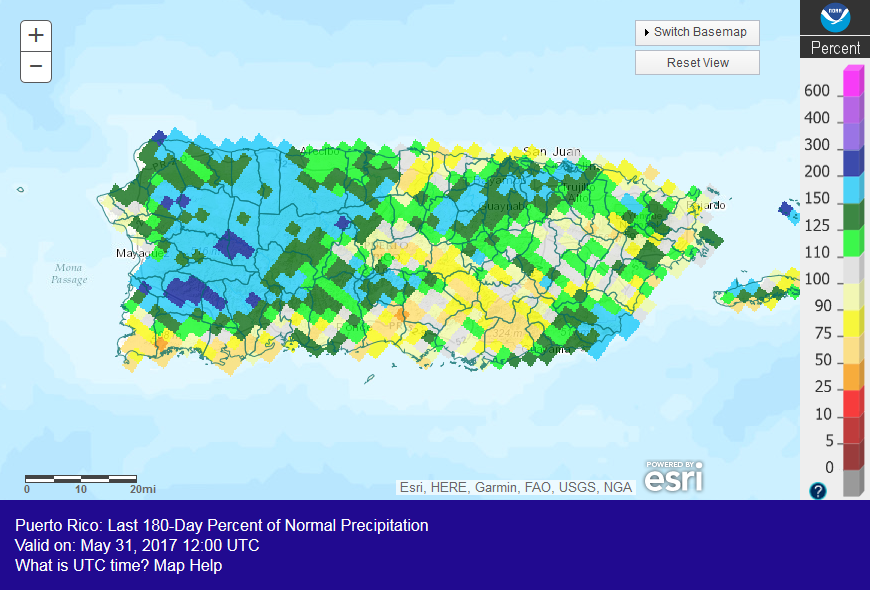
San Juan, Puerto Rico, precipitation, May, 1956-2017.
Puerto Rico: Puerto Rico was drier than normal during May, with San Juan having the 19th driest May in the 1956-2017 record. A mixed precipitation anomaly pattern was evident for the last 2, 5, and 6 months, but a wetter-than-normal pattern dominated at the 3- and 8-month time scales. Soils were a little dry along the southern coast but streamflow was above normal across the island. Puerto Rico was free of abnormal dryness and drought on the May 30th, 2017 USDM map.
CONUS State Precipitation Ranks:
|
|
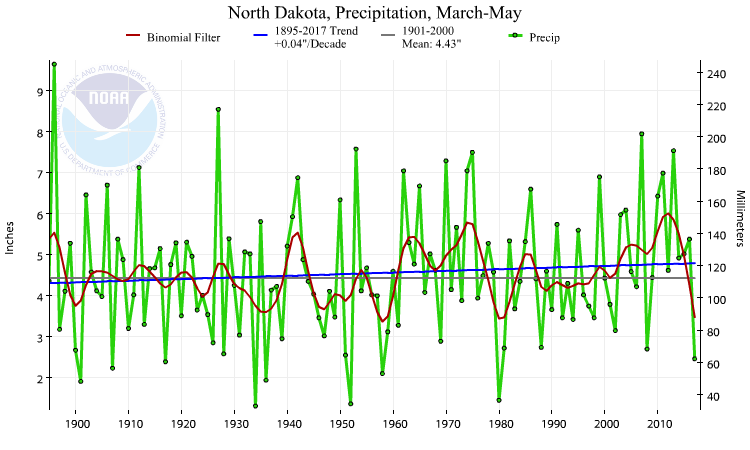
May 2017 was drier than normal across much of the West and parts of the northern and southern Plains. On a statewide basis, eight states ranked in the driest third of the historical record but none were in the top ten driest category. At the 3-month time scale, dryness was evident in the northern Plains and parts of the Southwest and Southeast. Four states ranked in the driest third of the 1895-2017 record, including North Dakota which had the ninth driest March-May. The dryness persisted at the 5-month time scale in the northern Plains and Florida, with three states ranking in the driest third of the historical record, including (once again) North Dakota which had the ninth driest January-May.
Wet conditions dominated at the 6-month time scale, with only two states ranking in the driest third of the historical record for December-May. The last 12 months were drier than normal across much of the Southeast and southern New England and parts of the northern Plains, with six states ranking in the driest third of the historical record for June-May.
 Primary Corn and Soybean Belt precipitation, May, 1895-2017.
|
 Primary Corn and Soybean Belt precipitation, March-May, 1895-2017.
|
May 2017 was generally cooler and wetter than normal across most of the Primary Corn and Soybean agricultural belt. The month ranked as the 30th wettest and 49th coolest May, regionwide, in the 1895-2017 record. March marks the beginning of the growing season for the Primary Corn and Soybean agricultural belt. March-May 2017 was warmer and wetter than normal across the region, ranking as the 18th warmest and 13th wettest March-May, regionwide, on record.
For the Primary Hard Red Winter Wheat agricultural belt, May 2017 was cooler than normal across the region and wetter than normal in the north and drier than normal in the south. The month ranked as the 47th wettest and 38th coolest May, regionwide, in the 1895-2017 record. October serves as the beginning of the growing season. October 2016-May 2017 was warmer than normal across the region and wetter than normal across much of the region, ranking as the third warmest and 24th wettest October-May, regionwide, on record.
NOAA Regional Climate Centers:
A more detailed drought discussion, provided by the NOAA Regional Climate Centers and others, can be found below.
As described by the High Plains Regional Climate Center, wet conditions continued in May for parts of the High Plains region, including eastern Colorado, western and central Kansas, and much of Nebraska. The pattern of near-normal temperatures experienced by much of the region in April continued into May in the High Plains, although temperatures tended to be more on the cool side. The spring season, which is defined as the March-May period, was very wet for these areas and for central Wyoming as well. Despite near-normal temperatures in April and May, the impressive warmth of March caused most of the region to have a warmer-than-normal spring. A negative impact of this type of pattern was plants and crops emerged early, then were subjected to sub-freezing temperatures while at growth stages that cannot sustain those types of temperatures for a long period of time. The wet spring and untimely cool temperatures contributed to several problems in the agricultural fields in Kansas and Nebraska. Rocky Mountain snowpack was impressive this season, as Snow Water Equivalent (SWE) in the Upper Missouri Basin was above normal for most of the season and snowpack peaked two weeks later normal in late April/early May.
It was dry across much of the Dakotas during the spring, and precipitation deficits accumulated quickly. The drought depiction for the High Plains changed drastically during May, as both improvements and degradations occurred throughout the region. The area in drought or abnormal dryness (D0-D4) only increased from 20 percent to 25 percent during the month, but a closer look at several parts of the region revealed that conditions changed quickly. According to the USDM, drought spread rapidly across the Dakotas in May as impacts became more apparent. Much of this region had a dry spring, and the central Dakotas received no more than 50 percent of normal precipitation. The below-normal spring temperatures delayed planting and slowed crop growth in this region. Poor water quality in stock ponds, stressed winter wheat, and poor growth in seasonal grasses were reported in northern South Dakota/southern North Dakota. However, fall moisture was helping some areas get through the dry spring, and the dryness was welcomed by producers conducting field work. During the month of May, the percent of topsoil moisture rated short to very short increased from 7 percent to 36 percent in North Dakota and from 12 percent to 38 percent in South Dakota. In contrast, improvements in drought and dryness occurred throughout Kansas, Nebraska, Colorado, and Wyoming. These states experienced excessively wet conditions during much of the spring, which alleviated the dryness. As of the end of May, Colorado, Nebraska, and Kansas were drought free, and less than one percent of Wyoming was experiencing drought.
As explained by the Southern Regional Climate Center, May was cooler than normal for all states in the Southern region besides Tennessee, and monthly precipitation values varied spatially across the region. Precipitation totals in parts of eastern Texas, southern Louisiana, and southern Mississippi were 300 percent of normal. In contrast, conditions were quite dry across north, central, and western Texas, southern Oklahoma, southwest Arkansas and west central Mississippi with stations reporting between 5 to 70 percent of normal. All states had clusters of normal, below normal and above normal levels of precipitation values. Over the month, drought conditions improved for some parts of the region, such as areas in eastern Oklahoma, northern Louisiana, and western Arkansas. There were areas in northern Texas and a few counties in central Texas the entered moderate drought. Northeastern Mississippi stayed in moderate drought conditions from April into May. During the month of May, all of Tennessee and most of Oklahoma, Arkansas, and Louisiana experienced normal conditions. At this time, there are no areas experiencing extreme or exceptional drought.
As summarized by the Midwest Regional Climate Center, May precipitation was plentiful in much of the Midwest but there were also locations that received less than normal amounts. Totals ranged from under 50 percent of normal in northwestern Minnesota to more than 150 percent of normal in locations across all nine Midwest states. May temperatures averaged to near normal for much of the Midwest. There was no drought in the region during May according to the USDM. The month began with no areas of abnormally dry conditions in the region for the first time since May 2002. Abnormally dry conditions developed across northwestern Minnesota as the month went on, ending the month with about 5 percent of the region affected.
As noted by the Southeast Regional Climate Center, temperatures were near average across much of the Southeast region (including Puerto Rico and the U.S. Virgin Islands) during May. Only ten long-term (i.e., period of record equaling or exceeding 50 years) stations across the region observed May mean temperatures that were ranked within their top 5 warmest values on record, including stations in Florida and North Carolina. Precipitation was well above normal across much of the region during May, but a few areas of unusual dryness were also observed. The driest locations were found across portions of the Florida Peninsula, Puerto Rico, and the U.S. Virgin Islands, where monthly precipitation totals were to 10 to 50 percent of normal. In contrast, the wettest locations were found across much of Georgia, the Carolinas, Virginia, east-central and southern Alabama, the Florida Panhandle, and portions of the Florida Peninsula. Indeed, every state across the region had at least one station (including CoCoRaHS) that observed 10 inches (254 mm) of precipitation or greater during the month.
While drought conditions were nearly or totally eliminated from several states across the region, portions of Georgia and Florida remained in moderate-to-extreme (D1-D3) drought during May. Persistent rainfall in early May removed lingering areas of moderate drought in North Carolina and Virginia. Drought conditions were nearly eliminated in Alabama during the month, as the coverage of moderate-to-severe (D1-D2) drought decreased from 32 percent on May 2nd to less than 1 percent on May 30th. Only a few small areas of moderate drought remained in South Carolina, and the coverage of moderate-to-severe drought was significantly reduced across portions of northern and central Georgia, including the removal of extreme drought in the northeastern corner of the state. In contrast, moderate-to-severe drought persisted over much of southern Georgia, while moderate-to-extreme drought continued to intensify and expand across Florida, covering nearly 72 percent of the state for the first time since February 2013. Much-below-normal streamflows and soil moisture persisted across southern Georgia and Florida due to a lack of rainfall. An extremely active wildfire season continued across Florida, with over 550 wildfires reported and nearly 60,000 acres burned during the month. Pastures remained thin and drought-damaged across southern portions of the region, with harmful armyworms reported in areas of Alabama and Georgia. Many livestock producers in Florida continued to feed hay and haul in water from outside the state. Above-average precipitation during May and much of spring contributed to a successful first cutting of hay across the northern half of the region, but some livestock producers in North Carolina reported unusually thin yields due to the recent drought. Persistent rainfall during early and late May stalled crop planting and winter wheat harvesting across much of the region. Some corn and tobacco had to be replanted in North Carolina and Virginia, as heavy rainfall saturated fields and leached soil nutrients. However, farmers in Georgia and South Carolina reported that the rainfall at the end of the month was timely for the corn crop, which had begun to silk and tassel. Hundreds of acres of tomato and watermelon crops in southwestern Florida were destroyed by an extreme infestation of whiteflies, which was attributed to warm and dry weather during spring as well as an unseasonably warm winter across the state.
As explained by the Northeast Regional Climate Center, May was colder and wetter than normal in the Northeast. The USDM released on May 4 indicated 3 percent of the Northeast was in a moderate drought, with another 8 percent being abnormally dry. Above-normal precipitation in April and May eased drought conditions so that by mid-May, the region became free of drought for the first time since April 2016. However, abnormally dry conditions lingered in parts of Pennsylvania and Connecticut through the month. May average streamflow was near to above normal. Groundwater and reservoir levels were near to above normal in many areas, but below-normal levels remained in a few spots. With improving conditions, drought declarations eased in several states.
As summarized by the Western Regional Climate Center, characteristic of the transition from spring to summer, periods of dry and above normal temperatures alternated with wetter conditions and below normal temperatures during May. Temperatures averaged to near normal across most of the West, and only a small area of the eastern Sierra Nevada and a swath of the Southwest observed well above normal precipitation.
Warmer than average conditions were observed along the northern tier of the region as well as in Nevada, Oregon, and northern and central California. May temperatures were slightly cooler than average across much of the Four Corners states as well as parts of Utah, Wyoming, and southern California. Large areas of the West observed below normal precipitation, particularly in northern and central California, eastern Oregon, Nevada, eastern Montana, southern New Mexico and Utah. Moderate drought conditions persisted in southern California and southern Arizona this month as well as expanded in the southern Arizona-New Mexico border area. Abnormally dry conditions were noted in the USDM in a large area of northeastern Montana. Precipitation was near normal for much across Washington as well as western Oregon, southwestern Montana, and southern Wyoming. Well above normal precipitation was observed in a broad swath stretching from southern California across northern Arizona and into eastern Colorado, mostly resulting from a slow-moving cutoff low-pressure system that moved through the area May 7-10. Some of these areas typically receive little May precipitation, so percentages of normal are quite high despite relatively low precipitation totals. Above normal May precipitation helped alleviate a small area of drought conditions in Colorado, leaving the state drought-free in the USDM at month's end.
In Alaska, May was slightly wetter than normal with near-normal temperatures. Most stations received at least 75% of normal May precipitation and many recorded above normal. Temperatures were above normal in the northern portion of the state; south of the Alaska Range, temperatures were below normal, especially in coastal southeast Alaska.
Further south, an unseasonably late Kona low brought precipitation and flash flooding to Maui and Big Island in Hawaii. Aside from this event, conditions were generally near normal or drier than normal across the state. Kahului, Maui, observed a total of 0.08 in (2 mm) rainfall, 11% of normal and Lihue, Kauai reported 1.58 in (40 mm), 76% of normal. Temperatures were near to slightly above normal for most of the state; however, Lihue reported an average temperature of 77.9 F (25.5 C), 2.1 F (1.2 C) above normal and the 4th warmest since records began in 1950.
Pacific Islands: The NOAA National Weather Service (NWS) offices, the Pacific ENSO Applications Climate Center (PEAC), and partners provided reports on conditions across the Pacific Islands.
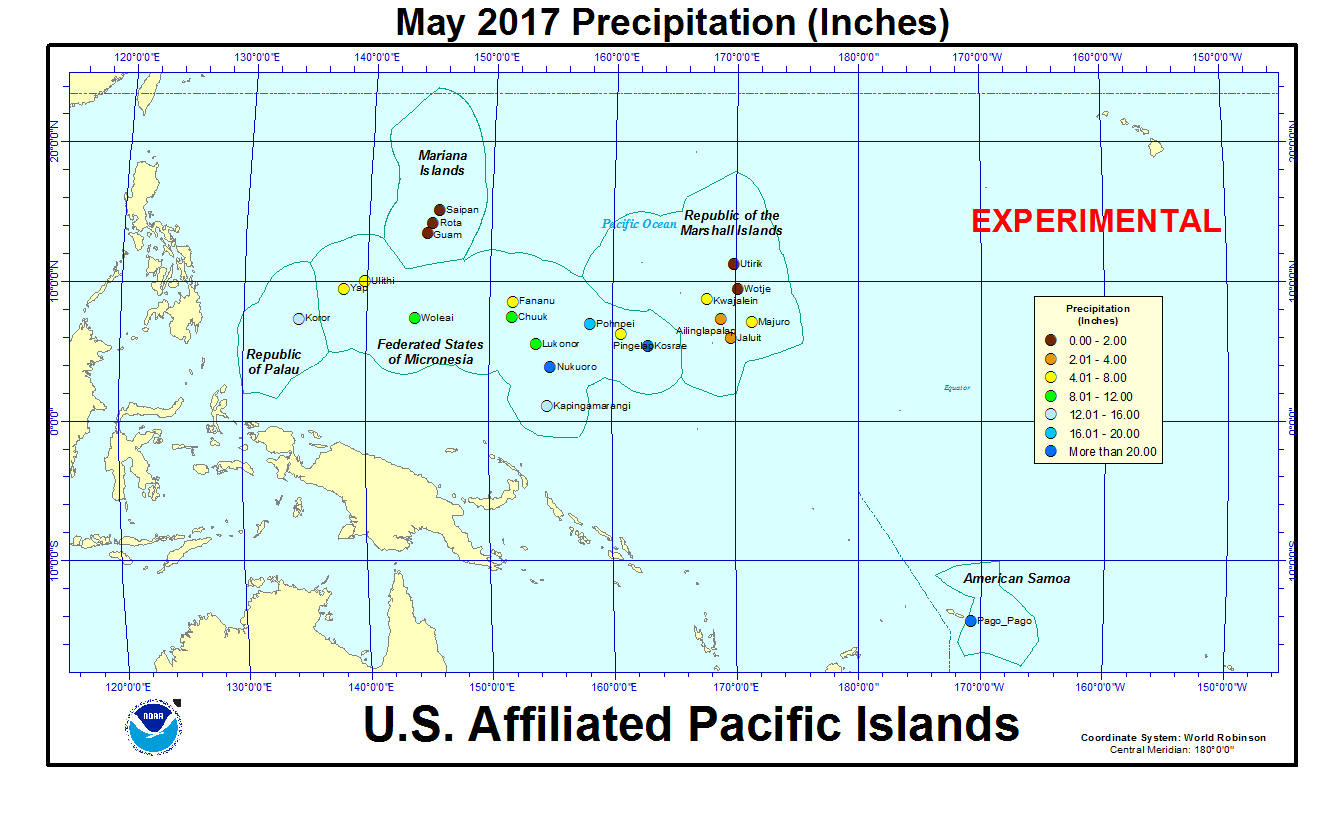
In the U.S. Affiliated Pacific Islands (USAPI) (maps — Federated States of Micronesia, Northern Mariana Islands, Marshall Islands, Republic of Palau, American Samoa, basinwide), May 2017 was drier than normal at Chuuk, Guam, Kwajalein, Lukonor, Majuro, Pohnpei, Saipan, and Yap, and wetter than normal at Kapingamarangi, Koror, Kosrae, and Pago Pago.
Rainfall amounts were below the minimum thresholds (4 or 8 inches) required to meet most monthly water needs at Guam, Rota, and Saipan (in the Mariana Islands); Yap, Ulithi, Pingelap, and Fananu (in the Federated States of Micronesia [FSM]); and Ailinglapalap, Jaluit, Kwajalein, Majuro, Utirik, and Wotje (in the Marshall Islands [RMI]). May rainfall was above the monthly minimum thresholds at the rest of the regular reporting stations in Micronesia. The 4- and 8-inch thresholds are important because, if monthly precipitation falls below the threshold, then water shortages or drought become a concern.
Significant dryness has developed in the northern Marshall Islands since December 2016, with four of the last six months having less than 2 inches each at Utirik and Wotje. The last two months were the second driest April-May at Utirik out of 15 years of data. The dryness spread across the rest of the RMI stations during May, with Jaluit having the driest May in 34 years of data, Ailinglapalap the second driest in 34 years of data, and Majuro fifth driest in the 63-year record. The National Weather Service office on Guam issued a revised Drought Information Statement on June 8 which noted that drought is a serious concern for the northern Marshall Islands following an April 24th declaration of a state of emergency by the President of the RMI for the northern atolls and islands affected by the dry conditions.
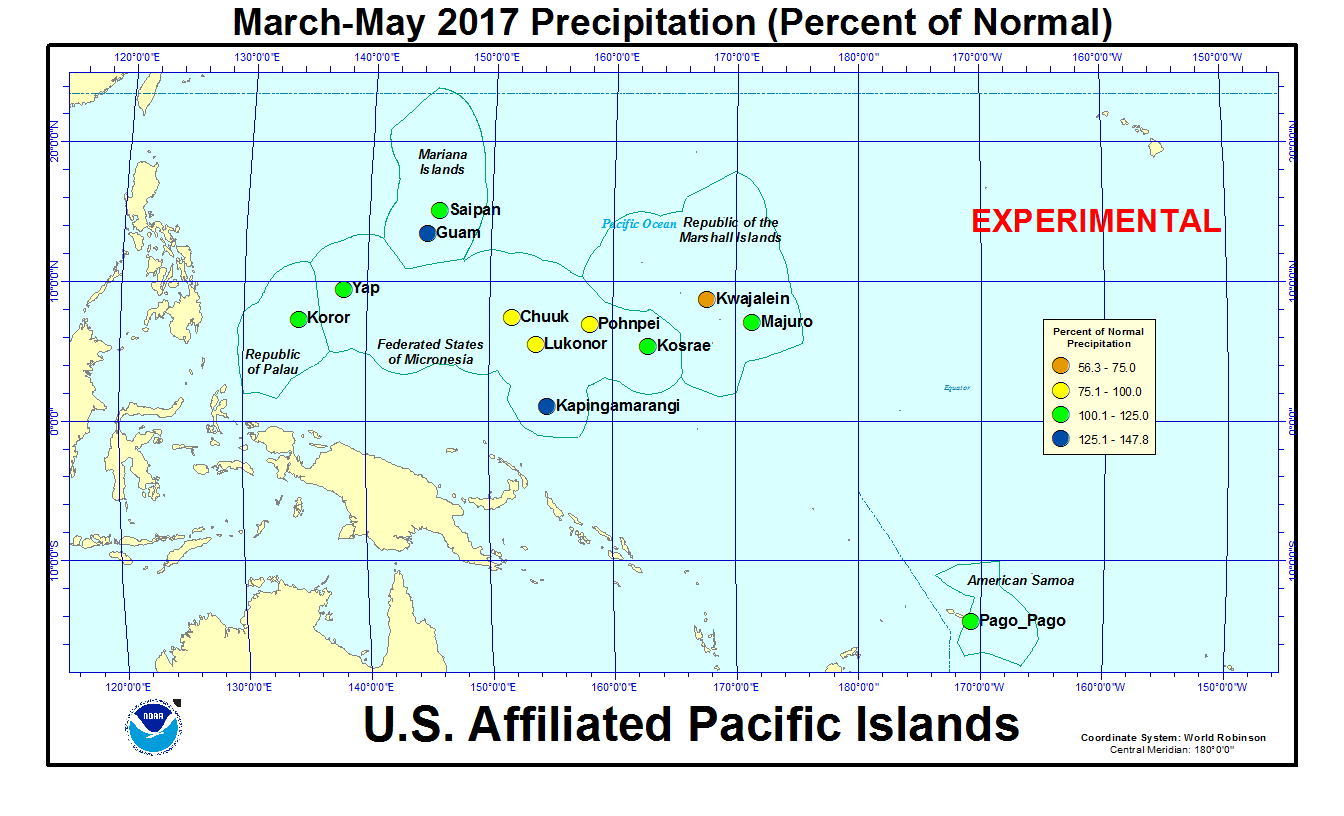
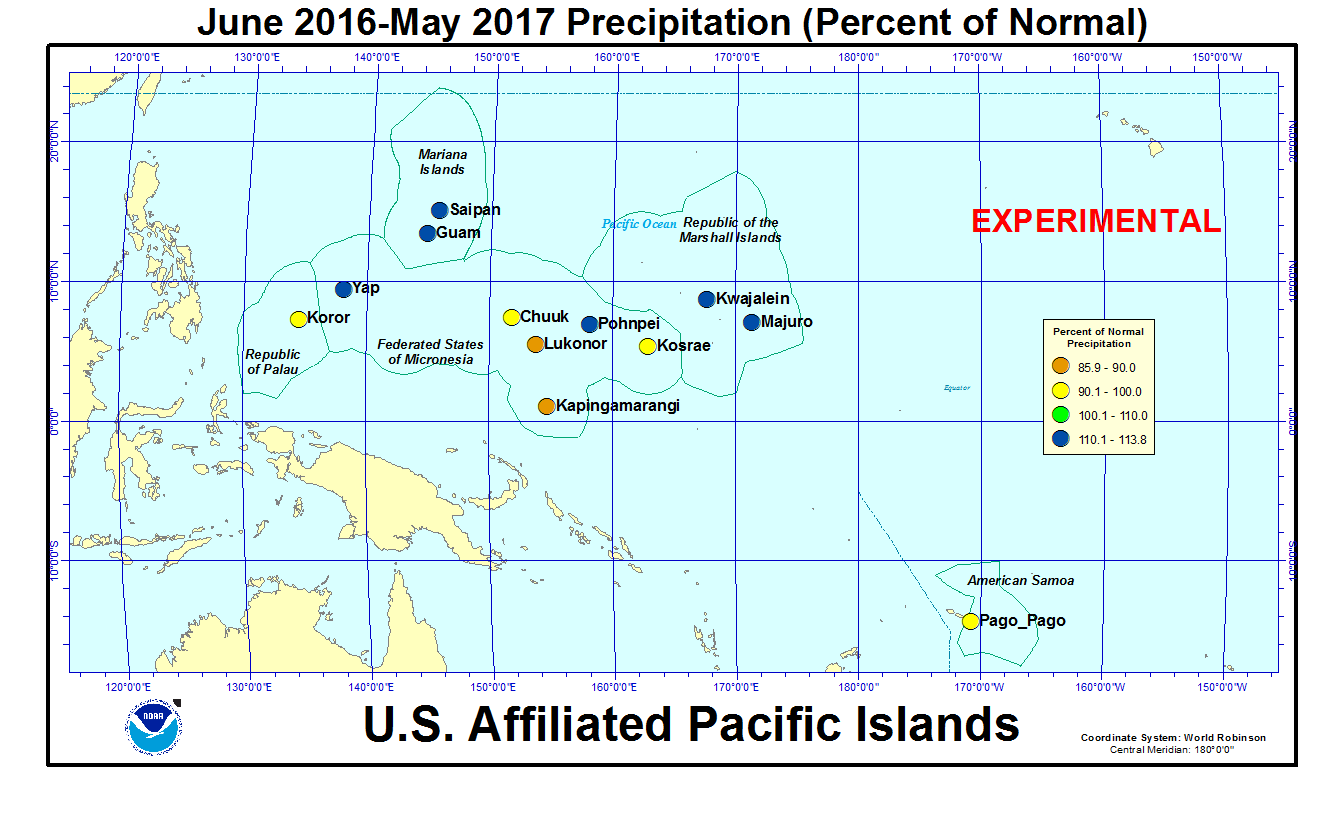
As measured by percent of normal precipitation, Lukonor has been drier than normal in the short term (May, the last 3 months [March-May], and the year-to-date [January-May]) as well as the long term (last 12 months [June 2016-May 2017]). Kwajalein was drier than normal in the near term and wetter than normal in the long term. Kapingamarangi and Pago Pago were wetter than normal in the near-term and drier than normal in the long term. Chuuk was wetter than normal for the year to date but drier than normal at the other three time scales. Pohnpei was drier than normal for May and March-May but wetter than normal for the other two time scales. Guam, Majuro, Saipan, and Yap were drier than normal for May but wetter than normal for the other three time scales. Koror and Kosrae were near to wetter than normal at all four time scales.
| Station Name | Jun 2016 | Jul 2016 | Aug 2016 | Sep 2016 | Oct 2016 | Nov 2016 | Dec 2016 | Jan 2017 | Feb 2017 | Mar 2017 | Apr 2017 | May 2017 | Jun- May |
|---|---|---|---|---|---|---|---|---|---|---|---|---|---|
| Chuuk | 91% | 94% | 74% | 86% | 58% | 98% | 176% | 113% | 114% | 189% | 60% | 83% | 96% |
| Guam NAS | 125% | 67% | 141% | 124% | 115% | 137% | 170% | 155% | 167% | 256% | 340% | 56% | 111% |
| Kapingamarangi | 24% | 66% | 91% | 77% | 26% | 71% | 114% | 159% | 207% | 126% | 159% | 114% | 90% |
| Koror | 93% | 45% | 61% | 115% | 153% | 144% | 64% | 131% | 175% | 245% | 76% | 107% | 100% |
| Kosrae | 130% | 88% | 88% | 89% | 90% | 56% | 168% | 103% | 213% | 150% | 112% | 115% | 99% |
| Kwajalein | 142% | 101% | 83% | 64% | 168% | 126% | 156% | 285% | 212% | 46% | 65% | 77% | 113% |
| Lukonor | 73% | 43% | 73% | 120% | 74% | 198% | 128% | 138% | 66% | 160% | 85% | 80% | 86% |
| Majuro | 66% | 90% | 75% | 123% | 120% | 129% | 103% | 228% | 138% | 199% | 110% | 49% | 112% |
| Pago Pago | 73% | 81% | 83% | 83% | 55% | 127% | 111% | 72% | 153% | 52% | 87% | 240% | 92% |
| Pohnpei | 143% | 79% | 112% | 144% | 120% | 115% | 142% | 182% | 71% | 115% | 96% | 92% | 114% |
| Saipan | 57% | 42% | 186% | 191% | 48% | 79% | 95% | 182% | 199% | 108% | 115% | 66% | 113% |
| Yap | 54% | 67% | 88% | 66% | 164% | 156% | 101% | 198% | 370% | 205% | 110% | 69% | 111% |
| Station Name | Jun 2016 | Jul 2016 | Aug 2016 | Sep 2016 | Oct 2016 | Nov 2016 | Dec 2016 | Jan 2017 | Feb 2017 | Mar 2017 | Apr 2017 | May 2017 | Jun- May |
|---|---|---|---|---|---|---|---|---|---|---|---|---|---|
| Chuuk | 10.61" | 11.27" | 9.50" | 10.04" | 6.73" | 10.39" | 19.83" | 11.37" | 8.27" | 15.74" | 7.51" | 9.40" | 130.66" |
| Guam NAS | 7.73" | 6.77" | 20.85" | 15.65" | 13.14" | 10.13" | 8.68" | 6.22" | 5.06" | 5.30" | 8.60" | 1.89" | 110.02" |
| Kapingamarangi | 3.30" | 9.33" | 7.38" | 7.61" | 2.14" | 6.58" | 11.22" | 14.54" | 19.18" | 14.44" | 21.70" | 13.75" | 131.17" |
| Koror | 16.25" | 8.28" | 8.20" | 13.51" | 18.06" | 16.38" | 7.13" | 13.30" | 14.99" | 18.26" | 5.54" | 12.61" | 152.51" |
| Kosrae | 18.99" | 13.07" | 12.48" | 12.71" | 9.87" | 7.76" | 26.99" | 17.21" | 27.51" | 24.16" | 19.62" | 20.34" | 210.71" |
| Kwajalein | 9.81" | 9.96" | 8.12" | 6.90" | 18.73" | 14.16" | 10.36" | 9.00" | 5.60" | 1.07" | 3.44" | 5.20" | 102.35" |
| Lukonor | 8.49" | 6.84" | 10.31" | 12.23" | 8.41" | 18.02" | 14.42" | 11.58" | 5.90" | 14.83" | 9.61" | 9.41" | 130.05" |
| Majuro | 7.27" | 10.09" | 8.78" | 13.73" | 15.28" | 17.36" | 11.77" | 17.65" | 9.50" | 13.07" | 10.36" | 4.93" | 139.79" |
| Pago Pago | 3.88" | 4.48" | 4.49" | 5.45" | 5.12" | 12.86" | 14.24" | 9.57" | 18.32" | 5.60" | 8.14" | 23.23" | 115.38" |
| Pohnpei | 21.18" | 12.12" | 15.91" | 18.13" | 18.39" | 17.00" | 22.83" | 24.00" | 6.76" | 15.16" | 17.68" | 18.45" | 207.61" |
| Saipan | 2.05" | 3.76" | 24.40" | 19.31" | 5.07" | 4.42" | 3.67" | 4.61" | 5.15" | 2.04" | 3.02" | 1.58" | 79.08" |
| Yap | 6.46" | 10.03" | 13.10" | 8.89" | 20.00" | 13.78" | 8.59" | 12.67" | 19.19" | 9.35" | 6.19" | 5.40" | 133.65" |
| Station Name | Jun 2016 | Jul 2016 | Aug 2016 | Sep 2016 | Oct 2016 | Nov 2016 | Dec 2016 | Jan 2017 | Feb 2017 | Mar 2017 | Apr 2017 | May 2017 | Jun- May |
|---|---|---|---|---|---|---|---|---|---|---|---|---|---|
| Chuuk | 11.66" | 11.98" | 12.86" | 11.71" | 11.51" | 10.61" | 11.25" | 10.10" | 7.25" | 8.32" | 12.47" | 11.30" | 136.77" |
| Guam NAS | 6.18" | 10.14" | 14.74" | 12.66" | 11.44" | 7.38" | 5.11" | 4.01" | 3.03" | 2.07" | 2.53" | 3.40" | 99.09" |
| Kapingamarangi | 13.78" | 14.15" | 8.13" | 9.93" | 8.19" | 9.27" | 9.84" | 9.15" | 9.27" | 11.43" | 13.64" | 12.08" | 145.85" |
| Koror | 17.48" | 18.53" | 13.50" | 11.77" | 11.84" | 11.39" | 11.16" | 10.18" | 8.56" | 7.44" | 7.32" | 11.83" | 152.90" |
| Kosrae | 14.64" | 14.91" | 14.22" | 14.22" | 10.94" | 13.83" | 16.11" | 16.67" | 12.93" | 16.06" | 17.51" | 17.75" | 213.87" |
| Kwajalein | 6.93" | 9.87" | 9.74" | 10.74" | 11.18" | 11.28" | 6.66" | 3.16" | 2.64" | 2.35" | 5.26" | 6.72" | 90.41" |
| Lukonor | 11.65" | 15.93" | 14.04" | 10.15" | 11.32" | 9.08" | 11.27" | 8.41" | 8.93" | 9.26" | 11.31" | 11.69" | 151.36" |
| Majuro | 11.01" | 11.17" | 11.69" | 11.17" | 12.73" | 13.44" | 11.39" | 7.74" | 6.88" | 6.58" | 9.42" | 10.11" | 125.25" |
| Pago Pago | 5.33" | 5.55" | 5.38" | 6.53" | 9.26" | 10.14" | 12.84" | 13.34" | 12.00" | 10.68" | 9.39" | 9.66" | 125.57" |
| Pohnpei | 14.81" | 15.43" | 14.26" | 12.55" | 15.27" | 14.83" | 16.08" | 13.18" | 9.55" | 13.17" | 18.41" | 19.96" | 182.36" |
| Saipan | 3.62" | 8.91" | 13.13" | 10.09" | 10.62" | 5.61" | 3.85" | 2.53" | 2.59" | 1.89" | 2.63" | 2.38" | 70.25" |
| Yap | 12.04" | 15.08" | 14.82" | 13.50" | 12.18" | 8.83" | 8.51" | 6.39" | 5.19" | 4.56" | 5.63" | 7.85" | 120.31" |
An analysis of historical data for the USAPI stations in the Global Historical Climatology Network-Daily (GHCN-D) dataset, augmented with fill-in data from the 1981-2010 Normals, indicated that long-term dryness persisted at a few stations, short-term dryness has developed at a few others, and wet conditions dominated at yet others. The following table lists the precipitation ranks for May 2017, March-May 2017 (last 3 months), and June 2016-May 2017 (the last 12 months). Some stations have a long period of record and their dataset is fairly complete, while other stations have a shorter period of record and the dataset has some missing data.
Rank of 1 = driest.
| Station | May 2017 Rank |
May No. of Years |
Mar- May 2017 Rank |
Mar- May No. of Years |
Jun 2016- May 2017 Rank |
Jun- May No. of Years |
Period of Record |
| Jaluit | 1 | 34 | 10 | 34 | 14 | 32 | 1981-2017 |
| Koror | 39 | 66 | 53 | 66 | 34 | 65 | 1951-2017 |
| Woleai | 15 | 35 | 15 | 31 | 9 | 20 | 1968-2017 |
| Yap | 18 | 66 | 33 | 66 | 44 | 65 | 1951-2017 |
| Majuro | 5 | 63 | 30 | 63 | 39 | 63 | 1954-2017 |
| Ulithi | 12 | 35 | MSG | 34 | MSG | 32 | 1981-2017 |
| Ailinglapalap | 2 | 34 | 11 | 34 | 26 | 31 | 1981-2017 |
| Kosrae | 33 | 48 | 32 | 43 | 18 | 30 | 1954-2017 |
| Lukonor | 10 | 33 | 27 | 33 | 9 | 20 | 1981-2017 |
| Saipan | 3 | 37 | 20 | 36 | 23 | 28 | 1981-2017 |
| Pohnpei | 31 | 66 | 32 | 66 | 54 | 65 | 1951-2017 |
| Kwajalein | 19 | 66 | 14 | 65 | 41 | 65 | 1952-2017 |
| Kapingamarangi | 16 | 23 | 20 | 23 | 6 | 13 | 1962-2017 |
| Chuuk | 13 | 66 | 25 | 66 | 15 | 65 | 1951-2017 |
| Guam | 13 | 61 | 48 | 61 | 45 | 60 | 1957-2017 |
| Nukuoro | 34 | 34 | 33 | 34 | 25 | 31 | 1981-2017 |
| Pago Pago | 51 | 52 | 31 | 51 | 18 | 51 | 1966-2017 |
| Wotje | 6 | 34 | 15 | 34 | 23 | 31 | 1981-2017 |
| Utirik | 7 | 18 | MSG | 6 | MSG | 2 | 1985-2017 |


[top]
State/Regional/National Moisture Status
A detailed review of drought and moisture conditions is available for all contiguous U.S. states, the nine standard regions, and the nation (contiguous U.S.):
| northeast u. s. | east north central u. s. | central u. s. |
| southeast u. s. | west north central u. s. | south u. s. |
| southwest u. s. | northwest u. s. | west u. s. |
| Contiguous United States |
[top]
Contacts & Questions