|
Contents Of This Report: |

|
Please note that the values presented in this report are based on preliminary data. They will change when the final data are processed, but will not be replaced on these pages.
National Drought Overview
|
|
[top]
Detailed Drought Discussion
Overview

The U.S. Drought Monitor drought map valid April 4, 2017.
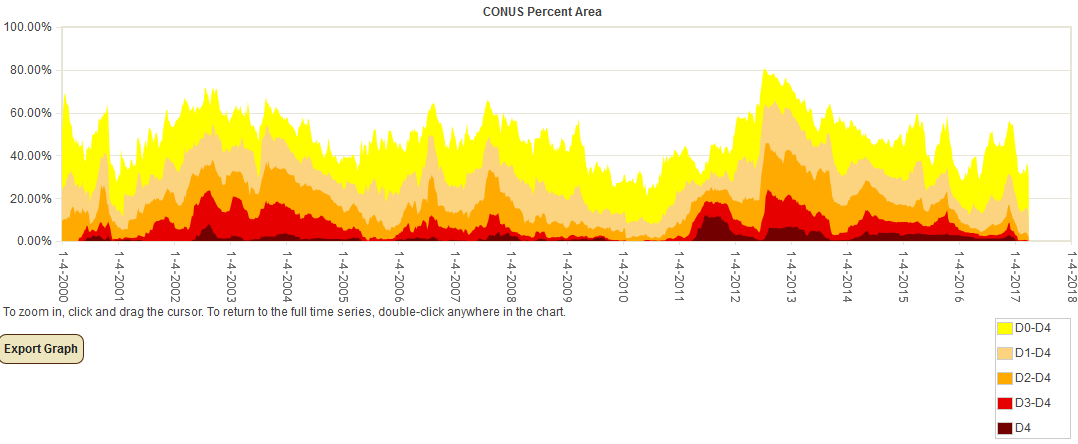
The atmospheric circulation pattern over the CONUS during March 2017 was dominated by a strong westerly flow within an anomalous long-wave ridge over the West and a long-wave trough over the Northeast. Many short-wave troughs and closed lows moved in this jet stream flow, dragging cold fronts and surface low pressure systems with them. The long-wave ridge brought above-normal temperatures to much of the country while the trough in the Northeast kept temperatures cooler than normal there. The ridge also tended to inhibit precipitation, but the short-wave troughs, fronts, and surface lows moving through the ridge brought above-normal precipitation to some areas. Precipitation during March and the first few days of April fell on many of the drought areas in the Plains to Southern Appalachians and Mid-Atlantic Coast to Northeast, resulting in contraction of drought and abnormal dryness in these areas. However, drought and abnormal dryness expanded in New Mexico, the Southeast, and other parts of the Mid-Atlantic where precipitation was below normal. March was drier than normal across most of Alaska and Hawaii, but wetter than normal across Puerto Rico. Drought contracted more than it expanded, so the USDM-based national moderate-to-exceptional drought footprint decreased across the CONUS from 14.1 percent at the end of February to 9.8 percent at the end of March (from 11.8 percent to 8.3 percent for all of the U.S.). According to the Palmer Drought Index, which goes back to the beginning of the 20th century, about 14.7 percent of the CONUS was in moderate to extreme drought at the end of March, an increase from last month's 12.3 percent.
Drought conditions at the end of the month, as depicted on the April 4th, 2017 USDM map, included the following CONUS core drought and abnormally dry areas:
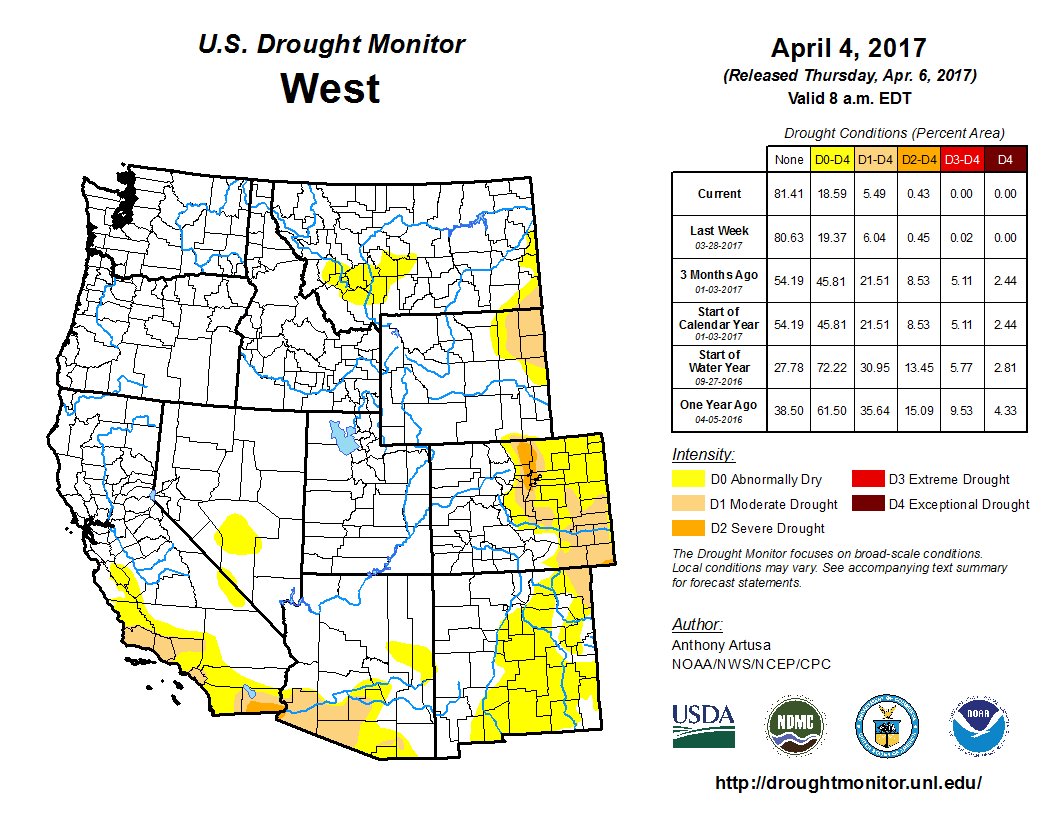
- Pockets of abnormally dry (D0) to severe (D2) drought conditions lingered in parts of the western U.S., mainly southern California to Arizona and the Colorado Rockies;
- Abnormally dry to moderate (D1) drought conditions continued in the Northern Plains and moderate to severe drought continued in parts of the Southern Plains to Lower Mississippi Valley;
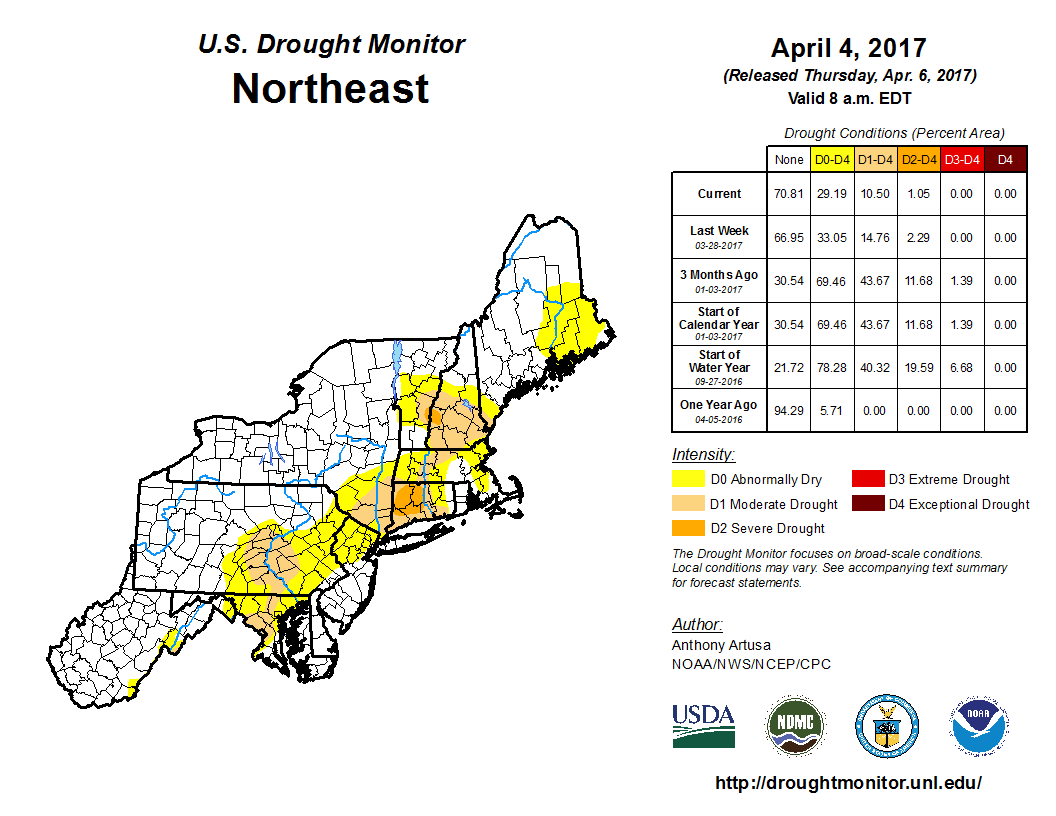
- Abnormally dry to severe drought conditions continued in parts of the Northeast;
- Abnormally dry to moderate drought conditions continued in parts of the Midwest, mainly along the Mid-Mississippi Valley;
- Abnormal dryness to extreme (D3) drought persisted in the Southeast; and
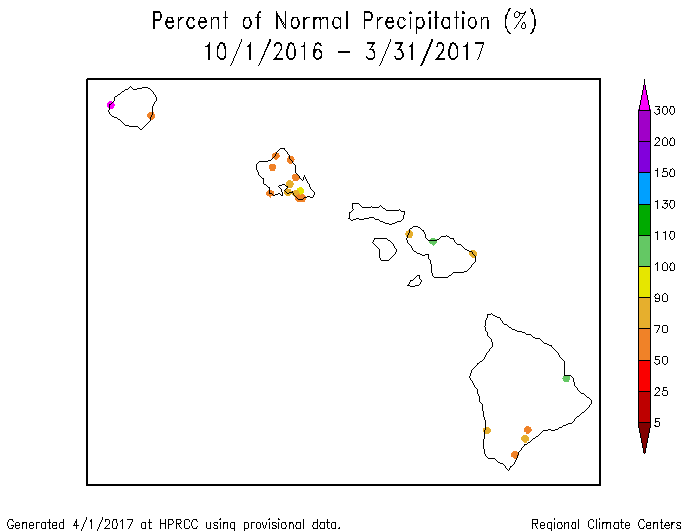
- Abnormally dry to severe drought expanded in parts of Hawaii, especially the Big Island.
Palmer Drought Index
The Palmer drought indices measure the balance between moisture demand (evapotranspiration driven by temperature) and moisture supply (precipitation). The Palmer Z Index depicts moisture conditions for the current month, while the Palmer Hydrological Drought Index (PHDI) and Palmer Drought Severity Index (PDSI) depict the current month's cumulative moisture conditions integrated over the last several months. While both the PDSI and PHDI indices show long-term moisture conditions, the PDSI depicts meteorological drought while the PHDI depicts hydrological drought. The PDSI map shows less severe and extensive drought in parts of the northeastern and southeastern U.S. than the PHDI map because the meteorological conditions that produce drought and wet spell conditions are not as long-lasting as the hydrological impacts.
|
 |
Used together, the Palmer Z Index and PHDI maps show that short-term dry conditions occurred across much of the Southern Plains to Southeast, from southern California to the Southern and Central Rockies, and parts of the Northern Plains and interior Mid-Atlantic. This short-term dryness intensified the existing long-term drought conditions in the Southeast to Mid-Atlantic (PHDI map for February vs. March). Near-normal to wet conditions in March reduced long-term drought in parts of the Northeast. Short-term wet conditions intensified long-term wet conditions in parts of the Pacific Northwest to Northern Rockies.
Standardized Precipitation Index
The Standardized Precipitation Index (SPI) measures moisture supply. The SPI maps here show the spatial extent of anomalously wet and dry areas at time scales ranging from 1 month to 24 months.
 |
 |
 |

The SPI maps illustrate how moisture conditions have varied considerably through time and space over the last two years. Parts to most of the Southeast was dry at the 1- to 12-month time scales, with dryness extending into the Mid-Atlantic region at the 1- to 9-month time scales. The Northeast was near to wetter-than normal at the 1-month time scale. But starting at 2 months, southern New England shows up as dry with the dry area expanding for each time period out to 24 months. Parts of the Southern Plains show up as dry at the 1- and 6- to 12-month time scales, and parts of the Northern Plains are dry at 1 to 3 months. Dryness is evident in parts of the West at 1 to 2 months, but wet conditions mostly dominate this region, especially at 3 to 24 months. Otherwise, near-normal to wet conditions dominate. Of particular note are the wet conditions across most of the CONUS at 24 months.
 |
 |
 |
Regional Discussion

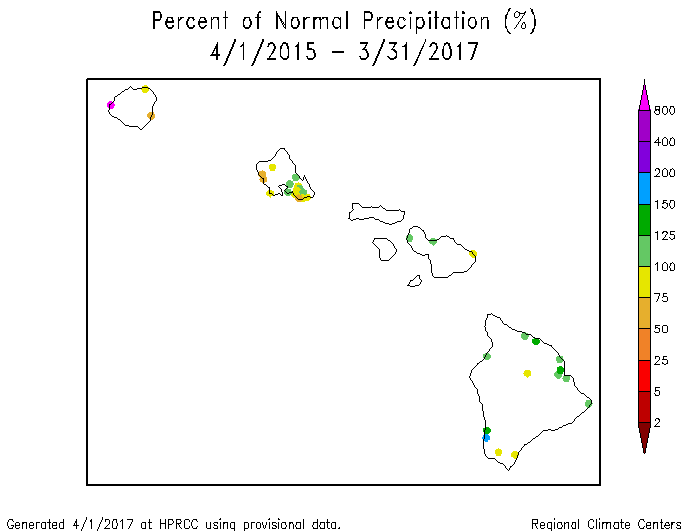
Hilo, Hawaii, precipitation, March, 1950-2017.
Hawaii: Drier-than-normal conditions dominated most of Hawaii during March 2017 and recent months (last 3 to 6 months), except during the last 2 months when dryness was limited more to the Big Island. Hilo, on the Big Island, had the fourth driest March in the 1950-2017 record, and streamflow was low in some areas. A mixed precipitation anomaly pattern was evident at longer time scales (last 9, 12, 24, and 36 months). Drought and abnormally dry conditions expanded during March, with moderate to severe drought covering about a fourth of the state on the April 4th, 2017 USDM map; abnormally dry to severe drought conditions covered about 87 percent of Hawaii.
 Alaska climate division precipitation rank map for October 2016-March 2017. |
 Alaska climate division 6 (Central Interior) precipitation, October-March, 1925-2017. |
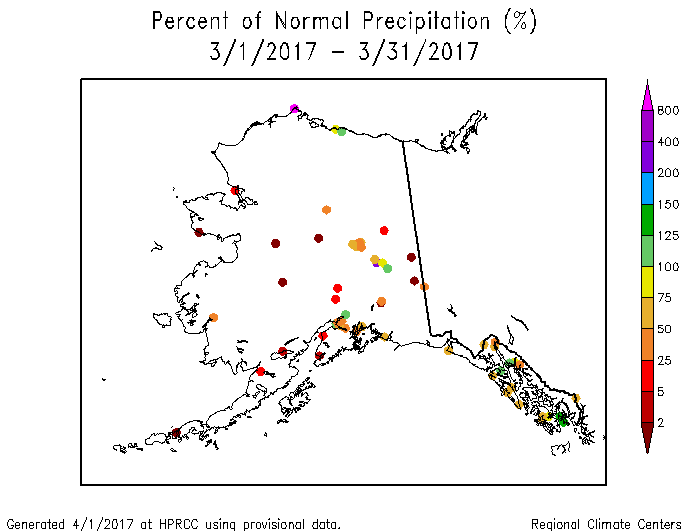
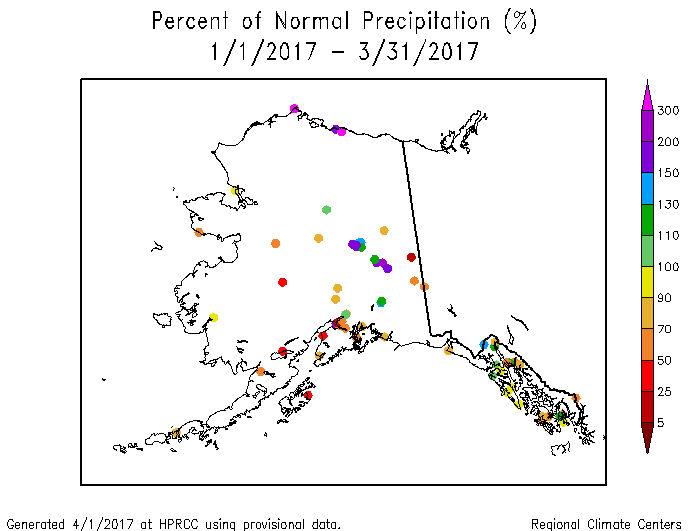
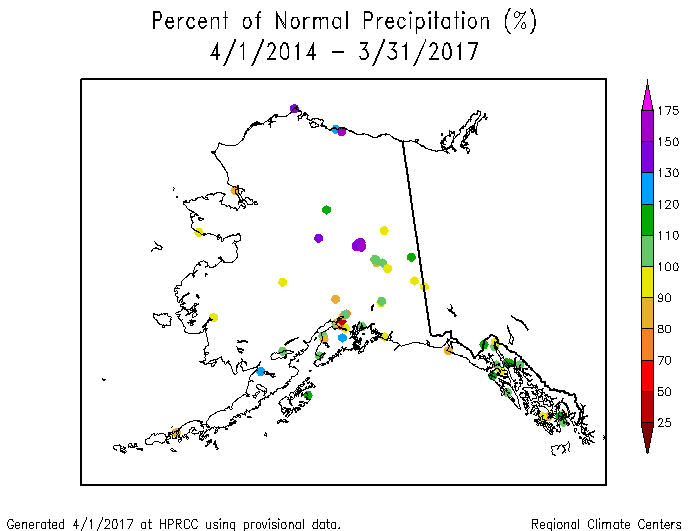
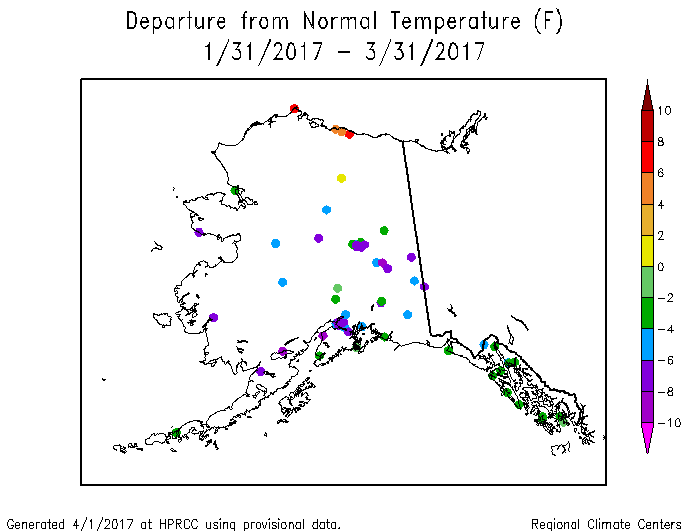
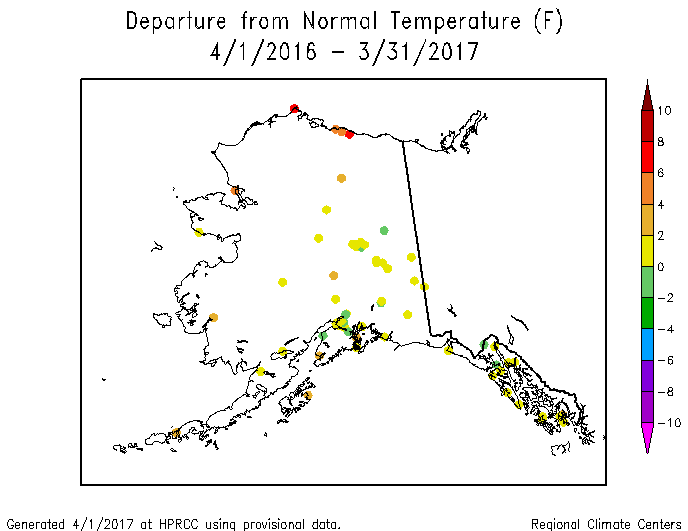
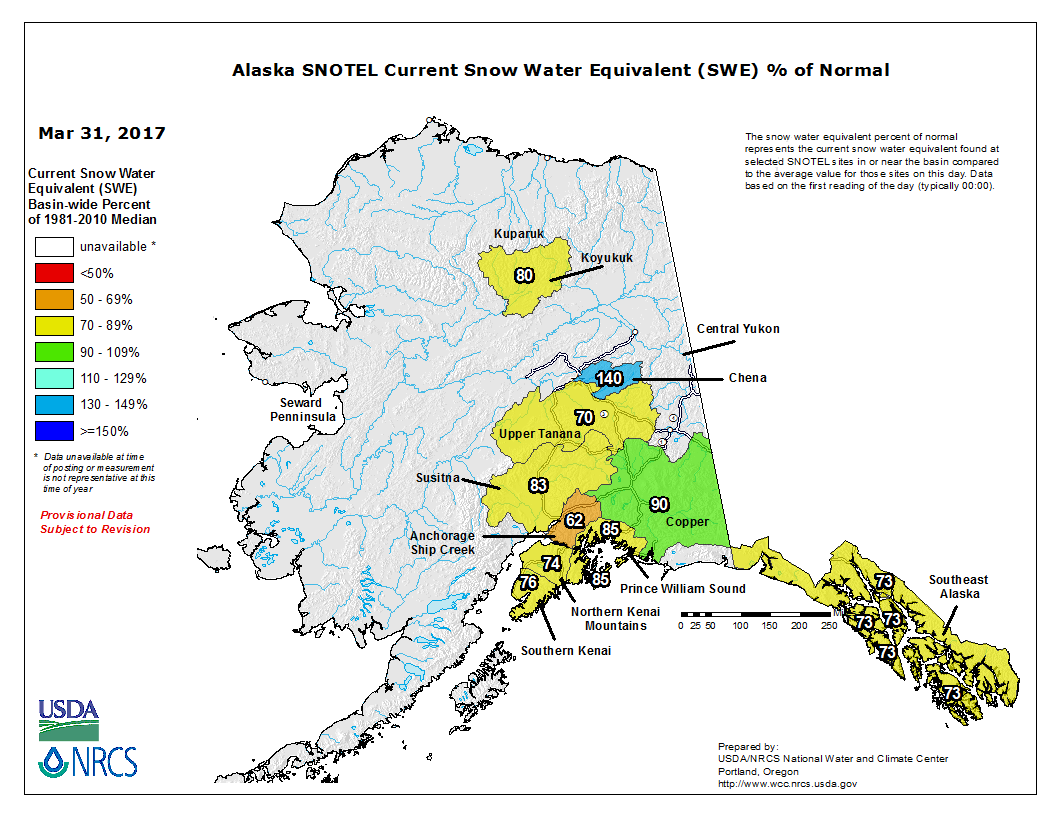
Alaska: March was drier than normal across most of Alaska. The dry conditions were more concentrated in the southwestern part of the state for the last 2 to 3 months (as seen on the climate division and low elevation station maps). Dryness was widespread across the state for the water year to date (October 2016-March 2017) (climate division, low elevation station, high elevation SNOTEL station and basin maps), with the Central Interior climate division having the driest October-March in the 1925-2017 record. The precipitation anomaly pattern was mixed for the last 9, 12 (climate division, low elevation station maps), 24, and 36 months. March was cooler than normal across most of the state, with the cooler-than-normal anomalies persisting for the last 2, 3 (climate division, low elevation station maps), and 6 (climate division, low elevation station maps) months. Temperatures were warmer than normal statewide at the 12-month time scale. Mountain snowpack and snow water content were below normal at most stations and basins. About a third of the state was abnormally dry on the April 4th USDM map.
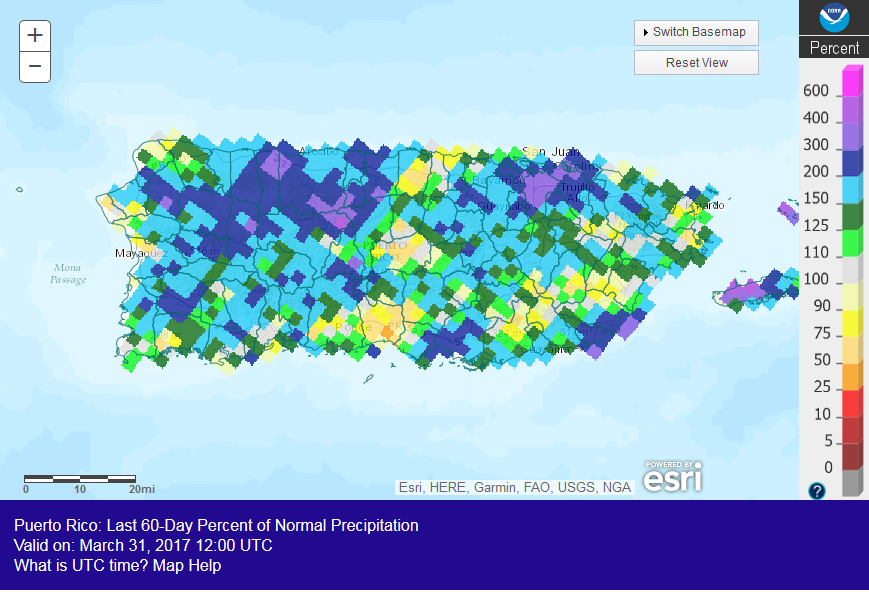
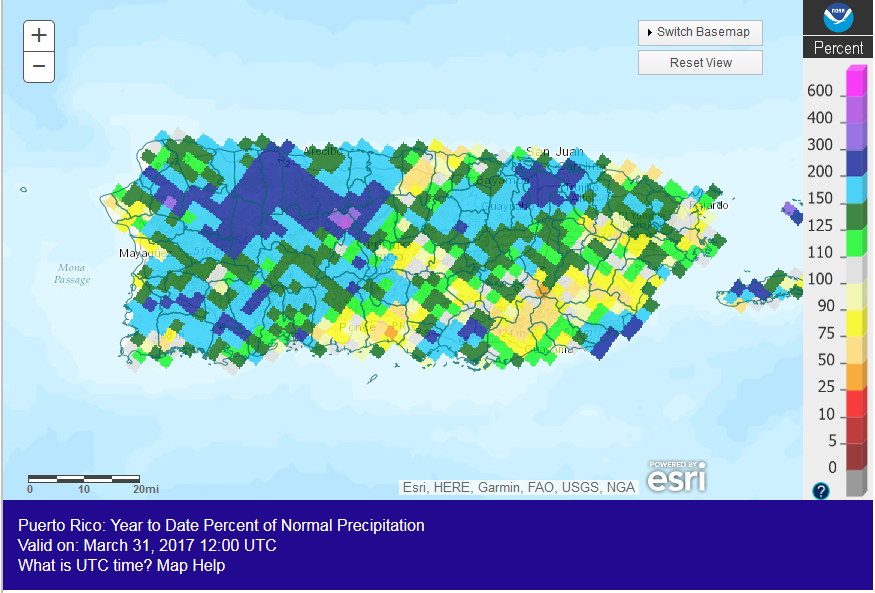
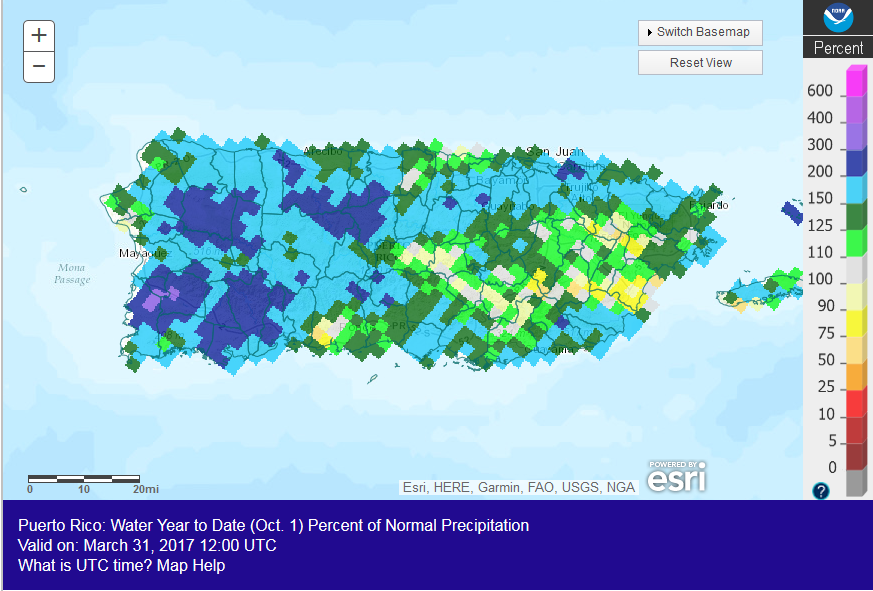
Puerto Rico: Puerto Rico was wetter than normal during March. The March wetness made up for precipitation deficits that had been building up during previous months (maps for the last 2, 3, and 6 months). Only a few areas of near to drier than normal conditions existed in the southeast. Soils were still a little dry along the southern coast. Precipitation during March was enough to eliminate abnormal dryness from the island on the April 4th, 2017 USDM map.
CONUS State Precipitation Ranks:

|
|
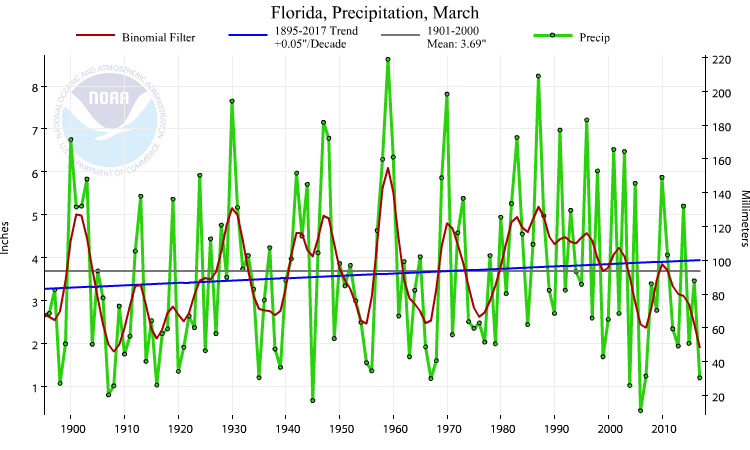
March 2017 was drier than normal across much of the Southwest and Southeast, and parts of the Southern and Central Plains and East Coast. Eleven states in the CONUS ranked in the driest third of the 1895-2017 record, including Florida which ranked ninth driest.
| The year-to-date (January-March 2017) was drier than normal in parts of the Northern Plains, Lower to Mid-Mississippi Valley, and East Coast. Precipitation during January-March prevented any state in the CONUS from ranking in the top ten driest category for the three-month period, although eleven ranked in their driest third of the historical record. |
|

|

|
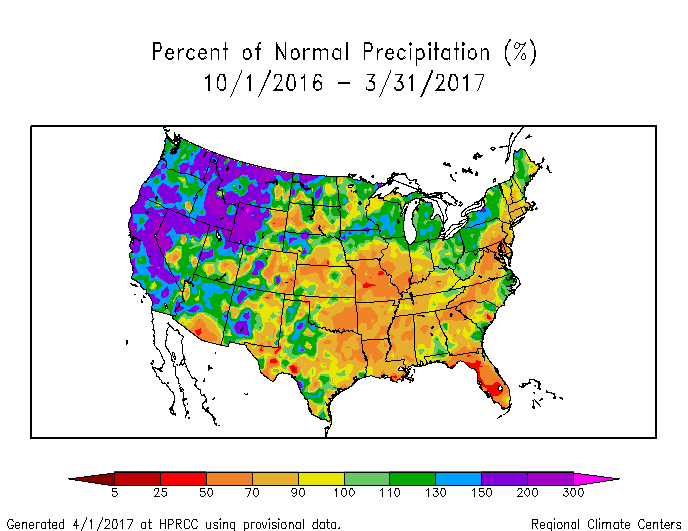
October 2016-March 2017 was drier than normal across a large part of the Southern and Central Plains to Ohio Valley and Southeast, and along the coastal Mid-Atlantic to southern New England. Sixteen states ranked in their driest third of the historical record for October-March, including Maryland which had the tenth driest such 6-month period.
 |

|
April 2016-March 2017 was drier than normal in parts of the Southern Plains to Southeast, much of the Northeast, plus scattered parts of the West and Northern Plains. Eleven states in the Southeast and Northeast ranked in their driest third of the historical record, including Connecticut which had the fourth driest April-March and Massachusetts which ranked eighth driest. The last five years (April-March periods) have ranked near to much drier than normal in Connecticut.
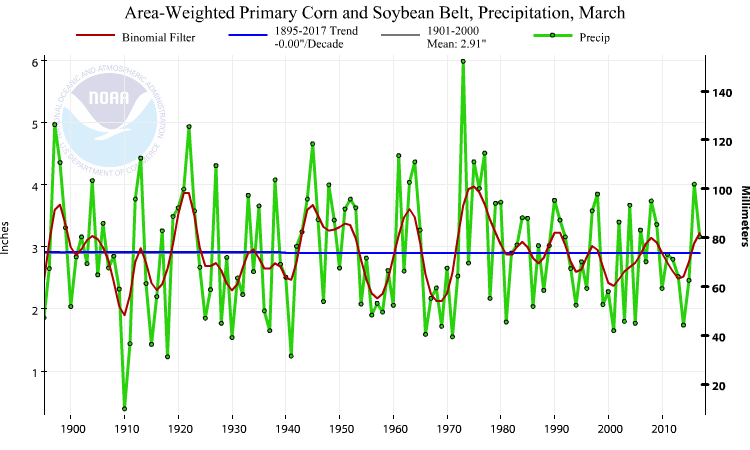 Primary Corn and Soybean Belt precipitation, March, 1895-2017.
|
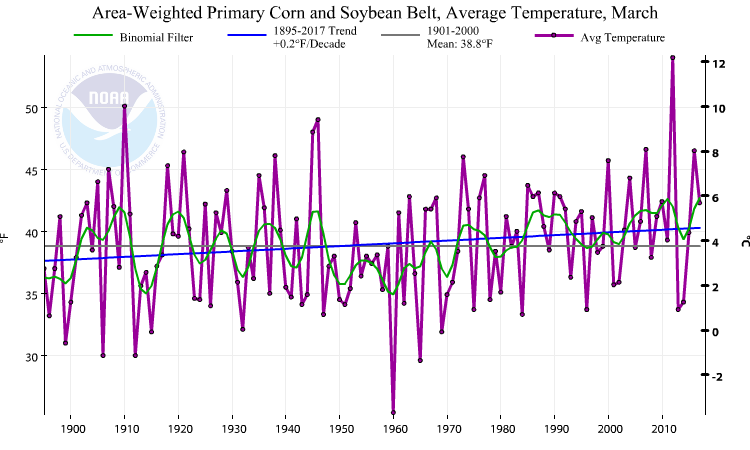 Primary Corn and Soybean Belt temperature, March, 1895-2017.
|
March 2017 was warmer than normal across the Primary Hard Red Winter Wheat agricultural belt, and wetter than normal across most of it. The month ranked as the fifth warmest and 18th wettest March, regionwide, in the 1895-2017 record. October serves as the beginning of the growing season. October 2016-March 2017 was wetter than normal in places and drier than normal in others, and warmer than normal across the region, ranking as the warmest and 50th wettest October-March, regionwide, on record.
March also marks the beginning of the growing season for the Primary Corn and Soybean agricultural belt. March 2017 was warmer than normal across the southern portions of the region and near to cooler than normal in the northern reaches. Parts of the agricultural belt wetter than normal and other parts drier than normal. The month ranked as the 27th warmest and 49th wettest March, regionwide, on record.
NOAA Regional Climate Centers:
A more detailed drought discussion, provided by the NOAA Regional Climate Centers and others, can be found below.
As described by the High Plains Regional Climate Center, most of the High Plains region experienced above-normal temperatures in March, while precipitation varied across the region, with some areas experiencing wet conditions while others were dry. Wet conditions continued in the Wyoming portion of the Rockies, while it was dry along the Colorado Front Range. Western and central Colorado, the Dakotas, and central Nebraska received no more than 70 percent of normal precipitation. Some areas, such as eastern Colorado and Kansas, would have been much drier in March had they not received copious precipitation the last few days of the month. This rainfall was welcome, as it helped ease drought conditions. Snowpack fared well in Wyoming and Colorado during March as we near the end of the first half of the snowpack season. On the other hand, a continuation of warm and dry conditions caused drought to expand across eastern Colorado and Kansas. Topsoil moisture and pasture conditions declined during March, and concerns over winter wheat were growing. Most notably, wildfires raged across this region, spreading quickly due to high winds. While wildfires are not uncommon in these areas in the early spring, the areas they have burned have been quite large. Although heavy rainfall at the end of March brought some drought relief to the region, more moisture will be needed in April to mitigate wildfire conditions.
The warm temperatures continued to accelerate plant growth and, according to the National Phenology Network, growth was a couple weeks ahead of schedule in the central and southern High Plains. Early growth of plants has put them at risk for freeze damage, as much of the region is several weeks away from the average last spring freeze. However, the warm weather has contributed to early calving in some areas and has allowed producers to begin prepping their fields for planting.
Drought conditions both improved and worsened during March throughout the High Plains. Overall, the percent area of the region in abnormal dryness or drought (D0-D4) increased slightly from approximately 35 percent to 37 percent on the USDM. Improvements occurred in northeastern Colorado and central Nebraska where beneficial rains fell in the latter part of the month. Meanwhile, degradations occurred throughout much of Kansas where most of the month was dry. Drought conditions in the Black Hills region of South Dakota and northeastern Wyoming changed little during March. Perhaps the most notable drought story of the month was rapidly-deteriorating conditions in Kansas and eastern Colorado. At the end of March, about 90 percent of Kansas was experiencing D0-D4 conditions, compared to approximately two-thirds of the state at the end of February. Topsoil moisture suffered, and 62 percent of the winter wheat in Kansas was rated fair or worse. In Colorado, producers were voicing concerns about winter wheat stands. They also reported that fall-planted crops came out of dormancy early due to mild temperatures during late winter, and the topsoil moisture they need for additional growth is lacking. Both states were ravaged with wildfires during March as a result of drought conditions. Fortunately, the last few days of March brought heavy rainfall to drought-stricken areas of Kansas and Colorado, so conditions will be reassessed and improvements will likely be made to the depiction of drought on the U.S. Drought Monitor in early April.
As explained by the Southern Regional Climate Center, March was a warmer-than-normal month for four states in the Southern region, and for the region as a whole, it was warmer than normal. Precipitation values for the month varied spatially across the Southern region. Precipitation totals in the northern and southern parts of Texas, the panhandle of Oklahoma, and northern Arkansas ranged between 150 to over 300 percent of normal. By contrast, conditions were quite dry across much of Louisiana, Mississippi, and eastern Oklahoma with most stations reporting between 25 to 70 percent of normal. In Arkansas, Oklahoma, Louisiana and Texas precipitation values were mixed in that there were clusters of normal, below normal and above normal levels of precipitation values. Tennessee reported above normal precipitation for most of the state, ranging from 110 to 200 percent above normal. Drought conditions improved for some parts of the region, such as areas in Tennessee and Arkansas. There were a few areas that went from normal to abnormally dry, including northern Texas and southern Louisiana. Areas of Oklahoma and northeastern Mississippi are experiencing severe drought, with the panhandle of Oklahoma reporting extreme drought.
As summarized by the Midwest Regional Climate Center, March precipitation in the Midwest was a mix of above-normal and below-normal areas, while temperatures were near-normal to slightly above-normal in the region. Large parts of Minnesota and smaller parts of western Wisconsin and Upper Michigan had totals of less than 50 percent of normal. Other areas with below-normal totals were primarily in the southern third of the region. Drought areas accounted for 10 to 15 percent of the region during March. The areas in drought were largely contained in Missouri, southwestern Illinois, and southeastern Iowa. A small area in central Missouri was classified as severe drought during the month.
As noted by the Southeast Regional Climate Center, precipitation was below normal across much of the Southeast during March, with several extremes recorded, and temperatures were near average across much of the region (including Puerto Rico and the U.S. Virgin Islands), except for portions of Alabama, Georgia, and the Florida Panhandle where mean temperature departures were 3 to 5 degrees F (1.7 to 2.8 degrees C) above average. The driest locations were found across much of Florida as well as portions of coastal and southeastern Alabama, central and southern Georgia, and the southern half of South Carolina. Monthly precipitation totals ranged from 5 to 50 percent of normal in these areas. At least 17 long-term stations in Georgia and Florida observed March precipitation totals that were ranked within the five lowest values on record, including Orlando, FL (0.10 inch; 2.5 mm), Savannah, GA (0.50 inch; 12.7 mm), and Alma, GA (0.54 inch; 13.7 mm). Brunswick Airport, GA (1949-2017) observed its highest count of 29 days during March with no measurable precipitation, while Jasper, FL (1951-2017) and Punta Gorda 4 ESE, FL (1966-2017) tied their highest count of 30 and 29 days during March, respectively, with no measurable precipitation.
While drought conditions improved slightly across the interior portion of the region, drought development and expansion occurred in other parts of the region during March. The greatest drought improvement occurred in Alabama, as the coverage of moderate-to-extreme (D1-D3) drought decreased from 54 percent on February 28th to 38 percent on March 28th. By the end of the month, extreme drought had declined across portions of northern Georgia and Upstate South Carolina, with a complete removal of these conditions occurring in central Alabama and western North Carolina. In contrast, drought continued to intensify and expand across much of the Florida Peninsula, with over 50 percent of the state classified in moderate-to-severe (D1-D2) conditions at the end of March. Moderate drought expanded into the northern Piedmont of North Carolina as well as central Virginia, and a small area of moderate drought developed along a coastal portion of the Carolinas. Streamflows, lake levels, and soil moisture were well below normal across drought-stricken portions of the region. Over 50 percent of the USGS gages in Georgia, the Carolinas, and Virginia recorded extremely low (i.e., less than the 10th percentile) streamflows during much of the month. In early March, dry and windy weather contributed to the rapid development of a 7,500-acre wildfire near Naples, FL, which destroyed 4 rural homes. Despite below-normal precipitation and the mid-month freeze, pastures continued to slowly improve across much of the region, except Florida. However, livestock producers in several states maintained a supplemental feeding for their herds due to limited grazing, with a severe shortage of hay persisting in Alabama and Georgia. The hard freeze during mid-March produced up to $1 billion in crop losses across Georgia and South Carolina, including 85 percent of South Carolina peaches and as much as 80 percent of blueberries in southern Georgia. Other fruit crops across the region that had bloomed prematurely due to the unseasonably warm winter were also damaged, particularly peaches and pears in Georgia, strawberries and blueberries in South Carolina, blueberries and peaches in North Carolina, and peaches and cherries in Virginia. A series of frosts damaged fruit and vegetable crops in northern and central Florida, while moderate-to-severe frost damage was reported in winter wheat fields in nearly every state across the region.
As explained by the Northeast Regional Climate Center, the Northeast wrapped up March with near-normal precipitation and below-normal temperatures, breaking a ten-month warmer-than-normal streak. Abnormally dry and drought conditions lingered but improved for much of the Northeast during March. The USDM released on March 2 indicated 27 percent of the Northeast was in a moderate, severe, or extreme drought, with another 20 percent being abnormally dry. In early March, the Northeast became free of extreme drought for the first time since early August 2016. Severe drought eased in New York, New Jersey, and portions of Maryland and New England. Moderate drought improved in Delaware and parts of New England, New York, New Jersey, Pennsylvania, and Maryland. Abnormal dryness eased in portions of New England, New York, New Jersey, Pennsylvania, Delaware, and Maryland. The only expansion of dry conditions during the month occurred in two small areas of eastern West Virginia. The USDM released on March 30 indicated 15 percent of the Northeast was in a moderate or severe drought, with another 18 percent being abnormally dry. March average streamflow was near to below normal for a majority of the Northeast, with the lowest flows found in portions of eastern West Virginia, southern New Jersey, New York's Long Island, and southern New England. Groundwater and reservoir levels increased during March, returning to near normal in some areas, but remaining below normal in other areas. New Britain, Connecticut's reservoir system, increased to nearly 50 percent of capacity by early March, allowing the city to stop purchasing water from another source. Connecticut's Department of Public Health issued a second water supply emergency for Darien, Greenwich, New Canaan, and Stamford. The order continued the irrigation ban that was previously enacted, but allowed for a few specific outdoor water uses. According to a press release from Aquarion Water Company, "This new order helps increase the likelihood of refilling the Greenwich and Stamford reservoir systems." The Department also requested that water systems serving over 1,000 customers monitor groundwater data weekly and submit their results monthly. Worcester, Massachusetts' drought status improved from a Drought Warning to a Drought Alert effective March 10. The city's reservoir system was 10 percent below average capacity on March 1. The Connecticut River Valley and southeastern Massachusetts improved to a Drought Watch, while the western and central regions improved to a Drought Advisory. Central Maryland worsened to a Drought Warning, while Eastern Maryland went from normal status to a Drought Watch.
As summarized by the Western Regional Climate Center, well above-normal precipitation was generally confined to the Pacific Northwest this month, with scattered areas in the central Rockies and northern Great Basin as well. Washington and northwest Oregon saw slightly cooler than normal temperatures while the rest of the region observed warmer than normal temperatures, with well above-normal temperatures in large areas of the Rocky Mountain states. Several cold storms this month brought snow to the West and maintained near- to above-normal snowpack across the region despite the periods of well above-normal temperatures. At the end of the month, Sierra Nevada snowpack stood at 160% to over 200% of normal and the Cascades observed roughly 100-140% of normal. The northern and southern Rockies reported near normal snowpack, while the central part of the range varied from near normal to greater than 150% of normal. Drier-than-normal conditions dominated the Southwest this month. San Diego, California; Las Vegas, Nevada; and Phoenix, Arizona, all recorded less than 10% of normal precipitation for March. This is not unprecedented for these locations, which have all seen at least a few years with no measurable March precipitation. The 0.08 in (2 mm) recorded in San Diego this month was 4% of normal and the 6th driest since records began in 1939. On the USDM, drought conditions improved in some areas of southern California this month, likely owing to impacts from previous precipitation in the season. Abnormally dry conditions were expanded across central and eastern New Mexico.
March was cooler and drier than normal across much of Alaska. All locations south of the Brooks Range observed below-normal temperatures for the month. Fairbanks reported its 3rd coolest March on record at -3 F (-19.4 C), 14.4 F (8 C) below normal. Records for Fairbanks began in 1929. Several locations attained or tied their driest March on record. These include Cold Bay, which received 0.04 in (1 mm), the driest since records began in 1950, and McGrath, where only trace precipitation was recorded, tied with three other years since records began in 1939. In contrast, on the North Slope, Utqiagvik recorded 0.3 in (7.6 mm), 333% of normal. Further south, precipitation was variable across the state of Hawaii though generally below normal, especially on the Big Island where Hilo received only 3.4 in (86 mm) of rainfall, 25% of normal. The leeward side of Big Island moved into moderate to severe drought conditions in the USDM this month. Scattered locations observed a wetter than normal March; Kahului, Maui, reported 4.14 in (105 mm), 169% of normal.
Pacific Islands: The NOAA National Weather Service (NWS) offices, the Pacific ENSO Applications Climate Center (PEAC), and partners provided reports on conditions across the Pacific Islands.
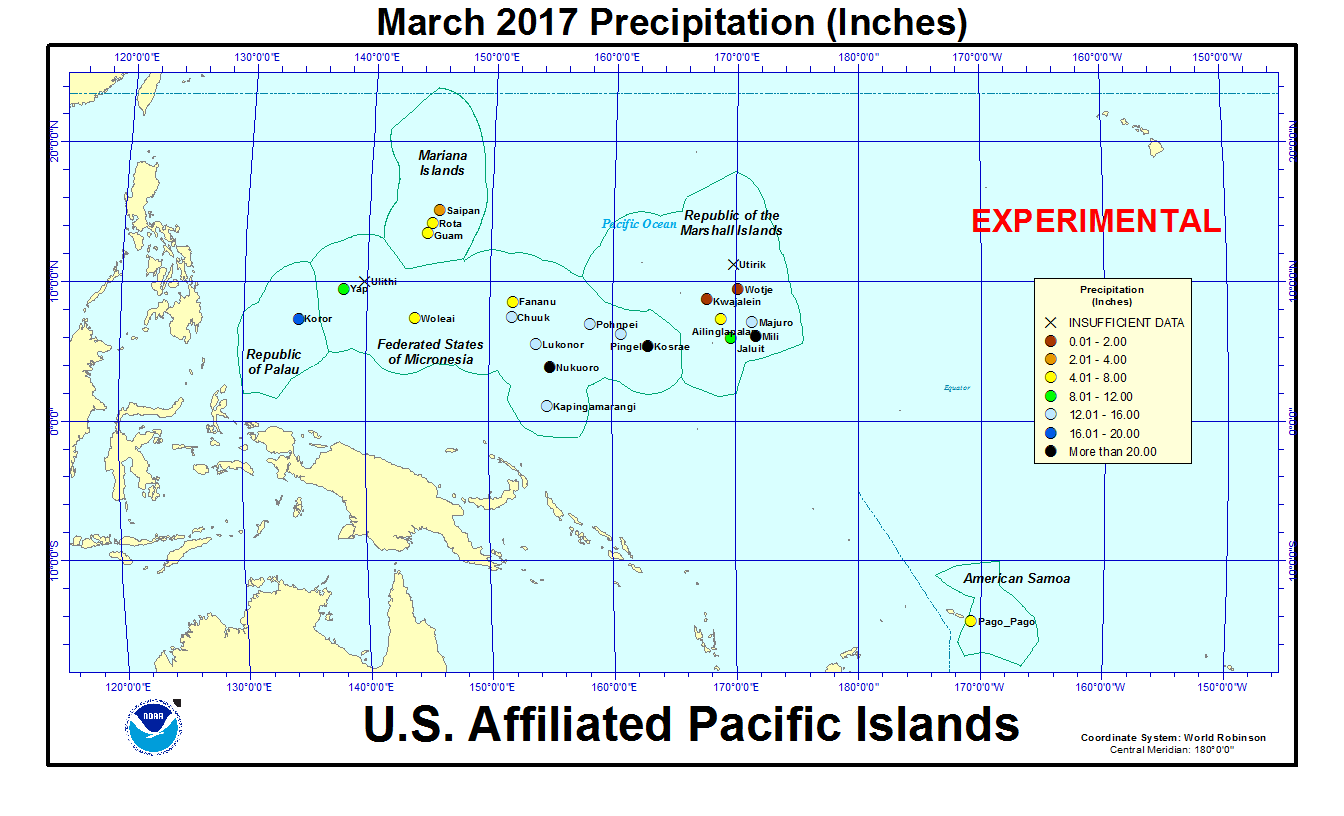
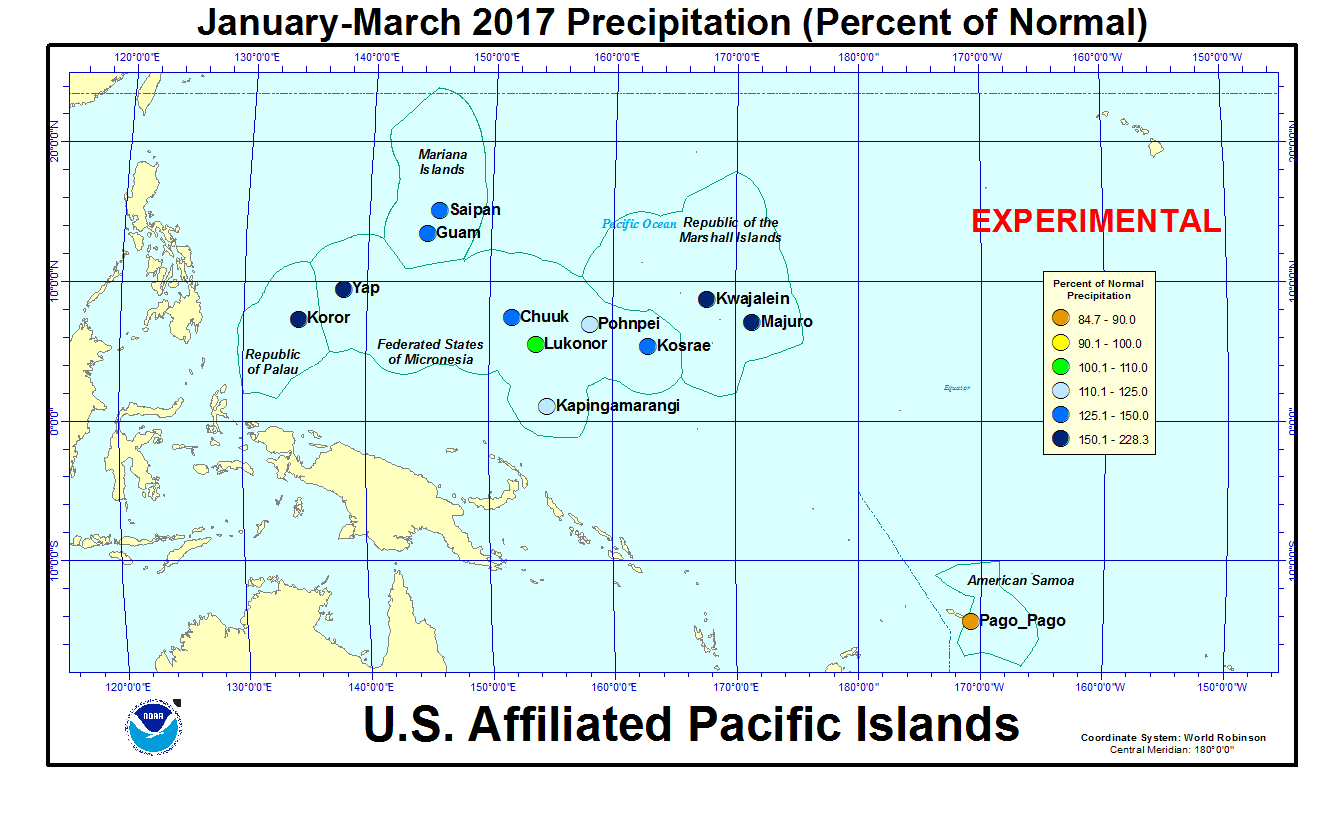
In the U.S. Affiliated Pacific Islands (USAPI) (maps — Federated States of Micronesia, Northern Mariana Islands, Marshall Islands, Republic of Palau, American Samoa, basinwide), March 2017 was drier than normal at Kwajalein and Pago Pago, and wetter than normal at the other stations.
Rainfall amounts were below the minimum thresholds (4 or 8 inches) required to meet most monthly water needs at Wotje (0.99 inch of rain in March), Kwajalein (1.07 inches), and Ailinglapalap (7.76) in the Marshall Islands; Fananu (5.31) and Woleai (5.55) in the Federated States of Micronesia; Saipan (2.04) in the Marianas Islands; and Pago Pago (5.60) in American Samoa. March rainfall was above the monthly minimum thresholds at the rest of the regular reporting stations in Micronesia. The 4- and 8-inch thresholds are important because, if monthly precipitation falls below the threshold, then water shortages or drought become a concern.
Kwajalein had only 1.07 inches of rain in March. Aside from a couple days in early February when a weather system moved over Wotje, dropping 0.75 inch of rain on the 5th, 1.75 inches on the 8th, and 1.98 inches on the 9th, and one day in March (the 13th) when 0.82 inch was recorded, virtually no rain has fallen in the northern Marshall Islands during the last four months. The National Weather Service office on Guam issued a revised Drought Information Statement on April 6 which noted that drought is a serious concern for the northern Marshall Islands and other Micronesian islands north of about 8 degrees North latitude. According to a March 24 "WASH report" by the International Organization for Migration (IOM):
- Dry conditions continued in Ailuk and Mejit but both communities were being provided with sufficient water through RO (reverse osmosis) Units and contingency reserves in community catchment tanks. The collected information also indicated that Ebadon (Kwajalein) and Wotho were growing increasingly vulnerable.
- Mejit: A majority of household catchment tanks were empty but there were several "communal" sources of catchment water in use. The RO Unit was being widely used by the population and was producing quality drinking water. Low salinity levels were found in well water and the vegetation appeared to be relatively dry.
- Ailuk: Household catchment tanks levels were low — on average 25% full. This level also applied to the recently constructed stand-alone cement catchments. Salinity levels of well water were normal and vegetation appeared to be enduring the dry conditions, albeit with some visible browning.
- Likiep: water levels in household tanks were low or empty and the land was very dry with dusty conditions.
- Wotje-Wodmej: Most household catchment tanks still had rainwater but were being slowly depleted. Salinity of well water was generally acceptable but the vegetation was visibly dry and had started to brown.
- Ebadon Island (Kwajalein Atoll): There was little remaining captured rainwater within the Ebadon community and the vegetation was visibly impacted by the dry conditions, with the drooping and brown/grey banana and coconut trees being the most evident sign of dry conditions.
- Kwajalein-Enebouj: A majority of household catchment tanks still had captured rainwater and community tanks were full to half full.
- Wotho Atoll: the Wotho community seemed to be in danger of running out of captured rainwater within the next several weeks. IOM found that a large majority of household tanks were completely empty and the community was relying heavily on well water, which appeared to be at GoRMI-established acceptable salinity levels.
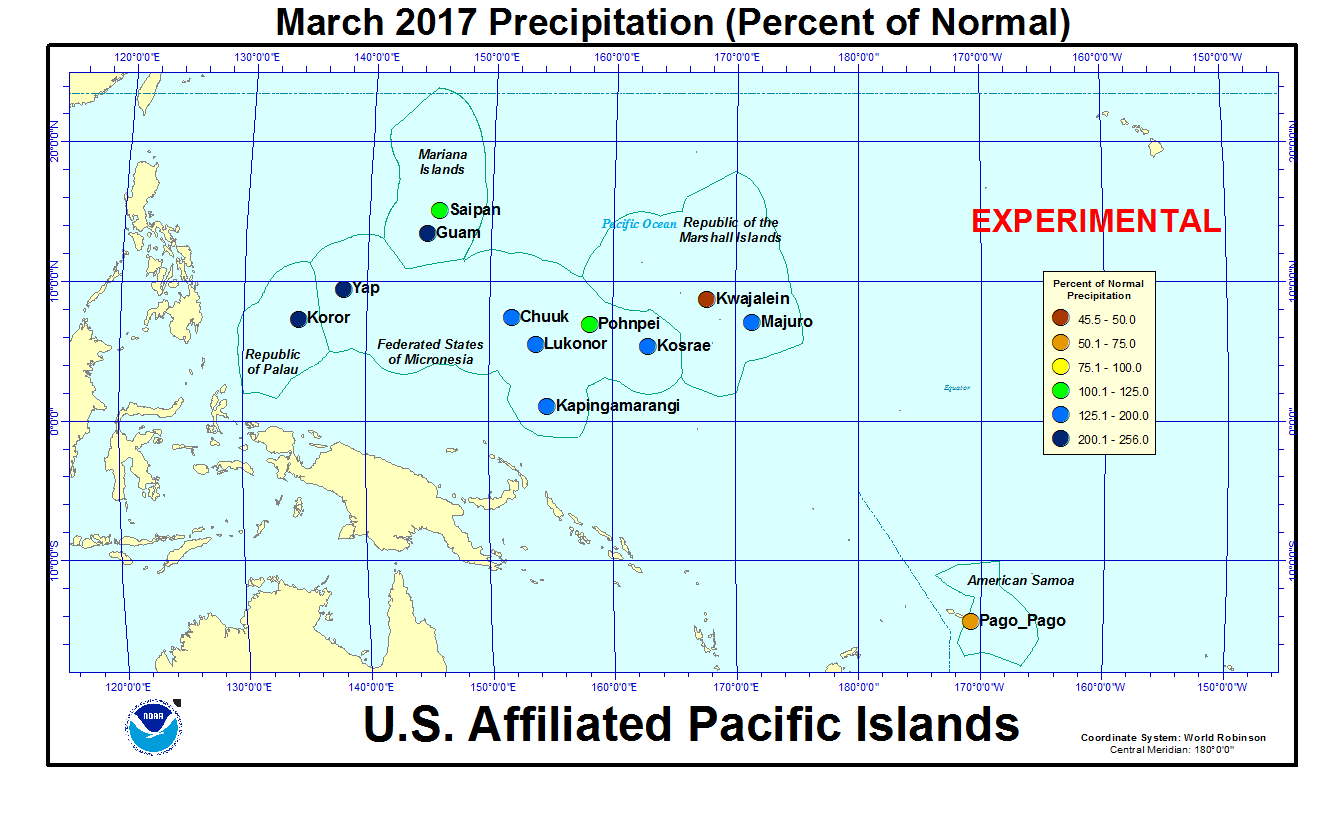
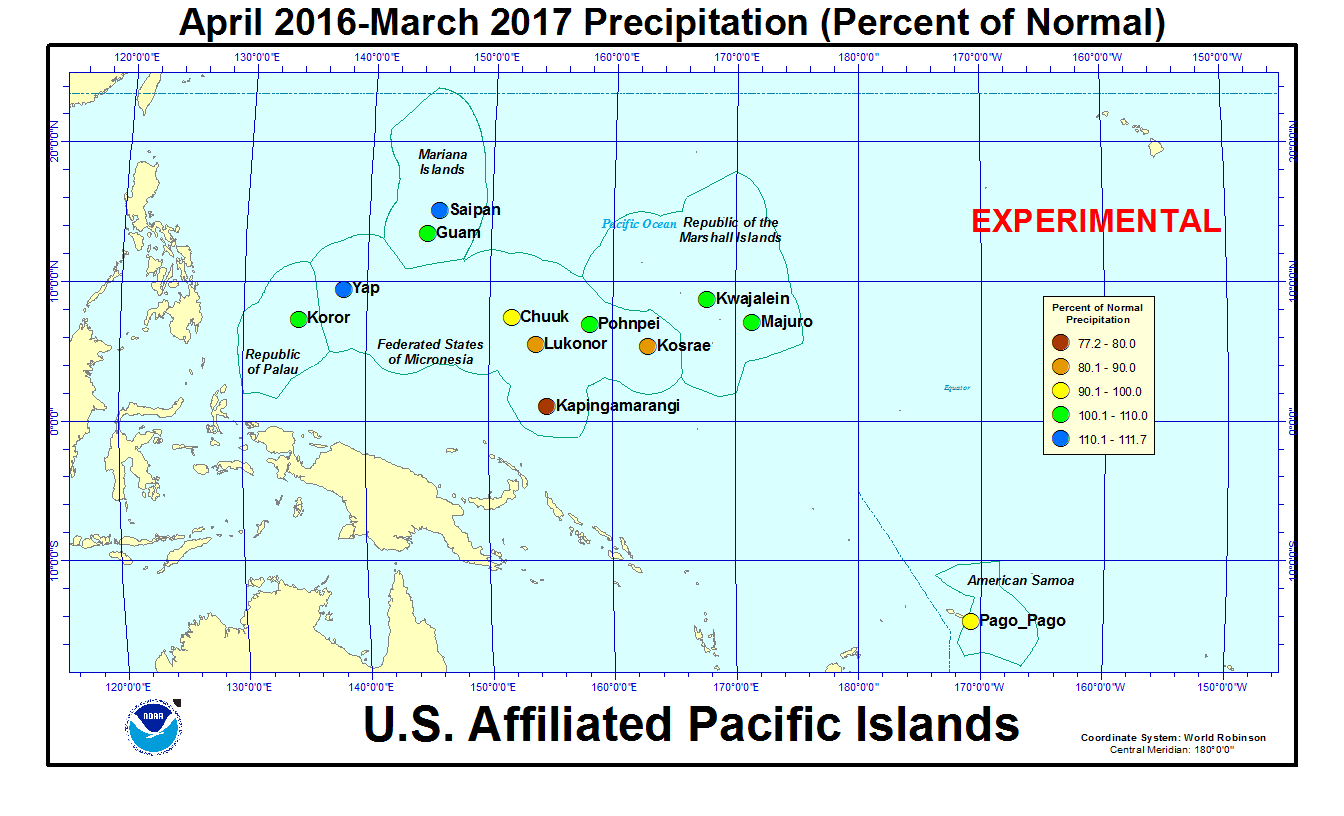
As measured by percent of normal precipitation, Pago Pago has been drier than normal in the short term (March and the last 3 months [January-March 2017]) as well as the long term (last 12 months [April 2016-March 2017]). Kapingamarangi, Kosrae, and Lukonor were dry in the long term but wet in the short term. Kwajalein was dry for March but wetter than normal at the other two time scales. Chuuk, Guam, Koror, Majuro, Pohnpei, Saipan, and Yap were near to wetter than normal at all three time scales.
| Station Name | Apr 2016 | May 2016 | Jun 2016 | Jul 2016 | Aug 2016 | Sep 2016 | Oct 2016 | Nov 2016 | Dec 2016 | Jan 2017 | Feb 2017 | Mar 2017 | Apr- Mar |
|---|---|---|---|---|---|---|---|---|---|---|---|---|---|
| Chuuk | 86% | 107% | 91% | 94% | 74% | 86% | 58% | 98% | 176% | 113% | 114% | 189% | 100% |
| Guam NAS | 52% | 53% | 125% | 67% | 141% | 124% | 115% | 137% | 170% | 155% | 167% | 256% | 104% |
| Kapingamarangi | 94% | 34% | 24% | 66% | 91% | 77% | 26% | 71% | 114% | 159% | 207% | 126% | 77% |
| Koror | 135% | 115% | 93% | 45% | 61% | 115% | 153% | 144% | 64% | 131% | 175% | 245% | 103% |
| Kosrae | 23% | 72% | 130% | 88% | 88% | 89% | 90% | 56% | 168% | 103% | 213% | 150% | 88% |
| Kwajalein | 21% | 57% | 142% | 101% | 83% | 64% | 168% | 126% | 156% | 285% | 212% | 46% | 109% |
| Lukonor | 113% | 102% | 73% | 43% | 73% | 120% | 74% | 198% | 128% | 138% | 66% | 160% | 90% |
| Majuro | 22% | 110% | 66% | 90% | 75% | 123% | 120% | 129% | 103% | 228% | 138% | 199% | 110% |
| Pago Pago | 329% | 102% | 73% | 81% | 83% | 83% | 55% | 127% | 111% | 72% | 153% | 52% | 99% |
| Pohnpei | 60% | 80% | 143% | 79% | 112% | 144% | 120% | 115% | 142% | 182% | 71% | 115% | 109% |
| Saipan | 68% | 87% | 57% | 42% | 186% | 191% | 48% | 79% | 95% | 182% | 199% | 108% | 112% |
| Yap | 62% | 113% | 54% | 67% | 88% | 66% | 164% | 156% | 101% | 198% | 370% | 205% | 112% |
| Station Name | Apr 2016 | May 2016 | Jun 2016 | Jul 2016 | Aug 2016 | Sep 2016 | Oct 2016 | Nov 2016 | Dec 2016 | Jan 2017 | Feb 2017 | Mar 2017 | Apr- Mar |
|---|---|---|---|---|---|---|---|---|---|---|---|---|---|
| Chuuk | 10.73" | 12.11" | 10.61" | 11.27" | 9.50" | 10.04" | 6.73" | 10.39" | 19.83" | 11.37" | 8.27" | 15.74" | 136.59" |
| Guam NAS | 1.31" | 1.80" | 7.73" | 6.77" | 20.85" | 15.65" | 13.14" | 10.13" | 8.68" | 6.22" | 5.06" | 5.30" | 102.64" |
| Kapingamarangi | 12.78" | 4.07" | 3.30" | 9.33" | 7.38" | 7.61" | 2.14" | 6.58" | 11.22" | 14.54" | 19.18" | 14.44" | 112.57" |
| Koror | 9.90" | 13.55" | 16.25" | 8.28" | 8.20" | 13.51" | 18.06" | 16.38" | 7.13" | 13.30" | 14.99" | 18.26" | 157.81" |
| Kosrae | 3.99" | 12.70" | 18.99" | 13.07" | 12.48" | 12.71" | 9.87" | 7.76" | 26.99" | 17.21" | 27.51" | 24.16" | 187.44" |
| Kwajalein | 1.13" | 3.80" | 9.81" | 9.96" | 8.12" | 6.90" | 18.73" | 14.16" | 10.36" | 9.00" | 5.60" | 1.07" | 98.64" |
| Lukonor | 12.83" | 11.92" | 8.49" | 6.84" | 10.31" | 12.23" | 8.41" | 18.02" | 14.42" | 11.58" | 5.90" | 14.83" | 135.78" |
| Majuro | 2.05" | 11.12" | 7.27" | 10.09" | 8.78" | 13.73" | 15.28" | 17.36" | 11.77" | 17.65" | 9.50" | 13.07" | 137.67" |
| Pago Pago | 30.87" | 9.89" | 3.88" | 4.48" | 4.49" | 5.45" | 5.12" | 12.86" | 14.24" | 9.57" | 18.32" | 5.60" | 124.77" |
| Pohnpei | 11.01" | 16.06" | 21.18" | 12.12" | 15.91" | 18.13" | 18.39" | 17.00" | 22.83" | 24.00" | 6.76" | 15.16" | 198.55" |
| Saipan | 1.78" | 2.07" | 2.05" | 3.76" | 24.40" | 19.31" | 5.07" | 4.42" | 3.67" | 4.61" | 5.15" | 2.04" | 78.33" |
| Yap | 3.47" | 8.90" | 6.46" | 10.03" | 13.10" | 8.89" | 20.00" | 13.78" | 8.59" | 12.67" | 19.19" | 9.35" | 134.43" |
| Station Name | Apr 2016 | May 2016 | Jun 2016 | Jul 2016 | Aug 2016 | Sep 2016 | Oct 2016 | Nov 2016 | Dec 2016 | Jan 2017 | Feb 2017 | Mar 2017 | Apr- Mar |
|---|---|---|---|---|---|---|---|---|---|---|---|---|---|
| Chuuk | 12.47" | 11.30" | 11.66" | 11.98" | 12.86" | 11.71" | 11.51" | 10.61" | 11.25" | 10.10" | 7.25" | 8.32" | 136.77" |
| Guam NAS | 2.53" | 3.40" | 6.18" | 10.14" | 14.74" | 12.66" | 11.44" | 7.38" | 5.11" | 4.01" | 3.03" | 2.07" | 99.09" |
| Kapingamarangi | 13.64" | 12.08" | 13.78" | 14.15" | 8.13" | 9.93" | 8.19" | 9.27" | 9.84" | 9.15" | 9.27" | 11.43" | 145.85" |
| Koror | 7.32" | 11.83" | 17.48" | 18.53" | 13.50" | 11.77" | 11.84" | 11.39" | 11.16" | 10.18" | 8.56" | 7.44" | 152.90" |
| Kosrae | 17.51" | 17.75" | 14.64" | 14.91" | 14.22" | 14.22" | 10.94" | 13.83" | 16.11" | 16.67" | 12.93" | 16.06" | 213.87" |
| Kwajalein | 5.26" | 6.72" | 6.93" | 9.87" | 9.74" | 10.74" | 11.18" | 11.28" | 6.66" | 3.16" | 2.64" | 2.35" | 90.41" |
| Lukonor | 11.31" | 11.69" | 11.65" | 15.93" | 14.04" | 10.15" | 11.32" | 9.08" | 11.27" | 8.41" | 8.93" | 9.26" | 151.36" |
| Majuro | 9.42" | 10.11" | 11.01" | 11.17" | 11.69" | 11.17" | 12.73" | 13.44" | 11.39" | 7.74" | 6.88" | 6.58" | 125.25" |
| Pago Pago | 9.39" | 9.66" | 5.33" | 5.55" | 5.38" | 6.53" | 9.26" | 10.14" | 12.84" | 13.34" | 12.00" | 10.68" | 125.57" |
| Pohnpei | 18.41" | 19.96" | 14.81" | 15.43" | 14.26" | 12.55" | 15.27" | 14.83" | 16.08" | 13.18" | 9.55" | 13.17" | 182.36" |
| Saipan | 2.63" | 2.38" | 3.62" | 8.91" | 13.13" | 10.09" | 10.62" | 5.61" | 3.85" | 2.53" | 2.59" | 1.89" | 70.25" |
| Yap | 5.63" | 7.85" | 12.04" | 15.08" | 14.82" | 13.50" | 12.18" | 8.83" | 8.51" | 6.39" | 5.19" | 4.56" | 120.31" |
An analysis of historical data for the USAPI stations in the Global Historical Climatology Network-Daily (GHCN-D) dataset, augmented with fill-in data from the 1981-2010 Normals, indicated that long-term dryness persisted at some stations, but wet conditions dominated in the short term. The following table lists the precipitation ranks for March 2017, October 2016-March 2017 (last 6 months), and April 2016-March 2017 (the last 12 months). Some stations have a long period of record and their dataset is fairly complete, while other stations have a shorter period of record and the dataset has some missing data.
Rank of 1 = driest.
| Station | Mar 2017 Rank |
Mar No. of Years |
Oct 2016- Mar 2017 Rank |
Oct- Mar No. of Years |
Apr 2016- Mar 2017 Rank |
Apr- Mar No. of Years |
Period of Record |
| Jaluit | 23 | 34 | 28 | 32 | 13 | 32 | 1981-2017 |
| Koror | 64 | 66 | 63 | 66 | 44 | 65 | 1951-2017 |
| Woleai | 13 | 35 | 22 | 29 | 10 | 21 | 1968-2017 |
| Yap | 56 | 66 | 66 | 66 | 47 | 65 | 1951-2017 |
| Majuro | 51 | 63 | 59 | 63 | 40 | 62 | 1954-2017 |
| Mili | 33 | 34 | MSG | 33 | MSG | 31 | 1981-2017 |
| Ailinglapalap | 23 | 34 | 31 | 32 | 23 | 31 | 1981-2017 |
| Kosrae | 38 | 47 | 24 | 34 | 13 | 29 | 1954-2017 |
| Lukonor | 27 | 33 | 23 | 31 | 10 | 20 | 1981-2017 |
| Saipan | 24 | 36 | 6 | 28 | 22 | 28 | 1981-2017 |
| Pohnpei | 40 | 66 | 58 | 66 | 47 | 65 | 1951-2017 |
| Kwajalein | 9 | 65 | 61 | 65 | 33 | 64 | 1952-2017 |
| Kapingamarangi | 18 | 27 | 11 | 19 | 2 | 12 | 1962-2017 |
| Chuuk | 59 | 66 | 51 | 65 | 27 | 65 | 1951-2017 |
| Guam | 53 | 61 | 48 | 60 | 32 | 60 | 1957-2017 |
| Nukuoro | 29 | 35 | 26 | 32 | 22 | 31 | 1981-2017 |
| Pago Pago | 7 | 51 | 18 | 51 | 26 | 50 | 1966-2017 |
| Wotje | 17 | 34 | 20 | 31 | 24 | 31 | 1981-2017 |

[top]
State/Regional/National Moisture Status
A detailed review of drought and moisture conditions is available for all contiguous U.S. states, the nine standard regions, and the nation (contiguous U.S.):
| northeast u. s. | east north central u. s. | central u. s. |
| southeast u. s. | west north central u. s. | south u. s. |
| southwest u. s. | northwest u. s. | west u. s. |
| Contiguous United States |
[top]
Contacts & Questions