|
Contents Of This Report: |

|
Please note that the values presented in this report are based on preliminary data. They will change when the final data are processed, but will not be replaced on these pages.
National Drought Overview
|
|
[top]
Detailed Drought Discussion
Overview

The U.S. Drought Monitor drought map valid January 3, 2017.
During December 2016, numerous troughs and cutoff lows moving in the jet stream flow dragged cold fronts and low pressure systems across the CONUS. These weather systems brought above-normal precipitation to the drought areas of the West, Ohio Valley, Southeast, and Northeast, contracting drought in these areas. But the region from the Southern Plains to Mid-Mississippi Valley was in between the storm tracks, resulting in a drier-than-normal month. Persistent dryness for the last 2 to 3 months resulted in expanding drought and abnormal dryness here. When precipitation is integrated across the CONUS, the wet and dry areas gave December 2016 a rank of 34th wettest December in the 1895-2016 record. The December precipitation anomaly pattern across Alaska was mixed, but generally drier than normal except wetter than normal at some interior and panhandle locations. In Hawaii, December was generally drier than normal in the north from Kauai to Oahu and wetter than normal in the south from Maui to The Big Island. The anomaly pattern across Puerto Rico was mixed, but generally wetter than normal in the west and extreme southeast. Drought was minimal in Alaska, Hawaii, and Puerto Rico. Drought contraction was greater than expansion, so the USDM-based national moderate-to-exceptional drought footprint decreased across the CONUS from 31.5 percent at the end of November to 22.5 percent at the end of December (from 26.3 percent to 18.8 percent for all of the U.S.). According to the Palmer Drought Index, which goes back to the beginning of the 20th century, about 13.2 percent of the CONUS was in moderate to extreme drought at the end of December, a decrease from last month's 20.0 percent.
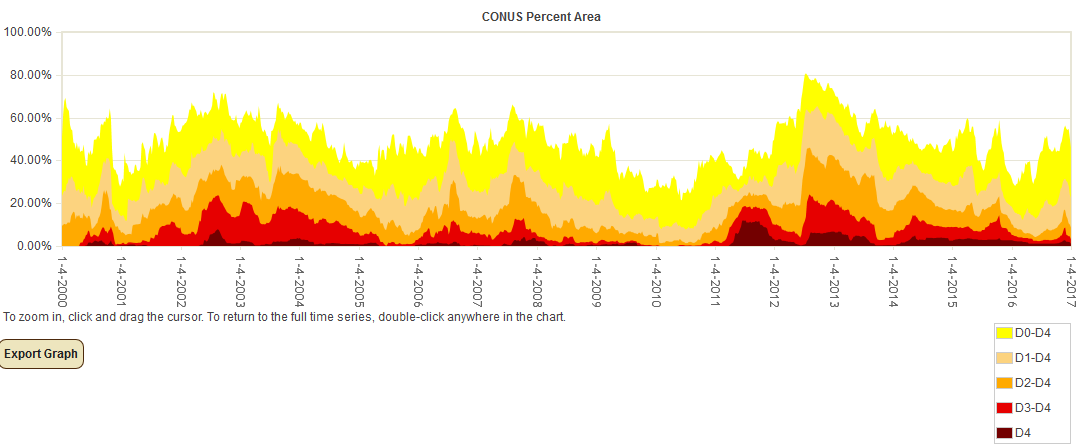
Percent area of the CONUS in moderate to exceptional drought, January 4, 2000 to present, based on the U.S. Drought Monitor.
Palmer Drought Index
The Palmer drought indices measure the balance between moisture demand (evapotranspiration driven by temperature) and moisture supply (precipitation). The Palmer Z Index depicts moisture conditions for the current month, while the Palmer Hydrological Drought Index (PHDI) and Palmer Drought Severity Index (PDSI) depict the current month's cumulative moisture conditions integrated over the last several months. While both the PDSI and PHDI indices show long-term moisture conditions, the PDSI depicts meteorological drought while the PHDI depicts hydrological drought. The PDSI map shows less severe and extensive drought in parts of the West and Southeast than the PHDI map because the meteorological conditions that produce drought and wet spell conditions are not as long-lasting as the hydrological impacts.
|
 |
Used together, the Palmer Z Index and PHDI maps show that short-term dry conditions occurred across parts of the Northwest, Southern Plains, and East. This short-term dryness expanded or intensified long-term dry conditions in December compared to November in parts of the Southeast, Southern Plains, and Great Lakes, and reduced the intensity of long-term wet conditions in coastal Washington. Short-term wet conditions reduced long-term drought conditions in parts of the West and Southeast.
Standardized Precipitation Index
The Standardized Precipitation Index (SPI) measures moisture supply. The SPI maps here show the spatial extent of anomalously wet and dry areas at time scales ranging from 1 month to 24 months.
 |
 |
 |

The SPI maps illustrate how moisture conditions have varied considerably through time and space over the last two years. The Southern Plains to Mid-Mississippi Valley region is dry for the last 1 to 3 months. The dryness spreads into the Ohio Valley at the 2- and 3-month time scales and into much of the Central Plains at 3 months. The High Plains of Colorado and southeast Wyoming have dryness indicated at the 3- to 9-month time scales. Eastern Oklahoma is dry on the 1- to 12-month maps. A few areas of the Southeast have dry conditions at the 1- and 24-month time scales, but dryness dominates there at the 2- to 12-month time scales. Parts of the Northeast are dry at the 2- to 24-month time scales, especially in southern New England at the longer time scales. Parts of the Pacific Northwest or Northern Rockies are dry at the 1-, 2-, and 24-month time scales, but wetness otherwise dominates at the other time scales there. Southern California shows up as dry on the 24-month map.
 |
 |
 |
Standardized Precipitation Evapotranspiration Index
The SPI measures water supply (precipitation), while the SPEI (Standardized Precipitation Evapotranspiration Index) measures the combination of water supply (precipitation) and water demand (evapotranspiration as computed from temperature). Warmer temperatures tend to increase evapotranspiration, which generally makes droughts more intense.
 1-month SPEI for current month.
|
 1-month SPI for current month.
|
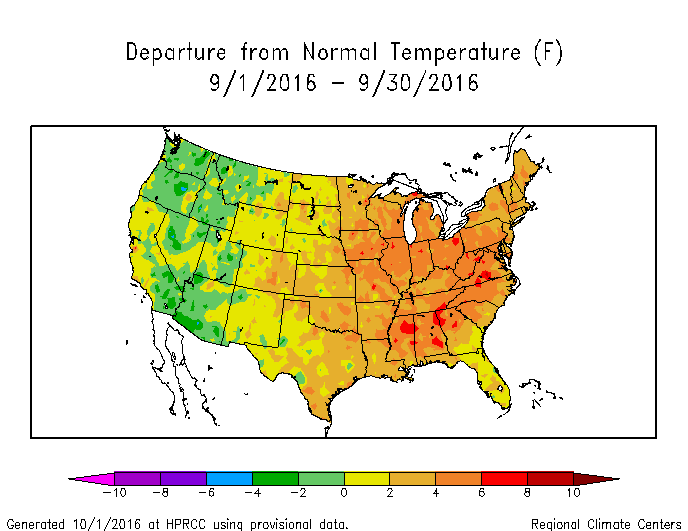
December 2016 temperatures were colder than normal across a large part of the CONUS from the Pacific Northwest to Ohio Valley. Only the Gulf Coast states were significantly warmer than normal. Much of the Southern Plains to Mid-Mississippi Valley and parts of the Northwest and central Florida were drier than normal. The combination of unusually warm temperatures and the lack of precipitation resulted in the 1-month SPEI map showing more severe drought conditions than the 1-month SPI map in Florida. But when the anomalous warmth and dryness of the last 12 months is examined, the SPEI maps show more severe drought conditions than the corresponding SPI maps in many parts of the CONUS (SPEI maps for last 3, 6, and 12 months) (SPI maps for last 3, 6, and 12 months).
 |
 |
 |
| Significant differences between the SPEI and SPI maps begin to appear in the West at the 24-month time frame (SPEI vs. SPI) and become increasingly significant at the 36-month (SPEI vs. SPI), 48-month (SPEI vs. SPI), 60-month (SPEI vs. SPI), and even 72-month (SPEI vs. SPI) time scales. This is due to persistent above-normal temperatures in the West for the last several years which have increased evapotranspiration and exacerbated drought conditions. Eleven of the last 17 years ranked in the top 20 warmest category, with last year (2015) being the warmest. Even with widespread near- to cooler-than-normal temperatures across the West in August, September, October, and December 2016, the 2016 annual temperature still ranked as the fourth warmest on record. |
 Western U.S. temperature, January-December, 1895-2016.
|
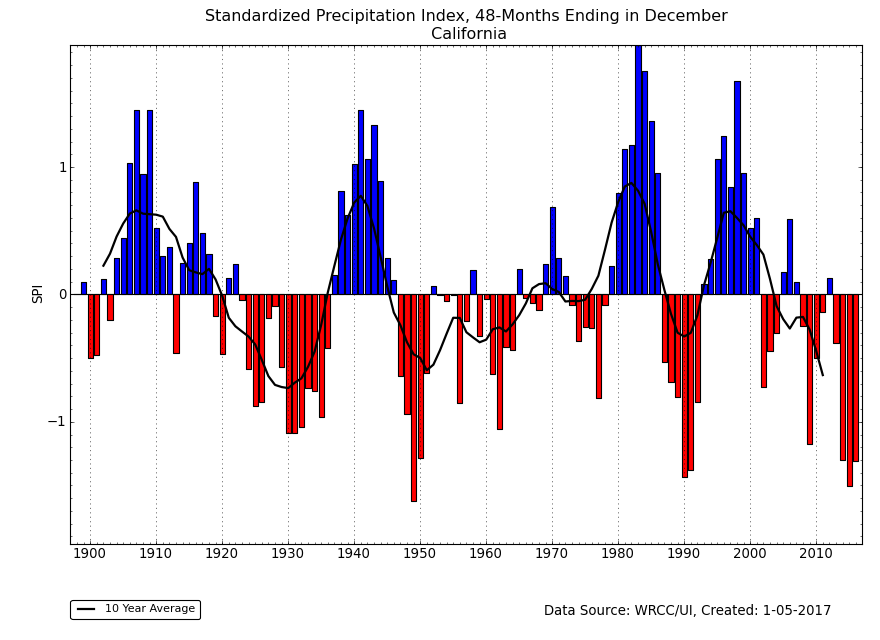
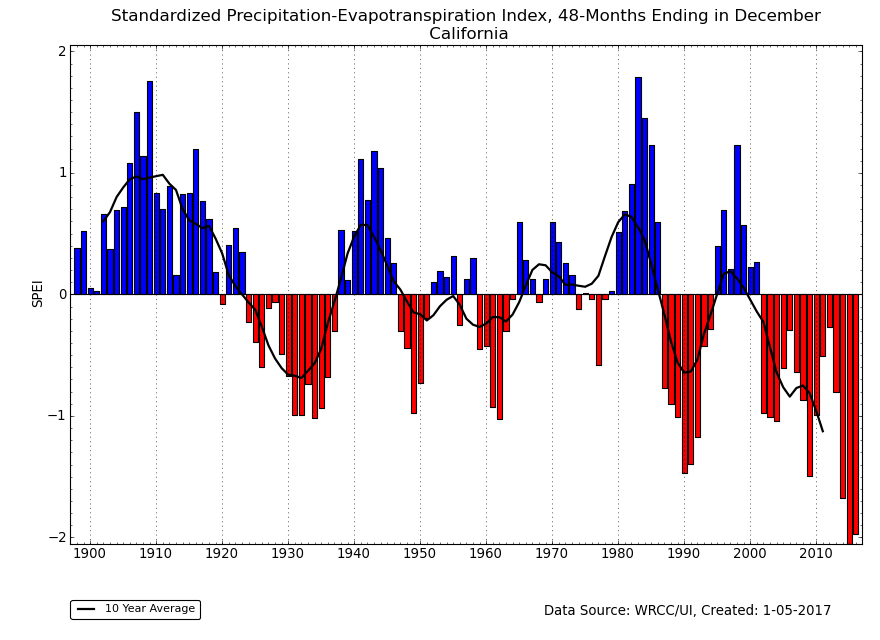
This is especially the case in California, where the last three years were the three warmest years for the state in the 1895-2016 record. The last three years cap a period of persistent unusual warmth which has lasted over three decades. The precipitation for the last 12 months gave California a statewide precipitation rank of 29th wettest (94th driest) for 2016. But the persistent dryness since 2000 still gave the state the fifth driest SPI for the last 48 and 72 months, and eighth driest for the last 60 months. When the temperature is factored in, California has had the most severe SPEI on record for the last 72 months and second most severe SPEI for the last 48 and 60 months.
 California statewide temperature, Annual, 1895-2016.
|
 California statewide 72-month SPEI for December, 1895-2016.
|
Regional Discussion
 USDA/NRCS statewide reservoir storage for end of December 2016.
|
 USGS streamflow percentiles for December 2016.
|
CONUS Agricultural & Hydrological Impacts:
Drought conditions at the end of December 2016 were reflected in a number of meteorological, hydrological, and agricultural indicators, both observed and modeled. These include: evapotranspiration (EDDI, ESI) and soil moisture (USDA observations, SMOS satellite-based model, Leaky Bucket model, CPC model, NLDAS model topsoil and total column, VIC model, NASA GRACE surface and root zone soil moisture). Where the dry conditions have been continuing for several months, hydrological conditions such as streamflow and groundwater supplies (USGS observations, NASA GRACE estimates) were reduced, as well as reservoir levels in the West. On a national scale, as of January 3rd, 2017, 26 percent of the nation's cattle inventory, 24 percent of the nation's hay, 26 percent of winter wheat production, eight percent of soybean production, and nine percent of corn production were in drought. These percentages are decreases compared to the values for the end of November.
Drought conditions at the end of the month, as depicted on the January 3rd, 2017 USDM map, included the following CONUS core drought and abnormally dry areas:
- Abnormally dry (D0) to moderate (D1) drought conditions covered a several parts of the western U.S., with pockets of severe (D2) drought occurring in some areas, and extreme (D3) to exceptional (D4) drought lingering in California;
- Abnormally dry and moderate to extreme drought conditions expanded in parts of the Plains;
- Abnormally dry and moderate to extreme drought conditions contracted in parts of the Northeast and essentially disappeared from the Ohio Valley;
- Exceptional drought disappeared and moderate to extreme drought and abnormal dryness mostly contracted in the Southeast to Lower Mississippi Valley.
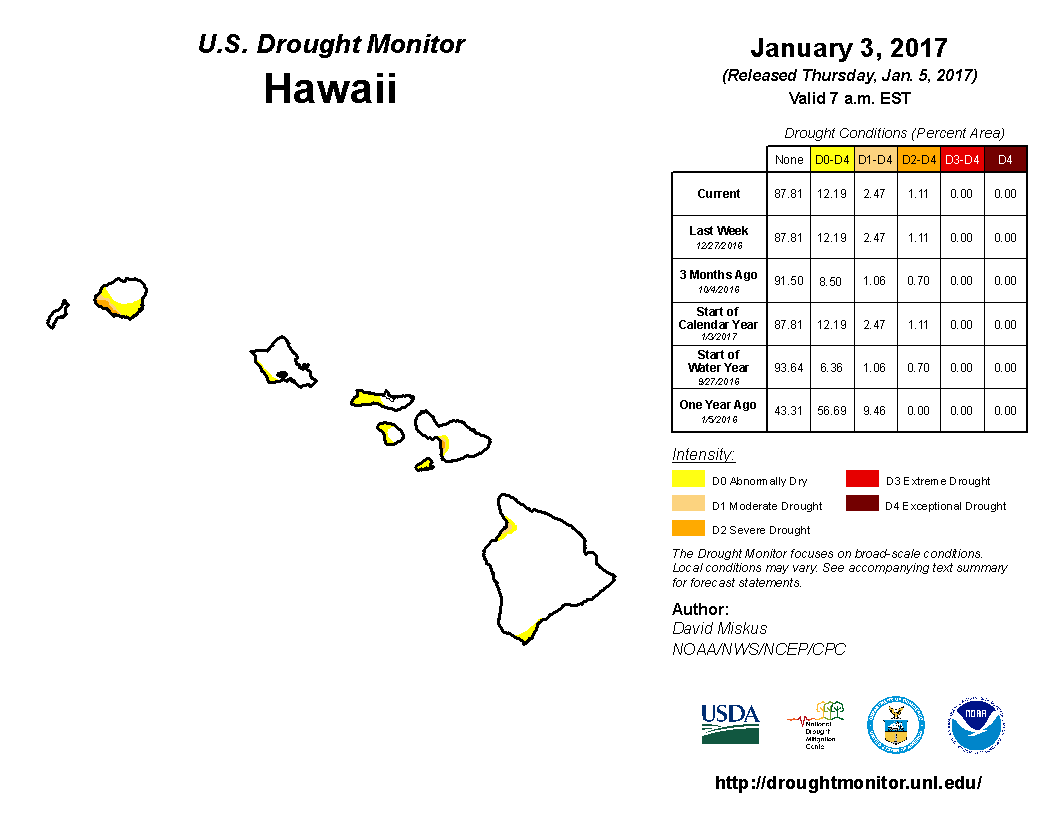
Hawaii: December 2016 was generally drier than normal across the northern islands (Kauai to Oahu) and wetter than normal across the southern islands (Maui to The Big Island). The last 2 to 3 months had a similar anomaly pattern. At the 6- to 9-month time scales, Oahu was wetter than normal but the other islands had an anomaly pattern similar to the last 3 months. A mixed precipitation anomaly pattern is evident at the longer time scales (last 12, 24, and 36 months). Drought contracted during December, with moderate to severe drought covering about three percent of the state according to the January 3rd, 2017 USDM map.

Alaska: Scattered low elevation stations in the interior and along the Alaskan panhandle had above-normal precipitation during December, but most of the stations were drier than normal for both the low elevation stations and high elevation SNOTEL stations. When integrated across the climate divisions, December was mostly drier than average. The 2-month anomaly pattern was similar. Drier-than-normal conditions dominated for the last 3 months (maps for climate divisions, low elevation stations, and SNOTEL stations and basins). At the 6-month time scale, interior Alaska is wetter than normal while the southeast is drier than normal (maps for climate divisions and low elevation stations). The pattern becomes mixed at longer time scales (12-month climate division map, low elevation station maps for the last 9, 12, 24, 36 months). The temperature anomaly pattern consisted of warmer-than-normal temperatures in the west transitioning to cooler-than-normal temperatures in the southeast for December (divisional and station maps) and the last 3 months (divisional and station maps). A mixed temperature anomaly pattern was evident on the station map for the last two months. Above-normal temperatures dominated at the longer time scales (divisional and station maps), with record warmth widespread on the 12-month climate division map. Mountain snowpack and snow water content were below normal. About 11 percent of the state was abnormally dry on the January 3rd USDM map.
Puerto Rico: The December precipitation anomaly pattern across Puerto Rico was mixed, but generally wetter than normal in the west and extreme southeast. The last two to three months were generally wetter than normal, but an area of below-normal precipitation in the southeast is evident at the six- to 12-month time scales. Soils were moist across most of the island. Puerto Rico was free of drought and abnormal dryness on the January 3rd, 2017 USDM map.
CONUS State Precipitation Ranks:
| December 2016 was drier than normal across much of the Central Plains to Ohio Valley, northern Mississippi to Virginia coast, central Florida, and parts of the Pacific Northwest. Four states in the CONUS ranked in their driest third of the 1895-2016 record. |

|
 |

|
October-December 2016 was drier than normal from the Central Plains to the Southeast. The dryness showed up on the statewide level with 14 states in the CONUS ranking in their driest third of the 1895-2016 record, including Alabama which ranked ninth driest.
 |

|
The last six months were drier than normal across much of the Southeast and parts of the West, Plains, and Northeast. Patches of wetter-than-normal conditions masked the state ranks in the West and Plains, except for Colorado. A total of nine states ranked in the driest third of the historical record for July-December, with Alabama (sixth driest) and Georgia (eighth driest) ranking in the top ten driest category.
 |
|
January-December 2016 was drier than normal across parts of the West and Plains and much of the Southeast and Northeast. Ten states in the Southeast and Northeast ranked in their driest third of the historical record. Three states were in the top ten driest category and included Connecticut (fourth driest year), Georgia (ninth driest), and Massachusetts (tenth driest). The last five years have been consistently drier than average in Connecticut.
 |

|
|

|
Percent area of the Western U.S. in moderate to extreme drought, January 1900 to present, based on the Palmer Drought Index.
December 2016 was wetter than normal across much of the West, especially the Rockies. Parts of the Northwest were drier than normal. The water year to date (October 1-December 31) has been wetter than normal for much of the West, especially the Pacific Northwest and Northern Rockies. Some of the high elevation SNOTEL stations have had a near-record wet October-December. With below-normal temperatures in December, some of the precipitation fell as snow, improving the mountain snowpack in some coastal ranges and the Central Rockies. But the snowpack in other areas was lagging due to the warm temperatures in November. The slow melting during spring of a thick winter snowpack provides an important water source for the West during the summer dry season.
The above-normal precipitation which fell across parts of the West during December and the water year to date improved drought conditions in some areas, but it was not enough to erase deficits which have built up over the last several years. According to the USDM, 21.5 percent of the West was experiencing moderate to exceptional drought at the end of December, which is less than the 25.6 percent of the previous month. The Palmer Drought Index percent area statistic for the West fell to 7.8 percent compared to 19.3 percent a month ago.
 Primary Hard Red Winter Wheat Belt precipitation, December, 1895-2016.
|
 Primary Hard Red Winter Wheat Belt precipitation, October-December, 1895-2016.
|
December 2016 was generally drier than normal across the Primary Hard Red Winter Wheat agricultural belt, while parts were cooler than normal and other parts near normal. The month ranked as the 57th driest and 38th coolest December, regionwide, in the 1895-2016 record. October serves as the beginning of the growing season. October-December 2016 was generally drier and warmer than normal across the region, ranking as the third warmest and 25th driest October-December, regionwide, on record.
NOAA Regional Climate Centers:
A more detailed drought discussion, provided by the NOAA Regional Climate Centers and others, can be found below.
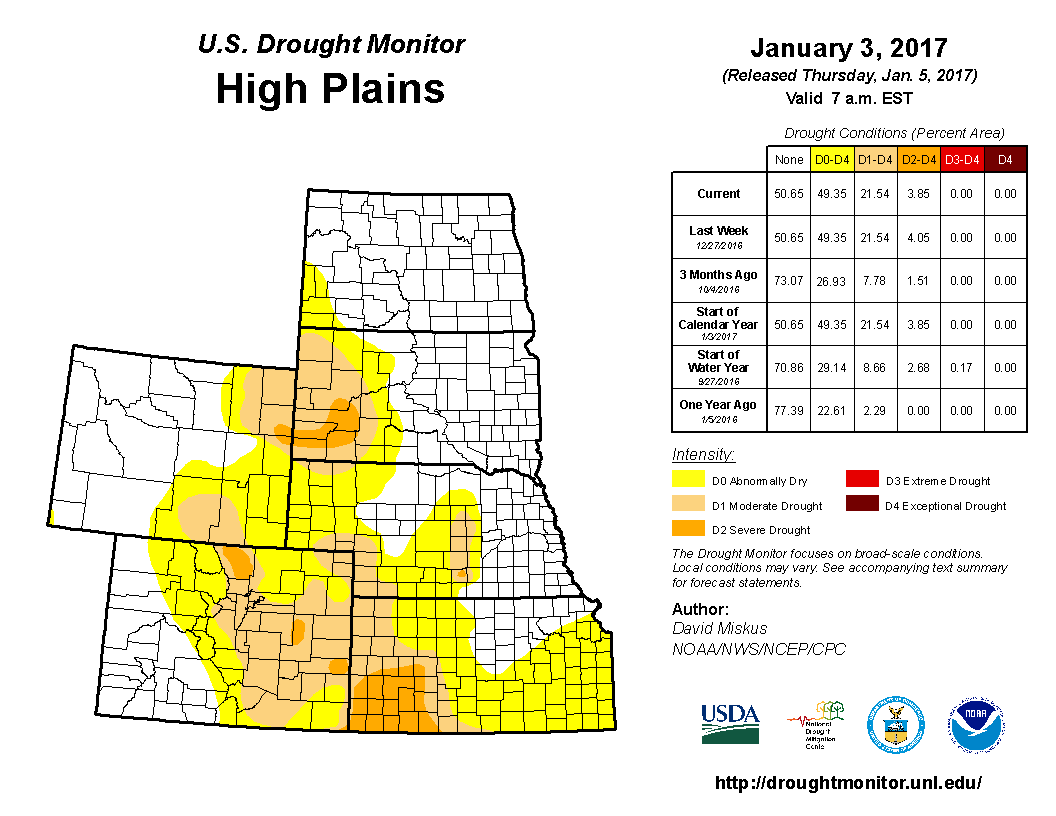
As described by the High Plains Regional Climate Center, the warm pattern that had been present throughout much of the fall finally gave way to cooler conditions to begin the winter season. Arctic air masses pushed their way through the High Plains several times during December. The cooler temperatures were accompanied by wetter conditions throughout a large part of the region. Several storm systems brought rain, freezing rain, and snow to the High Plains, and the region experienced a wide range of weather events, including blizzards, ice storms, thunderstorms, and even tornadoes. These systems did have some positive impacts. For example, the moisture was beneficial to parts of the Dakotas where drought has been persistent, and improvements were made in these areas on the USDM by the end of the month. Also, ample snowfall occurred in the Rockies in Colorado and Wyoming, which helped the mountain snowpack recover after an abysmal start to the snowpack season. However, not all parts of the region received excess precipitation in December. It was much drier in Kansas and eastern Colorado, and some areas of these states experienced below-normal precipitation in December as well. As a result, drought conditions persisted in western Kansas and eastern Colorado, and abnormal dryness was introduced to eastern Kansas during December on the USDM.
December brought about both improvements and degradations in drought conditions throughout the High Plains region. Overall, drought conditions improved as the area in drought or abnormal dryness (D0-D4) on the USDM improved from nearly 60 percent to about 50 percent over the course of the month. However, the area in severe drought (D2) increased. The drought that has been affecting the Black Hills region of South Dakota extending westward into Wyoming intensified due to a warm and dry November. However, a cooler and wetter December allowed for slight improvements in the area. One region that was drier in December was eastern Kansas, which received only about 50 percent of normal precipitation, at best. As a result, this region had been placed in the abnormal dryness category (D0) by the end of the month. The area in drought in western Kansas and eastern Colorado persisted, as it was not as wet as other locations in the High Plains in December. Several impacts were reported in eastern Colorado, such as grasses in poor condition and spotty winter wheat germination. The biggest improvements occurred across parts of the Dakotas and western Colorado. In the northern Plains, December precipitation was 200-400 percent of normal in many areas. A blizzard struck this region around Christmas, and despite its negative impact to travel, it provided beneficial moisture to drought-stricken areas. In western Colorado, mountain snowpack recovered quite well during December, which improved conditions there.
As explained by the Southern Regional Climate Center, December precipitation totals in the Southern region varied spatially bringing with them a mixed bag of wetter than normal conditions in some counties, and drier than normal conditions in other counties, and December was the fourth consecutive warmer-than-normal month for the region. Along the south western Texas coast, precipitation totals varied between 150 to 200 percent of normal. To the north in central Texas and in Oklahoma, precipitation was scarce, with most stations reporting only between 5 to 50 percent of normal precipitation. This was also the case throughout most of northwestern Arkansas. Although precipitation was slightly below normal in the northern half of the state of Mississippi, the amount of precipitation was enough to help alleviate drought conditions. Near-normal precipitation in western and central Tennessee, combined with above-normal precipitation in eastern Tennessee, also helped alleviate drought.
Specifically, drought conditions improved dramatically in the eastern states of Tennessee, Mississippi, Louisiana and Arkansas, while in Oklahoma, conditions worsened from the previous month. At the end of November, approximately half of the Southern region was experiencing some type of drought, with much of Mississippi and Tennessee categorized under extreme drought. As of January 3, 2017, only 27 percent of the Southern region was experiencing drought, with little to no extreme drought remaining. Much of the drought along the Gulf coast was also eradicated. Though precipitation totals in the eastern parts of the region were not high, they were much higher than in previous months. Due to below-normal precipitation in Oklahoma, drought conditions deteriorated slightly with more counties now falling under severe drought.
As summarized by the Midwest Regional Climate Center, temperatures for the month of December averaged within 2 degrees F (1 C) of normal across the entire Midwest, and precipitation was above normal in the northwestern and southeastern parts of the Midwest with drier-than-normal conditions stretching from Missouri to southern Michigan and northwestern Ohio. Large parts of Missouri and Illinois had monthly totals less than 50 percent of normal. In the northwestern third of the region precipitation totals ranged up to more than twice the normal amounts in northwestern Minnesota. Drought eased in the Midwest during the month. December began with more than 10 percent of the region in drought, nearly 8 percent in severe drought or worse, and about 2 percent in extreme drought. The area in drought included nearly all of Kentucky and small parts of neighboring states. Rains in Kentucky led to the lessening of drought severity and eventually the complete elimination of drought in Kentucky by the end of the month. Two small areas in southern Missouri, just over 1 percent of the Midwest, had moderate drought as December came to an end.
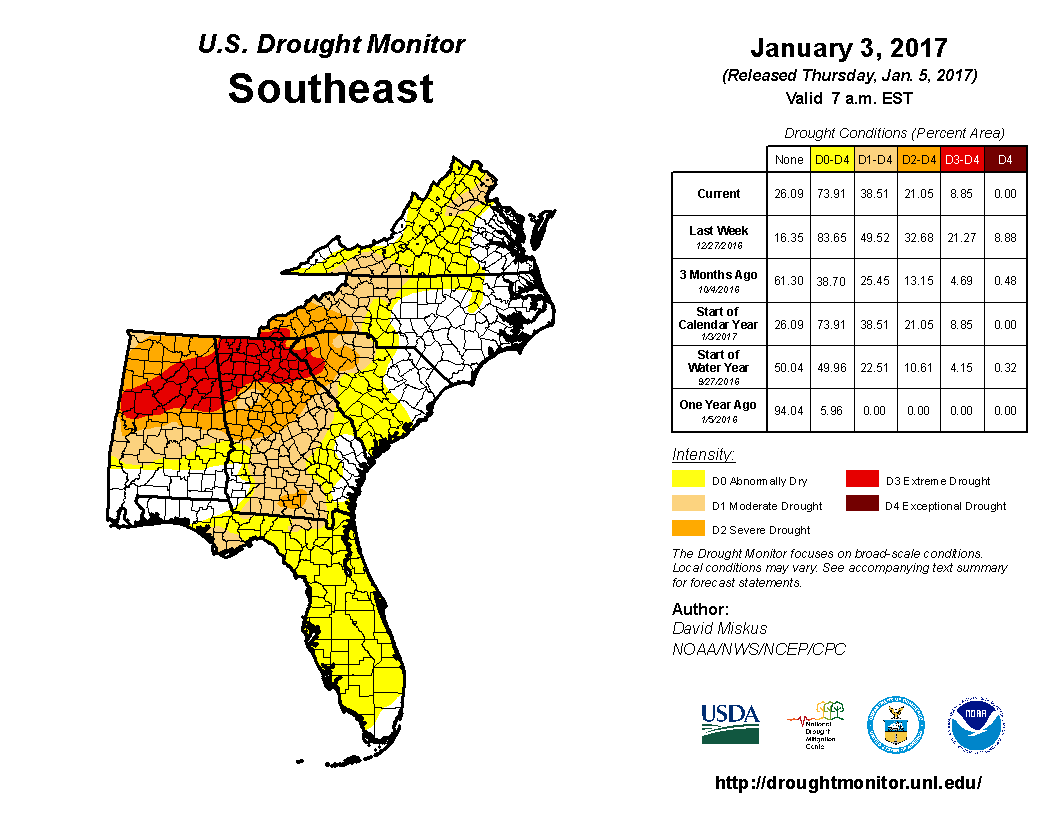
As noted by the Southeast Regional Climate Center, precipitation was highly variable across the Southeast region during December, with several extremes recorded, while mean temperatures ranged from near average to well above average across the region during the month. The driest locations were found across much of central and northern Florida, as well as portions of a broad area extending northeastward from central Alabama to northern Virginia. Monthly precipitation totals were between 5 and 50 percent of normal in these areas. Venice, FL (1955-2016) observed its driest December on record, with only 0.04 inch (1.0 mm) of precipitation. Naples Municipal Airport, FL (2002-2016) recorded its longest streak of 60 days with no measurable precipitation, ending on the 5th of the month.
Temperatures were well above average in Puerto Rico and the U.S. Virgin Islands during the month, as San Juan, PR (1898�2016) observed its warmest December mean temperature on record (80.8 degrees F; 27.1 degrees C). Precipitation was highly variable in Puerto Rico and the U.S. Virgin Islands, with monthly departures ranging from less than 25 percent of normal in southwestern Puerto Rico to more than 400 percent of normal in the west-central portion of the island.
Drought conditions improved significantly across the western half of the region during December. The coverage of extreme-to-exceptional (D3-D4) drought across the Southeast decreased from 36 percent on November 29th to 21 percent on December 27th. Indeed, extreme-to-exceptional drought in Alabama and Georgia decreased by nearly 45 and 13 percent, respectively, during the month. Exceptional drought conditions were removed from the Carolinas, while severe-to-extreme (D2-D3) drought was eliminated from the Florida Panhandle and southwestern Virginia. While the rainfall during December suppressed lingering wildfires, streamflow and lake levels were slower to respond in some areas from the long-term effects of the drought. Some improvement in pasture conditions was reported in drought-stricken portions of the region, but many pastures reached dormancy before the arrival of beneficial rainfall. Livestock producers continued to provide a supplemental feeding for their herds, with many producers concerned about the potential for severe hay shortages later this winter. Small grains and forage were not able to be planted in many areas due to insufficient soil moisture and a persistent lack of rainfall during the planting window. A prevalence of foggy mornings during mid-December increased disease pressure on vegetable crops across portions of southern Florida.
As explained by the Northeast Regional Climate Center, the Northeast received 3.77 inches (95.76 mm) of precipitation, 108 percent of normal, in December, and for the eighth consecutive month, the region averaged out to be warmer than normal. The twelve states were split between drier than normal and wetter than normal, with totals ranging from 81 percent of normal in Rhode Island to 131 percent of normal in West Virginia.
The USDM released on December 1 indicated 54 percent of the Northeast was in a moderate, severe, or extreme drought, with another 24 percent being abnormally dry. During the month, abnormally dry and drought conditions generally remained unchanged or improved across most of the region. Areas that saw conditions deteriorate included portions of southeastern Massachusetts, central Delaware, and southern and coastal New Jersey. The USDM released on December 29 indicated 44 percent of the Northeast was in a moderate, severe, or extreme drought, with another 27 percent being abnormally dry. Streamflow was generally near to below normal for the Northeast during December. As of December 29, the salt front on the Delaware River was 5 miles (8 km) upstream from its normal December location compared to 21 miles (34 km) on December 1. While water levels of some wells returned to near normal, many remained below normal in the drought-stricken areas. Some reservoirs saw an uptick in water levels, but overall they also remained below normal. For instance, Worcester, Massachusetts' reservoir was at 52.8 percent of capacity as of December 11, which is up from 52.1 percent on December 1, but below the December 1 average of 80.3 percent. As of December 30, the New York City reservoir system was at 64.8 percent of capacity compared to the normal 87.5 percent. Due to low streamflow and a drop in groundwater levels, western and central Maryland were placed in a Drought Watch. Mifflin, Juniata, Snyder, and Union counties in Pennsylvania were placed in a Drought Warning on December 16.
As summarized by the Western Regional Climate Center, much of the West saw above-normal precipitation for the month of December, with the main exceptions being Washington, interior Montana and coastal sections of California and Oregon. The Pacific Northwest and northern Rockies experienced well-below-normal temperatures, while temperatures in much of Arizona and New Mexico were well above average.
December was an active weather month over the West characterized by a persistent stronger-than-normal jet stream over the northern half of the US and two major atmospheric river events during the first half of the month. These were both inland penetrating atmospheric rivers that brought widespread heavy rain and snowfall from California all the way to the Rocky Mountains of Wyoming and Montana. This brought some improvement of drought conditions to the region; however, the warm nature of the atmospheric river storms produced high snow levels and snow water equivalent actually decreased in mid-to-low elevation locations over the course of the month. Precipitation was generally below normal in Washington, most notably east of the Cascade Range. Ephrata, Washington, recorded 0.32 in (8.13 mm) of precipitation, 26% of normal. A small region in southwest Nevada, east of the White Mountains, did not benefit from the atmospheric river storms and reported drier than normal conditions. Dyer, Nevada, recorded only 0.08 in (2.03 mm) for the month, 24% of normal.
Temperatures in Alaska were well below normal during the first half of the month and above normal the second half of the month. Interior and southern portions of the state were 3-6 F (1.7 C to 3.3 C) below normal, while the west coast and North Slope were 3-8 F (1.7-4.4 C) above normal. Temperatures at Utqiagvik, on the North Slope, were 7.9 F (4.4 C) above normal, while at the other end of the spectrum, Kenai saw a departure of 6.1 F (3.4 C) below normal. December in Alaska was quite dry in the southern and southeastern portions of the state and for the Interior and North Slope precipitation was well above normal. Fairbanks led the way with 1.96 in (50 mm) precipitation, 306% of normal and the 4th wettest December since records began in 1904. Unlike previous winters, the precipitation in the mainland all fell as snow. In Hawaii, Maui and the Big Island experienced well above normal precipitation with Hana recording 19.4 in (492.8 mm), 278% of normal and the wettest December since records began in 1950. Oahu and Kauai saw significantly below normal precipitation; Lihue recorded 1.17 in (30 mm) rainfall, 23% of normal and the 10th driest December since records began in 1950.
Pacific Islands: The NOAA National Weather Service (NWS) offices, the Pacific ENSO Applications Climate Center (PEAC), and partners provided reports on conditions across the Pacific Islands.
In the U.S. Affiliated Pacific Islands (USAPI) (maps — Federated States of Micronesia, Northern Mariana Islands, Marshall Islands, Republic of Palau, American Samoa, basinwide), December 2016 was drier than normal at Koror and Saipan, and near to above normal at the other stations.
Rainfall amounts were below the minimum thresholds (4 or 8 inches) required to meet most monthly water needs at Koror (in the Republic of Palau); Dugor, Gilman, Maap, North Fanif, and Rumung (in the Federated States of Micronesia [FSM]); Saipan (in the Mariana Islands); and Utirik and Wotje (in the Marshall Islands). December rainfall was above the monthly minimum thresholds at the rest of the regular reporting stations in Micronesia. The 4- and 8-inch thresholds are important because, if monthly precipitation falls below the threshold, then water shortages or drought become a concern.
The 11.22 inches in December at Kapingamarangi broke a string of four dry months. Six of the last eight months were below the 8-inch threshold at Kapingamarangi, and May-December 2016 ranked as the driest May-December in 14 years of record. Drought impacts were beginning to be felt, so the wetter-than-normal December was welcomed. The monthly precipitation at Utirik was 1.99 inches and at Wotje 1.50 inches, which are both significantly dry and well below normal. The National Weather Service office on Guam issued a revised Drought Information Statement on January 12 which noted that residual drought damage may linger for Kapingamarangi and drought is a serious concern for the northern Marshall Islands and is possible in the coming months for the Mariana Islands.
As measured by percent of normal precipitation, Saipan has been drier than normal in the short term (December and the last 3 months [October-December 2016]) but near normal in the long term (last 12 months [January-December 2016]). Chuuk, Guam, Kwajalein, Lukonor, Majuro, Pohnpei, and Yap were near to wetter than normal in the short term but drier than normal in the long term. Kapingamarangi, Kosrae, and Pago Pago were wetter than normal in December but drier than normal at the other two time scales. Koror was wetter than normal for the last 3 months but drier than normal for December and the last 12 months.
| Station Name | Jan 2016 | Feb 2016 | Mar 2016 | Apr 2016 | May 2016 | Jun 2016 | Jul 2016 | Aug 2016 | Sep 2016 | Oct 2016 | Nov 2016 | Dec 2016 | Jan- Dec |
|---|---|---|---|---|---|---|---|---|---|---|---|---|---|
| Chuuk | 63% | 29% | 85% | 86% | 107% | 91% | 94% | 74% | 86% | 58% | 98% | 176% | 85% |
| Guam NAS | 65% | 120% | 79% | 52% | 53% | 125% | 67% | 141% | 124% | 115% | 137% | 170% | 95% |
| Kapingamarangi | 103% | 65% | 88% | 94% | 34% | 24% | 66% | 91% | 77% | 26% | 71% | 114% | 62% |
| Koror | 26% | 30% | 36% | 135% | 115% | 93% | 45% | 61% | 115% | 153% | 144% | 64% | 78% |
| Kosrae | 60% | 113% | 32% | 23% | 72% | 130% | 88% | 88% | 89% | 90% | 56% | 168% | 69% |
| Kwajalein | 64% | 17% | 45% | 21% | 57% | 142% | 101% | 83% | 64% | 168% | 126% | 156% | 96% |
| Lukonor | 123% | 61% | 51% | 113% | 102% | 73% | 43% | 73% | 120% | 74% | 198% | 128% | 82% |
| Majuro | 14% | 46% | 20% | 22% | 110% | 66% | 90% | 75% | 123% | 120% | 129% | 103% | 82% |
| Pago Pago | 34% | 54% | 101% | 329% | 102% | 73% | 81% | 83% | 83% | 55% | 127% | 111% | 90% |
| Pohnpei | 102% | 49% | 44% | 60% | 80% | 143% | 79% | 112% | 144% | 120% | 115% | 142% | 97% |
| Saipan | 54% | 105% | 106% | 68% | 87% | 57% | 42% | 186% | 191% | 48% | 79% | 95% | 103% |
| Yap | 35% | 34% | 15% | 62% | 113% | 54% | 67% | 88% | 66% | 164% | 156% | 101% | 81% |
| Station Name | Jan 2016 | Feb 2016 | Mar 2016 | Apr 2016 | May 2016 | Jun 2016 | Jul 2016 | Aug 2016 | Sep 2016 | Oct 2016 | Nov 2016 | Dec 2016 | Jan- Dec |
|---|---|---|---|---|---|---|---|---|---|---|---|---|---|
| Chuuk | 6.40" | 2.09" | 7.08" | 10.73" | 12.11" | 10.61" | 11.27" | 9.50" | 10.04" | 6.73" | 10.39" | 19.83" | 116.78" |
| Guam NAS | 2.62" | 3.63" | 1.63" | 1.31" | 1.80" | 7.73" | 6.77" | 20.85" | 15.65" | 13.14" | 10.13" | 8.68" | 93.94" |
| Kapingamarangi | 9.40" | 6.04" | 10.02" | 12.78" | 4.07" | 3.30" | 9.33" | 7.38" | 7.61" | 2.14" | 6.58" | 11.22" | 89.87" |
| Koror | 2.64" | 2.53" | 2.68" | 9.90" | 13.55" | 16.25" | 8.28" | 8.20" | 13.51" | 18.06" | 16.38" | 7.13" | 119.11" |
| Kosrae | 9.95" | 14.56" | 5.15" | 3.99" | 12.70" | 18.99" | 13.07" | 12.48" | 12.71" | 9.87" | 7.76" | 26.99" | 148.22" |
| Kwajalein | 2.02" | 0.46" | 1.05" | 1.13" | 3.80" | 9.81" | 9.96" | 8.12" | 6.90" | 18.73" | 14.16" | 10.36" | 86.5" |
| Lukonor | 10.37" | 5.44" | 4.75" | 12.83" | 11.92" | 8.49" | 6.84" | 10.31" | 12.23" | 8.41" | 18.02" | 14.42" | 124.03" |
| Majuro | 1.11" | 3.17" | 1.33" | 2.05" | 11.12" | 7.27" | 10.09" | 8.78" | 13.73" | 15.28" | 17.36" | 11.77" | 103.06" |
| Pago Pago | 4.49" | 6.49" | 10.76" | 30.87" | 9.89" | 3.88" | 4.48" | 4.49" | 5.45" | 5.12" | 12.86" | 14.24" | 113.02" |
| Pohnpei | 13.49" | 4.64" | 5.76" | 11.01" | 16.06" | 21.18" | 12.12" | 15.91" | 18.13" | 18.39" | 17.00" | 22.83" | 176.52" |
| Saipan | 1.36" | 2.72" | 2.00" | 1.78" | 2.07" | 2.05" | 3.76" | 24.40" | 19.31" | 5.07" | 4.42" | 3.67" | 72.61" |
| Yap | 2.23" | 1.77" | 0.70" | 3.47" | 8.90" | 6.46" | 10.03" | 13.10" | 8.89" | 20.00" | 13.78" | 8.59" | 97.92" |
| Station Name | Jan 2016 | Feb 2016 | Mar 2016 | Apr 2016 | May 2016 | Jun 2016 | Jul 2016 | Aug 2016 | Sep 2016 | Oct 2016 | Nov 2016 | Dec 2016 | Jan- Dec |
|---|---|---|---|---|---|---|---|---|---|---|---|---|---|
| Chuuk | 10.10" | 7.25" | 8.32" | 12.47" | 11.30" | 11.66" | 11.98" | 12.86" | 11.71" | 11.51" | 10.61" | 11.25" | 136.77" |
| Guam NAS | 4.01" | 3.03" | 2.07" | 2.53" | 3.40" | 6.18" | 10.14" | 14.74" | 12.66" | 11.44" | 7.38" | 5.11" | 99.09" |
| Kapingamarangi | 9.15" | 9.27" | 11.43" | 13.64" | 12.08" | 13.78" | 14.15" | 8.13" | 9.93" | 8.19" | 9.27" | 9.84" | 145.85" |
| Koror | 10.18" | 8.56" | 7.44" | 7.32" | 11.83" | 17.48" | 18.53" | 13.50" | 11.77" | 11.84" | 11.39" | 11.16" | 152.90" |
| Kosrae | 16.67" | 12.93" | 16.06" | 17.51" | 17.75" | 14.64" | 14.91" | 14.22" | 14.22" | 10.94" | 13.83" | 16.11" | 213.87" |
| Kwajalein | 3.16" | 2.64" | 2.35" | 5.26" | 6.72" | 6.93" | 9.87" | 9.74" | 10.74" | 11.18" | 11.28" | 6.66" | 90.41" |
| Lukonor | 8.41" | 8.93" | 9.26" | 11.31" | 11.69" | 11.65" | 15.93" | 14.04" | 10.15" | 11.32" | 9.08" | 11.27" | 151.36" |
| Majuro | 7.74" | 6.88" | 6.58" | 9.42" | 10.11" | 11.01" | 11.17" | 11.69" | 11.17" | 12.73" | 13.44" | 11.39" | 125.25" |
| Pago Pago | 13.34" | 12.00" | 10.68" | 9.39" | 9.66" | 5.33" | 5.55" | 5.38" | 6.53" | 9.26" | 10.14" | 12.84" | 125.57" |
| Pohnpei | 13.18" | 9.55" | 13.17" | 18.41" | 19.96" | 14.81" | 15.43" | 14.26" | 12.55" | 15.27" | 14.83" | 16.08" | 182.36" |
| Saipan | 2.53" | 2.59" | 1.89" | 2.63" | 2.38" | 3.62" | 8.91" | 13.13" | 10.09" | 10.62" | 5.61" | 3.85" | 70.25" |
| Yap | 6.39" | 5.19" | 4.56" | 5.63" | 7.85" | 12.04" | 15.08" | 14.82" | 13.50" | 12.18" | 8.83" | 8.51" | 120.31" |
The current La Niña recently brought dry weather to southern portions of Micronesia. But the end of the El Niño several months ago and subsequent ENSO-neutral conditions in the tropical Pacific resulted in the return of much-needed rainfall to most of the USAPI region. Although the rains ended the drought that was occurring earlier this year, long-term precipitation deficits continued for some stations, as seen in the table below.
An analysis of historical data for the USAPI stations in the Global Historical Climatology Network-Daily (GHCN-D) dataset, augmented with fill-in data from the 1981-2010 Normals, indicated that, even though rains returned to most stations during the last half of the year, several stations still had near-record dryness during January-December 2016. The following table lists the precipitation ranks for December 2016, July-December 2016 (last 6 months), and January-December 2016 (the last 12 months). Some stations have a long period of record and their dataset is fairly complete, while other stations have a shorter period of record and the dataset has some missing data. Stations with low ranks for the last 12 months (January-December 2016) include: Kapingamarangi 3rd driest out of 14 years of data, Kosrae 6th driest out of 30 years, Lukonor 4th driest (out of 20 years), Nukuoro 8th driest (32 years), Ulithi 6th driest (33), Woleai 4th driest (21), Yap 7th driest (65), Chuuk 8th driest (65), Koror 6th driest (65), Jaluit 4th driest (33), and Majuro 6th driest (62).
Rank of 1 = driest.
| Station | Dec 2016 Rank |
Dec No. of Years |
Jul- Dec 2016 Rank |
Jul- Dec No. of Years |
Jan- Dec 2016 Rank |
Jan- Dec No. of Years |
Period of Record |
| Jaluit | 30 | 33 | 17 | 33 | 4 | 33 | 1981-2016 |
| Koror | 9 | 66 | 17 | 66 | 6 | 65 | 1951-2016 |
| Woleai | 25 | 36 | 13 | 24 | 4 | 21 | 1968-2016 |
| Yap | 29 | 66 | 32 | 66 | 7 | 65 | 1951-2016 |
| Majuro | 38 | 63 | 38 | 63 | 6 | 62 | 1954-2016 |
| Mili | 33 | 33 | 27 | 33 | 18 | 31 | 1981-2016 |
| Ulithi | 29 | 35 | 24 | 34 | 6 | 33 | 1981-2016 |
| Ailinglapalap | 31 | 33 | 30 | 32 | 12 | 32 | 1981-2016 |
| Kosrae | 38 | 49 | 11 | 36 | 6 | 30 | 1954-2016 |
| Lukonor | 28 | 33 | 11 | 20 | 4 | 20 | 1981-2016 |
| Saipan | 17 | 29 | 24 | 29 | 17 | 28 | 1981-2016 |
| Pohnpei | 59 | 66 | 54 | 66 | 24 | 65 | 1951-2016 |
| Kwajalein | 49 | 65 | 48 | 65 | 19 | 64 | 1952-2016 |
| Kapingamarangi | 15 | 26 | 4 | 16 | 3 | 14 | 1962-2016 |
| Chuuk | 62 | 66 | 16 | 65 | 8 | 65 | 1951-2016 |
| Guam | 52 | 60 | 40 | 60 | 25 | 59 | 1957-2016 |
| Nukuoro | 31 | 34 | 10 | 33 | 8 | 32 | 1981-2016 |
| Pago Pago | 27 | 51 | 17 | 51 | 15 | 50 | 1966-2016 |
| Wotje | 6 | 32 | 28 | 32 | 23 | 32 | 1981-2016 |
| Utirik | 7 | 17 | 6 | 6 | 2 | 3 | 1985-2016 |


[top]
State/Regional/National Moisture Status
A detailed review of drought and moisture conditions is available for all contiguous U.S. states, the nine standard regions, and the nation (contiguous U.S.):
| northeast u. s. | east north central u. s. | central u. s. |
| southeast u. s. | west north central u. s. | south u. s. |
| southwest u. s. | northwest u. s. | west u. s. |
| Contiguous United States |
[top]
Contacts & Questions